Soil Fertility Conference 2018 - 'Optimising Soil and Fertiliser Management for Sustainable Grassland Production' - Teagasc
←
→
Page content transcription
If your browser does not render page correctly, please read the page content below

Crops
                                       Environment
                                       & Land Use
                                       Programme

Soil Fertility Conference 2018
‘Optimising Soil and Fertiliser Management
for Sustainable Grassland Production’
Soil Fertility Conference 2018
  ‘Optimising Soil and Fertiliser Management
     for Sustainable Grassland Production’

 Maximising Farm Productivity and Profitability Through
Efficient Use of Fertilisers for Sustainable Grass Production

              Lyrath Hotel, Kilkenny, Co. Kilkenny
                Wednesday, 17th October 2018
                     10.00 am to 4.00 pm

               Edited by David P. Wall and Mark Plunkett
             Teagasc, CELUP, Johnstown Castle, Co Wexford

                           Tel 053 9171200
                       Web: www.teagasc.ie/soil

                                    Teagasc: Soil Fertility Conference 2018   1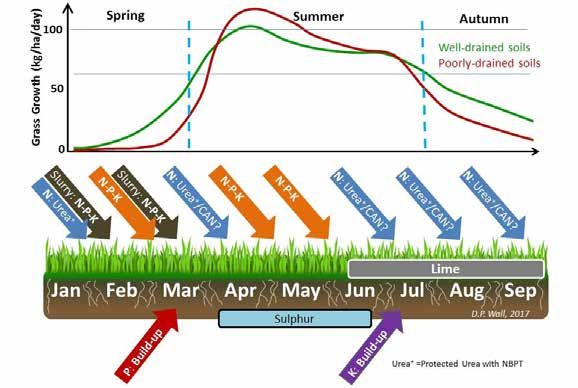
Soil Fertility Conference 2018
                                                       ‘Optimising Soil and Fertiliser Management
                                                                    Soil Fertility Conference 2018
                                                          for Sustainable        Grassland Production’
                                                               Optimising Soil and Fertiliser Management for
                                                                            Sustainable Grassland Production
                                              Introduction
                                              Teagasc welcomes you to the National Soil Fertility Conference 2018, which aims to provide
                                              farmers, farm advisors and agri-industry stakeholders with updates on the latest nutrient
                                              efficiency and fertiliser research as well as practical nutrient management planning tips and
                                              advice. The theme of this event is ‘Optimising Soil and Fertiliser Management for
                                              Sustainable Grassland Production’.

                                              Grass-based dairy and dry-stock systems hold certain advantages over confined and high
                                              concentrate feeding systems in terms of lower cost structure; increased farmer control over
                                              feed supply, high quality of the milk and meat produced and increased levels of
                                              environmental sustainability. As many Irish dairy farms strive to increase their milk output
                                              per ha post milk quota, it is critical that Irish dairy maintains its ‘green’ image in order to
                                              compete in a fiercely competitive world dairy market. Good productive soils are the
                                              foundation of any successful farming system and key for growing sufficient high quality
                                              grass to feed the herd. Irish farmers are in a position to maximise the potential milk and meat
                                              output from their farms and to achieve this high grass growth rates over an extended season is
                                              needed. This places an increasing demand on soil nutrient supply. The ability of soils to
                                              supply nutrients at a time and in appropriate quantities for grass growth is a key determining
                                              factor of how productive a field or farm can be. Therefore, the management of soil fertility
                                              levels should be a primary objective of every farm.

                                              Soil Fertility Management
                                              Now is the time for farmers to make decisions regarding fertiliser and manure management
                                              strategies for their farms. High fertiliser prices and strict limits under the Nitrates Action Plan
                                              have led to decreasing trends in national soil fertility. A recent review of soils tested at
                                              Teagasc indicates that the majority of soils in Ireland are below the target levels for pH
                                              (i.e.6.3) or P and K (i.e. Index 3) and will be very responsive to application of lime P & K.
                                              On many farms sub-optimal soil fertility will lead to a drop in output and income if allowed
                                              to continue. It is important to complete a farm fertiliser plan to guide lime, manure and
                                              fertiliser decisions in 2019 and to avoid further decline in soil fertility levels.

                                              During this Soil Fertility Conference Teagasc is highlighting 5 steps for effective soil fertility
                                              management:

                                                 1)   Have soil analysis results for the whole farm.
                                                 2)   Apply lime as required to increase soil pH up to target pH for the crop.
                                                 3)   Aim to have soil test P and K in the target Index 3 in all fields.
                                                 4)   Use organic fertilisers as efficiently as possible.
                                                 5)   Make sure the fertilisers used are properly balanced.

                                              The main focus of this event is to highlight and discuss issues related to good soil fertility
                                              management for maximising the productivity of our soils in an environmentally sustainable
                                              manner. For those farmers aiming to improve soil fertility on their farms, following these 5
                                              steps provides a solid basis for success.

2   Teagasc: Soil Fertility Conference 2018                                                      Teagasc: Soil Fertility Conference 2018            3
                                                                                                                                               3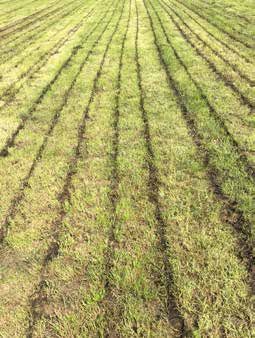
Programme Soil Fertility Conference 2018                                                   Programme Soil Fertility Conference 2018
                                  9.15: Coffee on arrival
                                                                                                                              12.30 – 13.30: Lunch

10.00:        Opening & Welcome
              John Spink, Head of CELUP, Teagasc

Session I.    Soil Fertility Research                                                         Session III. Soil Fertility Advice
              Chair: John Spink, Head of CELUP, Teagasc                                                    Chair: Aidan Brennan, Irish Farmers Journal

                                                                                              13.35:       Manure and its Management                                                   Page 18
10.10:        Response to Potassium and Implications                                Page 6                 Patrick Forrestal, Teagasc, Johnstown Castle
              for Grass Silage Production
              Mark Plunkett, Teagasc, Johnstown Castle
                                                                                              14.00:       Long Term Fertiliser use Trends in Ireland and Implications                 Page 20
                                                                                                           for Sustainability
10.35:        Spring Nutrient Advice for Grassland Farms                          Page 10                  Cathal Buckley, Teagasc, Athenry
              David Wall, Teagasc, Johnstown Castle

                                                                                              14.25:       Getting the Most out of Your Stored Slurry                                  Page 22
11.00:        Phosphorus Management & Soil Fertility Trends                       Page 12                  Ian Kavanagh, Teagasc, Johnstown Castle
              in Agricultural Catchments
              Noeleen McDonald, DAFM, Dublin
                                                                                              14.50:       NMP-Online Planning Farm Lime & Nutrient Requirements                       Page 24
                                                                                                           Christy Watson, Teagasc Advisory, Naas, Co. Kildare
Session II. Soil Fertility Research into Practice
            Chair: John Carroll, Glanbia, Kilkenny
                                                                                              15.15:       Putting Fertiliser Advice into Practice                                     Page 28
                                                                                                           Mark Heffernan, Grass 10 farmer of the year 2017,
11.30:        Managing Grass-Clover Swards in an Intensive                        Page 14                  Dunamaggin, Co. Kilkenny
              Grass Based Systems
              Mike Egan, Teagasc, Moorepark
                                                                                              15.40:       Conference Closing
                                                                                                           Professor Gerry Boyle, Teagasc Director
11.55:        Increasing the Efficiency of Soil Nutrient                            Page 16
              Management in Northern Ireland
              Susanne Higgins, Agri Food and Biosciences Institute (AFBI), Northern Ireland

4            Teagasc: Soil Fertility Conference 2018                                                                                         Teagasc: Soil Fertility Conference 2018             5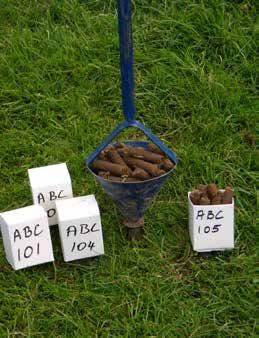
Response to potassium and implications for grass silage production Factors affecting soil K status
Over the last decade Teagasc soil test results show that the proportion of grassland soils at K
Mark Plunkett and David Wall index 1 and 2 levels have increased by 50%. This has the potential to compromise grass
Teagasc, Crops Environment and Land Use Programme, Johnstown Castle, Wexford. productivity and fertiliser N efficiency.
Summary
Silage swards have higher potassium (K) requirements than grazed swards
Aim to apply recommended levels of K for silage and grazing over the growing 70
season
Select a fertiliser type with the correct P:K balance (1:6) for silage crops 60
% Soil Samples
Recycle nutrients in cattle slurry back to silage fields 50
Check slurry dry matter & adjust application rates for correct P & K supply 40 Dairy
30 Drystock
Introduction
Grass silage is one of the largest crops grown in Ireland with a current requirement of ~ 10 20
million tonnes of dry matter annually. Making sufficient quality grass silage is an essential 10
component of sustainable grass based livestock production systems for over winter fodder.
Correct fertilisation of the grass silage crop is required for both yield and quality at harvest 0
time. Potassium (K) plays a key role as it is necessary for the formation of sugar, starch and 2007 2008 2009 2010 2011 2012 2013 2014 2015 2016 2017
protein. Sufficient plant available K is required during peak growth to drive nitrogen (N) Year
efficiency for yield and reduce possible N losses through leaching or de-nitrification.
Potassium deficiency will reduce grass yield rapidly in a silage sward compared to a grazing Figure 2. Percentage of grassland dairy and drystock soil samples at K Index 1 & 2.
situation where K in recycled during dung and urine deposition. Nationally, the application of
fertilisers K on grassland farms is below the levels needed to replace K offtake by the silage Fertiliser K use
crops and for maintenance of soil K levels (K index 3). Fertiliser K use on farms declined dramatically between 1989 and 2009 with a 300% decrease
in fertiliser K imports nationally. Since 2009 fertiliser K use has doubled (52,000 to 108,000
t). Figure 1 shows average fertiliser K applications for dairy and drystock farms. Over the
10 year period the average use on dairy and drystock farms has been 23 and 15kg K /ha/year,
K advice for 1st cut sialge 5t/ha DM respectively. This level of K fertiliser use was well below the recommended K rates required
60
125
for maintenance (Index 3) on silage crops. It is assumed that cattle slurry produced on farms
is recycled back to silage fields helping to fulfil most of the K requirements; however, these
50
data indicate that little or no additional K is being applied for soil fertility improvement on
Potassium (K) (kg/ha)
the majority of farms.
40
Fertiliser Type
K advice for Dairy at 2LU/ha Selecting a suitable compound fertiliser with the correct P: K ratio is critical for supplying the
30 Dairy K requirements for grass production during the growing season. A fertiliser programme
should comprise of a 0-7-30 (N-P-K) type fertiliser blend in the absence of cattle slurry.
20 However, where cattle slurry is applied at a rate of 33m3/ha a fertiliser blend such as 27-2.5-5
K advice for Drystock at 2LU/ha Cattle
is adequate to meet crop requirements with additional K required for low index soils (Index 1
10 & 2) which is best applied at the end of the grass growing season (autumn).
Cattle Slurry
0
Recycle the nutrients in cattle slurry back to silage fields to ensure that soil P and K levels are
2005 2006 2007 2008 2009 2010 2011 2012 2013 2014 2015 replenished. The nutrient value (P & K) in cattle slurry will be variable depending on
Year Dillon et al. 2018. NFS fertiliser use survey dilution with water. More dilute slurry will have lower nutrient value and will result in under
fertilising the silage crop. For example 33m3/ha of cattle slurry at 7% dry matter (DM) will
supply the majority of P and K required for a grass silage crop compared to slurry at 4% DM
will only supply ~50 and 60% of crop P & K requirements, respectively. This practice will
Figure 1. Average potassium (K) fertiliser use on grassland farms nationally and K
result in a nutrient deficit if fertiliser is not adjusted accordingly.
application advice for drystock, dairy and silage production systems.
6 7
6 Teagasc: Soil Fertility Conference 2018 Teagasc: Soil Fertility Conference 2018 7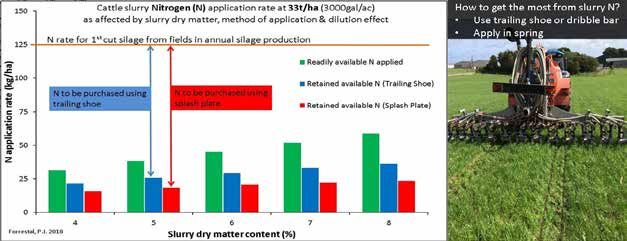
Table 1 Recommended rates of K for 1st, 2nd & 3rd cut grass silage.
                                                           1/3 Ryegrass mixture         2/3 Ryegrass mixture                  Ryegrass only
                                                                                                                                                          Soil              1st Cut                2nd Cut                3rd Cut                Total K
    Average grass yield 2005-2009 (kg/ha DM)
                                               16,000                                              Soil test K 51 mg/l (Index 2) in 2005
                                                                                                                                                         Index             5 t/ha DM               3 t/ha DM             2 t/ha DM                 (kg/ha)

                                                                             1 kg K fertiliser
                                                                                                                                                           1                  185                     75                     50                     310
                                               15,000                                                                                                      2                  155                     75                     50                     280
                                                                              = 9 kg grass
                                                                                                                               1 kg K fertiliser           3                  125                     75                     50                     250
                                               14,000                                                                           = 6 kg grass               4                   0                       0                      0                      0
                                                                                                                                                       On Index 4 soils omit K for one year and revert back to Index 3 advice until next soil test. Adjust K advice
                                                                                                                                                       by +/- 25kg K/ha per tonne of grass DM.
                                               13,000

                                                                                                                                                       Fertiliser K Timing Advice
                                               12,000                                                                                                  The fertiliser K application strategy should be carefully planned especially where high levels
                                                                                                                                                       of K are required. For example in springtime K applications should not exceed 90 kg K/ha in
                                                                                                                                                       a single application. Where higher rates are required it is advised to apply the balance to the
                                               11,000
                                                                                                                                                       aftermath or in late autumn. On fast growing swards which have received high levels of
                                                                                                                                                       nitrogenous and potassic fertilisers grass tetany (grass staggers) can become more prevalent.
                                               10,000                                                                                                  High soil K levels can induce grass tetany as it antagonises magnesium uptake by the grass
                                                            0              60                120                   180                     240         crop. In areas where the disease is known to be problematic it’s advisable to feed cal mag 3
                                           K Fertiliser rate (kg /ha)                                                                                  weeks before and after susceptible periods.
      Figure 3. Relationships between average annual grass yield (kg/ha) and potassium (K)
      fertiliser rate (kg/ha) for a 4 cut silage experiment at Johnstown Castle between 2005 and                                                       Conclusions
      2009. Three sward types with varying perennial ryegrass levels were evaluated.                                                                   As animal numbers increase on intensive livestock farms there is an increasing demand for
                                                                                                                                                       conserved winter feed. Potassium has a major role to play in the production of quality grass
      Silage sward response to K fertiliser                                                                                                            silage. Over the last decade the levels of K fertiliser applications on grassland farms have
      A study of silage response to K fertiliser application was conducted from 2005 to 2009 at                                                        been insufficient to meet K offtakes from grazing and silage systems annually. These low
      Teagasc Johnstown Castle. Swards with ryegrass mixed with other grass species had higher                                                         levels of K application have been reflected in soil test results from grassland farms where the
      grass yield response to K fertiliser (up to 180 kg K/ha per annum) than the ryegrass only                                                        percentage of soils at index 1 continues to increase. To produce annual grass silage
      sward (up to 240 kg K/ha per annum) as shown in (figure 3).                                                                                      requirements it is essential that recommended rates of K are applied at key times during the
                                                                                                                                                       growing season. This can be achieved by recycling the nutrients in cattle slurry back to
      Potassium advice for silage swards                                                                                                               silage fields and by selecting suitable compound fertilisers to top to crop K requirements.
      Intensively cut grass silage has a large demand for K with every 1 ton DM removing 25kg K.
      For example a 2/3 cut silage system will remove 10t/ha DM and up to 250 kg K/ha. Table 1
      shows the recommended levels of K for silage crops based on soil K levels and the typical
      DM yields. Additional K is required at soil K index 1 and 2 to build soil K levels over time.
      Build up rates of K should be applied in the autumn time to reduce the risk of grass tetany in
      the spring time. Potassium rates recommended at soil K index 3 show the levels of K
      removed by the crop at harvest time. To maintain soil K levels these amounts need to be
      applied through the application of cattle slurry and, or, chemical K fertilisers.

                                                                                                                                                   8                                                                                                                  9

8                                                   Teagasc: Soil Fertility Conference 2018                                                                                                                       Teagasc: Soil Fertility Conference 2018                 9
Spring Nutrient Advice for Grassland Farms Lime & Fertiliser Advice
The starting point when building soil fertility is to apply lime according to the soil test
David Wall recommendations. In spring soil and weather conditions can be very variable, so selecting a
Teagasc, Crops Environment and Land Use Programme, Johnstown Castle, Wexford. stable N fertiliser source, such as protected urea, can help to maximise the recovery of N by
the grass. In very early spring, where soils are wet and cold, delaying N application until
Summary conditions improve can be prudent in terms of increased N uptake by the grass and
Soil testing and fertiliser planning are key requirements for any successful farm and minimising N leaching losses. The nutrient application advice for P and K for dairy grassland
should be conducted during autumn in advance of fertiliser purchase. is shown in Tables 1 and 2. The advice for both P and K applications shown includes P and K
Low soil fertility (e.g. soil P and K Index 1 or 2) equates to reductions in grass growth from both chemical fertiliser and slurry sources. In addition, the P application rates should
potential in excess of 3t grass DM/ha per year, which is worth at least €540 per ha on also be adjusted to account for the P coming onto the farm in concentrate feeds.
a dairy farm and €315 on a drystock farm, per year.
Soil test results indicate that 88% of grassland fields have sub-optimal soil fertility Table 1. Simplified P fertiliser requirements (kg/ha) of grazed and cut swards for dairy farms
which is seriously limiting grass growth potential on farms. (These total P requirements should be adjusted for concentrate feeds or where organic
Approximately 47% of soil samples from grassland farms still have below target soil manure is applied)
pH of 6.3 indicating that lime applications are required. Grazed Swards Silage Swards
Higher yielding swards and highly stocked farms require higher nutrient application Soil P Farm Stocking Rate (LU/ha)
rates to replace nutrients removed during grazing and silage cutting. Index 2.5 Cut Once Cut Twice
Slurry is valuable resource and should be targeted towards fields with highest 1 30 33 36 39 +20 +30
requirement for P & K (i.e. Index 1 & 2 or silage fields) to help offset expensive 2 20 23 26 29 +20 +30
fertiliser costs. 3 10 13 16 19 +20 +30
4 0 0 0 0 0 0
Introduction * Note: Farms stocked at ≥130 kg Org N /ha can avail of additional P build-up allowances on index
Of the dairy farm soil samples analysed by Teagasc in 2017 just 15% had optimal soil 1&2 soils. Contact your advisor or consultant for more details.
fertility levels as indicated by soil pH, P and K. Only 1/3 of dairy farms are applying lime on a
regular basis which indicates that more emphasis on lime application is needed to reduce soil Table 2. Simplified K fertiliser requirements (kg/ha) of grazed and cut swards for dairy farms
acidity. Implementing the correct fertiliser programme in spring to deliver the nutrients (These total K requirements should be adjusted for organic manures applied)
required is critical for early grass growth and turnout and sets the farm up for the growing Grazed Swards Silage Swards
season ahead. Soil K Farm Stocking Rate (LU/ha) Subsequent
Index 2.5 Cut Once* cuts
1 85 90 95 100 +185 +75
2 55 60 65 70 +155 +75
3 25 30 35 40 +125 +75
4 0 0 0 0 0 0
* Typically no more than 90 kg/ha K should be applied at closing for silage
Conclusions
Fertiliser is an important investment on dairy and drystock farms and represents >25% of
total variable production costs. Trying to plan fertiliser application strategies without field-
by-field information on soil fertility levels is impossible and leads to poor return on
investment and higher potential for nutrient losses to the environment. Soil testing costs less
than 1 kg of fertiliser P per ha per year (€2) and having up to date soil test results for the
whole farm is essential when selecting the right fertiliser type, and deciding the right fertiliser
application rate and right fertiliser application timing.
Although it costs money to increase fertility levels, the returns in terms of increased grass
production from low fertility soils can be considerable (>3.0 tonnes grass dry matter per ha),
and can increase the livestock carrying capacity (i.e. stocking rate) of the farm, provide
additional winter feed stocks (silage), improve animal health (nutrition value of the grass),
increase milk and meat outputs and ultimately whole farm profitability.
Figure 1. Typical N-P-K-S fertiliser and lime programme timings which must be tailored to
seasonal grass growth and soil types on the farm.
10 11
10 Teagasc: Soil Fertility Conference 2018 Teagasc: Soil Fertility Conference 2018 11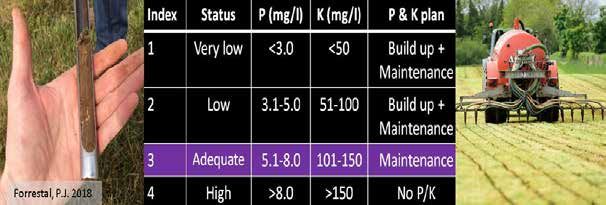
Phosphorus Management & Soil P Trends in Agricultural Catchments
Noeleen McDonald1, 2, Edward Burgess1, Per-Erik Mellander2, 3 & David Wall3
1Department of Agriculture Food and Marine, Agricultural House, Kildare St, Dublin 2.
2Agricultural Catchments Programme, Teagasc, Crops, Environment and Land Use
Programme, Johnstown Castle, Wexford.
3 Teagasc, Crops Environment and Land Use Programme, Johnstown Castle, Wexford.
Summary
The Agricultural Catchments Programme (ACP) has been evaluating the effectiveness
of Nitrates Directive regulations for minimising nutrient loss to water since 2009.
Grassland fields with excessive soil P levels (P Index 4) have generally declined, Figure 1 Trend of the soil available P levels in the poorly-drained (PD-Ballycanew)
however, the area with low soil P (P Index 1 and 2) has increased (up to 85%). moderately-drained (MD-Dunleer) and well-drained (WD-Timoleague) catchment grassland
soils sampled between 2009 and 2018.
Phosphorus fertiliser inputs varied between years and catchments (24 to 36 kg P/ha).
Grassland management (grazing vs. silage) and stocking rate at field scale have a
Phosphorus Management
large influence on soil P change over time.
The average P inputs, as fertiliser P or manure P ,varied from year to year in each catchment
Soil fertility advice and management at field scale is most appropriate for maintaining
(Table 1). The PD catchment received the lower average P application rates (24 kg/ha)
production levels and also achieving environmental targets.
compared to the MD and WD catchments, which received 30kg P/ha and 37 kg P/ha,
Introduction respectively (Table 1). Of the total P applied to grassland fields, manure P made up the
The agricultural catchments programme (ACP) was established in 2008 to evaluate the largest proportion of P inputs in these catchments (PD, 51%, MD, 82% and WD 81%). The
Nitrates Directive Good Agricultural Practice (GAP) measures for improving water quality in efficiency of P recovery by the plant varies by soil properties and the type of grassland
six agricultural river catchments in Ireland. These catchment areas vary in soil type, drainage management (i.e. silage vs. grazing and stocking rate). Silage fields that are cut with no stock
characteristics, and nutrient loss risk and include both drystock and dairy farming systems. grazing have the highest P removal leading to a P deficit of -14 kg P/ha/year on average. In
Better nutrient management on farms is recognised as being important for productive and contrast, grassland fields that were grazed and thus recycle P via dung and urine back to the
profitable farming and also for minimising the risk of nutrient loss to streams, rivers and soil, can have lowest P removal, resulting with an average P surplus of +10 kg P/ha/year.
lakes. Phosphorus (P) is recognised as a key plant nutrient but is also as a potential pollutant
of surface waters when it is lost from the landscape. Nutrient management performance was Table 1: The mean P input in kg/ha (chemical and organic manures) to the grassland fields in
evaluated in three catchments representing (1) well-drained soils (WD) in Timoleague south- each study catchment between 2010 and 2015.
west Cork, (2) moderately-drained soils (MD) in Dunleer, Co. Louth, and (3) poorly-drained Six year
soils (PD) in Ballycanew North Wexford over a nine year period. Each field in each Catchment 2010 2011 2012 2013 2014 2015 Average
catchment were soil sampled every 3-4 years over this period and the soil test results; pH, P P input kg/ha
and potassium (K), while utilised for research were also provided to the farmers through a Poorly Drained
dedicated advisory service. Records of fertiliser and manure applications to fields, as well as Ballycanew, 18 22 23 22 30 28 24
silage, milk and meat off takes were collected on a number of the ACP farms throughout Wexford
these years. This enabled farm and field scale P balances to be calculated in order to assess Moderately
the effectiveness of the fertiliser and manure management on these farms. Drained 23 28 39 35 28 29 30
Dunleer, Louth
Catchment Soil Phosphorus Trends Well Drained
34 26 47 43 39 36 37
Across this period soil P levels changed in all the three catchment types (Fig 1). The Timoleague, Cork
percentage of grass fields in the PD catchment with sub-optimum P levels (i.e. Index 1 and
Index 2) were highest and increased (67% in 2009 to 85% in 2017) over time. Fields with Conclusions
optimum levels of soil P (Index 3) declined across all catchments, while fields with excessive Monitoring soil P levels and calculating P input-output balance at field scale has helped to
soil P levels (Index 4) declined in two catchments while they increased in the MD catchment. identify the effectiveness of nutrient management strategies on catchment farms. Better
The PD and MD catchments are identified as been the most risky for P loss from the distribution of nutrients applied in slurry is necessary to optimise soil fertility and to
landscape to surface waters. In the PD catchment with the greatest P loss risk due to overland minimise the risks of nutrient loss to water. Increased farmer awareness and advice is
water flow, the area of fields at P Index 4 were lowest out of all the catchments and continued required to address field-by-field soil fertility issues and to develop a suitable fertiliser plan
to decline across the sampling periods. Whereas in the MD catchment, fields at P Index 4 specific to their farm. This will help to achieve sustained grass and crop production levels,
peaked in 2014 when 36% of the catchment grass fields had high P source potentially improve farm profitability and protect water quality and the surrounding environment.
contributing to increased P loss.
12
13
12 Teagasc: Soil Fertility Conference 2018 Teagasc: Soil Fertility Conference 2018 13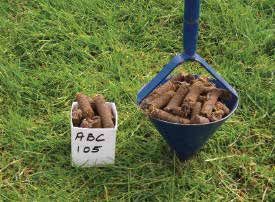
Managing Grass-Clover Swards in an Intensive Grass Based System benefit clover persistence as it negates the increased competition for light, space and nutrients
with increased N fertiliser. A four year grazed plot experiment (2010 – 2013) investigated the
Michael Egan and Deirdre Hennessy effect of N fertiliser application rate on grass DM production and sward clover content. There
Teagasc, Animal and Grassland Research and Innovation Centre, were five N fertiliser application rates 0, 60, 120, 196 and 240 kg N/ha per year applied to
Moorepark, Fermoy, Co. Cork, Ireland grass-only and grass-clover swards. Regardless of N fertiliser application rate, herbage DM
Summary production increased by 2.9 t DM/ha when clover was included in the sward (Table 1).
Grass-clover swards can increase grass DM production by 2.9 t DM/ha. However, as fertiliser N application rate increased, average annual sward clover content
White clover can fix up to 185 kg N/ha./yr. under optimal grazing management. decreased from 33.3% when 0 kg N/ha was applied to 19.6% when 240 kg N/ha were
Nitrogen fixation decreased as N fertiliser application increases and sward white applied, and as N fertiliser levels increased the level of BNF reduced (Table 1).
clover content decreases. Table 1: Average annual grass production and average sward clover content in grass-only &
Frequent tight grazing (4 – 4.5 cm above ground level) of grass-clover swards will grass-clover swards receiving 0, 60, 120, 196 and 240 kg N/ha per year between 2009 & ‘13
encourage white clover persistence in grazed swards. Nitrogen fertiliser application rate (kg N/ha/year)
Grass-clover swards, offer the potential to increase grass DM and potential to reduce 0 60 120 196 240
levels of nitrogen fertiliser applied. Grass only (t DM/ha/year) 9.1 9.2 11.0 11.3 12.6
Grass-clover (t DM/ha/year) 13.3 13.1 13.1 13.8 14.4
Introduction
Sward clover content (%) 31.6 29.2 26.4 20.3 18.5
Research investigating the benefit of incorporating white clover (clover) into perennial
ryegrass (PRG) pastures for high stocking rate systems of milk production over the last Nitrogen fixation (kg N/ha/year) 219 205 148 122 112
number of years has shown the potential to increase pasture production, reduce costs (lower A recent systems grazing experiment undertaken in Teagasc Moorepark (2013 – 2016)
nitrogen (N) input), increase animal performance (increase milk production per cow) and investigating the use of clover in an intensive grazing system (stocking rate – 2.74 cows/ha),
improve environmental sustainability (reduced nitrous oxide emissions). Therefore, clover with three grazing treatments, a grass only sward receiving 250 kg N/ha (Gr250), a grass-
has huge potential to benefit Irish dairy farmers at farm level. However, the use of clover on clover sward receiving 250 kg N/ha (Cl250) and a grass-clover sward receiving 150 kg N/ha
Irish farms is low with little or no swards reliant on nitrogen (N) from clover. (Cl150), all stocked at 2.74 cows/ha. Over the course of the 4 years, there was no difference
Nitrogen Fixation of Grass-Clover Swards in grass DM production between the three treatments (14.5 t DM/ha). It is interesting to note
As a legume, clover develops root nodules that house symbiotic N-fixing bacteria rhizobium, that, at Moorepark, the Cl150 treatment had the same herbage DM production as the Gr250
which can convert atmospheric dinitrogen (N2) gas is converted into ammonia (NH3), a plant- and Cl250 treatments despite receiving 100 kg N/ha less than the other two treatments. This
usable N form, through biological nitrogen fixation (BFN). The relationship between the shows that under high levels of N fertiliser (250 kg N/ha and 150 kg N/ha), good grazing
rhizobia and the host plant is symbiotic; in return for fixed N from the bacteria, the host plant management practices (as mentioned above) can maintain significant levels of clover (23%
provides the bacteria with carbon (C) from photosynthesis. The cost to the host plant in terms and 27% on grass-clover swards receiving 250 and 150 kg N/ha, respectively) in the sward
of C is approximately 6 g C per 1 g of N fixed. This effectively means that BNF is a very five years post sowing (swards were sown in summer 2012) and maintained similar levels of
energy demanding process on the clover plant. This higher metabolic cost to the clover plant DM production compared to grass-only swards. As well as the positive effects in terms of
has previously been used to explain the observation that swards solely reliant on BNF had herbage production, incorporating clover in the swards increased milk solids yield by 33
40% less growth than that of mineral N fertilised swards. The quantity of N fixed by clover kg/cow/year compared to Gr250.
through biological nitrogen fixation (BNF) varies from 10 to 185 kg N/ha/yr. depending on Strategic use if Nitrogen Fertiliser on Mixed Grass-Clover Swards
management factors that affect sward clover content, with an average sward clover content of Nitrogen derived from clover alone may not be sufficient to maintain high levels of DM
≥ 20% required before a significant benefit in herbage production is observed through BNF. production; however, including clover in swards where high levels of N fertiliser are applied
Nitrogen Fertiliser and White Clover reduces the impact of clover in terms of BNF. We must reach a compromise between
It is generally accepted that the application of N fertiliser results in a reduction in sward including clover into grazed swards and the level of N fertiliser applied. The experiments
clover content. However, strategic use of N fertiliser on grass-clover swards can compensate outlined above indicate that applying 120 to 150 kg N/ha/yr to mixed grass-clover swards
for low clover growth, particularly in the spring period. A reduction in sward clover content produced similar levels of herbage compared to grass-only sward receiving 250 kg N/ha/yr.
is mainly due to an increase in competition with PRG for light, water and nutrients. White Seventy per cent of the N fertiliser in those studies was applied by May, with reduced
clover can utilise N fertiliser similar to PRG, although the uptake of N fertiliser is faster by quantities applied thereafter. This coincides with the period of increasing sward clover
PRG than by clover. The uneven uptake of N fertiliser between the PRG and clover results in content, usually April/May onwards, and the potential for that clover to fix N.
a faster growth rate of PRG. As a result the application of N fertiliser, overall herbage Conclusions
production is often increased, and this can often result in a decrease in sward clover content White clover can significantly impact on Irish dairy productions systems through increased
compared to swards solely reliant on N from clover. herbage production. Clover can also offer the opportunity to strategically reduce inorganic N
Good grazing management, that is tight grazing in spring and in the last rotation (~ 3.5 cm if input to high stocking rate grass-based systems, particularly in the second half of the year as
possible), 18 to 21 day rotation length in mid-season (April to August), pre-grazing herbage sward clover content increases and BNF occurs.
mass of 1300 to 1500 kg DM/ha and post-grazing sward height of 4 cm in mid-season, will
14 15
14 Teagasc: Soil Fertility Conference 2018 Teagasc: Soil Fertility Conference 2018 15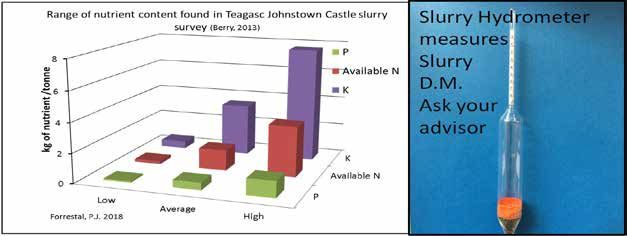
Increasing the Efficiency of Soil Nutrient Management in Northern Ireland The Catchment Scheme
The Catchment Scheme focussed on the Upper Bann River Catchment with 11 sub-
Suzanne Higgins and John S. Bailey catchments soil tested. 78% of the eligible farms (513 farms out of 654) within the Upper
Agri-Food and Biosciences Institute, Belfast Bann Catchment registered for the scheme and received soil testing.
Summary Soil sampling took place during the winter of 2017/18 and all farmers received their own
A soil sampling and analysis scheme was carried out across Northern Ireland in 2017, independent soil analysis report along with nutrient recommendation maps and training on
and open to all eligible livestock farmers. the interpretation of their data. The catchment area was also flown by LiDAR technology and
all farmers in the catchment scheme received P run-off risk maps in addition to their soil
Almost 20,000 fields were soil sampled during the winter of 2017 / 18.
nutrient maps.
The aim of the scheme was to improve the productivity of livestock farms while also
benefitting the environment. Results
Soil nutrient surpluses as well as soil nutrient deficiencies were identified across all Almost half (42%) of all fields sampled (50% of dairy farm fields) within the Open Scheme
sectors. recorded soil P indices > Index 2 (Olsen P soil test) (Figure 1). 15% of dairy farms recorded
Tens of £ millions worth of additional grass dry matter could potentially be realised an under-supply of P. A quarter of all fields sampled in the Open Scheme displayed sub-
through correcting these nutrient imbalances. optimum K levels. Additional slurry and / or potash fertiliser on these fields could result in
400 kt/yr extra grass dry matter worth £40 million (gross)/yr.
Introduction
In 2016, The Sustainable Agricultural Land Management Strategy for Northern Ireland, P Over-Supply (%) K Under-Supply (%)
reported that grass utilisation in Northern Ireland was significantly below optimal levels, less
than 10% of farmland had an up-to-date soil analysis, and 64% of our soils were not at the
optimum soil pH. By enhancing soil health and increasing the efficiency of soil nutrient
management we can help to optimise grass yields and grass quality, improve grass utilisation
35 20
and minimise the loss of excess nutrients to the environment.
50 33
Soil Sampling and Analysis Scheme
An EU-funded soil sampling scheme supported by the Department of Agriculture in Northern
Ireland, the Ulster Farmers Union, the College of Agriculture, Food and Rural Enterprise, and
the University of Ulster was launched in Northern Ireland in 2017. The scheme was designed
to provide farmers with detailed information about their soils, with the aim of improving 37 26
profitability and benefiting the environment (Table 1).
Dairy Beef Sheep Dairy Beef Sheep
Table 1: Objectives of the 2017 Soil Sampling and Analysis Scheme in Northern Ireland
(a) (b)
Improving PROFITABILITY Figure 1: Precentage of fields on dairy, beef and sheep farms displaying (a) an over-supply
Increase grass and forage yields of soil P and (b) an under-supply of soil K
Improve soil fertility (pH, P, K, Mg, Ca, OM)
Overall, 43% of grassland in Northern Ireland was shown to require lime. Sub-optimal soil
Improve the distribution of manure, preventing over- or under-supply of nutrients
pH can lead to on avarage 2t reduction in grass dry matter/ha/yr. The extra grass potentially
Benefiting the ENVIRONMENT
achievable through correcting soil pH can represent a 5 fold return on the lime investment.
Reducing the risk of nutrient loss to water-bodies
Conclusions
The 2017 soil sampling scheme in NI highlighted large inefficiencies in soil nutrient
The scheme comprised two components; an Open Scheme and a Catchment Scheme. management within the three main grass-based livestock sectors (dairy, beef and sheep). P
over-loading of land was a problem and needs to be addressed. Nutrient deficiencies were
The Open Scheme also identified, particularly K deficiency and soil acidity. Farmers were undoubtedly attracted
The Open Scheme was open to all eligible livestock farmers. In total, 3,030 farms (98,000 to the scheme by the free soil sampling and analysis provided. However, for the relatively
fields) registered and from this 522 farms were randomly selected (12,218 fields). modest cost of soil analysis, which is required only once every 3-5 years, tens of millions
worth of additional grass DM could be realised through the correction of nutrient imbalances.
16 17
16 Teagasc: Soil Fertility Conference 2018 Teagasc: Soil Fertility Conference 2018 17Manure and its Management
Patrick Forrestal
Teagasc, Crops, Environment and Land Use Programme, Johnstown Castle, Wexford.
Summary:
Soil test this autumn to decide where to apply slurry and to maximise yield potential.
Target slurry to first cut silage ground or low P and K index soils
Slurry nutrients can vary widely across farms, just like bagged fertiliser you need to know
your slurry “N-P-K label”
Nitrogen (N): up to two thirds of available N in slurry may be lost during housing and
storage
Maximise the remaining N by applying in spring with a trailing hose or dribble bar Figure 2. Large nutrient variability in slurry, a 17 fold difference in available N, a 11 fold in
Phosphorous (P) & potassium (K): applying slurry can save you money, offsetting the P and a 15 fold in K between high and low samples.
need for compound fertiliser purchases. 4. How do you get the most out of slurry N and balance correctly?
How to Maximise the Efficiency of Slurry Nutrients for Production & Profitability Get the most out of the available N not lost in housing and storage by:
(a) using a trailing shoe or dribble bar and (b) apply slurry during spring.
1. Do you have a recent soil test? Balance with fertiliser N to crop requirements as per figure 3 & download your free copy of
If not soil test all fields this autumn to determine your slurry and fertiliser plan to grow the the Teagasc Green Book of nutrient advice produced at Johnstown Castle.
most grass at the least cost next year.
Figure 1. Soil P & K index system and associated P & K plan.
Figure 3. Effect of slurry dry matter and application method on available N retained.
2. What is the target crop?
Slurry contains P and K in a suitable balance for silage. Note that slurry is mainly produced 5. Purchase P and K fertiliser required for maintenance & soil build-up requirements?
from animals eating silage during winter housing. Therefore slurry is best suited for Unlike nitrogen P and K are not lost as gases during housing, storage or application so the
application to silage ground and less suited to grazing ground due to high K levels. majority of maintenance requirements can often be met from slurry. Top up P and K with
fertilisers as required (see figure 4) and apply build-up P and K as indicated by soil test.
Table 1. Maintenance N-P-K requirements for silage production (Index 3 soils)
Crop Target Yield N P K
t/ha (D.M.) kg/ha
1st cut silage 5 125 20 125
2 cut silage
nd 3 100 10 75
3. What is the nutrient content of your slurry?
Slurry nutrient content is very variable across farms (Figure 2). A recipe for leaving crops
short of nutrients or for costly over application of purchased fertiliser.
Slurry dry matter content is a reasonable indicator of N and P content and also gives an
indication of K content. Dry matter content can be measured using a slurry hydrometer
(figure 2), talk to your advisor. Also consider sending a slurry sample for lab analysis to
check the nutrient level of slurry produced on your farm. Figure 4. Effect of slurry dry matter on P & K application rate.
18 19
18 Teagasc: Soil Fertility Conference 2018 Teagasc: Soil Fertility Conference 2018 19Long Term Fertiliser use Trends in Ireland and Implications for 120
Sustainability
Fertiliser use kg/ha
100
Cathal Buckley1, Emma Dillon1, Brian Moran1, John Lennon1 and David Wall2 80
1 Agricultural Economics and Farm Surveys Department, Teagasc, Athenry, Galway.
60
2 Crops, Environment and Land-use Programme, Teagasc Johnstown Castle, Wexford.
40
Summary 20
This research looks at fertiliser use on Irish farms based on data collected by the
0
Teagasc National Farm Survey between 2005 to 2015. 2005 2006 2007 2008 2009 2010 2011 2012 2013 2014 2015
Nitrogen (N), phosphorus (P) and potassium (K) fertiliser application rates on farms Nitrogen 99 100 89 76 88 92 84 81 95 88 83
declined by approximately 11-16% between 2005 and 2015, with more dramatic Phosphorus 9 9 7 4 4 6 5 5 7 8 8
declines in (23-52%) fertiliser use in the mid-study period. Potassium 23 21 19 13 11 15 14 14 19 20 20
Fertiliser use on land used for cereal production generally increased over this period.
Fertiliser application rates on grassland were on average 36% lower for farms Figure 1: Average fertiliser N, P and K applications on grassland from 2005 to 2015.
participating in Agri-environment schemes.
On average just over 20% of farms used lime year-on-year over the study period. Agri-environmental scheme membership had a large impact on fertiliser usage. Fertiliser
application rates on grassland were on average 34-38% lower on farms participating in an
Introduction Agri-environment scheme and 3-15% lower for cereal production.
This research examines long term developments in farm and crop scale fertiliser use across
the Republic of Ireland. The analysis is based on data collected by the Teagasc National Farm A concern raised by this research is that just over 20% of farms are using lime from year to
Survey covering the years 2005 to 2015. This is a period when fertiliser use on farms in the year. Adequate liming is essential to achieve optimum soil pH levels in order to maximise the
Republic of Ireland has been constrained by the Nitrates Directive regulations. This longer effectiveness of fertilisers. Higher rates of liming were associated with dairy farms but also
term study provides a better picture of fertiliser use trends at farm level than short term on farms of wide land use potential and farms with higher stocking rates.
analysis. Data showing short term trends in fertiliser use can be affected by fertiliser price
% of Farms using Lime
50%
levels and weather variations and are a less reliable indicator of longer term changes
40%
Methodology
30%
The data used for this analysis is taken from the Teagasc National Farm Survey (NFS). The
NFS is based on a nationally representative random sample of the farming population. The 20%
2015 results are based on a sample of 898 farms which represents 84,259 farms nationally.
Results are presented for average quantities of N, P and K and lime applied at farm level on 10%
grassland and arable farms between 2005 and 2015. Trends in fertiliser use by nitrates zone, 0%
land use class, farm system, stocking rate and agri-environmental scheme participation are 2005 2006 2007 2008 2009 2010 2011 2012 2013 2014 2015
part of overall research project (Teagasc, 2018). These NFS data results closely track annual Cattle 12% 11% 13% 16% 14% 15% 18% 14% 18% 16% 16%
sales data of N, P and K from the Department of Agriculture, Food and the Marine (DAFM). Dairy 28% 25% 27% 34% 25% 35% 40% 29% 42% 41% 35%
Sheep 17% 18% 20% 26% 21% 14% 20% 13% 24% 24% 19%
Results & Conclusions Tillage 30% 14% 21% 23% 20% 20% 27% 27% 36% 32% 28%
Results indicate that average N, P, K, fertiliser application rates on grassland tended to be All Systems 18% 16% 18% 22% 18% 21% 25% 19% 26% 24% 21%
between 11-16% lower at the end of the study period compared to the start, with more Figure 2: Percentage of farms using Lime by Farm System.
dramatic declines in application rates noticeable in the mid-study period (23-52%). The years
of lowest grassland fertiliser use (2008-09) coincided with the period of higher fertiliser Acknowledgements
prices, while higher than average fertiliser application rates in 2013-2014 were associated Grateful acknowledgement to the research staff involved in the collection and validation of
with the aftermath of a national fodder shortage. Higher application rates of N, P and K on the data and to farmers participating in the Teagasc National Farm Survey.
grassland were generally associated with farms in nitrates zone A, farms of wide land use
potential, dairy farms and farms with higher stocking rates.
Teagasc National Farm Survey: Fertiliser Use Survey 2005-2015, 2018. Available:
https://www.teagasc.ie/media/website/publications/2018/Fertiliser-Use-Survey
290518.pdf
20 21
20 Teagasc: Soil Fertility Conference 2018 Teagasc: Soil Fertility Conference 2018 21Getting the Most out of your Stored Slurry Solution
Recent work carried out at Johnstown Castle evaluated various chemical and biological
Ian Kavanagh and Dominika Krol amendments for reducing ammonical N losses from slurry during the winter storage period.
Teagasc, Crops Environment and Land Use Programme, Johnstown Castle, Wexford. An incubation experiment was carried out investigating ammonia emissions from cattle slurry
treated with chemical amendments such as sulphuric acid, acetic acid, ferric chloride and
Summary alum, and agricultural waste products such as sugar beet molasses and dairy processing waste
Maximising slurry nutrient value is important for offsetting expensive fertiliser input under winter storage conditions. The reductions in ammonical N emitted throughout the three
costs on farms. month experiment were significant with the greatest reduction of 97% from slurry treated
Use of chemical and biological amendments reduced nutrient losses during storage. with ferric chloride compared to the untreated slurry (Fig. 2). These amendments also had the
added benefit of drastically reducing methane emission from the slurry and reducing crusting,
These amendments may have secondary benefits when slurry is applied to field.
which would suggest potential reduction in slurry agitation costs.
Further investigation needed at field application. 100
% of NH3-N emitted
Introduction 80
during storage
As artificial fertilisers represent a large input costs on farms and fertiliser prices remain
extremely volatile, the improved slurry utilization has never been more relevant. Slurry is a 60
resource that has the potential not only to improve soil quality and grass growth but also lead
to direct savings in the form of reduced artificial fertiliser usage. Typical cattle slurry of 7% 40
dry matter (DM) has a nutrient value of approximately 2.4 kg of nitrogen (N) per tonne. The
20
majority of N in slurry is in the form of ammonium (NH4) which is readily available for
plants, however, it is also susceptible for loss to the air as ammonia (NH3) gas. The cattle 0
sector (dairy & beef) accounts for 80% of agricultural ammonia emissions in Ireland. Animal Untreated Dairy waste Sugar beet Acetic acid Alum Sulphuric Ferric
housing and manure storage contribute approximately half of these emissions (Figure 1). slurry molasses acid chloride
Figure 2: Ammonia-N (NH3-N) % reductions when compared to the untreated slurry.
The reduction in ammonical N emissions helped preserving the N nutrient content of the
slurry during storage. Plant-available N in slurries varied between amendment types and was
lowest in the untreated slurry and highest from slurry treated with ferric chloride (Table 1).
Table 1. Available nitrogen (NH4–N) in untreated and amended cattle slurry post winter
storage period
Treatment Available nitrogen (NH4-N) in slurry Nitrogen saving
kg/t Units/1000 gallons kg/t
Untreated slurry 1.16 10 units 0
Dairy waste 1.24 11 units 0.08
Sugar beet molasses 1.68 14 units 0.52
Acetic acid 1.52 13.5 units 0.36
Figure 1: Ammonia emissions distribution from cattle. Alum 2.36 21units 1.2
Sulphuric acid 2.22 20 units 1.06
Ferric chloride 3.02 27 units 1.86
What’s the problem?
Ammonia emissions during slurry storage equate to large N losses of up to 20 units of N Conclusion
nutrient for every 1000 gallons of slurry or 2.2kg of N/tonne and result in reduced N The use of selected amendments during winter slurry storage significantly reduced N
availability in slurry for land spreading. On top of this agronomic loss, ammonia emissions emissions leading to increased plant available N at slurry spreading time. Following the
have detrimental effects on the environment. Ammonia leads to pollution and acidification of incubation experiment a pilot-scale study is planned for winter 2019 to further investigate the
waterways and it disrupts the N balance of sensitive ecosystems and also indirectly leads to effects of slurry amendments on gaseous emissions to air, plant availability of slurry nutrients
greenhouse gas pollution in the form of nitrous oxide (N2O). Ammonia can also lead to other and grass growth response post slurry application. In particular, the use of amendments such
issues such as bovine respiratory problems in poorly ventilated houses and infrastructural as ferric chloride and alum may have an effect on phosphorous availability. Furthermore,
damage in the form of rusting and corrosion of ventilation points. different slurry spreading methods, such as low emission slurry spreading techniques, will be
used to evaluate the full potential of ammonia savings and improved N use efficiency of
slurry. The financial cost-benefit of each amendment will also be evaluated.
22 23
22 Teagasc: Soil Fertility Conference 2018 Teagasc: Soil Fertility Conference 2018 23NMP-Online; Planning lime & Nutrient Requirements for the Farm
Christy Watson,
Drystock Advisor, Naas, Co. Kildare
Introduction
Irish farmers spent €500m on fertiliser and lime in 2017, a very significant input cost on Irish
farms. It is essential that fertiliser inputs are used to maximum effect in driving output while
at the same time not adversely affecting the environment. This poses a challenge for advisers
to produce fertiliser recommendations that meet crop requirements within the constraints of
existing environmental protection legislation. With many factors to be considered it is not a
simple procedure to generate fertiliser recommendations for a farmer. Some of the factors
that must be taken into account are as follows; Figure 1. Field map, with field area and soil test P index
Soil test results: pH, P & K levels Planning
Quantity of concentrate feed used on the farm Once the farm is mapped then animal numbers to be held on the farm are entered to generate
Whole farm and grassland stocking rate a stocking rate. Soil sample results for the farm are electronically imported into NMP Online
which saves time and eliminates any potential error. Concentrate feed usage is entered for the
Winter housing period: 16, 18, 20 or 22 weeks year preceding the planning year along with details of all animal housing and manure/slurry
Crop rotation and grassland use (grazing or silage +/- grazing) storage facilities. Using this information the NMP Online programme generates an accurate
Use of organic manures-imports and exports estimate of the volumes of slurry/soiled water and farmyard manure produced on the farm,
Farm soil type : mineral vs organic (peaty) soils giving the farmer and advisor two critical pieces of information. A report showing the
Environmental scheme (GLAS / BPS) or Nitrates derogation participant quantity of organic manures to be spread or exported and the adequacy of the storage
facilities to meet mandatory storage requirements under Nitrates regulations as shown in
figure 2. This enables the advisor and farmer to target the valuable nutrient resources in slurry
So we can see it is no longer as simple as looking at a soil test result and telling the farmer and manures that are available to the fields that have the highest P and K requirements.
what to apply to any particular crop. An additional complication is the wide variety of
fertiliser types used by both livestock and tillage farmers. According to the Teagasc National
Farm Survey-Fertiliser Use Survey 2005-2015 thirty nine fertiliser types account for 95% of
the applied fertiliser on Irish farms in 2015. So the task of generating a fertiliser
recommendation for the average Irish farm is not as simple as we might first believe. It is
clear that we need comprehensive and intelligent decision support tools to assist us to develop
a fertiliser plan in order to get best outcome for our farmer clients.
The Teagasc Nutrient Management Planning (NMP) Online tool was launched in 2016 and
enables agri-professionals to produce high quality nutrient management plans for farmers by
combining their expert knowledge of soil fertility with a range of information sources.
The Teagasc NMP Online programme has been designed for agri-professionals to allow them
to design a programme of fertiliser management for their clients to optimise production while
working within the limits set down for nutrient use under the Nitrates regulations. Some of
the key features of the programme are discussed as follows in this paper.
Mapping Tool
The latest aerial imagery and mapping capability is used to map all fields on the farm. All soil
characteristics and management factors to be considered are linked to the field unit. This
enables maps to be generated for the farmer showing the soil nutrient phosphorus (P),
potassium (K), magnesium (Mg) and pH levels for each field with colour coding according to
index, to show fields that need particular fertiliser treatment to remedy a significant
deficiency, as shown in figure 1. Figure 2. NMP Online farm manure calculations for slurry storage and slurry produced.
24 25
24 Teagasc: Soil Fertility Conference 2018 Teagasc: Soil Fertility Conference 2018 25Liming Programme Table 2. Livestock type and number and fertiliser use on the farm in 2017
The first critical aspect of nutrient management planning is to ensure that any fields with low Livestock type No. Lime/ Fertiliser Type Rate (t/ac)
pH are limed adequately. The NMP Online programme generates a lime report which clearly Bulls @ 420kg 40 Lime (autumn 2016) 2 t/acre
outlines to the farmer where lime is needed and what rate to be applied. An example of the Heifers @ 390 kg 28 Urea ½ bag/ac
lime application map is shown in figure 3. Suckler Cow + calves 2 18-6-12+S 5 bags/ac
Turnout date: March 13th Total Units/ac
Weanlings purchased as stock is finished or N: 113 – P:30 – K:60 – S:20
housed
The outputs achieved in the first full year of production are shown in table 3, demonstrating
the excellent output that can be achieved on old pasture through judicious use of fertiliser
nutrients combined with excellent grassland management. The nutrient management plan for
this block of land addressed the existing soil fertility issues, and resulted in 13.75 tonnes/ha
DM of grass grown.
Table 3. Lime and fertiliser costs and livestock and grass outputs and revenue generated.
Lime & Fertiliser inputs Cost (€) Outputs €
Fertiliser €2,812 (€225/ha) 240 grazing days
Lime €400 9,000 kgs Live Wt €21,150
Figure 3. Field map with soil pH level and lime application. Outblock: 60 silage bales €1,500
20% more fertiliser (+€37/ha) Grass grown 13.75 t/ha DM
Fertiliser Plan - chemical fertiliser Total Cost €3,212 Total Revenue €22,650
A chemical fertiliser plan can be generated in a map format as well as a tabular version to
guide the farmer in a practical way at farm level. Once the nutrient management plan is Conclusions:
completed the programme generates a purchase list of the fertilisers recommended for the NMP Online is an essential tool for delivering fertiliser and lime advice to farmers.
relevant year as shown in table 1. Nutrient recommendations are presented in a very user friendly and practical format.
The NMP Online maps create a visible link to soil fertility results on a field-by-field
Table 1. Annual farm fertiliser shopping list and quantities required basis and for map based fertiliser and lime application programmes to be generated.
Planned Fertilisers As well as giving guidance on grassland and crop nutrient requirements, NMP Online
Fertiliser Tonnes also provides critical information on regulatory compliance.
Urea(46%N) 4.7 By following good nutrient advice farmers can reduce their costs of production, by
18-6-12 20.6 increasing grass production expensive rented land can be eliminated.
CAN(27%N) + S 12.5
NMP Online – farm case study
Good nutrient management planning should increase overall farm profitability by increasing
output or helping to reduce existing costs of production, for example leading to a reduction in
the need for rented land or a reduction in purchases of forage or concentrates. In 2016 I
completed a nutrient management plan using NMP Online for a client who took on an extra
12.5ha block of land on long term lease. The main issues on this land block were old pasture
with all soil samples at index 1 for P and 2/3 of samples at index 1 for K, and 1/3 of the farm
required 2 tonnes lime per acre.
As this leased farm was to be used for beef production it was decided not to reseed but to
address soil fertility and install paddocks, with the aim of maximising grass production. The
livestock grazed on the farm and fertiliser use in 2017 are shown in table 2.
26 27
26 Teagasc: Soil Fertility Conference 2018 Teagasc: Soil Fertility Conference 2018 27Growing Lots of Grass! Grass Management
We began measuring grass in 2008 and have continued to do so ever since. We walk the farm
Mark Heffernan weekly and twice a week in times of high growth. Last year the farm was walked and grass
The Heffernan Family Farm, cover was measured 50 times. This information is then entered into the Pasture Base Ireland
Caherleske Farm, Dunnamaggin, Co. Kilkenny. web-based programme. Pre-grazing covers and cover per cow are 2 key figures we use when
making decisions about grazing.
Summary The weekly farm cover measurements are also marked onto a farm map which is printed on a
Our objective is to grow and utilise as much grass as we can and in turn convert that white board and located on the wall in the dairy. This is an essential piece of equipment as all
grass into milk solids. members of the family can clearly view the grass supply on the farm every week and the next
Soil testing and fertiliser planning every year are important to ensure the farm can paddocks to be grazed.
grow lots of grass. Farm Performance
White boards in our dairy show a map of soil fertility and slurry application strategy Currently there is a stocking rate of 3.3 cows/ha on the milking block and the overall farm
for each paddock. stocking rate is around 2.75 LU/ha. Our focus on output and profit on this farm is based on
Soil tests results in January 2017 indicate that about 60% of the soils on the farm have high grass utilization. About 550 kgs meal/cow was fed in 2017 and the rest of the herds diet
a deficiency in lime and potassium (K). was made up of grazed grass and grass silage. The farm sold over 480 kgs milk solids/cow to
We have spread 800 tons of lime in 2017 to help improve the soil pH. GII (Glanbia) in 2017 or over 1400 kgs milk solids/ha from the milking platform. The target
Muriate of potash (50% K) was the main fertiliser product used to tackle our K is to sell over 1500 kg/ha of milk solids from a predominately grazed grass diet.
deficiency.
Slurry is targeted towards soils with highest requirement for K. Soil Fertility Management
Our farm is soil tested on a regular basis (about 3 times in 5 yrs). Our plan is to soil sample
Introduction the farm every 2 years. We are due to soil sample our milking platform in January 2019. We
Our farm consists of about 200 ha of land which is in 3 blocks. The home farm is the milking apply for a Nitrates Derogation every year and a nutrient management plan is drawn up by
platform of 132 (95 ha owned, 37 ha leased). There are 2 outside blocks; Outside block 1 is our Teagasc advisor. This forms the basis of our fertiliser and slurry plan for the year. The
23.5 ha which is all leased and the second Outside block 2 is 37.5 ha which is also all leased. soil fertility analysis for each paddock is marked onto a farm map which is printed on a white
The outside blocks are used for grazing the replacements for the dairy herd and for silage board and located on the wall in the dairy. We have a paddock slurry map on a white board
production. For many years the home block of 95 ha was farmed as a mixed farm with also. These are essential pieces of equipment as all members of the family can clearly view
typically 40 dairy cows, 300/400 breeding ewes, and a cattle and a tillage enterprise. Now the where compound fertilisers and, or, slurry needs to be targeted i.e. low index paddocks.
farm is completely focused on dairy production and is farmed as a family partnership made In January 2017, about 60% of the farm was low in lime and index 1or 2 for potassium (K).
up of my parents, myself and my brother Liam. We have a lot of soils index 3 or 4 for phosphorus (P). Since then we have spread 800 tonnes
of lime (500 tons on the milking platform). A small amount of lime is required this autumn
The farm has evolved overtime and has grown in cow numbers over the last decade to on about 10 ha. Our main compound fertiliser application is in spring with 2 bags of N-P-K:
become a dairy farm. This is outlined in the table below. 18-6-12 /acre. We have also spread fertilisers high in K (Muriate of Potash 50% K in autumn
time) to help fix our K deficiency and we target slurry on our paddocks which are low in soil
Table 1. Dairy cow numbers between 2008 and 2018 on the farm K or that are cut for silage (surplus grass).
We believe our farm responds well to sulphur application and we start applying sulphur in
Year 2008 2009 2010 2011 2012 2013 2014 2015 2016 2017 2018 April. We use a CAN 27%N + S type product where about 25 units/acre of sulphur is applied
to every paddock every year.
Cows 70 79 102 104 120 144 165 224 295 346 450 Conclusions
Our farm aims to grow and utilise as much grass as we can and in turn convert that grass into
Growth in cow numbers has been matched with both an increase in land base but also an milk solids. Soil testing is carried out every 2 years and this forms the basis of our fertiliser
increase in the grass grown per ha on the farm. Outlined below is the grass production pattern and slurry plan for the year. Farm maps printed on white boards located in our dairy help us
over the last 10 years. There has been a 50 % increase in grass production on this farm. The keep track of soil fertility for every paddock and slurry application for each paddock. This
length of our grazing season is now about 290 days. has proven to be a successful strategy and has helped us to increase grass growth over the last
decade.
Table 2. Average grass grown (t/ha) between 2008 and 2017 across the farm.
Year 2008 2009 2010 2011 2012 2013 2014 2015 2016 2017
Grass t/ha 12.6 14.3 13.6 15.6 15.9 15 16.5 17.5 16.5 19.0
29
28
28 Teagasc: Soil Fertility Conference 2018 Teagasc: Soil Fertility Conference 2018 29You can also read