Elevational is the main factor controlling the soil microbial community structure in alpine tundra of the changbai Mountain - Nature
←
→
Page content transcription
If your browser does not render page correctly, please read the page content below
www.nature.com/scientificreports
OPEN Elevational is the main factor
controlling the soil microbial
community structure in alpine
tundra of the Changbai Mountain
Mingze Tang1, Lin Li1,2, Xiaolong Wang1,2, Jian You1, Jiangnan Li1 & Xia Chen1*
To reveal the self-coordination mechanism of the fragile ecosystem of alpine tundra, we explored the
relationship between soil microorganisms and other elements. On the alpine tundra of the Changbai
Mountain, different vegetation types, altitudes and soil properties were selected as driving factors
of soil microbial community. Soil microbial community, C- and N-cycling functional microbial and
fungal biomass were analyzed. Structural equation model was used to study the control of biotic and
abiotic factors in rhizosphere soil microbial community. The results showed that the pH value of soil
had the strongest direct impact on the diversity and community structure of soil microorganisms,
and had significant correlation with most of the C- and N-cycling functional microbial; organic carbon
and vegetation also have strongest direct effect on fungal biomass, but all of them were not main
factors influence soil microbial community structure, the elevation was the main controlling factor. In
addition, the elevation mainly through indirect action affects the soil microbial community by driving
distribution of plant species, soil organic carbon and pH value. This finding highlighted that elevation
was the main predictor to determine rhizosphere microbial community structure but not vegetation in
alpine tundra of Changbai Mountain.
Soil microorganism as one of the most important links in the biochemical cycle, can affect many important
cycling processes of soil e cosystem1, such as carbon and nitrogen cycling in the ecosystem, transformation and
cycling of soil nutrients (nitrogen, phosphorus, etc.). Therefore, changes in soil microbial community structure
are often used as important sensitive indicators of changes in soil environment and n utrients2. Given that the
influence of environmental factors on microorganisms can reveal fundamental problems in microbial e cology3,4,
research on it will be of great significance for the function of soil e cosystem5.
Vegetation plays an important role in shaping the rhizosphere m icrobiome6,7. It has been found that narrow
areas of soil around plant roots are affected by root activity and/or root e xudates8, and that each vegetation type
supports a rhizosphere-specific microbial c ommunity9,10. Thus, specific soil conditions under different vegeta-
tion types coexist with specific soil microbial c ommunities11. As a frontier ecological topic in the field of micro-
bial–environmental interaction12,13, a deeper understanding of the relationship between vegetation types and soil
microbial communities may help us develop better strategies to protect the harsh environment of alpine tundra14.
Alpine tundra elevation gradients have also proven to be important when people try to understand the effects
of environmental factors on the structure and distribution of microbial communities. A short elevation gradient
on a high mountain can provide a serious environmental gradient. Therefore, the species number and richness of
which decrease with the elevation rising15, and the composition and metabolic rate of soil microbial communi-
ties can also be r egulated16. To date, some is known regarding the shift in microbial community structure and
functional genes along an alpine c limosequence17–19. Although the assessment of effects such as high turnover of
aboveground vegetation, local soil conditions, and climate regimes on spatial patterns of microbial communities
along elevation g radients20 has been performed, most experimental studies have focused on large-scale natural
ecosystems or microbial communities along latitudinal g radients21,22 rather than across the range and scale of
elevation gradients23,24.
1
National & Local United Engineering Laboratory for Chinese Herbal Medicine Breeding and Cultivation, School
of Life Sciences, Jilin University, Changchun 130112, China. 2Medical Technology Department, Qiqihar Medical
University, Qiqihar 161006, China. *email: chenxiajlu@163.com
Scientific Reports | (2020) 10:12442 | https://doi.org/10.1038/s41598-020-69441-w 1
Vol.:(0123456789)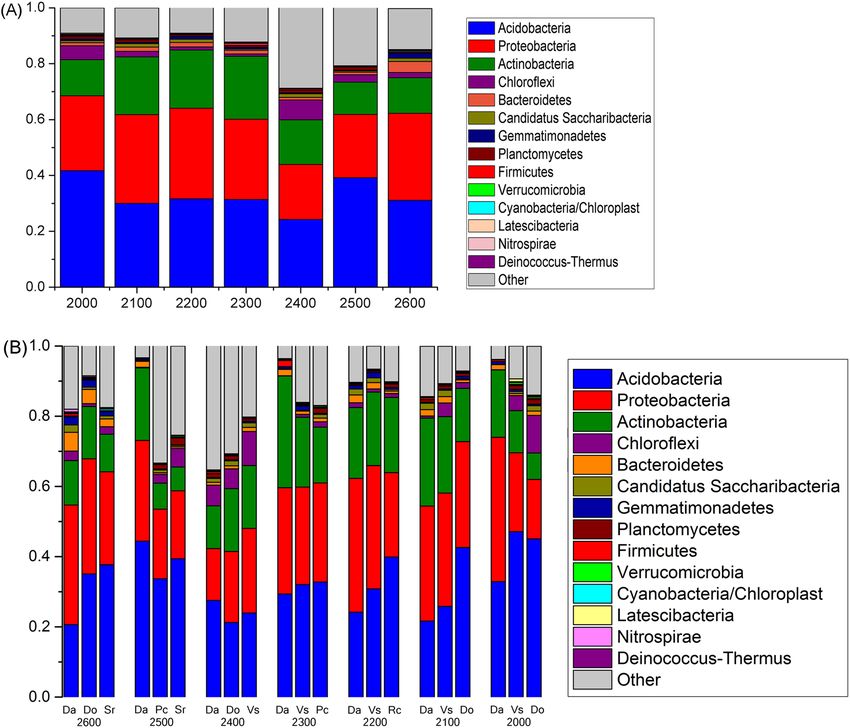
www.nature.com/scientificreports/
Besides vegetation and elevation gradient, soil microbial is also sensitive to soil properties such as pH, mois-
ture, nutrient amounts, and nitrogen/carbon (C/N) r atio25–27. Uroz et al. observed that bacterial community
composition was strongly correlated with soil characteristics under different vegetation types27. Similarly, Shi
et al. have recently observed that bacterial, fungal, and eukaryotic communities were correlated with ammonium
concentration, dissolved organic nitrogen (DON) content, and C/N ratio in the Arctic tundra28. In addition, as
important component of the soil microbial community, some studies have suggested that the biomass of fungi
is significantly correlated with soil nutrients, because of relatively high amounts of chitin and protein in fungal
cell walls and their biopolymers, thus representing an important source of both carbon (C) and nitrogen (N)29–31.
The relationships between soil physicochemical characteristics and the development of plant and microbial suc-
cessions have been subject of investigation for a long t ime27.
The above relationships are all interrelated. Vegetation along the mountainside elevation distribution may vary,
when mirroring the latitudinal vegetation gradient from temperate to frigid zones on the Eurasian c ontinent32,33.
Soil properties such as pH and nutrient availability are also important drivers of structure, diversity, and func-
tioning of both plant and microbial communities34–36. However, little studies taking all of them into account.
The objectives of this study were (1) to explore the relationship among vegetation, elevation, soil physico-
chemical properties and soil microbial communities, (2) to determine the main driving factor controlling the
microbial community. Considering that climate change and the change of vegetation type which caused by alien
species invasion can pose an important challenge to the environmental protection of tundra, our study should
provide scientific basis for predicting the change trend of microbial community under different environmental
conditions. Moreover, in view of the important position of soil microorganisms in the terrestrial ecosystem, to
explore the relationship between soil microorganisms and other elements of the tundra ecosystem will help us
to understand the self-coordination mechanism of the whole ecosystem and provide theoretical basis for envi-
ronmental protection or disaster recovery.
In this study, the soil bacterial communities in the alpine tundra of Changbai Mountain were studied at differ-
ent elevations (2,000–2,600 m) and under different conditions of vegetation rhizospheres and soil environments.
Due to the plant rhizosphere soil as our research object which is specifically influenced by plant root activities
and/or root exudates, we further hypothesized that vegetation may be the main controlling factors for microbial
community composition in rhizosphere soil. Therefore, we set up two research groups along the elevation gradi-
ent to study the relationship between soil biological factors, abiotic factors and microbial communities under
different dominant vegetation types and different mixed types of the same species (see “Experimental design”
method). We used the sequencing method (Illumina MiSeq) to analyze the soil microbial community structure,
real-time PCR to quantitatively analyze the nutrient cycling functional genes, and high-performance liquid
chromatography (HPLC) to quantify the fungal biomass, and related it to the elevation, species investigation
and measurement of soil variables to reveal the potential interaction.
Results
Rhizosphere soil bacterial community along the elevation gradient. Soil nutrients significantly
varied across the elevation gradient (Supplementary Table S1); soil enzyme activity did not significantly vary,
with the exception of urease activity. Ergosterol levels were the highest at the elevation 2,200 m and the lowest at
2,600 m (Supplementary Fig. S1), but fungal biomass did not differ significantly (P = 0.079). Correlation analy-
ses (Supplementary Fig. S2) showed that fungal biomass was significantly positively correlated with TN (total
nitrogen), TOC (total organic carbon), MBC (microbial biomass carbon), and sucrase (P ≤ 0.001). Assessment
of the abundance of C- and N-cycling functional groups (bacterial aomA ammonia oxidizing bacteria functional
gene, archaeal aomA ammonia oxidizing archaea functional gene, nifH nitrogen-fixing bacteria functional gene,
nosZ denitrifying bacteria functional gene, cbbl carbon-fixing bacteria functional gene) revealed that only the
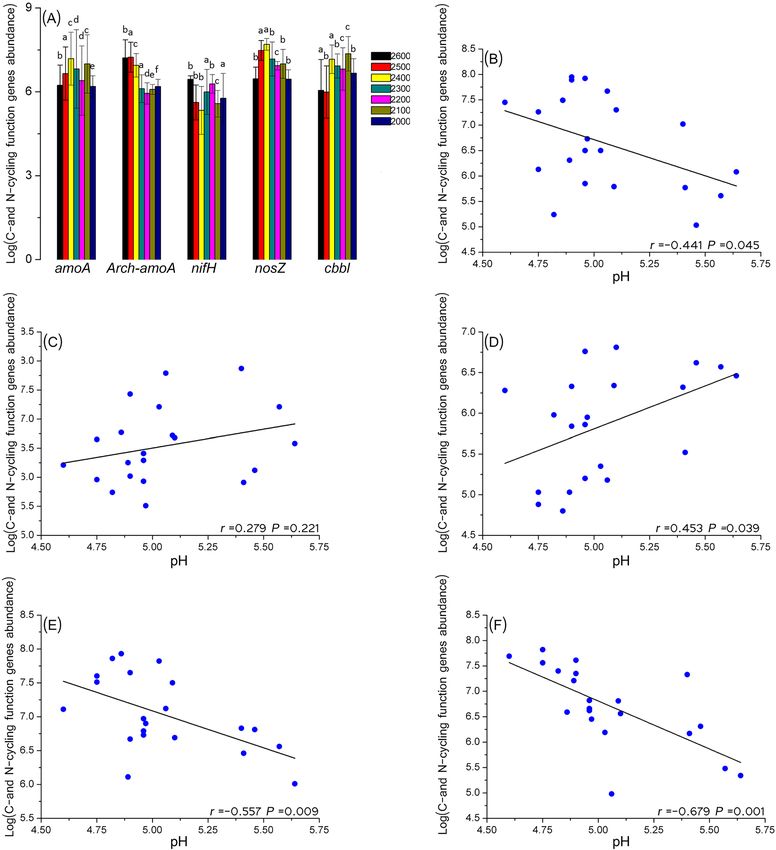
abundances of archaeal aomA and nosZ significantly differed (P ≤ 0.05) among the seven elevations (Fig. 1A).
Pearson´s correlation coefficient (r) for the abundances of C- and N-cycling function genes and soil properties
showed that the functional genes were significantly (P ≤ 0.05) correlated with pH values, except for archaeal
aomA genes (Fig. 1B–F). Among them, the abundance of archaeal aomA was correlated with elevation, soil
moisture, and urease, the abundance of cbbl was positively correlated with SOC, C/N ratio, urease, and soil mois-
ture and negatively correlated with N H4+. The abundance of nosZ was positively correlated with phosphatase and
bacterial aomA was positively correlated with soil moisture (Supplementary Table S2).
16S rRNA gene sequencing showed that alpha diversity was significantly different between the seven eleva-
tions, except in terms of the Simpson index (Table 1). The OTU richness exhibited a unimodal pattern with
elevation, albeit with no significant differences (P = 0.255), and showed higher values for samples from lower or
higher elevations than for samples from medium elevations (Supplementary Fig. S3).
In terms of the response of the bacterial community to the different elevations, Acidobacteria (33%) was
the most dominant phylum, while Proteobacteria was the second most abundant phylum, accounting for 28%
of all sequences; Actinobacteria were accounting for 17% (Fig. 2A). Testing by ANOSIM revealed that three
dominant bacterial phyla (Bacteroidetes, Gemmatimonadetes, and Nitrospirae) showed significantly different
abundances between different elevations (Supplementary Table S3). Nitrospirae was most abundant at 2,600 m,
but non-existent at elevations of 2,500, 2,400, and 2,100. Non-metric multidimensional scaling (NMDS) ordi-
nation revealed microbial communities were significantly different (P = 0.011) between elevations (Fig. 3A).
The microbial community at 2,600 m was separate from that of other elevations, but communities at 2,500 and
2,400 m were more similar. The microbial community at lower elevations (below 2,300 m) was not obviously
different (Fig. 3A).
Scientific Reports | (2020) 10:12442 | https://doi.org/10.1038/s41598-020-69441-w 2
Vol:.(1234567890)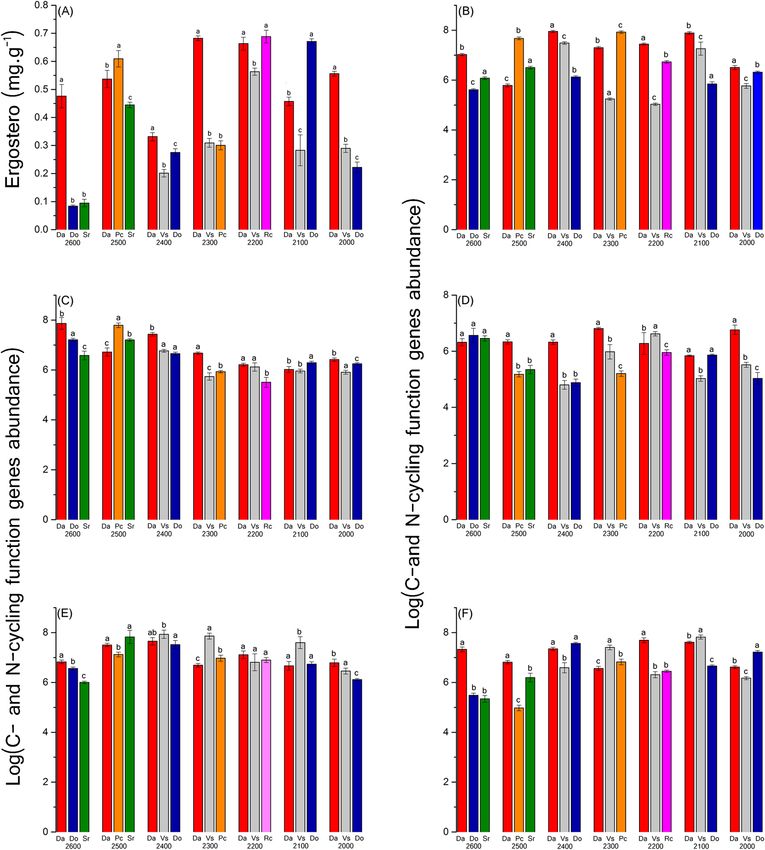
www.nature.com/scientificreports/

                            Figure 1.  (A) Real-time PCR quantification of the C- and N-cycling function genes (aomA bacterial amoA,
                            Arch-amoA archaeal amoA, nifH nitrogen-fixing bacteria functional gene, nosZ denitrifying bacteria functional
                            gene, cbbl carbon-fixing bacteria functional gene) in the bulk soil under seven elevations. The copy number of
                            genes in each gram of dry soil was estimated based on the results of real-time PCR (copies per ng DNA). The
                            standard curve of all these genes was > 0.99. Each sample was measured in triplicate. (B–F) Pearson correlations
                            between C- and N-cycling function genes abundance and pH-value. (B) was bacterial amoA; (C) was archaeal
                            amoA; (D) was nifH; (E) was nosZ and (F) was cbbl correlation with pH. Pearson correlations between C- and
                            N-cycling function genes abundance and other indexes see Supplementary Table S2.

                            Different rhizosphere soil bacterial communities at similar elevations. The results of the ANOVA
                            showed the rhizosphere soil properties of different plants at the same altitude were different significantly. At
                            2,600, 2,500, 2,200, and 2,000 m, total nutrient levels at Da (the independent community of R. aureum Georgi)

Scientific Reports |   (2020) 10:12442 |              https://doi.org/10.1038/s41598-020-69441-w                                           3

                                                                                                                                      Vol.:(0123456789)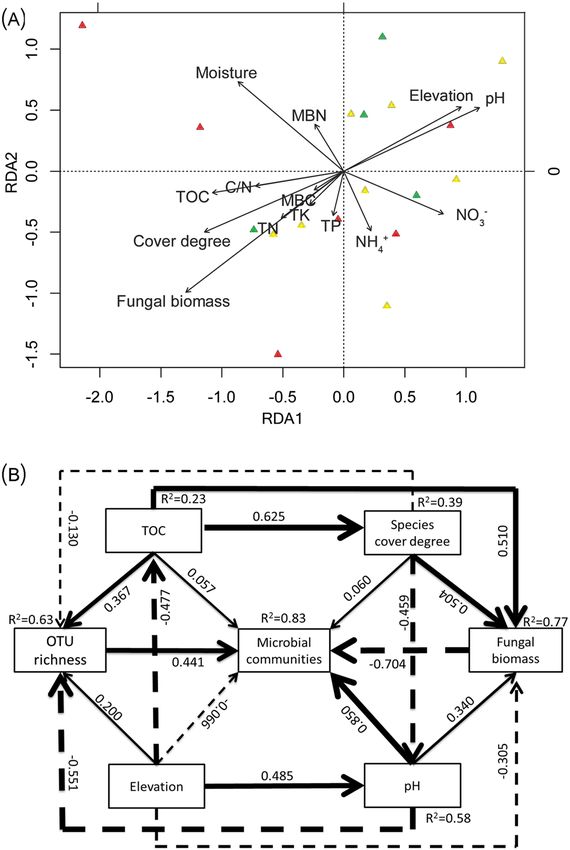
www.nature.com/scientificreports/

                                                 Chao1          Observed species   PD whole_tree   Shannon    Simpson
                                       2,600 m   1,207.291      1,049.333          60.10461        8.382897   0.991891
                                       2,500 m       896.4872   746.3333           45.823          7.435108   0.987337
                                       2,400 m   1,089.604      902.3333           55.01141        7.662607   0.987238
                                       2,300 m       913.1888   757                46.78453        7.431501   0.985501
                                       2,200 m   1,240.182      988                57.33918        7.842169   0.985375
                                       2,100 m   1,017.882      830.3333           51.05846        7.643039   0.988449
                                       2000 m    1,118.46       908.3333           52.47835        7.637198   0.984229
                                       P-value         0.025    0.008              0.031           0.005      0.173

                                      Table 1.  The alpha diversity difference between seven elevation treatments. Bolded values indicate significant
                                      (P < 0.05, ANOVA) effects.

                                      Figure 2.  Relative abundances of the dominant bacterial phyla in soils separated according to elevation and
                                      species categories. Relative abundances are based on the proportional frequencies of those DNA sequences that
                                      could be classified at the phylum level. (A) was separated according to elevation categories; (B) was separated
                                      according to species categories at seven elevations.

          Scientific Reports |   (2020) 10:12442 |                      https://doi.org/10.1038/s41598-020-69441-w                                      4

Vol:.(1234567890)
www.nature.com/scientificreports/

                            Figure 3.  Non-metric multidimensional scaling (NMDS) plot of community composition based on
                            pyrosequencing of (A) microbial communities of seven elevations and (B) microbial communities of Da (the
                            independent community of R. aureum Georgi), Da + S (R. aureum Georgi lives with other shrub), Da + H (R.
                            aureum Georgi lives with herbaceous). Distances for (A,B) are based on weighted Unifrac scores. Bray-Stress for
                            (A,B) are 0.134 and 0.082.

                            sites were higher than at other sites. However, soil pH was not significantly different among the three plant soils
                            at same elevations of 2,600, 2,500, and 2,100 m. Soil enzymatic activities at Da sites were highest at 2,600 and
                            2,100 m (Supplementary Table S1). At the same elevations, the content of ergosterol was significantly different
                            between the three plant soil samples (Supplementary Table S7). Among them, Pc, Rc, and Do had the highest
                            ergosterol contents, respectively, at 2,500, 2,200, and 2,100 m; ergosterol contents of Da sites were higher than
                            others at the remaining three elevations (Fig. 4A).
                                Abundance of C- and N-cycling functional groups in the rhizosphere soil, for bacterial amoA, was highest
                            at 2,500 and 2,100 for Pc. At other elevations, highest abundance was found for Da sites. The abundance of
                            archaeal amoA (Fig. 4B–F) was highest in Pc and Do sites at 2,500 and 2,300 m respectively; Da sites showed
                            higher values than the two other sites at the remaining elevations. For nifH abundance, there was no significant
                            difference among the three plant species at 2,600 m; Vs had the highest abundance at 2,200 m, at other three
                            elevations, the highest abundance of nifH was found in Da sites. For nosZ abundance, values at 2,200 m were
                            not significantly different between plant species. The rhizosphere soil of Da had the highest abundance of cbbl
                            at elevations of 2,600, 2,500 and 2,200 m.
                                Taxonomic summary of the relative abundance of bacteria (Fig. 2B) showed that rhizosphere soil microbial
                            communities were different between the three plant species at the same elevation. The rhizosphere soil of Da had
                            a higher relative abundance of Proteobacteria (phyla) than other plant species at the same elevation, except at
                            2,400 m. The heatmap shows pairwise comparisons of the bacterial community structures between all samples
                            (Fig. 5A) showed that the sites at 2,600 m were clustered into one clade. At 2,500, 2,400, and 2,300 m, the Da sites
                            were separated from the other two sampling sites. Soil communities were clustered into different clades at lower

Scientific Reports |   (2020) 10:12442 |               https://doi.org/10.1038/s41598-020-69441-w                                             5

                                                                                                                                         Vol.:(0123456789)
www.nature.com/scientificreports/
Figure 4. (A) Ergosterol (mg g−1) in rhizosphere soil for different species on the seven elevations. (B–F) Real-
time PCR quantification of the C- and N-cycling function genes in the rhizosphere soil under different species
on the seven elevations. (B) is bacterial amoA, (C) is archaeal amoA; (C) is nifH; (D) is nosZ and (F) is cbbl.
altitudes. Hierarchical clustering analysis (Fig. 5B) for Da at seven elevations showed that 2,600 m and 2,400 m
were clustered into one clade, Da at other elevations formed clustered into the other clade.
The rhizosphere soil bacterial community in different plant communities formed by the same
vegetation. The rhizosphere soil properties of different plant communities formed by the same plant in the
alpine tundra were not significantly different (Supplementary Table S4). The highest content of ergosterol in the
soil was found for Da; Da + S (R. aureum Georgi lives with other shrub) had lower content and Da + H (R. aureum
Georgi lives with herbaceous) the lowest (Supplementary Fig. S4).
Scientific Reports | (2020) 10:12442 | https://doi.org/10.1038/s41598-020-69441-w 6
Vol:.(1234567890)www.nature.com/scientificreports/
Figure 5. (A) Pairwise comparison of β-diversity with all samples and annotations. Clustering and heatmap
were computed using the weighted Unifrac scores. (B) Hierarchical clustering analysis of microbial communities
for Da at seven elevations based on pyrosequencing data.
Scientific Reports | (2020) 10:12442 | https://doi.org/10.1038/s41598-020-69441-w 7
Vol.:(0123456789)www.nature.com/scientificreports/
Figure 6. (A) Redundancy analysis (RDA) triplots of 16S rDNA fingerprint patterns, showing the contribution
of 14 environmental parameters to variability. Arrows indicate environmental factors and their relative effects on
microbial community structure. The red triangles indicate Da; yellow triangles indicate Da + S; green triangles
indicate Da + H. Eigenvalues of RDA1 and RDA2 are 0.336 and 0.2436. (B) A structural equation model (SEM)
showing the causal influences of soil TOC, pH, species cover degree, elevation, OTU richness, fungal biomass
and microbial communities in the soil. The width of arrows indicates the strength of the causal effect. The
numbers above the arrows indicate path coefficients (*indicate significant (P < 0.05) effects, **indicate significant
(P < 0.01) effects, ***indicate significant (P < 0.001) effects). Bold and dashed lines indicate positive and negative
effects respectively. R2 values represent the proportion of the variance explained for each variable.
The abundance of C- and N-cycling functional groups was assessed for three treatments. Treatment Da + H
had the lowest abundance of nifH and cbbl genes, but the abundance of other functional genes was not signifi-
cantly different between the three treatments (Supplementary Fig. S5). There was no significant difference in OTU
richness among the three plant communities (Supplementary Fig. S6). Pearson correlation analysis indicated
that OTU richness and fugal biomass were significantly intercorrelated and both were significant positively
correlated with TOC and species degree (P < 0.05), but negative correlated with pH (P < 0.05) (Supplementary
Table S5). Fugal biomass was also negatively correlated with elevation (P < 0.05). NMDS ordination revealed that
there was no significant difference (P = 0.145) in microbial communities among Da, Da + S and Da + H (Fig. 3B).
However, microbial communities at Da + S and Da + H sites were more similar than at Da. In the redundancy
analysis (RDA) ordination biplot (Fig. 6A), fungal biomass and cover degree showed a significant correlation
with community composition (Supplementary Table S6). Other factors, such as moisture, pH, elevation, and
TOC also showed a high correlation with bacterial community composition (Supplementary Table S6).
In order to further analyze the relationship between soil biological factors and non-biological factors, the
structural equation model (SEM) was constructed. The path model on the controls of soil microbial commu-
nity structure by dominant site factors passed all the statistical tests on adequacy (λ2 = 0.980, P = 0.806, CMIN
/df = 0.327; GFI = 0.990; CFI = 1.000; RMSEA < 0.001) and explained 63%, 83%, and 77%, respectively, of the
variance in the abundance of OTU richness, bacterial communities and fungal biomass. The path coefficients
(λ) for direct effects are displayed in Fig. 6B. The direct, indirect, and total effects on bacterial communities and
intermediate explanatory variables are shown in Table 2. Regarding the total effects, elevation (λ = 0.603) was the
strongest predictor for microbial community composition in rhizosphere soil compared TOC, pH and vegeta-
tion coverage (Table 2). Regarding the direct effects, pH (λ = 0.850, P < 0.001) was the strongest direct predictor
Scientific Reports | (2020) 10:12442 | https://doi.org/10.1038/s41598-020-69441-w 8
Vol:.(1234567890)www.nature.com/scientificreports/
Cover Fungal OTU
Elevation TOC pH
degree biomass richness
Direct Effects
TOC -0.477 0 0 0 0 0
Cover degree 0 0.625 0 0 0 0
pH 0.485 0 -0.459 0 0 0
Fungal biomass -0.305 0.51 0.504 0.34 0 0
OTU richness 0.2 0.367 0.13 -0.551 0 0
Microbial community -0.066 0.057 0.06 0.85 -0.704 0.441
Indirect Effects
TOC 0 0 0 0 0 0
Cover degree -0.298 0 0 0 0 0
pH 0.137 -0.287 0 0 0 0
Fungal biomass -0.182 0.217 -0.156 0 0 0
OTU richness -0.556 0.239 0.253 0 0 0
Microbial community 0.668 -0.451 -0.466 -0.482 0 0
Total Effects
TOC -0.477 0 0 0 0 0
Cover degree -0.298 0.625 0 0 0 0
pH 0.622 -0.287 -0.459 0 0 0
Fungal biomass -0.486 0.727 0.348 0.34 0 0
OTU richness -0.356 0.606 0.382 -0.551 0 0
Microbial community 0.603 -0.394 -0.406 0.368 -0.704 0.441
Table 2. Direct, indirect and total effect coefficients of each variable. Stronger colours (red is positive, blue is
negative) in the heatmap represent stronger effect.
for microbial communities in rhizosphere soil, followed by fungal biomass (λ = − 0.704, P < 0.001) and OTU
richness (λ = 0.441, P = 0.008). The direct effects of TOC (λ = 0.057, P > 0.05), elevation (λ = − 0.066, P > 0.05),
and vegetation cover degree (λ = 0.060, P > 0.05) were relatively weak (Fig. 6B); these factors only influenced
microbial communities mainly through the indirect path. Elevation was the strongest indirect predictor (medi-
ated through pH, TOC, fungal biomass, and OTU richness), followed by pH (mediated through OTU richness
and fungal biomass), vegetation cover degree (mediated through fungal biomass, pH, and OTU richness), and
TOC (mediated through cover degree, fungal biomass, and OTU richness), whereas the effect of elevation,
pH, vegetation cover degree, and TOC on bacterial communities was through a combination of both direct
and indirect paths. Among them, soil TOC and the vegetation cover degree for fungal biomass had the largest
direct effect (λ = 0.504, P < 0.05) of all parameters. Soil pH had a positive direct effect on microbial community
structure, but a negative indirect one.
Discussion
Effects of vegetation on the microbial community. The interaction between plants and soil micro-
bial is one of the forefront topics of international ecological r esearch12,13. In our research, soil nutrients, fungal
biomass, and nutrient cycling gene abundance of different plant rhizosphere soils were significantly different at
similar altitudes. Host specificity to a species or group of related species is also well documented in plant-asso-
ciated fungi37,38. Some studies have shown strong impacts of vegetation on the abundance of C- and N-cycling
soil bacteria and archaea39. In addition, our result showed that N-fixing gene (nifH) and C-fixing gene (cbbl)
abundance were significant different. Aureum plant community lives with other species. Further said that the
variation of species have an impact on functional microbial abundance.
In-depth analysis showed that R. aureum Georgi rhizosphere soil had higher soil nutrient, fungal biomass,
and C- and N-fixing gene abundance at most elevations compared to other species, as well as higher nutrient
cycling rates. Plants and their microbiomes can be considered as “superorganisms”, partly due to their reliance
on soil microbiota for specific functions and t raits13,40. Plant species appear to be an important factor for soil N
transformation in the alpine tundra, and, consequently, may influence plant community structures and ecosystem
functions41,42. This might be one of the reasons why R. aureum was abundant at each altitude.
Scientific Reports | (2020) 10:12442 | https://doi.org/10.1038/s41598-020-69441-w 9
Vol.:(0123456789)www.nature.com/scientificreports/
The microbial community structure in different vegetation rhizosphere soils at similar elevations was different.
This is in agreement with the findings of previous studies that different vegetation types significantly affect the
microbial community structure and functional diversity in rhizosphere soil43,44. Moreover, NMDS ordination
revealed that mixing with herbaceous species resulted in higher dissimilarly than mixing with shrub species.
Different plant types have different effects on the s oil43,45, and soil microbial community structure over altitudinal
gradients is mainly governed by changes in vegetation cover type46.
Effects of elevation gradients on the microbial community. Elevation strongly affects rhizosphere
soil properties. The contents of TN, TOC, water content, C/N, urease decreased with the increase of elevation
which is consistent with the previous research results45. There was no significant correlation between fungal
biomass and elevation gradient. Similarly, previous studies have shown no significant difference in fungal bio-
mass at different a ltitudes38. Our study found that with the decrease of altitude, the fungal biomass related to the
same shrub root system increased. Margesin et al. also suggested that fungal biomass decreased with altitude. In
the high altitude area, the environment condition is harsh, and the fungi associate with roots of the host plants,
thereby increasing absorptive surface area and allowing enhanced uptake of essential nutrients and water47.
Similarly, soil fungal biomass has been reported to vary along elevation gradients48,49. Although different fungal
groups produce different levels of ergosterol (which may not exist in some fungal groups)50,51, few fungi (< 5% of
OTUs) are found lacking ergosterol, and all communities have similar order-level c omposition38, which allows
for comparison of biomass concentrations. Contrary to fungal biomass, C- and N-cycling gene abundances did
not vary along elevation gradients, but there were significant differences in different vegetation types. Shen et al.
suggest that soil microbial functional gene richness dramatically increases at the treeline ecotone from temperate
forest to alpine tundra in the Changbai Mountains52. Different vegetation types with different litter input which
can lead to difference in the composition of soil organic m atter53. Tian et al. using the Biolog method found that
labile organic carbon contribute to variation in functional microbial diversity54. This indicates that vegetation
types drive the spatial distribution of functional gene richness along elevation gradients in alpine tundra. To the
best of our knowledge, this finding has not been reported in a small-scale elevation gradient in alpine tundra
studies.
Taxonomic richness does not follow the classic decreasing or unimodal elevation diversity patterns, which
agrees with most studies finding non-significant elevation patterns52,55,56. Shen et al. observed that taxonomic
richness linearly decreased with increased elevation and phylogenetic diversity exhibited a unimodal pattern with
elevation57. This observation is not in agreement with our results, possibly because these authors were studying
the bulk soil, while we focused on rhizosphere soil influenced by plant roots and a zone of high microbial activity,
clearly distinct from bulk soil58. Here, we found similar bacterial communities at higher elevations (2,600, 2,500,
and 2,400 m), but dissimilarities at lower elevations. Based on the results of the RDA, the bacterial community
composition was significantly affected by altitude and three phyla (Bacteroidetes, Gemmatimonadetes, and
Nitrospirae). Abundance of Nitrospirae, belonging to the nitrite-oxidizers, was highest at 2,600 m. Nitrifying
bacteria appear significantly impacted by elevation and may be drivers of living at high altitude. Many research-
ers have found that bacterial or micro-eukaryotic composition varied with e levation55,5659,60. As a consequence,
elevation is a main factor contributing to the overall bacterial community, but different vegetation types also
interfere with the composition of the rhizosphere soil microbial community structure.
Effects of soil properties on the microbial community. There is accumulated evidence that soil phys-
ical and chemical properties are usually the best predictors of variations in microbial d iversity42,61,62. Fungal
biomass was significantly correlated with soil TOC, TN, MBC, and PH. José et al. stated that fungal abundance at
higher altitudes was significantly and positively related to the high amounts of C (TOC and humus), EC, N, and
mineral nutrients in subalpine and alpine e nvironments63. The higher C, N, and P levels with increasing altitudes
may contribute to enhanced microbial g rowth63. As previously observed, the bacterial diversity/structure and
function was strongly influenced by soil properties34,52,64,65. In our research, correlation analyses demonstrated
that C- and N-cycling gene (except ammonia-oxidizing archaea) abundance is associated with pH, some of
them also correlated with soil moisture, TOC, C/N, and acid phosphatase. Previous studies have suggested that
N-cycling is usually associated with NH4+ or NO3−, but we did not observe this in our study. This result was to
be expected, since gene presence is not necessarily related to gene a ctivity66. Similar studies have reported that
N-cycling functional genes were contingent on local site characteristics such as soil nutrients, soil temperatures,
and site latitude66–68.
Similar to N-cycling genes, soil pH also has a stronger influence on soil microbial community structure than
some other parameters. This agrees with other studies which found that the dominant bacterial taxonomic diver-
sity/structure was strongly influenced by soil p H62,69. Here, pH was significantly correlated with OTU richness,
fungal biomass, and other soil properties, especially soil TOC, which strongly influenced microbial community.
In summary, our study reveals complex impacts of the microenvironment by various elevation, species cover
degree, and soil properties and their interactive effects, using the SEM. Rhizosphere soil microbial community
composition was most strongly influenced by fungal biomass, followed by elevation. Elevation, species cover
degree, and soil TOC had little direct effect on the microbial composition, while TOC and species cover degree
were most strongly affected by fungal biomass. Elevation also had a strong effect on fungal biomass. Previous
studies have demonstrated no significant variation in fungal biomass between elevation zones; instead, ergosterol
varied according to host species t ype70 and fungal richness was primarily affected by host species identity71.
Moreover, fungal richness was governed by host-associated factors such as soil nutrients38 49. Our results indicate
that the soil TOC, species cover degree, and elevation indirectly and significantly impact the microbial com-
munity structure. Regarding the effect of pH, it had the strongest impact on the microbial community, acting
Scientific Reports | (2020) 10:12442 | https://doi.org/10.1038/s41598-020-69441-w 10
Vol:.(1234567890)www.nature.com/scientificreports/
significantly, albeit indirectly. This is in agreement with previous studies in which soil pH did not alter the
microbial community itself, but directly or indirectly interacted with other soil p arameters36,63.
Soil properties (TOC and pH) have the greatest impact on the abundance of OTU, which directly affects
the microbial community structure. Overall, soil variables often indirectly affect microbial diversity/commu-
nity. Although rhizosphere soil fungi have a strong and direct impact on microbial community structure, the
impact is controlled by host species and soil properties. The overall effect of plant species coverage on microbial
diversity/community was significant, indicating that plant species can shape rhizosphere microenvironment. In
addition to microbial factors, altitude, vegetation and soil properties affect each other. The altitude and species
coverage have the greatest influence on soil pH. Root exudates mainly include mucilage, ecotoenzymes, organic
substances, sugars, and various kinds of amino acids. They can significantly improve soil structure, cause soil
mineral weathering, increase soil cation exchange capacity, and affect soil pH value, soil surface adsorption
characteristics and soil biological characteristics72. Therefore, different plant communities have different effects
on pH value of rhizosphere s oil73.
Although vegetation has a strong impact on microbial community structure, altitude as an abiotic factor has
the greatest impact on microbial community structure. This is contrary to our initial hypothesis that species
may be the most important factor affecting the microbial community structure of rhizosphere soil. The altitude
pattern of plant species in Changbai Mountain has been reported previously33. With the increase of altitude, the
environment becomes harsher and harsher, which, among other things, results in nutritional stress, which leads
to great changes in plant community structure74. As pH value, soil nutrients and vegetation are widely considered
as the main driving factors of soil bacteria. The results showed that the elevation was the main factor affecting
the microorganism, and the distribution of plant species, soil organic carbon and pH value was driven indirectly.
Conclusion
Our results revealed the relationship between vegetation types, elevation, soil properties and soil microbial
communities on Changbai Mountain, and found that elevation was the main controlling factor. To the best of
our knowledge, this is the first study to reveal that elevation is the main predictor of rhizosphere microbial com-
munity structure rather than vegetation in the alpine tundra. It should provide a basis for understanding and
predicting species succession and stability of alpine tundra ecosystem.
Material and methods
Study area. We performed our sampling in the Changbai Mountains National Nature Reserve (41° 41′ 49″–
42° 25′ 18″ N, 127° 42′ 55″–128° 16′ 48″ E). Precisely, the study area is on the north slope of the alpine tundra
(42° 01′–42° 05′ N, 128° 03′–128° 07′ E) at an elevation between 2,000 and 2,600 m. Such area is characterized
by short growing season (June–September), low temperature (3 °C–7 °C in the growing season) and heavy
precipitation (exceeds 1,400 mm annually)75. Common plants are dominated by shrubs such as D. octopetala L.
var. asiatica, Rhododendron aureum Georgi, Vaccinium uliginosum Linn, and tussocks such as Trollius chinensis,
Sanguisorba tenuifolia var. alba, Rhodiola cretinii (Hamet) H. Ohba subsp. sino-alpina (Frod.) H. Ohba, Ligularia
jamesii (Hemsl.) Kom, etc76,77. The soil is mountain tundra soil, the development of which is very low. The soil
layer is thin, and not connected into pieces. Soil profile: 1–5 cm is peat layer, 5–10 cm is peat gravel layer, and
10–30 cm is volcanic rock layer.
Experimental design. The experimental design was set up two research groups. The first group was used
to analyze the effects of altitude and vegetation types on soil microbial community. We set 7 altitudes and at each
altitude we selected 3 dominant species communities as research object. So we selected 21 sample locations in all.
The coverage of each dominant species in the community was higher than 85%. We selected R. aureum Georgi
communities at each altitude, because it is the only woody plant with a distribution at each elevation. The other
two dominant species plant communities are different at the seven elevations. Detailed distributions can be seen
in Supplementary Table S7.
The second research group was used to analyze the direct or indirect effects of altitude, species coverage, and
soil physicochemical characteristics on soil microbial community. We set three treatments: The independent
community of R. aureum Georgi (Da), R. aureum Georgi lives with other shrub (Da + S) and R. aureum Georgi
lives with herbaceous (Da + H). Da + S sites had less than 5% coverage of herbaceous plants, and Da + H sites
less than 5% coverage of other shrub. In the three treatments, R. aureum Georgi had different cover degree from
40 to 95%, the detailed see Supplementary Table S8. We selected 8 locations of Da + S, 4 locations of Da + H,
and the sits of Da in the first and second group are the same locations. Detailed distributions can also be seen in
Supplementary Table S8. Therefore, the total sample location number of this research is 33.
Soil sampling. Soil samples were collected in July of 2014. We randomly selected three 1 × 1 m plots in each
location and extracted approximately 500 g soil. As a result, the study included 99 plots. In each plot, we removed
the litter layer of the soil and collected plant affected soil samples with five replicates (5 cm diameter × 10 cm
deep). As most the plants in the sampling areas grew at relatively high densities (especially for Rhododendron
aureum Georgi, Sanguisorba tenuifolia var, Ligularia jamesii), the collected soil was originally only a few millim-
eters away from the root axis surface, hence they seem to have great impacts on the surrounding soil. Therefore,
the collected soil samples were defined as “rhizosphere soil samples”78. Except for the 16rDNA sequencing of
microbial communities, all the results in this paper are based on the analysis of those 99 plots. By mixing all
samples collected from the same location, we sequenced 33 composite soil samples. The collected samples were
refrigerated at 4 °C immediately and have been transported to the laboratory within 4 h. They were further
Scientific Reports | (2020) 10:12442 | https://doi.org/10.1038/s41598-020-69441-w 11
Vol.:(0123456789)www.nature.com/scientificreports/
sieved by 2 mm mesh sieve and have been assigned into two groups. Half of the samples were stored at 4 °C for
chemical analysis and the other half at − 80 °C for microbial community analyses.
Analysis of soil characteristics and fungal biomass. Soil moisture was measured by the gravimetri-
cal mass loss after drying samples to a constant weight (105 °C for at least 12 h). We measured pH by using a
pH meter on a 1:10 (w/v) ratio in distilled water. Soil organic matter was determined by dichromate oxidation
with external heat and titration with ferrous ammonium sulphate79. TN was determined by semimicro-Kjel-
dahl (KDY-9820) d igestion80. Soil total phosphorus (TP) was determined colorimetrically using the molybdate
method81. MBC and microbial biomass nitrogen (MBN) were determined using the chloroform fumigation
extraction method82. Soil nitrate nitrogen and ammonium nitrogen were analyzed using a flow-injection auto-
analyzer (SKALAR SAN+ +, Netherlands). Phosphatase activity was measured using the modified method of
Schinner and von M ersi83. Soil catalase activity was measured using the 0.1 N K ethod84. Urease
MnO4 titration m
activity was determined according to Klose and Tabatabai85. Invertase activity was assayed using the 3,5-dinitro-
salicylic acid technique86.
Fungal biomass was determined by HPLC analyzing ergosterol content in the soil87. Briefly, ergosterol was
extracted by KOH, methanol, and ethanol from 3 g of fresh soil (70 °C water bath for 30 min). After n-hexane
extraction, concentration, and solvent replacement, ergosterol content was quantified by HPLC (AGILENT 1,200,
USA; reverse C18 column; mobile phase, 95% methanol; flow rate, 1 min/ml; detection wavelength, 282 nm).
Real‑time PCR. In order to eliminate the internal variability within each site, we performed 10 replications
in the mixed soil samples. Each DNA sample was extracted using 0.3 g freeze-dried soil with the Power Soil DNA
Isolation Kit (MOBIO), according to the manufacturer’s protocol. Due to the qPCR is extremely sensitive and
vulnerable to interference by humic material. Extracted DNA was purified using the GV-High-Efficiency Aga-
rose Gel DNA Purification Kit (BEI JING DINGGUO CHANGSHENG BIOTECHNOLOGY CO.LTD., China),
DNA concentrations were determined using the Qubit quantification platform with QUANI-IT ESDNA BR
Assay Kit (INVITROGEN). DNA was diluted to 10 ng/μl and stored at − 80 °C prior to molecular analysis.
The abundances of genes (cbbl, nifH, archaeal amoA, bacterial amoA, nosZ) encoding the key enzymes for bio-
logical C- and N-cycling were quantified by real-time PCR (IBA7500) for all soil samples. The primers N-cycling
functional genes were reference by Mao et al. and Levy-Booth et al.34,88, and C-cycling functional genes were
reference by Yuan et al.89 (details see Supplementary Table S9). Standards for the qPCR assays were generated
by PCR products from a common DNA mixture (equal amounts of DNA from all samples)90. PCR product was
diluted to 100 ng/μl and set five concentration gradients in 10 times diluted. For each sample-derived standard,
copy number concentration was calculated based on the length of the PCR product and the mass concentration
(measured by Qubit). The 20 μl reaction mixture contained 0.2 μl of each primer (20 μM), 10 μl of 2 × Trans Start
Green qPCR Super Mix (TRANSGEN BIOTECH, China), 0.4 μl Passive Reference Dye (50 ×), 0.3 μl of BSA
(10 mg/ml), and 10 ng of DNA template.
Bioinformatics analysis. The 16SrDNA high-throughput sequencing was performed by the REALBIO
Genomics Institute (Shanghai, China) using the ILLUMINA MiSeq platform. The 16S V3–V4 region was ampli-
fied using the primers U341F (ACT CCT ACG GGA GGC AGC AG) and U806R (GGA CTA CHV GGG TWT
CTA AT). The raw data were then subjected to a quality control procedure using U PARSE91. The qualified reads
92
were clustered to generate OTUs at the 97% similarity level using USEARCH . A representative sequence for
each OTU was assigned to a taxonomic level in the RDP database by the RDP c lassifier93.
A total of 1.8 million high-quality 16S rRNA gene sequence reads were obtained from 33 samples. There were
a total of 29,607 distinct OTUs (operational taxonomic units) across samples, with a total of 87,156 unique reads
that were assigned to these OTUs. In QIIME, sequences were subsampled to an even depth of 20,067 reads prior
to estimating relative taxon abundances and running diversity analyses. Alpha diversity was measured using
Chao1, observed species, Shannon, Simpson, goods coverage, and PD whole tree.
Statistical analysis. All analyses were performed in the corrplot package in R
94. For soil parameters, one-
way analysis of variance (ANOVA) was used to determine differences among elevation treatments and different
vegetation treatments. Two-way analysis of variance (ANOVA) was used to the determine differences among
elevation × vegetation treatments. The correlations between the abundance of N-cycling functional genes, diver-
sity metrics, and OTU richness and fungal biomass were correlated with soil characteristics using Pearson cor-
relations. Statistical significance was set at P < 0.05.
NMDS was performed via the vegan package of R v.3.1.1 project95 (Weighted Unifrac scores). We also used
analysis of similarities (ANOSIM, 999 permutations) to evaluate the null hypothesis. Heatmaps and clustering
tree were constructed using ggplot2 package in R. RDA was performed to determine the environmental factors
that significantly correlated with community composition (abundance of OTUs), via the function envfit (999
permutations) in the vegan package of R v.3.1.1 project96,97. SEM was constructed via AMOS 17.098 and the ‘vegan’
package in R. Only abiotic factors variables that were both significant correlated (P < 0.05) with OTU richness,
fungal biomass, elevation and vegetation coverage were included in the model construction, namely soil TOC
and pH. We tested the fitness of the model with the data using the maximum likelihood (λ2) goodness-of-fit test,
Jöreskog’s GFI, the Bollen–Stine bootstrap test and RMSEA.
Scientific Reports | (2020) 10:12442 | https://doi.org/10.1038/s41598-020-69441-w 12
Vol:.(1234567890)www.nature.com/scientificreports/
Received: 22 October 2019; Accepted: 7 July 2020
References
1. Ruan, H., Zou, X., Scatena, F. & Zimmerman, J. Asynchronous fluctuation of soil microbial biomass and plant litterfall in a tropical
wet forest. Plant Soil 260, 147–154 (2004).
2. Ibekwe, A. M. et al. Impact of fumigants on soil microbial communities. Appl. Environ. Microbiol. 67, 3245–3257 (2001).
3. Reiss, J., Bridle, J. R., Montoya, J. M. & Woodward, G. Emerging horizons in biodiversity and ecosystem functioning research.
Trends Ecol. Evol. 24, 505–514 (2009).
4. Fuhrman, J. A. & Fuhrman, J. A. Microbial community structure and its functional implications. Nature 459, 193–199 (2009).
5. Lanzen, A. et al. Multi-targeted metagenetic analysis of the influence of climate and environmental parameters on soil microbial
communities along an elevational gradient. Sci. Rep. 6, 28257. https://doi.org/10.1038/srep28257 (2016).
6. Berendsen, R. L., Pieterse, C. M. J. & Bakker, P. A. H. M. The rhizosphere microbiome and plant health. Trends Plant Sci. 17,
478–486 (2012).
7. Oh, Y. M. et al. Distinctive bacterial communities in the rhizoplane of four tropical tree species. Microb. Ecol. 64, 1018–1027 (2012).
8. Walker, T. S., Bais, H. P., Grotewold, E. & Vivanco, J. M. Root exudation and rhizosphere biology. Plant Physiol. 132, 44–51 (2003).
9. Herre, E. A. Negative plant-soil feedback predicts tree-species relative abundance in a tropical forest. Nature 466, 752–755 (2010).
10. Philippot, L., Raaijmakers, J. M., Lemanceau, P. & Wh, V. D. P. Going back to the roots: The microbial ecology of the rhizosphere.
Nat. Rev. Microbiol. 11, 789–799 (2013).
11. Hackl, E., Pfeffer, M., Donat, C., Bachmann, G. & Zechmeister-Boltenstern, S. Composition of the microbial communities in the
mineral soil under different types of natural forest. Soil Biol. Biochem. 37, 661–671 (2005).
12. Park, S. et al. Principal component analysis and discriminant analysis (PCA–DA) for discriminating profiles of terminal restriction
fragment length polymorphism (T-RFLP) in soil bacterial communities. Soil Biol. Biochem. 38, 2344–2349 (2006).
13. Mendes, R. et al. Deciphering the rhizosphere microbiome for disease-suppressive bacteria. Science 332, 1097–1100 (2011).
14. Klimeš, L. Alpine plant life. Functional plant ecology of high mountain ecosystems by C. Körner. Folia Geobot. 41, 454–455 (2006).
15. Diaz, H. F., Grosjean, M. & Graumlich, L. Climate variability and change in high elevation regions: Past, present and future. Clim.
Change 59, 1–4 (2003).
16. Schinner, F. & Gstraunthaler, G. Adaptation of microbial activities to the environmental conditions in alpine soils. Oecologia 50,
113–116 (1981).
17. Cui, H.-J. et al. Soil microbial community composition and its driving factors in alpine grasslands along a mountain elevational
gradient. J. Mt. Sci. 13, 1013–1023. https://doi.org/10.1007/s11629-015-3614-7 (2016).
18. Zhang, B., Liang, C., He, H. & Zhang, X. Variations in soil microbial communities and residues along an altitude gradient on the
northern slope of changbai mountain, china. PLoS ONE 8, e66184 (2013).
19. Collins, C. G., Carey, C. J., Aronson, E. L., Kopp, C. W. & Diez, J. M. Direct and indirect effects of native range expansion on soil
microbial community structure and function. J. Ecol. 104, 1271–1283 (2016).
20. Margesin, R., Jud, M., Tscherko, D. & Schinner, F. Microbial communities and activities in alpine and subalpine soils. FEMS
Microbiol. Ecol. 67, 208–218 (2009).
21. Fierer, N. & Mcculley, R. L. Reconstructing the microbial diversity and function of pre-agricultural tallgrass prairie soils in the
United States. Science 342, 621–624 (2013).
22. Shi, Y. et al. Multi-scale variability analysis reveals the importance of spatial distance in shaping Arctic soil microbial functional
communities. Soil Biol. Biochem. 86, 126–134 (2015).
23. Yang, Y. et al. The microbial gene diversity along an elevation gradient of the Tibetan grassland. Isme J. Multidiscipl. J. Microb. Ecol.
8, 430–440 (2013).
24. Ding, J. et al. Integrated metagenomics and network analysis of soil microbial community of the forest timberline. Sci. Rep. 5, 7994
(2015).
25. Liu, J. et al. High throughput sequencing analysis of biogeographical distribution of bacterial communities in the black soils of
northeast China. Soil Biol. Biochem. 70, 113–122 (2014).
26. Brockett, B. F. T., Prescott, C. E. & Grayston, S. J. Soil moisture is the major factor influencing microbial community structure and
enzyme activities across seven biogeoclimatic zones in western Canada. Soil Biol. Biochem. 44, 9–20 (2012).
27. Uroz, S., Tech, J. J., Sawaya, N. A., Frey-Klett, P. & Leveau, J. H. J. Structure and function of bacterial communities in ageing soils:
Insights from the Mendocino ecological staircase. Soil Biol. Biochem. 69, 265–274 (2014).
28. Shi, Y. et al. Vegetation-associated impacts on arctic tundra bacterial and microeukaryotic communities. Appl. Environ. Microbiol.
81, 492–501 (2014).
29. Zeglin, L. H. & Myrold, D. D. Fate of decomposed fungal cell wall material in organic horizons of old-growth douglas-fir forest
soils. Soil Sci. Soc. Am. J. 77, 489–500 (2013).
30. Wallander, H., Göransson, H. & Rosengren, U. Production, standing biomass and natural abundance of 15N and 13C in ectomy-
corrhizal mycelia collected at different soil depths in two forest types. Oecologia 139, 89–97 (2004).
31. Colpaert, J. V., Laere, A. V. & Assche, J. A. V. Carbon and nitrogen allocation in ectomycorrhizal and non-mycorrhizal Pinus
sylvestris L. seedlings. Tree Physiol. 16, 787–793 (1996).
32. Zhang, M. et al. Distribution of soil organic carbon fractions along the altitudinal gradient in Changbai mountain, China. Pedo-
sphere 21, 615–620 (2011).
33. Wenduo, X. U., Xingyuan, H. E., Chen, W. & Liu, C. Characteristics and succession rules of vegetation types in Changbai mountain.
Chin. J. Ecol. 23, 162–174 (2004).
34. Mao, Y., Yannarell, A. C., Davis, S. C. & Mackie, R. I. Impact of different bioenergy crops on N-cycling bacterial and archaeal
communities in soil. Environ. Microbiol. 15, 928–942 (2012).
35. Grayston, S. J. et al. Assessing shifts in microbial community structure across a range of grasslands of differing management
intensity using CLPP, PLFA and community DNA techniques. Appl. Soil. Ecol. 25, 63–84 (2004).
36. Lauber, C. L., Hamady, M., Knight, R. & Fierer, N. Pyrosequencing-based assessment of soil pH as a predictor of soil bacterial
community structure at the continental scale. Appl. Environ. Microbiol. 75, 5111–5120 (2009).
37. Tedersoo, L. et al. Towards global patterns in the diversity and community structure of ectomycorrhizal fungi. Mol. Ecol. 21,
4160–4170 (2012).
38. Davey, M. L., Heegaard, E., Halvorsen, R., Kauserud, H. & Ohlson, M. Amplicon-pyrosequencing-based detection of compositional
shifts in bryophyte-associated fungal communities along an elevation gradient. Mol. Ecol. 22, 368–383 (2013).
39. Mao, Y., Yannarell, A. C. & Mackie, R. I. Changes in N-transforming archaea and bacteria in soil during the establishment of
bioenergy crops. PLoS ONE 6, e24750 (2011).
40. Heijden, M. G. A. V. D., Bardgett, R. D. & Straalen, N. M. V. The unseen majority: Soil microbes as drivers of plant diversity and
productivity in terrestrial ecosystems. Ecol. Lett. 11, 296–310 (2008).
41. Steltzer, H. & Bowman, W. D. Original articles: Differential influence of plant species on soil nitrogen transformations within moist
meadow alpine Tundra. Ecosystems 1, 464–474 (1998).
Scientific Reports | (2020) 10:12442 | https://doi.org/10.1038/s41598-020-69441-w 13
Vol.:(0123456789)www.nature.com/scientificreports/
42. Shen, C., Ni, Y., Liang, W., Wang, J. & Chu, H. Distinct soil bacterial communities along a small-scale elevational gradient in alpine
tundra. Front. Microbiol. 6, 538–541 (2014).
43. Zhang, C., Liu, G. B., Xue, S. & Xiao, L. Effect of different vegetation types on the rhizosphere soil microbial community structure
in the loess plateau of China. J. Integr. Agric. 12, 2103–2113 (2013).
44. Weand, M. P., Arthur, M. A., Lovett, G. M., Mcculley, R. L. & Weathers, K. C. Effects of tree species and N additions on forest floor
microbial communities and extracellular enzyme activities. Soil Biol. Biochem. 42, 2161–2173 (2010).
45. Wu, Z. et al. Terminal restriction fragment length polymorphism analysis of soil bacterial communities under different vegetation
types in subtropical area. PLoS ONE https://doi.org/10.1371/journal.pone.0129397 (2015).
46. Singh, D. et al. Strong elevational trends in soil bacterial community composition on Mt. Halla, South Korea. Soil Biol. Biochem.
68, 140–149 (2014).
47. Fallen, M. Linking water and nutrients through the vadose zone: A fungal interface between the soil and plant systems. J. Arid
Land 206, 155–163 (2011).
48. Grayston, S. J., Griffith, G. S., Mawdsley, J. L., Campbell, C. D. & Bardgett, R. D. Accounting for variability in soil microbial com-
munities of temperate upland grassland ecosystems. Soil Biol. Biochem. 33, 533–551 (2001).
49. Studies, R. Forest floor properties across sharp compositional boundaries separating trembling aspen and jack pine stands in the
southern boreal forest. Plant Soil 345, 353–364 (2011).
50. Ruzicka, S., Edgerton, D., Norman, M. & Hill, T. The utility of ergosterol as a bioindicator of fungi in temperate soils. Soil Biol.
Biochem. 32, 989–1005 (2000).
51. Weete, J. D., Abril, M. & Blackwell, M. Phylogenetic distribution of fungal sterols. PLoS ONE 5, e10899 (2010).
52. Shen, C. et al. Dramatic increases of soil microbial functional gene diversity at the treeline ecotone of Changbai mountain. Front.
Microbiol. https://doi.org/10.3389/fmicb.2016.01184 (2016).
53. Quideau, S. A., Chadwick, O. A., Benesi, A., Graham, R. C. & Anderson, M. A. A direct link between forest vegetation type and
soil organic matter composition. Geoderma 104, 41–60 (2001).
54. Tian, J. et al. Linkages between the soil organic matter fractions and the microbial metabolic functional diversity within a broad-
leaved Korean pine forest. Eur. J. Soil Biol. 66, 57–64 (2015).
55. Yuan, Y., Si, G., Jian, W., Luo, T. & Zhang, G. Bacterial community in alpine grasslands along an altitudinal gradient on the Tibetan
plateau. FEMS Microbiol. Ecol. 87, 121–132 (2013).
56. Fierer, N. et al. Microbes do not follow the elevational diversity patterns of plants and animals. Ecology 92, 797–804 (2011).
57. Shen, C., Ni, Y., Liang, W., Wang, J. & Chu, H. Distinct soil bacterial communities along a small-scale elevational gradient in alpine
tundra. Front. Microbiol. 6, 582. https://doi.org/10.3389/fmicb.2015.00582 (2015).
58. Hinsinger, P., Bengough, A. G., Vetterlein, D. & Young, I. M. Rhizosphere: Biophysics, biogeochemistry and ecological relevance.
Plant Soil 321, 117–152 (2009).
59. Shen, C. et al. Contrasting elevational diversity patterns between eukaryotic soil microbes and plants. Ecology 95, 3190–3202
(2014).
60. Jarvis, S. G., Woodward, S. & Taylor, A. F. S. Strong altitudinal partitioning in the distributions of ectomycorrhizal fungi along a
short (300 m) elevation gradient. New Phytol. 206, 1145–1155 (2015).
61. Lanzén, A. et al. Multi-targeted metagenetic analysis of the influence of climate and environmental parameters on soil microbial
communities along an elevational gradient. Sci. Rep. 6, 28257 (2016).
62. Shen, C. et al. Soil pH drives the spatial distribution of bacterial communities along elevation on Changbai mountain. Soil Biol.
Biochem. 57, 204–211 (2013).
63. Siles, J. A. & Margesin, R. Abundance and diversity of bacterial, archaeal, and fungal communities along an altitudinal gradient
in alpine forest soils: What are the driving factors?. Microb. Ecol. 72, 207–220 (2016).
64. Sagovamareckova, M., Cermak, L., Omelka, M., Kyselkova, M. & Kopecky, J. Bacterial diversity and abundance of a creek valleysites
reflected soil pH and season. Open Life Sci. https://doi.org/10.1515/biol-2015-0007 (2015).
65. Smith, J. L., Halvorson, J. J. & Bolton, H. Soil properties and microbial activity across a 500m elevation gradient in a semi-arid
environment. Soil Biol. Biochem. 34, 1749–1757 (2002).
66. Yergeau, E., Kang, S., He, Z., Zhou, J. & Kowalchuk, G. A. Functional microarray analysis of nitrogen and carbon cycling genes
across an Antarctic latitudinal transect. ISME J. 1, 163–179 (2007).
67. Kai, X. et al. Warming alters expressions of microbial functional genes important to ecosystem functioning. Front. Microbiol. 7,
668 (2016).
68. Jing, C. et al. Available nitrogen is the key factor influencing soil microbial functional gene diversity in tropical rainforest. BMC
Microbiol. 15, 397–398 (2015).
69. Griffiths, R. I. et al. The bacterial biogeography of British soils. Environ. Microbiol. 13, 1642–1654 (2011).
70. Davey, M. L., Nybakken, L., Kauserud, H. & Ohlson, M. Fungal biomass associated with the phyllosphere of bryophytes and
vascular plants. Mycol. Res. 113, 1254–1260 (2009).
71. Meier, C. L., Rapp, J., Bowers, R. M., Silman, M. & Fierer, N. Fungal growth on a common wood substrate across a tropical elevation
gradient: Temperature sensitivity, community composition, and potential for above-ground decomposition. Soil Biol. Biochem.
42, 1083–1090 (2010).
72. Tu, S., Sun, J., Guo, Z. & Gu, F. On relationship between root exudates and plant nutrition in rhizosphere. Soil Environ. 9, 64–67
(2000).
73. Zhang, C., Liu, G., Xue, S. & Song, Z. Rhizosphere soil microbial activity under different vegetation types on the Loess Plateau,
China. Geoderma 161, 115–125 (2011).
74. Zeng, S., Zhiyao, S. U., Chen, B. & Yuanchun, Y. U. A review on the rhizosphere nutrition ecology research. J. Nanjing For. Univ.
27, 79 (2003).
75. Wei, Z., Xiaojuan, Q. I., Jianwei, L., Zhengxiang, Y. U. & Xia, C. Characterization of microbial community structure in rhizosphere
soils of cowskin Azalea (Rhododendron aureum Georgi) on northern slope of Changbai mountains, China. Chin. Geogr. Sci. 26,
78–89 (2016).
76. Yang, X. & Wu, G. The strategy for conservation and sustainable utilization of biodiversity in Changbaishan biosphere reserve. J.
For. Res. 9, 217–222 (1998).
77. Zong, S. et al. Analysis of the process and impacts of Deyeuxia angustifolia invasion on the Alpine Tundra, Changbai mountain.
Acta Ecol. Sin. 34, 87–104 (2014).
78. Batten, K. M., Scow, K. M., Davies, K. F. & Harrison, S. P. Two invasive plants alter soil microbial community composition in
serpentine grasslands. Biol. Invas. 8, 217–230 (2006).
79. Mebius, L. J. A rapid method for the determination of organic carbon in soil. Anal. Chim. Acta 22, 120–124 (1960).
80. Industry, D. I. Design in industry. Electr. Power 28, 228–228 (1982).
81. Murphy, J. & Riley, J. P. A modified single solution method for the determination of phosphate in natural waters. Anal. Chim. Acta
27, 31–36 (1962).
82. Brookes, P. C., Landman, A., Pruden, G. & Jenkinson, D. S. Chloroform fumigation and the release of soil nitrogen: A rapid direct
extraction method to measure microbial biomass nitrogen in soil. Soil Biol. Biochem. 17, 837–842 (1985).
83. Schinner, F. & Mersi, W. V. Xylanase-, CM-cellulase- and invertase activity in soil: An improved method. Soil Biol. Biochem. 22,
511–515 (1990).
Scientific Reports | (2020) 10:12442 | https://doi.org/10.1038/s41598-020-69441-w 14
Vol:.(1234567890)You can also read