Waikato Prioritisation Framework and its use for soil conservation - development and methods - Waikato Regional Council Technical Report 2021/06
←
→
Page content transcription
If your browser does not render page correctly, please read the page content below
Waikato Regional Council Technical Report 2021/06

Waikato Prioritisation Framework
and its use for soil conservation –
development and methods

www.waikatoregion.govt.nz
ISSN 2230-4355 (Print)
ISSN 2230-4363 (Online)
Prepared by:
Matt Norris and Dan Borman (Waikato Regional Council)
Dr Reece Hill (Landsystems)

For:
Waikato Regional Council
Private Bag 3038
Waikato Mail Centre
HAMILTON 3240

September 2021

Document #: 20216175
Peer reviewed by:
 Peter Singleton                                        Date         May 2021

 Approved for release by:
 Mike Scarsbrook                                        Date         September 2021

Disclaimer
This technical report has been prepared for the use of Waikato Regional Council as a reference document
and as such does not constitute Council’s policy.

Council requests that if excerpts or inferences are drawn from this document for further use by individuals
or organisations, due care should be taken to ensure that the appropriate context has been preserved,
and is accurately reflected and referenced in any subsequent spoken or written communication.

While Waikato Regional Council has exercised all reasonable skill and care in controlling the contents of
this report, Council accepts no liability in contract, tort or otherwise, for any loss, damage, injury or
expense (whether direct, indirect or consequential) arising out of the provision of this information or its
use by you or any other party.

Doc # 20216175
Doc # 20216175
Acknowledgement
The authors would like to acknowledge the considerable input of the ICM staff over many years,
in developing and applying the Waikato Prioritisation Framework. Keri Nielson and Tane
Desmond are thanked for their key roles in its development and use. Thank you to Matt Norris
for managing the production of the report, organising meetings with WRC staff, access to
documents, and for providing useful feedback on the draft report. Dr Peter Singleton (Natural
Knowledge) is thanked for is thoughtful and constructive review of the draft report along with
Haydon Jones (WRC) who provided feedback on the final draft version

Doc # 20216175                                                                           Page i
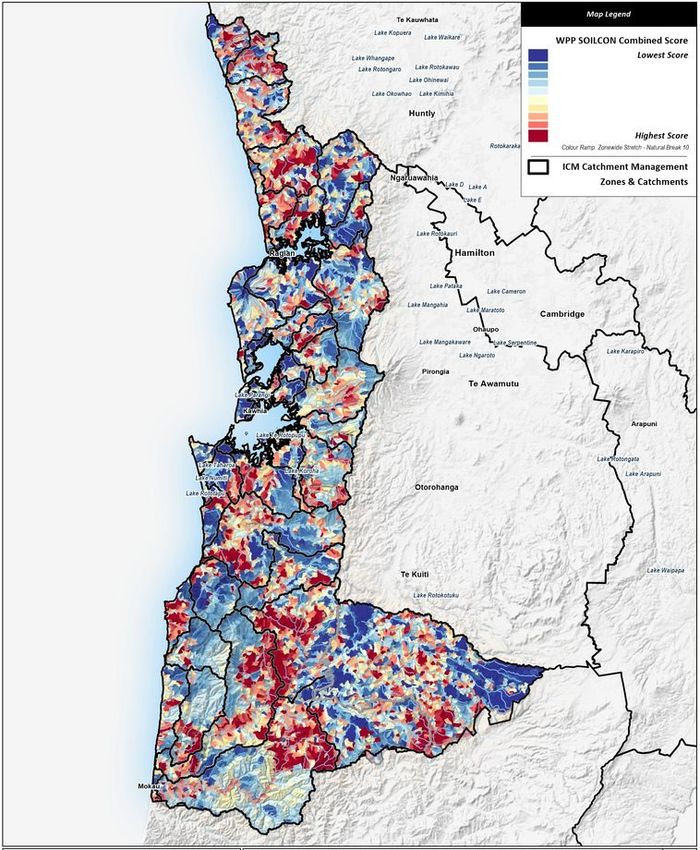
Table of Contents

Abbreviations                                                   iv
Executive summary                                               vi
1         Introduction                                          1
2         Waikato Prioritisation Framework                      2
    2.1      Introduction                                        2
    2.2      Objectives                                          2
    2.3      Framework overview                                  2
    2.4      WPF development phases                              2
    2.5      Key issues                                          3
    2.6      Scoring and ranking                                 4
    2.7      Spatial scales                                      4
    2.8      Applications                                        5
    2.9      Validation and assessment of value                  6
    2.9.1 Validation and peer review                             6
    2.9.2 Assessment of value                                    6
3         WPF for soil conservation                             8
    3.1      Background                                          8
    3.2      Purpose                                             8
4         Methods                                               9
    4.1      Framework base                                      9
    4.1.1 Hydrological framework                                9
    4.1.2 Land use layer                                       10
    4.2   Datasets and metrics                                 11
    4.3      Factors                                           13
    4.3.1 Calculating factor scores                            14
    4.3.2 Ranking scores                                       15
5         Decision support outputs                             16
    5.1      Introduction                                      16
    5.2      Individual factor score maps                      17
    5.3      Key issue outputs                                 18
    5.4      Outputs at different spatial scales               19
    5.5      Mitigation cost and reduction data tables         19
6         Application of the soil conservation sub-model       21
    6.1      Soil conservation key issue factors               21
    6.2      Mitigations, costs, and reductions                21
    6.2.1    Introduction                                      21
    6.2.2    Mitigation criteria                               22
    6.2.3    Mitigation suite                                  22
    6.2.4    Spatial placement of mitigations                  23
    6.2.5    Calculating mitigation costs                      23
    6.2.6    Estimating mitigation reductions                  23
    6.2.7    Current WPF mitigation reductions                 24
    6.2.8    Mitigation limitations and sensitivity            25
7         Worked example (West Coast)                          26
    7.1      Introduction                                      26
    7.2      Factors and key issues                            26

Page ii                                                    Doc # 20216175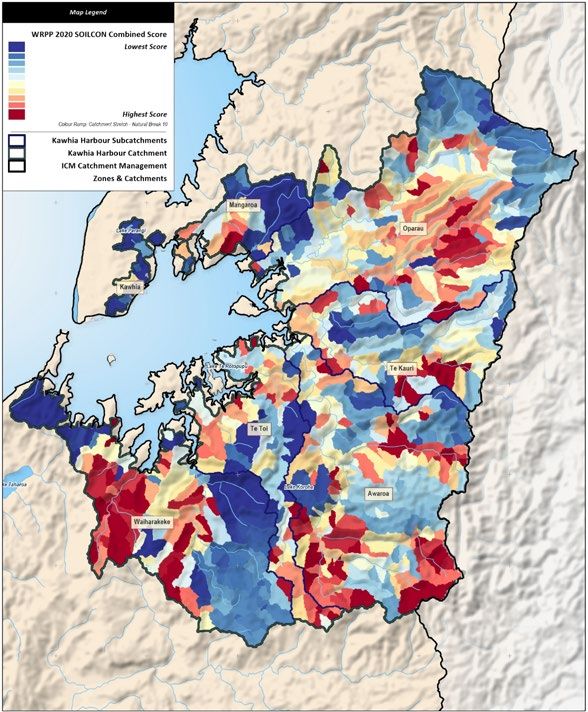
7.3 Datasets and metrics 26
7.4 Mitigation criteria for the West Coast 28
7.5 Outputs 29
7.5.1 Introduction 29
7.5.2 Soil conservation and ranked factor score outputs 29
7.5.3 Mitigation estimates 32
7.5.4 Mitigation cost estimates 34
7.5.5 Mitigation reductions in water contamination 37
7.5.6 Summarised outputs 37
8 Conclusions 39
9 Future developments 40
10 References 41
Figures
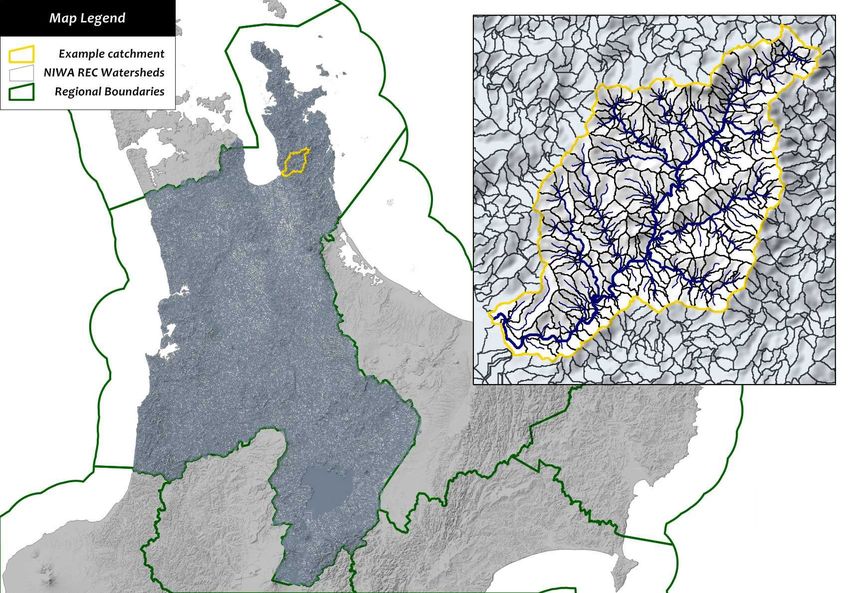
Figure 1. NIWA River Environment Classification reach-watersheds for the Waikato region (NIWA,
2021). 10
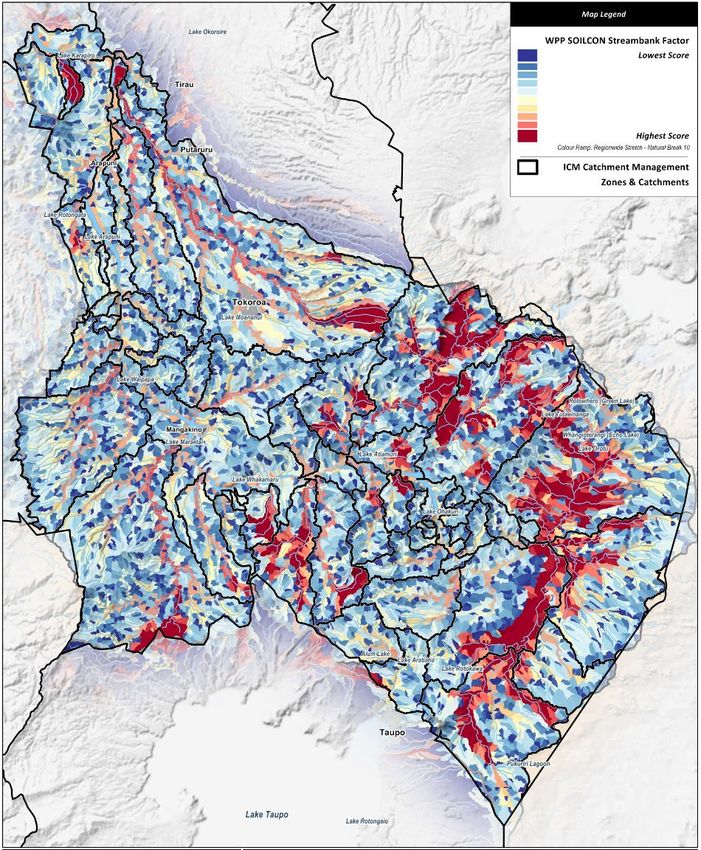
Figure 2. Streambank erosion factor score map for the Upper Waikato management zone. The
higher the score the greater the risk and the redder the colour. 17
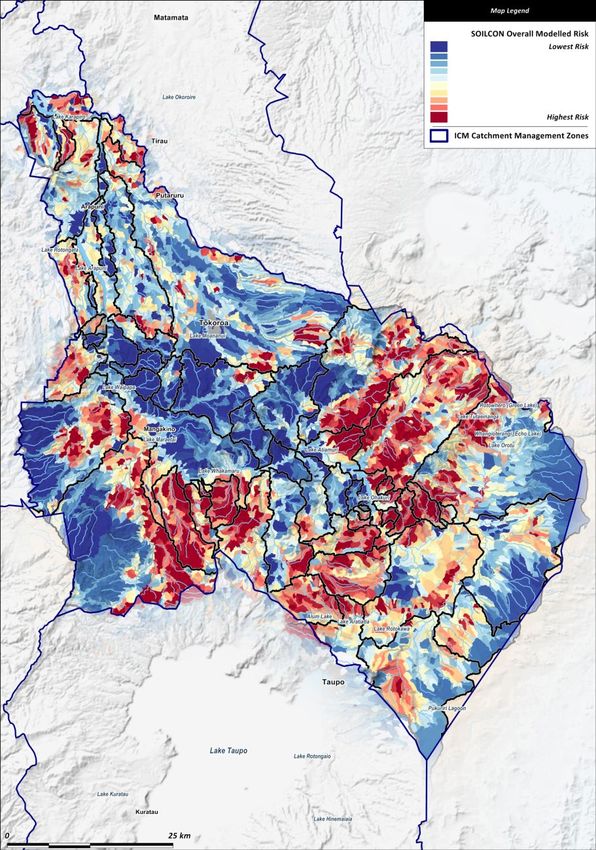
Figure 3. Soil conservation factor score map and graph example for the Upper Waikato
management zone. 18
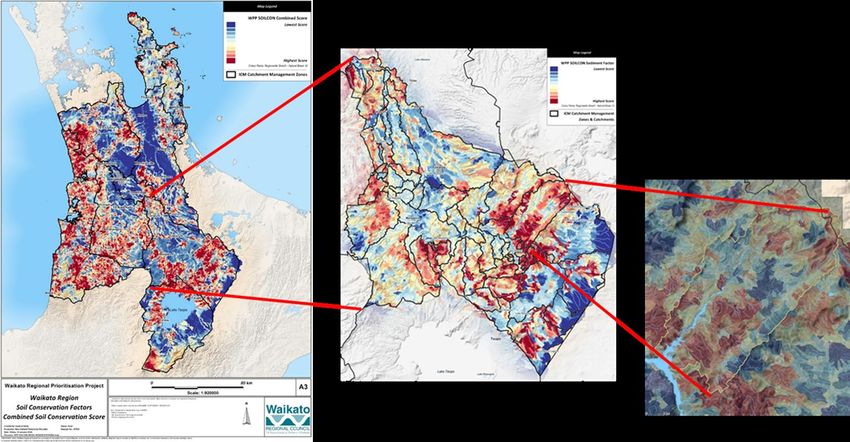
Figure 4. Maps of soil conservation scores normalised at different scales; regionally, within a
management zone, and for a sub-catchment within a management zone. 19
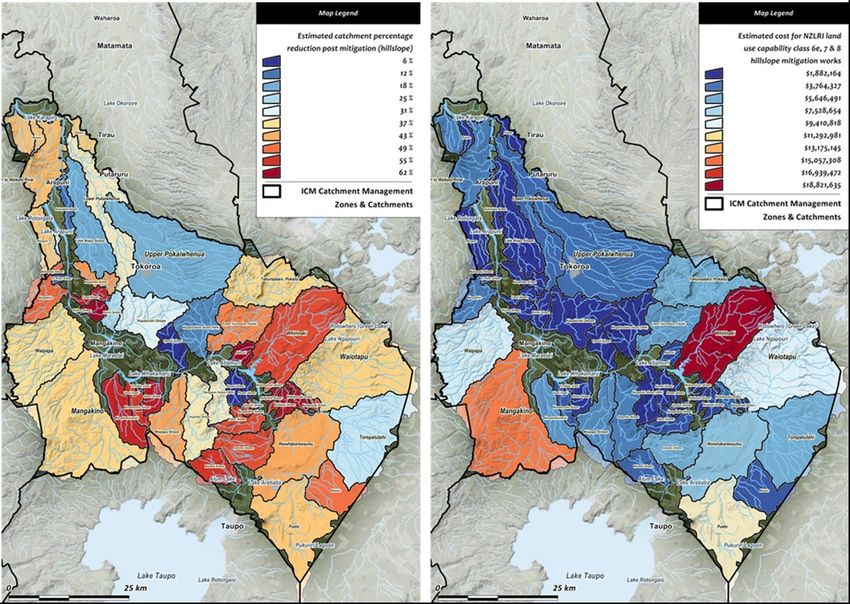
Figure 5. Mapped examples of ranked reductions and costs for the Upper Waikato management
zone. 20
Figure 6. Map of the ranked soil conservation key issue scores for the sub-catchments in the West
Coast management zone. 30
Figure 7. Graphs of the ranked soil conservation factor scores for the sub-catchments in the West
Coast management zone. 31
Figure 8. Maps of the ranked soil conservation key issue scores for the sub-catchments in the three
harbour catchments, West Coast management zone. 31
Figure 9. Graphs of the ranked soil conservation factor scores for the sub-catchments in the three
harbour catchments, West Coast management zone. 32
Figure 10. An example of summarised WPF data used in prioritisation workshops for the West
Coast prioritisation assessment. 38
Figure 11. An example of summarised WPF output data for the three harbour catchments used in
prioritisation workshops for the West Coast prioritisation assessment. 38
Tables
Table 1. Sub-catchment count and mean area by management zone. 5
Table 2. A summary of the current Waikato Prioritisation Framework for soil conservation
components. 9
Table 3. Specific datasets used in the WPF. 11
Table 4. The factors currently defined in the WPF. 13
Table 5. Outputs for determining catchment priorities and implementing mitigations. 16
Table 6. The factors and weightings used to calculate the soil conservation key issue score. 21
Table 7. Criteria used to define individual mitigations. 22
Table 8. The suite of soil conservation mitigations used in the WPF. 22
Table 9. The literature source of the individual reduction criteria (for N, P, sediment, and faecal
microbes) applied for each mitigation. 24
Table 10. The current mitigation reduction percentages for water contaminants used in the WPF.
25
Table 11. The factors and weightings used to calculate the soil conservation and water quality issue
scores. 26
Table 12. Specific datasets used for the West Coast prioritisation assessment. 27
Doc # 20216175 Page iii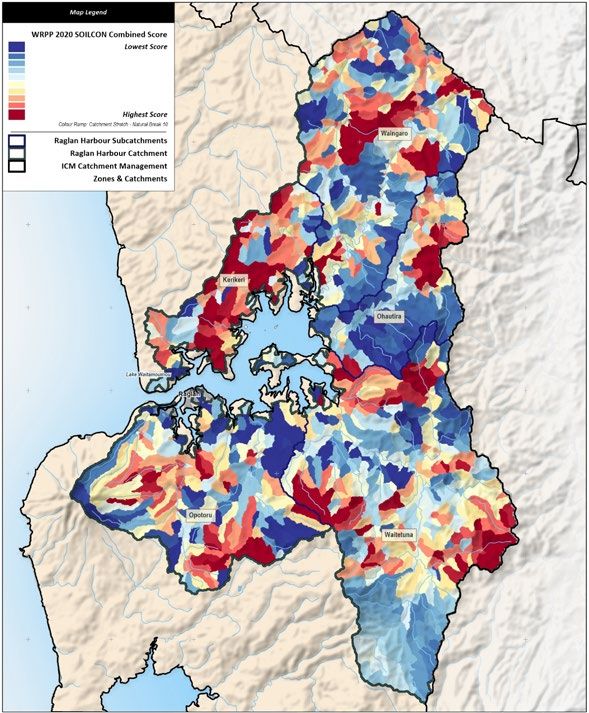
Table 13. Mitigation criteria (mitigations, costs, and reductions) for the West Coast prioritisation
            assessment.                                                                           28
Table 14. Estimates of the mitigations required for each sub-catchment in the West Coast
            management zone (harbour catchment sub-catchments are highlighted).                   33
Table 15. Estimates of the riparian mitigation costs for each sub-catchment in the West Coast
            management zone (harbour catchment sub-catchments are highlighted).                   34
Table 16. Estimates of the hillslope mitigation costs for each sub-catchment in the West Coast
            management zone (harbour catchment sub-catchments are highlighted).                   35
Table 17. Estimates of the total mitigation costs for each sub-catchment in the West Coast
            management zone (harbour catchment sub-catchments are highlighted).                   36
Table 18. The mitigation cost per contaminant unit for the three harbour catchments.              36
Table 19. Estimated percentage reductions in sediment, nitrogen, phosphorus, and E. coli for all
            mitigations in sub-catchments in the West Coast management zone.                      37

Abbreviations
     CLUES      Catchment Land Use for Environmental Sustainability model
        GIS     Geographic Information System
       HEL      Highly Erodible Land
       ICM      Integrated Catchment Management
      LCDB      Land Cover Database
  LCDB v5.0     Land Cover Database 5.0
        LTP     Long Term Plan
       LUC      Land Use Capability
          N     Nitrogen
     NIWA       National Institute of Water and Atmospheric Research
   NZeem®       New Zealand empirical erosion model
     NZLRI      New Zealand Land Resource Inventory
          P     Phosphorus
       REC      River Environment Classification
       RPS      Regional Policy Statement
        SAS     Science and Strategy group
       SQL      Structural Query Language
      WRC       Waikato Regional Council
       WPF      Waikato prioritisation framework
      WRP       Waikato Regional Plan
    WWRRS       Waikato and Waipā River Restoration Strategy

Page iv                                                                                     Doc # 20216175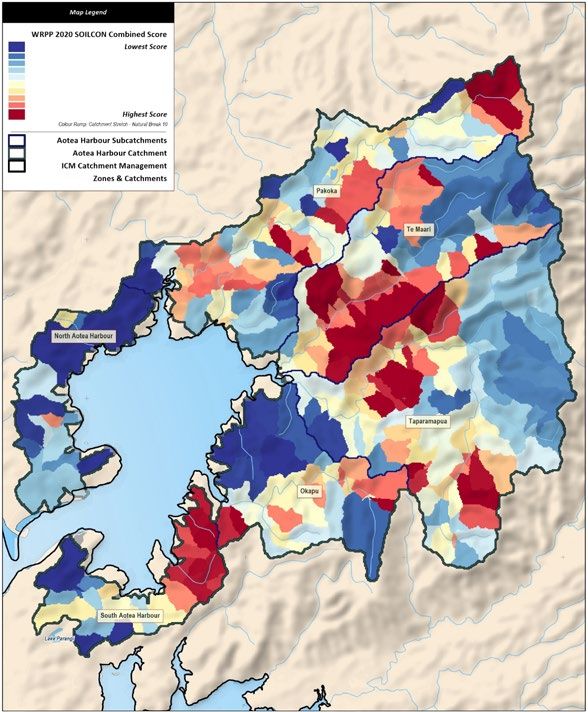
Abstract
The Waikato Prioritisation Framework (WPF) comprises a series of components and geospatial
processes that collectively are used to simplify the use of data from multiple models. This tool
can be applied to a region or sub-catchment to show locations with high to low risk for soil
conservation, water quality, or biodiversity factors. The methods employed are flexible enough
to allow adjustments to be made spatially (for example by catchment management zone) or
temporally (as improved input data becomes available) while retaining a consistent geospatial
approach.

The WPF provides a single decision support tool for consistent prioritisation across catchments
and provides increased efficiency for targeting resources used in mitigations. The WPF can be
used for several spatial prioritisation applications (e.g. soil conservation, water quality, or
biodiversity).

This report describes the use of the WPF for soil conservation. It covers using the framework to
show soil conservation risk locations, and its ability to apply general soil conservation mitigations
used by WRC to estimate the cost of the mitigations and estimate the impact of mitigations on
reducing water contaminants (sediment, nutrients, and E. coli bacteria). Collectively, the outputs
provided assist with decision making around soil conservation work programmes for WRC and
others.

Doc # 20216175                                                                                 Page v
Executive summary
Introduction
This report describes the methods used to develop the Waikato Prioritisation Framework and
its use for making soil conservation management decisions. The Waikato Prioritisation
Framework (WPF) has been developed through the Waikato Regional Prioritisation Project
(WRPP) at Waikato Regional Council (WRC). It is a spatial framework that utilises spatial model
data from multiple sources and applies geospatial techniques for determining priorities based
on risk. The WPF can be used for a number of spatial prioritisation projects. In this report, the
framework has been used to determine soil conservation priorities, mitigation costs, and their
estimated impact on water quality improvement. The degree of risk, and its location in the
catchment, can be used to guide decision making for implementing soil conservation mitigations
and achieving improvements in water quality. It provides a decision support tool for consistent
prioritisation across catchments, identifying locations with the greatest potential for water
quality improvement, and increasing the efficiency of implementing soil conservation resources.

Background of the Waikato Prioritisation Framework
In 2013, Waikato Regional Council’s sustainable land management programmes highlighted a
need to improve the way the Council prioritised, and connected catchment works (soil
conservation, river management, and biodiversity) within and across catchment management
zones in the region.

Previous prioritisation approaches used in the Waikato region for soil conservation planning and
implementation generally used a simple level of spatial prioritisation based on one static dataset
showing the location of high to low risk. Often the outputs were difficult to interpret because of
the wide spatial scatter of the high values at sub-catchment scale.

Over the 2013/14 year, an improved spatially-based prioritisation framework was developed for
the Waipā catchment to support the implementation of integrated catchment management in
that zone. The new framework was an improvement on the previous prioritisation method. A
similar improved framework was proposed for the rest of the Waikato Region, and development
of the Waikato Prioritisation Framework (WPF) commenced. The WPF has been incrementally
improved since 2013/14 to meet new specific needs of WRC soil conservation programmes.

Methods
The Waikato Prioritisation Framework utilises a series of components and geospatial processes
that collectively simplify multiple model data and increase the accessibility of the data to a
broader and more diverse audience, while remaining science-based. The methods employed are
flexible enough to allow adjustments to be made spatially (for example by management zone)
or temporally (as improved input data becomes available) while retaining a consistent geospatial
approach. A summary of the Waikato Prioritisation Framework components are as follows:

 Component                Description

 Framework base           Spatial analysis base consisting of reach-watersheds derived from REC2,
                          combined with a regional land use layer overlay.
 Datasets and metrics     Available regional and national spatial model datasets.
 Factors (risks)          Soil conservation and water quality factors (risks) considered important by
                          WRC and linked to soil conservation mitigations that WRC implement.
 Key issues               Individual factors are combined to address the key issues of soil
                          conservation and related water quality risks.
 Scoring and ranking      Relative risk scores are generated for all factors. For key issues, individual
                          factors are combined, and weighted relative (risk) scores are estimated for
                          each key issue. Relative risk scores are used to rank and prioritise areas.

Page vi                                                                                   Doc # 20216175
Mitigations Soil conservation related mitigations are identified.
Costs Costs for implementing soil conservation mitigations are estimated.
Reductions Reductions in water contaminants resulting from soil conservation
mitigations are estimated for sediment, nitrogen, phosphorus, and
microbes.
Decision support Graphed relative scores and maps for a selected area which can range in
outputs size from region to sub-catchment.
The Waikato Prioritisation Framework is underpinned by two key spatial tools. These are the
regional hydrological network and regional land use. The hydrological framework uses the River
Environment Classification, v2.5 (REC2), (NIWA, 2021). The main advantages of using the REC2
are that (i) it provides hydrological connectivity, (ii) models such as the Catchment Land Use for
Environmental Sustainability model (CLUES) use the REC river segments to perform their
calculations (Elliot et. al., 2016), (iii) it can be spatially aggregated to interrogate data at various
scale, and (iv) it provides full regional coverage. The land use layer in the WPF is based on the
methods used for the CLUES land use layer but has been rebuilt to include more current land
cover (LCDB v5.0) and land use (2018 Agribase) data.
Key issues are those that have been identified in consultation with WRC staff and are addressed
through implementing mitigations as part of WRC soil conservation work programmes.
Essentially the key issues are treated as geospatial sub-models within the framework. These sub-
models can be revised, or new models added to provide prioritisation guidance for specific
issues as required. For each key issue, the individual factors contributing to the issue are
identified and combined. Factors (risk scores) are weighted (as a percentage contribution to the
total key issue score) based on their perceived relative contribution (or importance) to the key
issue, and scores for the key issue are calculated.
Factors are those aspects which contribute to creating a key issue. For example, factors relating
to soil conservation are, erosion of hillslopes, runoff of sediment from the land, lack of riparian
fencing allowing stock to access streambanks and reduced streambank stability. For each factor,
a metric is used to calculate a factor score, which in turn are combined and used to calculate
scores for key issues. Individual factors are represented by a metric, which is an attribute
provided by one or more of the spatial models used to input data for the framework.
The WPF approach is to combine all available model data to utilise each model’s strengths and
simplify the combined data for easier interpretation for use. Additionally, as models are revised,
or new models become available, they can be incorporated into the WPF for use.
For each dataset, simple metrics have been selected to inform the factors identified. Metrics are
generally area, length, or yield-based. The current WPF utilises 13 main datasets or models.
The WPF provides for spatial analysis at multiple scales. This is enabled by the contiguous
hydrological framework on which the spatial analysis is based. To provide the flexibility WRC
requires for decision making and mitigation implementation, the finest scale units (REC2 reach-
watersheds) can be aggregated into WRC defined sub-catchments and management zones.
The Waikato region comprises eight management zones which are managed independently. The
use of management zones recognises the variation in geology, topography, and soil
conservation-related issues across the region. Collectively, the eight management zones are
further delineated into 354 sub-catchments. The sub-catchments have been derived for each
management zone through consultation with WRC staff. These are generally sub-catchments
that are familiar to WRC staff and community groups, and where works are, or have been,
undertaken.
Doc # 20216175 Page viiThe WPF uses relative normalised scores which are calculated for all reach-watersheds. The
geospatial analysis to calculate these scores uses MANIFOLD® GIS software and SQL language to
write scripts to automate and speed up the analysis. This allows the analysis to be updated
regularly if changes are required, or input datasets are modified or added. The analysis
computes a score for each reach-watershed. The final scores are normalised to enable the
combination and comparison of factors across the catchment.
Additionally, data are normalised where multiple datasets are used to derive a factor score (e.g.
CLUES sediment and SednetNZ can both be used to derive the sediment factor score). This
approach allows data of different scales to be aggregated to derive a single risk score. The final
factor score for a reach-watershed has two components: a reach score and an upstream score.
The reach score is derived using the proportion of the threat that occupies the reach-watershed.
It represents the factor’s contribution from the reach-watershed. An upstream score component
is included to reflect the impact/contribution of the upstream catchment above a reach-
watershed. Also, this has the effect of “averaging” the scores in closer proximity (in a
hydrological context) to simplify the visual pattern shown in the prioritisation outputs. The
upstream score is derived by averaging all upstream reach-watershed scores for every reach-
watershed.
The final reach-watershed factor score is derived by summing the reach score and upstream
score for each reach and scaling the result to yield a normalised score scaled from 0-100:
Reach-watershed factor score =
((Reach score + Upstream score) / Max (Reach score + Upstream score)) * 100
The ranking of scores for individual factors and combined factors (key issues), mitigation costs
and reductions requires that the data be normalised across attributes to provide relativity in the
scoring and ranking analysis. This has the following advantages:
• allows the bringing together of multiple datasets,
• provides flexibility to incorporate new data as it becomes available,
• it is hydrologically connected,
• consideration of the upstream catchment condition and inclusion in the score for a
reach-watershed, and
• it is scalable to provide information and a framework for whole of catchment and
sub-catchment scale assessment.
For individual factors and mitigations, the ranking is based on the normalised score for the
reach-watershed. For key issues, the ranking is based on the weighted score sum of all
contributing factors.
Soil conservation mitigations
The inclusion of soil conservation mitigations aims to identify actions that can be used by land
managers to address soil conservation and related water quality issues for a given area. The
inclusion of the mitigations provides a way of estimating the “catchment scale” efficacy, in terms
of reducing risks, and the cost of doing so.
A suite of six soil conservation mitigations have been developed for the WPF. However, for each
management zone these may be revised based on specific soil conservation practices developed
in each zone. There are two riparian management mitigations and four hillslope mitigations. The
riparian mitigations are based on the level of riparian protection provided by fencing (to exclude
stock), and woody vegetation (to increase soil stability provided by tree roots). Three of the
hillslope management mitigations are based on land limitations as indicated by the Land Use
Capability (LUC) sub-class, and one is based on the presence of active erosion. All six mitigations
are implemented by WRC in their catchment works programmes.
Page viii Doc # 20216175Not all mitigations should be placed everywhere in the catchment. Mitigation placement is
limited to the areas which are realistic for placement and which target risks. Estimating where
mitigations can be placed, their cost, and relative effectiveness of water contaminant
reductions, will assist with prioritising actions in the catchment.
Mitigation cost estimates are based on those used for the Waikato and Waipā River Restoration
Strategy but are reviewed for each management zone as required. The review process involves
workshops with WRC staff, land managers and can include community representatives.
The WPF has developed water contaminant reduction estimates for the six soil conservation
mitigations. Reduction estimates are for sediment, nitrogen, phosphorus, and faecal microbes
entering waterways. Reduction estimates are based on available literature.
For all mitigation related estimates there is a high level of uncertainty around the mitigation
reductions that can be achieved. This is primarily because of variable local conditions, farm
management practices, and implementation effectiveness.
In the WPF, the soil conservation mitigations focus on general actions such as fencing and
planting. However, several site-specific mitigations such as detainment bunds, bridges, and
constructed wetlands are also included.
Scale and uses
The WPF database can be interrogated to produce outputs at various scales; for whole of
catchment, sub-catchment, and individual reach-watersheds. The WPF output formats include
graphs and static maps. The outputs were developed in consultation with WRC staff to provide
simple to understand information for a broad audience. This is an important consideration for
ensuring science is accessible for all those involved in WRC catchment work programmes.
One of the main features of the map outputs is their visual representation of the data. The colour
ramps used are adjusted to the scale of the area of interest by recalculating the data to present
as relative normalised scores for only the reach-watersheds in the area of interest. This could be
for the entire region, or a specific sub-catchment. This provides a visual relative normalised
representation of the data which allows for easier visual interpretation. Additionally, graphed
data are treated the same and correlate with the map data.
WRC has used the WPF (through the Waikato Regional Prioritisation Project) for numerous
activities, primarily for catchment management, prioritisation, and planning. Examples of its use
include:
• Informing catchment management
o Catchment and Zone Management Plans
o Implementing soil conservation and river management works
o Identifying Priority catchments
o Coromandel Focus Catchments
o Prioritising West Coast harbour catchments
• Waikato and Waipā River Restoration Strategy
• Supporting funding applications
o Waikato River Authority (Waikato River Clean-up Trust)
o One Billion Trees Programme
o Hill Country Erosion (HCE) Programme
• Informing policy
o Healthy Rivers Wai Ora (Plan Change 1) Catchment Stories
• WRC related projects
o Waipā Afforestation Feasibility Study
Doc # 20216175 Page ixA worked example shows how the WPF is used for a West Coast management zone sub-
catchment prioritisation assessment. It should be noted the example is illustrative only and the
data provided may differ from any actual assessment for the West Coast.
Conclusions
• The Waikato Prioritisation Framework (WPF) has been developed incrementally since
the 2013/14 year through the Waikato Regional Prioritisation Project (WRPP) at Waikato
Regional Council (WRC).
• The WPF is primarily used by Waikato Regional Council, but is of benefit to iwi partners,
the Waikato River Authority, Co-governance partners, and land managers, funding
agencies, and communities within the wider Waikato region.
• The WPF combines multiple sourced spatial model data and applies geospatial analysis
techniques to derive prioritisation rankings (scores) for managing soil conservation, at
multiple scales, across the Waikato region.
• The Waikato Prioritisation Framework is dynamic in nature, providing the flexibility to
adjust spatial model data inputs and criteria as new data becomes available, or as soil
conservation related priorities change throughout the region.
• The WPF (and its geospatial analyses) are underpinned by a hydrologically contiguous
framework and current land use layer. These ensure regional consistency in the analyses
and allow for aggregation of data at different spatial scales.
• The WPF can be used to inform soil conservation works at a sub-catchment scale by
identifying locations of highest risk and greatest potential opportunity for focusing and
prioritising soil conservation work programmes.
• Individual factors relating to soil conservation are identified and metrics used to assign
relative normalised factor scores to reach-watersheds. These factor scores can be
ranked to indicate relative risks associated with the individual factors.
• Factors can be grouped to represent key issues. Three key issues have been developed
for the WPF, of which two (soil conservation and water quality) are currently being used.
The third issue (biodiversity) is under revision.
• Soil conservation mitigations used by WRC work programmes have been developed and
can be imposed onto the WPF. A suite of six mitigations have been developed, two for
riparian management, and four for hillslope management.
• Inclusion of the mitigations enables mitigation resources and costs to be estimated for
areas of interest such as sub-catchments and management zones.
• Available research literature has been used to develop estimates of the likely sediment,
nitrogen, phosphorus, and faecal microbe reductions achieved when implementing
mitigations.
• Various data outputs are used for communicating the results of the WPF analyses. These
are visually focused to enable easy interpretation by a broad audience including WRC,
land managers, and the community.
• The main WPF outputs include maps, graphs, and tables, which can combine and
represent the output data to guide soil conservation decision making.
• WPF outputs have been used in numerous soil conservation projects at WRC since
2013/14 and provided data to support various funding applications for soil conservation.
• The WPF is flexible to allow iterative revisions as new input datasets/models become
available, or as the focus of WRC soil conservation programmes change.
Page x Doc # 20216175Future developments
• Incorporating new biodiversity data back into the WPF and developing a revised
biodiversity key issue,
• investigating the inclusion of newly available spatial data into the WPF, and
• periodically revising the WPF (every three to five years) to incorporate new data rather
than as it becomes available.
Doc # 20216175 Page xi1 Introduction
This report describes the methods used to develop the Waikato Prioritisation Framework (WPF)
for soil conservation. The Waikato Prioritisation Framework has been developed through the
Waikato Regional Prioritisation Project (WRPP) at Waikato Regional Council (WRC). It is a spatial
framework that utilises spatial model data from multiple sources and applies geospatial
techniques to provide a relative risk-based spatial framework for determining priorities to guide
decision making. The WPF can be used for a number of spatial prioritisation projects. In this
report the framework has been used to determine soil conservation priorities, their mitigations
and expected water quality improvements. The Waikato Prioritisation Framework provides a
single decision support tool for consistent prioritisation across catchments and increased
efficiency of implementation of soil conservation resources.
The Waikato Prioritisation Framework has been developed incrementally since the 2013/14 year
to inform soil conservation related works that are carried out via management zone and
catchment management plans in the Waikato Region. The WPF informs soil conservation works
at a sub-catchment scale by identifying locations of highest risk and greatest potential
opportunity for focusing and prioritising work programmes for soil conservation and their water
quality improvements. Although the WPF is primarily used by Waikato Regional Council, it is of
benefit to iwi partners, the Waikato River Authority, Co-governance partners, land managers,
funding agencies, and communities within the wider Waikato region.
The objectives for the project were:
1. Develop for use, a preliminary regional spatial framework to inform the prioritisation of soil
conservation, biodiversity, and water quality mitigation implementation at a catchment
scale.
2. Provide maps and associated data to inform prioritisation decisions (a decision support
system).
3. Include peer review to provide scientific certainty for the spatial framework.
Previously, WPF processes and application have been documented in internal reports, covering
part of the development of the methods. The purpose of this report is to provide WRC with a
consolidated, up-to-date, and externally available reference detailing the methods used to
develop the Waikato Prioritisation Framework. It should be noted that with respect to
framework outputs, the report only focuses on specific examples for the purpose of method
explanation (with a focus on West Coast outputs), rather than including all region wide outputs.
Doc # 20216175 Page 12 Waikato Prioritisation Framework
2.1 Introduction
Although a complex statistically based model could be used to do what the Waikato
Prioritisation Framework aims to achieve, the framework approach presented in this report has
the advantage of using simple empirical methods and hydrological spatial aggregation.
The framework uses a collection of geospatial analytical approaches and spatial analyst skills
under direction of land scientists and land management practitioners. Visual spatial outputs and
associated data table summaries are provided as tools to assist decisions on priority locations
for undertaking land management activities. The WPF can be used for several spatial
prioritisation applications (e.g. soil conservation, water quality, or biodiversity).
2.2 Objectives
The initial objectives identified for the Waikato Prioritisation Framework for soil conservation
included:
• build a regional framework to produce a regionally consistent spatial picture of
catchment soil conservation issues,
• use catchments provided by on-ground staff for each management zone to rank
catchments according to soil conservation issues,
• determine the optimal aggregations of watersheds within catchments to help prioritise
mitigations, and
• identify potential priority catchments regionally, and for each management zone.
2.3 Framework overview
The Waikato prioritisation framework combines multiple sourced spatial model data and applies
geospatial analysis techniques to derive prioritisation rankings (scores) for managing soil
conservation, water quality, and eventually biodiversity, at multiple scales across the Waikato
region. The hydrological and land use frameworks provide the “base” on which multiple spatial
model data are imposed for the various spatial analyses to create the outputs used for
prioritisation.
The Waikato Prioritisation Framework is dynamic in nature, providing the flexibility to adjust
spatial model data inputs and criteria as new data becomes available, or, for example, as soil
conservation related priorities change throughout the region.
2.4 WPF development phases
In 2013, Waikato Regional Council’s sustainable land management programmes highlighted a
need to improve the way Council prioritised, and connected catchment works (soil conservation,
river management, and biodiversity) within individual management zones, and consistently
across management zones, in the region.
Previous prioritisation approaches used in the Waikato region for soil conservation planning and
implementation generally used a simple level of characterisation based on one static dataset
showing the location of high to low values. Often the outputs were difficult to interpret because
of the wide spatial scatter of the high values at sub-catchment scale. Commonly only one model
or one main factor was used to determine catchment priorities. For example, for determining
soil conservation implementation for Project Watershed 1 only New Zealand Land Resource
1 Project Watershed was undertaken in the early 2000s to develop a consistent framework for managing and funding flood
protection, soil conservation, and river management in the greater Waikato River catchment.
Page 2 Doc # 20216175Inventory (NZLRI) Land Use Capability (LUC) classes 6e, 7 and 8, as well as land cover (as
determined at the time by the Land Cover Database 1 LCDB1) and 1:50,000 scale hydrology,
were applied to assess implementation locations and resource requirements. In addition, the
identification of priority catchments for implementing work programmes was unclear and
inconsistent across management zones in the region.
Over the 2013/14 year, a spatially based prioritisation framework was developed for the Waipā
catchment to support the implementation of integrated catchment management in that zone.
The prioritisation framework (as part of a broader prioritisation process) helped to identify
priority sub-catchments and sites for soil conservation, water quality (nutrients), and
biodiversity. The outputs of the Waipā framework have informed the priority catchment
management approach in the Waipā Catchment Plan (Waikato Regional Council, 2014).
Following the development of the WPF for the Waipā Catchment Plan, the Waikato Regional
Prioritisation Project (WRPP) was initiated, proposing a similar framework for the rest of the
Waikato Region. The project had an initial framework development phase (Phase 1 – “Waikato
Lite”) which ran through 2014/15 using existing regional data sets (Hill et al., 2015). Phase 1 was
intended to provide all management zones with initial information on broad priorities. Following
Phase 1, second and third phases of the project were indicated in the Waikato Regional Council’s
Long Term Plan.
Phase 2 (2015/16 to 2016/17) incorporated new model data and updates to the framework
identified in an external peer review of the WRPP in Phase 1 (Hill and Borman, 2016). Phase 2
only covered the greater Waikato Catchment zones of Waipā, Upper Waikato, Central Waikato,
and Lower Waikato. This was part of the development of the Waikato River and Waipā River
Restoration Strategy (Neilson et al., 2018a).
The development of mitigations for soil conservation, including estimates of mitigation costs
and sediment reductions resulting from the spatial implementation of the mitigations, were a
feature of Phase 2.
Phase 3 built on the revised prioritisation framework used for the Waikato River and Waipā River
Restoration Strategy with new model data and updates and was completed for all catchment
zones in the Waikato Region in 2020/2021.
It should be noted that biodiversity has not been included in the WPF since Phase 1 as the
prioritisation methods have been in a process of incremental revision across the region. It is
intended that once complete, the biodiversity prioritisation model will be reincorporated into
the framework.
The incorporation of SedNetNZ model data for the whole region, a revised land use layer, and
soil conservation mitigations for the whole region (including estimates of mitigation costs and
sediment reductions) were a feature of Phase 3.
2.5 Key issues
Key issues are those identified in consultation with WRC staff and are addressed through
implementing mitigations (e.g. as part of WRC soil conservation related work programmes).
Essentially the key issues are the geospatial sub-models within the WPF. These sub-models can
be revised, or new models added to provide prioritisation guidance for specific issues as
required. For each key issue, the individual factors contributing to the key issue are identified
and combined. Factors (risk scores) are weighted on their perceived relative contribution (or
importance) to the key issue, and scores for the key issue are calculated.
There are three key issues identified in the WPF. These are soil conservation, water quality, and
biodiversity (in progress). Currently, only the soil conservation sub-model is fully developed and
Doc # 20216175 Page 3being used within the WPF. The water quality key issue sub-model is partially complete but has
yet to have water quality mitigations developed and implemented. At present the water quality
risk outputs can be used in conjunction with the soil conservation key issue sub-model to
indicate where water quality risks may be greater. The biodiversity key issue sub-model
developed for the Waipa Catchment Plan (WRC, 2014) and the rest of the region (Hill et al.,
2015) has since been undergoing an incremental revision across the region and as such is not
currently included in the WPF. On completion of the regionally revised biodiversity data, it is
envisaged that the biodiversity sub-model will be incorporated into the WPF.
An important concept of the WPF, is the use of individual factors and the identification of key
issues. In combination they allow for specific setting of priorities across catchments. For
example, priority catchments may be different for different key issues; high N nutrient
catchments may be different to erosion risk priority catchments which, in turn, may be different
to biodiversity priority catchments (WRC, 2014).
For each key issue, the factors relevant to the key issue are selected and their contribution to
the key issue score weighted to reflect their relative importance. Weightings are largely based
on expert opinion and in consultation with WRC staff. They can be adjusted in the future as
required if supporting information becomes available.
In this report the methods for the soil conservation key issue are described in detail. The detailed
methods for the water quality and the biodiversity key issues will be covered in separate reports.
2.6 Scoring and ranking
The WPF uses relative normalised scores which are calculated for all reach-watersheds. The use
of relative normalised scores has both advantages and disadvantages when compared with
using absolute data.
The main advantages include:
• data is averaged across model outputs for risks, this can reduce the influence of extreme
outlying data,
• being able to combine data from multiple output sources (i.e. data from multiple
models) to create a single “score” that represents the average of all the model data used
– this reduces the reliance on a single model (all models have strengths and
weaknesses),
• being able to combine multiple threats, and weight the scores to address a specifically
defined catchment value,
• enabling a relative comparison of the effectiveness of different mitigations, and
• aggregation of reach-watersheds into sub-catchments and catchments to identify
threats and effectiveness at multiple scales.
The main disadvantages include:
• data is averaged across model outputs for a risk, this can lead to loss of the “high and
low” extremes within data that may be important for example most contaminants
move through a catchment at high flows, and if so, averaging the data across
‘contradictory’ model outputs effectively normalises the data, and
• only relative percentage changes can be estimated for threats and mitigations
estimates of absolute yield cannot be calculated.
2.7 Spatial scales
The WPF provides for spatial analysis at multiple scales. This is enabled by the contiguous
hydrological framework on which the spatial analysis is based. To provide the flexibility WRC
require for decision making and mitigation implementation, the finest scale units (reach-
Page 4 Doc # 20216175watersheds) which have an average area of about 26 ha, can be aggregated into WRC defined
sub-catchments and management zones.
The Waikato region comprises eight management zones which are managed independently. The
use of management zones recognises the variation in geology, topography, and soil
conservation-related issues across the region.
Sub-catchments in the WPF have been derived for each management zone through consultation
with WRC staff. These are generally sub-catchments that are familiar to WRC staff and
community groups, or where works are or have been undertaken. The named catchments serve
several main purposes including, (i) provide some geographic familiarity, (ii) test how any
existing priority catchment works sit relative to the outputs of the WPF, and (iii) provide a means
by which the location of priorities (to inform plans) can be communicated. They are of a size that
matches local catchment groups, about 10,000 ha in size. Sub-catchments are assigned a name
(i.e. sub-catchments are referred to as “named catchments”). The naming of the sub-catchments
is usually based on the main stream or river in the sub-catchment and acts to provide some local
familiarity to both WRC staff and catchment landowner, especially when interpreting the WPF
output maps and data. A summary of the current number of sub-catchments for each
management zone used in the WPF is provided in Table 1.
Table 1. Sub-catchment count and mean area by management zone.
Sub-catchment mean area
Management zone Sub-catchment count
(ha)
Central Waikato 10 5981
Coromandel 22 8248
Lake Taupo 44 6222
Lower Waikato 38 7709
Upper Waikato 52 7575
Waihou Piako 28 14037
Waipa 36 8588
West Coast 32 11580
Waikato region 262 8743
An important point to note is that the framework does not use the named catchments in its
analysis. Ideally, the outputs from the framework can be used to simply show the relative reach-
watershed scores and where clusters of similar scores occur within the reach. The named
catchments can be imposed on the framework watersheds to show their relative reach-
watershed scores and where clusters of similar scores occur. This is useful for focussing efforts
within existing named catchments.
2.8 Applications
WRC has used the WPF (through the Waikato Regional Prioritisation Project) for numerous
projects, primarily for catchment management prioritisation and planning. Examples of its use
include:
• Informing catchment management
o Catchment and Zone Management Plans
o Implementing soil conservation and river management works
o Identifying Priority catchments
o Coromandel Focus Catchments
o Prioritising West Coast harbour catchments
Doc # 20216175 Page 5• Waikato and Waipā River Restoration Strategy
• Supporting funding applications
o Waikato River Authority (Waikato River Clean-up Trust)
o One Billion Trees Programme
o Hill Country Erosion (HCE) Programme
• Informing policy
o Healthy Rivers Wai Ora (Plan Change 1) Catchment Stories
• WRC related projects
o Waipā Afforestation Feasibility Study
Details of these WPF applications are provided in a review of the Waikato Regional Prioritisation
Project by Hill (2021). In addition to guiding annual soil conservation works programmes for
WRC, the WPF has played a fundamental role in guiding the priorities and resource requirements
for WRC-led funding applications to the Waikato River Authority ($7.8m), One Billion Trees
($3.2m), and the Hill Country Erosion Fund ($4.3m).
2.9 Validation and assessment of value
2.9.1 Validation and peer review
The WPF is a WRC (“in-house”) developed framework, developed, and incrementally revised to
meet the requirements of various WRC soil conservation projects and work programmes. As
such, it’s robustness is often questioned. With this in mind, an external peer review of the WPF
was undertaken as part of Phase 1 development of the WPF (Hill and Borman, 2016). The
external peer review was carried out in February 2015. The review panel included staff from
NIWA, DairyNZ, and the Department of Conservation. As a result of the peer review,
recommendations were made by the panel and incorporated into the Phase 2 development of
the WPF (Hill and Borman 2016). In 2020, a review of the WRPP was undertaken to assess the
use and future development of the WPF. The review process involved WRC Science and ICM
staff. The findings of the review are provided in a report by Hill (2021).
2.9.2 Assessment of value
An assessment of the value of the WPF can be made against other more commonly used national
approaches used for catchment management of contaminants. Based on comparisons outlined
in Hill (2021), the WRPP had the following disadvantages and advantages.
Disadvantages included:
• is not an independently developed framework provided by an external science research
provider,
• it is not a nationally used framework, or recognised approach, although it does make
use of nationally accepted models, such as SedNetNZ, CLUES, and other nationally
available data such as the LCDB,
• lacks the research development and scientific rigour (and funding) provided for the
development of the other approaches, and
• requires specialist GIS and Science input for its development and operation.
Advantages included:
• it has been developed “in-house” which provides the flexibility to undertake revisions
as required and customise the framework and its outputs to meet Council needs in a
timely manner,
• using the framework directly involves WRC staff, including those that implement work
on the ground, and so there is better ongoing support and a greater element of
connectivity and realism that is not likely to be achieved with other externally provided
approaches,
• it uses existing datasets, including those developed by WRC, and applies them to help
manage issues relevant to WRC,
Page 6 Doc # 20216175• it utilises multiple model outputs to provide single, more interpretable factor outputs
that are easier to communicate and reduce the barrier for information uptake in the
organisation, and
• in comparison to a research organisation-developed product, it is low cost, updatable,
and directly relevant to WRC needs.
Aside from limitations governed by data availability, the WPF includes many necessary
generalisations and assumptions throughout. These generalisations and assumptions are
required to allow the combination of all the different data used and simplify the complexity of
the spatial analyses. This does compromise the “scientific robustness” of the approach but does
allow for (relatively quick) delivery of meaningful outputs for WRC use.
The WPF is not intended to prescribe the priorities or exactly which mitigations should be used
or the exact placement of mitigations. Instead, its value is in providing a synthesis of multiple
catchment data and a consistent, meaningful, and approachable picture of the relative soil
conservation related priorities within an area of interest. It is a tool to help support management
decisions.
Doc # 20216175 Page 73 WPF for soil conservation
3.1 Background
This report presents how the WPF can be used in catchments for guiding soil conservation
priorities by land management staff. There are a number of background considerations that led
to the current approach:
1. WRC were interested in a simple prioritisation model that could be completed in a
short period (6 months),
2. requirement for a flexible framework to add new data to as it becomes available (e.g.
updated land cover and land use change),
3. a desire to use all the data WRC has rather than individual competing models,
4. the requirement for objective outputs to support priorities within and across
management zones in the Waikato region,
5. the ability to link local issues to upstream issues,
6. visual spatial outputs as well as data for assessment of issues, and
7. tools and techniques for progressively breaking down areas into more manageable
units and optimally planning mitigations.
3.2 Purpose
The purpose of the Waikato Prioritisation Framework for soil conservation is to provide a
consistent approach for the planning and implementation of the mitigations for soil
conservation across the Waikato region.
The Waikato Prioritisation Framework also informs Waikato Regional Council’s Strategic
Directions and the objectives, policies, and methods of the WRC’s key statutory documents
including the Waikato Regional Policy Statement (RPS) and the Waikato Regional Plan
(WRP).This report covers the WPF, its use for soil conservation including its ability to impose
general soil conservation mitigations used by WRC to estimate the cost of the mitigations and
estimate the impact of the mitigations on reducing sediment and other water quality related
contaminants. Collectively, the outputs provided, assist with decision making around soil
conservation work programmes for WRC and others.
Page 8 Doc # 202161754 Methods
The Waikato Prioritisation Framework for soil conservation incorporates a series of components
and geospatial processes that are collectively used to simplify model data from multiple source,
thereby increasing data accessibility to a broader and more diverse audience, while remaining
science based. The methods employed are flexible enough to allow adjustments to be made
spatially (for example by management zone) or temporally (as improved input data becomes
available) while retaining a consistent geospatial approach. A summary of the Waikato
Prioritisation Framework components are shown in Table 2.
Table 2. A summary of the current Waikato Prioritisation Framework for soil conservation
components.
Component Description
Spatial analysis base consisting of reach-watersheds derived from REC2,
Framework base
combined with a regional land use layer overlay.
Datasets and metrics Available regional and national spatial model datasets.
Soil conservation and water quality factors (risks) considered important by
Factors (risks)
WRC and linked to soil conservation mitigations that WRC implement.
Individual factors are combined to address the key issues of soil
Key issues
conservation and related water quality risks.
Relative risk scores are generated for all factors. For key issues, combine
individual factors are combined and weighted relative (risk) scores are
Scoring and ranking
estimated for each key issue. Relative risk scores are used to rank and
prioritise areas.
Mitigations Soil conservation related mitigations are identified.
Costs Costs for implementing soil conservation mitigations are estimated.
Reductions in water contaminants resulting from soil conservation
Reductions mitigations are estimated for sediment, nitrogen, phosphorus, and
microbes.
Decision support Graphed relative scores and maps for a selected area which can range in
outputs size from region to sub-catchment.
The following WPF methods sections describe the components in Table 1 in greater detail.
Mitigations, Costs and Reductions are described specifically for the soil conservation key issue
sub-model in Section 6.
4.1 Framework base
Underpinning all geospatial analyses within the WPF are two geospatial layers; a hydrological
network, and a land use layer. These provide the ‘base’ for the geospatial analyses.
4.1.1 Hydrological framework
The hydrological framework uses the River Environment Classification, v2.5 (REC2), (NIWA,
2019). The main advantages of using the REC2 is that it provides hydrological connectivity within
and between catchments. Also, models such as CLUES use the REC river segments to perform
calculations, it can be spatially aggregated to interrogate data at various scales, and it provides
full regional coverage.
The River Environment Classification (REC2) consists of hydrologically contiguous surface
waterway reaches and associated watersheds (upstream catchments). For the Waikato region
there are about 60,000 reaches with associated watersheds (termed reach-watersheds), with
an average area of about 50 hectares each (Figure 1).
Doc # 20216175 Page 9Figure 1. NIWA River Environment Classification reach-watersheds for the Waikato region (NIWA,
2021).
For the WPF, the REC2 has been extended to include additional attributes and geometrics
allowing direct interrogation using spatial Structural Query Language (SQL). These extensions
facilitate a variety of hydrology-based querying, including semi-instantaneous creation of
derivative datasets including upstream tracing and attribute aggregation, hydrological indexing,
catchment thresholding, and watercourse/catchment optimisation across a range of factors. It
also allows for pre-calculated lookup tables to be related to the base framework and to be
included in all SQL and spatial analysis.
The reach-watersheds comprising the hydrological framework, provide the finest scale spatial
base for all analyses in the WPF. Data outputs for all reach-watersheds can be aggregated or
grouped at multiple broader scales (e.g. aggregated to defined sub-catchments or management
zones). This provides the flexibility to apply any spatially defined boundary to the data for
analysis. Spatial datasets (such as the Landcover Database – LCDB) can also be overlain and
interrogated to provide spatial outputs.
4.1.2 Land use layer
The land use layer is derived from land cover and land use spatial data. It is used to identify
different types of land and underpins the estimates of contaminant generation, the placement
of appropriate mitigations, and reductions expected from imposing mitigations.
Many of the models contributing to the input data in the WPF use their own land use layers for
their model outputs. However, these layers are often outdated and do not reflect more recent
land use change (e.g. the CLUES land use layer for the Waikato region was compiled using LCDB
version3.0 (2008/09) land cover, and Agribase land use data of a similar date).
The land use layer in the WPF has been rebuilt to include more current land cover and land use
data (land cover, LCDB v5.0, 2018 and land use, 2018 Agribase). Additionally, the decision
making process for spatially allocating land uses and stock units within farms and the intensity
of stock units has been refined, resulting in improved method transparency and repeatability.
The detailed decision criteria for the revised land use layer are available as scripts and associated
metadata held by the GIS Team at WRC.
Page 10 Doc # 202161754.2 Datasets and metrics
An objective of the Waikato Prioritisation Project was to make use of a number of externally
developed models that provided data for estimating erosion, sediment, and potential
contaminants such as nitrogen, phosphorous, and microbes (E.coli). These models were, in
general, developed independently and constructed in different ways. The result was that they
were good estimators of some components and not others (i.e. as with all models they had
strengths and weaknesses). This provided the end user in WRC with a confusing and large
amount of data to interpret when deciding on soil conservation priorities and mitigations. The
WPF approach is to combine all available model data for a factor to utilise each model’s
strengths and simplify the combined data for easier interpretation for use. Additionally, as
models are revised or new models become available, they can be incorporated into the WPF for
use.
For each dataset, simple metrics have been selected to inform the factors identified. Metrics are
generally area, length, or yield-based. The datasets and metrics used in the WPF are shown in
Table 4. Additional details of the individual datasets/models used can be sourced from the
original reports referenced in Table 3.
Table 3. Specific datasets used in the WPF.
Dataset/model Metric References
Framework layers
https://niwa.co.nz/freshwater-
River Environment
and-estuaries/management-
Hydrological Classification v2.5 REC2 derived reach-watersheds.
tools/river-environment-
(REC2)
classification-0
https://lris.scinfo.org.nz/layer/
Updated land use layer used to 104400-lcdb-v50-land-cover-
LCDB v5.0 and derive stock unit density, database-version-50-mainland-
Land
flattened 2018 landcover, and integrated into new-zealand/
use/landcover
AgriBase™ farm type CLUES for modelling generated
yields. AgriBase™ 2018 data for the
Waikato region
Factors
Updated sediment
Generated sediment yield estimate
load estimator for Hicks et al. (2019)
for reach-watersheds.
New Zealand
CLUES (WANSY
Generated sediment yield estimate
revised) sediment Haddadchi and Hicks (2016)
for reach-watersheds.
Sediment generated
NZEEM® sediment Generated sediment yield estimate
Palmer et al. (2013)
generated for reach-watersheds.
SedNetNZ sediment Generated sediment yield estimate
Dymond et al. (2016)
generated for reach-watersheds.
Doc # 20216175 Page 11You can also read