Forest Transition and Its Dynamics in Subtropical Chongqing, China since 1990s - MDPI
←
→
Page content transcription
If your browser does not render page correctly, please read the page content below
Article

Forest Transition and Its Dynamics in Subtropical Chongqing,
China since 1990s
Lingyue Li 1, Zhixin Qi 2,* and Teng Zhong 3

                                         1 Department of Urban Planning, College of Architecture and Urban Planning, Tongji University,
                                           Shanghai 200092, China; lilingyue@tongji.edu.cn
                                         2 Guangdong Provincial Key Laboratory of Urbanization and Geo-Simulation, School of Geography

                                           and Planning, Sun Yat-sen University, Guangzhou 510275, China
                                         3 Key Laboratory of Virtual Geographic Environment (Ministry of Education), Nanjing Normal University,

                                           Nanjing 210023, China; tzhong27@njnu.edu.cn
                                         * Correspondence: qizhixin@mail.sysu.edu.cn; Tel.: +86-020-841-15-833

                                         Abstract: This research aims to advance our understanding towards forest transition, which is about
                                         the shift from net deforestation to net reforestation over a given area during certain period, through
                                         a case study of a western city in China from 1990 to 2015. Three main contributions are made to the
                                         theory and practice of forest land management. First, this research enriches forest transition theory
                                         with a meso-level exploration on forest land change in subtropic Chongqing, which echoes the “U”
                                         shape transition rules widely observed in the Euro-American context but was found a time lag of
                                         the turning point until 2000s. Second, it intentionally identifies the subtype of forests—the artificial
                                         plantation, which is considered influential on performance of forest’s carbon sequestration but not
                                         paid sufficient attention to. Third, it adds knowledge on forest transition pathway at an intra-urban
Citation: Li, L.; Qi, Z.; Zhong, T.      scale through the identified significance degree of forest transition dynamics, which implies that
Forest Transition and Its Dynamics       economic development matters but is less important than topography in a mountainous city like
in Subtropical Chongqing, China
                                         Chongqing, and different dimensions of economy impact differently on forest transition.
since 1990s. Land 2021, 10, 777.
https://doi.org/10.3390/land10080777
                                         Keywords: forest transition; land use change; characteristics; dynamics; Chongqing; China

Academic Editor: Diane L. Haase,
Jeremiah R. Pinto and
Owen T. Burney
                                         1. Introduction
Received: 18 June 2021                         Though worldwide deforestation remains alarmingly prominent, its rates have been
Accepted: 20 July 2021                   dropping, and a shift to net reforestation, scholarly termed as forest transition, has been
Published: 23 July 2021                  noticed in a number of countries [1–3]. This “U” shape phenomena of forest transition
                                         were first noted in early 19th century France, then in the United Kingdom, Switzerland,
Publisher’s Note: MDPI stays neu-
                                         the United States, Denmark, Portugal, and Japan [4–7]. Theorization of the phenomena
tral with regard to jurisdictional
                                         thus is primarily grounded in these advanced industrialized, mainly Euro-American
claims in published maps and institu-
                                         countries [8]. Since the 1990s, net reforestation has eminently been observed in Asia,
tional affiliations.
                                         among which China, the industrialization giant successor, is reported to be the country
                                         experiencing the fastest growth of forests on earth [9–12]. Though China’s rapid forest
                                         expansion has caught scholarly attention, research results vary greatly and are sometimes
Copyright: © 2021 by the authors.
                                         paradoxical [13–15]. For instance, some scholars believe that China is undergoing “U”
Licensee MDPI, Basel, Switzerland.
                                         shape curve in its forest resources [16], others think that the evidences are insufficient and
This article is an open access article   call the U-shaped relation between forest and economy into question [16,17]. Even when
distributed under the terms and con-     admitting the “U” shaped curve, the turning point is also arguable, given the omnifarious
ditions of the Creative Commons At-      statements of, e.g., the 1980s or late 1990s [14,15]. This research views China’s forest tran-
tribution (CC BY) license (http://cre-   sitions a heterogeneous landscape that a more nuanced and localized critical examination
ativecommons.org/licenses/by/4.0/).      on the source, flows and spatiotemporal patterns of this large scale, domestic forest tran-
                                         sition is in need. This is particularly true in those mountainous, urban-rural coordinated

Land 2021, 10, 777. https://doi.org/10.3390/land10080777                                                              www.mdpi.com/journal/land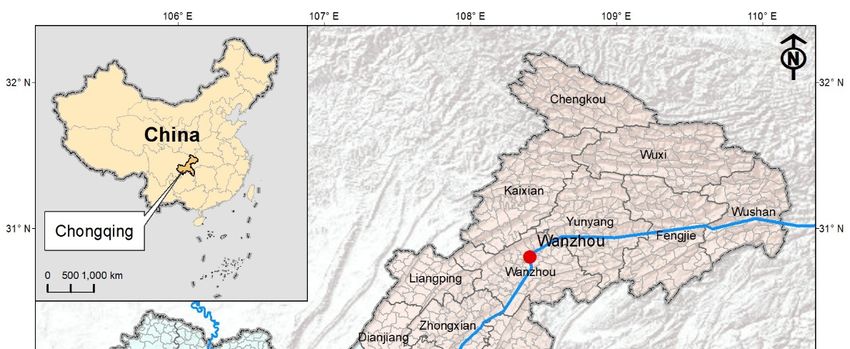
Land 2021, 10, 777                                                                                           2 of 14

                     areas where factors related to urbanization and those of natural ones may both produce
                     significant impacts on this transition.
                           Remote sensing and geographical information system technology capable of captur-
                     ing large-range, long-time span change of land-use/land-cover help to display and quan-
                     tify forest transition across time periods [18,19]. Indicators such as annual change rate and
                     Gini coefficients assist to measure the speed and (un)balance of the transition [20–24].
                     Benefitted from these methods, great many studies have portrayed the general trends of
                     deforestation and reforestation on earth [1], especially in tropical areas [9,25] and found
                     that urban and agricultural expansions were considered the two main processes threaten-
                     ing the loss of forest land [26–28]. Is similar forest transition observed in fast expanded
                     Chinese cities? How this transition is spatially distributed, and why? Given the known
                     knowledge on the net forest gain in recent years, scholars argue for in-depth, multiscale
                     examination over subtle changes of forest land and how these changes are spatially varied
                     in different climate zones especially at intra-urban or intra-regional scale, which is critical
                     for meso- and micro-level forest policy making and localized land administration.
                           Another significant but often overlooked reality in existing studies is the lack of dis-
                     crimination of natural forest and planation, the quality of which leads to differentiated
                     ecosystem services, thus influences the performance of forest’s carbon sequestration [29].
                     In places where natural forest loss and plantation expansion simultaneously occur, e.g.,
                     Ecuador and Chile, the increase of overall forest cover area is found to had negative effects
                     on carbon storage. In other words, gains of forest from plantations at the cost of natural
                     forest loss do not benefit carbon fixation or reduction [30]. Therefore, research on the over-
                     all change of forest cover area alone is not enough to uncover the actual alteration of eco-
                     system services result from the forest transition. A proper treatment of different forest
                     types, at least distinguishing natural forest and afforestation, would be a starting point
                     consummating forest transition studies and inspiring policy making for improving eco-
                     system services [31].
                           Scholars also identified several major, often overlapping, pathways of forest transi-
                     tion. The primary pathway is the typical “U” shape phenomena found in association with
                     socioeconomic development. Scholars report that alongside the increase of income and
                     level of economic development and urbanization, deforestation happens, reaches a peak,
                     then drops, and follows with a gradual reforestation or afforestation [2,3]. Another equally
                     important pathway attributable to reforestation is found inherently related to the demand
                     for forest-based eco-services and values of forest products, that is, forest scarcity results
                     in reforestation [32–34]. Other pathways are found driven by state-led reforestation poli-
                     cies, globalization, and land use intensification of smallholder agriculture but are sensitive
                     to political, geographical, and local socioeconomic contexts [34,35]. Among the various
                     factors influencing change of forest land, forestry output value is considered associated
                     with both forest scarcity and economic development [5,14,36]. Growth of GDP, urbaniza-
                     tion of rural population and road density as indicators able to reflect level of economic
                     development and urbanization are found positively related to forest expansion [37–39].
                     Increase of grain productivity per square kilometer as an indicator reflects not only eco-
                     nomic development but also land use intensification. Topographical and hydrographical
                     indicators such as slope and distance to natural rivers well capture characteristics of local
                     environment [40,41]. To what extent these indicators influence forest transition in a local
                     context deserves critical examination.
                           Endeavoring for constructing national forest city under the discourse of urban–rural
                     coordination, Chongqing, located in southwest China, is intriguing to echo the three re-
                     search objectives indicated above given its rapid economic growth, forceful reforestation
                     policies and vast ecological conservation areas: (1) to unveil an intra-metropolitan source,
                     flows and spatiotemporal patterns of forest transition and identify whether a U-shaped
                     curve, observed in the Euro-American context, exists in the study area; (2) to give an eye
                     on the subtype of forests—the artificial plantation, which is considered influential on per-
                     formance of forest’s carbon sequestration; and (3) to analyze the significance degree of
Land 2021, 10, 777 3 of 14
forest transition dynamics, especially the diverse relation between the change of forest
land and economic development. The following then the lists the method and result of
forest land change in Chongqing metropolis, so as to enrich an urban-level understanding
towards forest transition in Chinese context.
2. Research Method
2.1. Site for Study
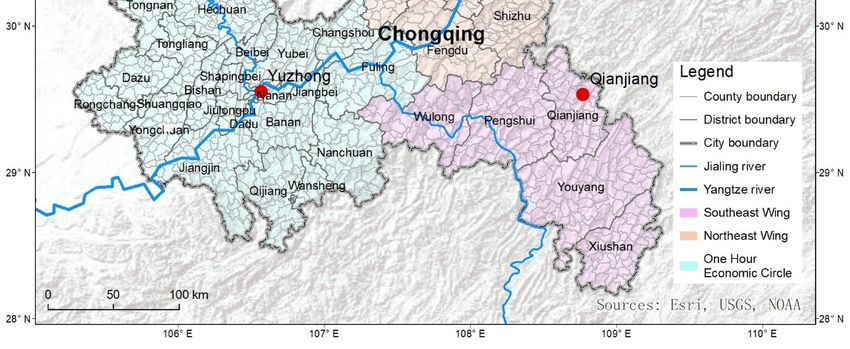
Chongqing (105°11′–110°11′ E, 28°10′–32°13′ N) locates at the junction of the Qinghai-
Tibet Plateau and the plains of the middle and lower reaches of the Yangtze River (Figure
1), covering an area of 82,402 sq.km. As an important ecological barrier in the Yangtze
River Basin and a national strategic water resource reserve, it shoulders the responsibility
to guarantee ecological security in the Three Gorges Reservoir area and the middle and
lower reaches of the Yangtze River, in which forest plays an irreplaceable role. Since the
catastrophic floods occurred in the Yangtze River Basin in 1990s, ecological security has
been given priority in local agenda and Chongqing municipal government has launched
a series of forest ecological projects to protect its natural environment.
Figure 1. Location and spatial structure of Chongqing; Source: edited by authors.
Complex in topography, Chongqing encompasses vast territory, dominated by
mountains and hills (accounting for 75.8% and 18.2% of total area, respectively) with rich
natural vegetations. Its unique geographical milieu and subtropical climate zone location
provide beneficiary conditions for diverse forest development, e.g., subtropical evergreen
broad-leaved forest, deciduous broadleaf forest, mixed forests of the former two and
warm coniferous forest, etc., producing prominent effects on ecological conservation.
Within Chongqing’s jurisdiction, the main tree species include mason pine, fir, cypress,
oak, birch and poplar, etc. that are widespread planted in Mountain Wuling, Jinyun, Sim-
ian, and Jinfo. Being one of China’s largest metropolises, Chongqing entrusted with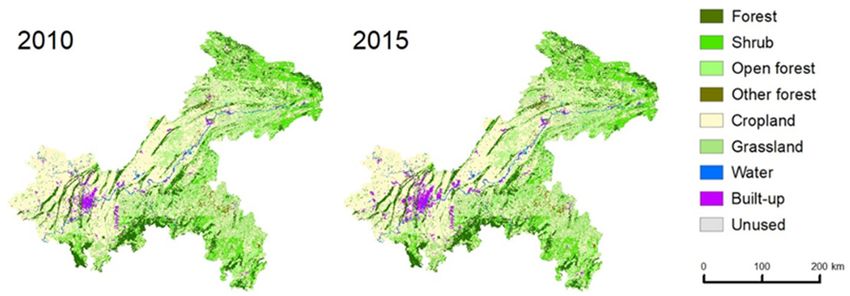
Land 2021, 10, 777                                                                                           4 of 14

                     demonstration task of urban–rural coordination is characterized by a “One Circle, Two
                     Wings” metropolitan structure, offering the spatial framework for analysis of forest tran-
                     sition. In this structure, One Circle refers to the economically advanced urban functional
                     core/development area while Two Wings indicate the northeast wing of ecological con-
                     servation development area and the southeast wing of ecological protection area (Figure
                     1). In this figure, the boundaries with dark gray refer to districts or counties at the bureau
                     level (tingju ji) and the boundaries with light gray refer to towns, villages or streets within
                     the districts or counties. There are 39 districts/counties and roughly more than 1000 vil-
                     lages/towns/streets in Chongqing.

                     2.2. Data Analysis
                     2.2.1. Forest Land Data
                           Multi-source data are deployed to reveal the spatiotemporal patterns of forest land
                     change. The primary source is China’s Land-Use/Cover Dataset (CLUD) collating remot-
                     ing sensing image encompassing (non)forest classification at 30-m resolution in 1990,
                     2000, 2010, and 2015 in Chongqing [42]. The CLUD was gathered from multiple sources
                     of Landsat Multispectral Scanner (MSS), Thematic Mapper (TM), Enhanced Thematic
                     Mapper Plus (ETM+), and Operational Land Imager (OLI), combined with multispectral
                     data from the Huanjing-1 satellite (HJ-1) [42]. The raw data contain six primary-level clas-
                     sifications—farmland, forest, grassland, waters, built-up land, and unused land, so that
                     the source and flow of forest change can be traced. Here, the forest land is inclusive of a
                     broad sense of all standing forests, e.g., shrub and open forest, etc. (Figure 2). Moreover,
                     statistical yearbooks are consulted to collate annual forest data and socioeconomic data
                     that is influential on forest transition. To further obtain data of the sub-types of forest
                     transition, e.g., the artificial planation, this research consults the Yearbook Sharing Plat-
                     form (www.yearbookchina.com, accessed on 20 May, 2021) and search words of “Chong-
                     qing” and “artificial planation (rengong zaolin)” in combination. As Chongqing was up-
                     graded to a metropolis directly under the administration of central government in 1997,
                     the available municipal statistical data were after 1997. Three types of statistics documents
                     are found reporting the artificial planation area at provincial level: China Forestry Statis-
                     tical Yearbook (zhongguo linye tongji nianjian), China Statistical Yearbook on Environment
                     (zhongguo huanjing tongji nianjian), and Compilation of Agricultural Statistics in 30 Years
                     of Reform and Opening (gaige kaifang sanshinian nongye tongji ziliao huibian). This research
                     takes China Statistical Yearbook on Environment to collate yearly artificial planation data
                     and checks data accuracy with the other two statistics documents.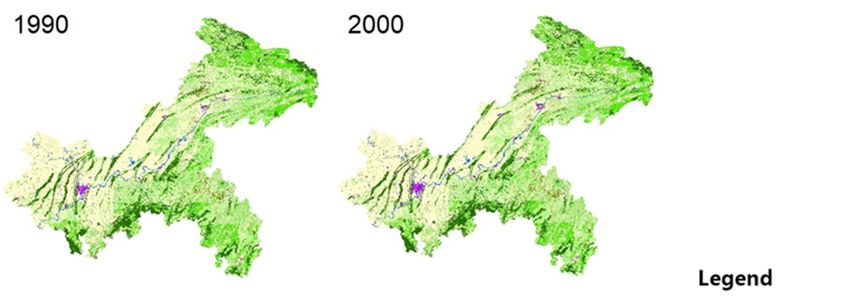
Land 2021, 10, 777                                                                                                 5 of 14

                     Figure 2. Land use and forest land maps in Chongqing (1990, 2000, 2010, 2015); Source: edited by
                     authors.

                     2.2.2. Characterizing Forest Transition
                           An exploratory, progressive approach is applied to unravel the change of forest land
                     and forest resources in Chongqing. To characterize the intra-metropolitan patterns of for-
                     est transition, a multiscale perspective is adopted in line with Chongqing’s multi-level
                     spatial layout. At the metropolitan level, sources and flow of forest display the land use
                     impetus of forest transition. The transitioned forest cover area from/to other land use type
                     divided by its net increased/decreased area eliminating the impact of area size manages
                     to showcase the conversion between forest and other land use. This research uses
                            ( ),  to represent the former and              ,( ) to indicate the latter. In specific,
                            ( ), represents the proportion  of the  converted   forest cover area (in line i) to another
                     type of land use in column j to the total loss of forest cover in the same period;                ,( )
                     indicates the ratio of converted area from other types of land use in line i to forest cover
                     in column j to total increased forest area. Both            ( ), and           ,( ) are contribution
                     rates of land use transition out of or to forest.               , refers to the  net increase rate of
                     forest (in line i) from land use type j.      . and       , are the total areas of gained/lost of
                     forest cover from/to other areas in column i and line i, respectively.
                           Preliminary observation suggests that gains of forest cover evidently happened after
                     the year 2000 in Chongqing, before that, the area of forest cover declined in general and
                     the outbreak of 1998 well-known basin-wide catastrophic flood had raised the significance
                     of forest-based soil and water conservation. Therefore, annual data related to forest re-
                     sources, e.g., the artificial planation, total standing forest stock, stock volume of forest,
                     and ratio of forest coverage after 2000 are identified to provide additional information for
                     this study.
                           To move forward to unravel how the loss and gains of forest cover are spatially dis-
                     tributed and variated, this research links the spatial database of Chongqing containing
                     both district/county-level and village/town-level spatial units with forest cover data with
                     coordinates. For all the time periods, statistical spatial units are based on administrative
                     division and adjustment after the city was upgraded as a municipality directly under the
                     administration of the central government. As the change of forest land is minimal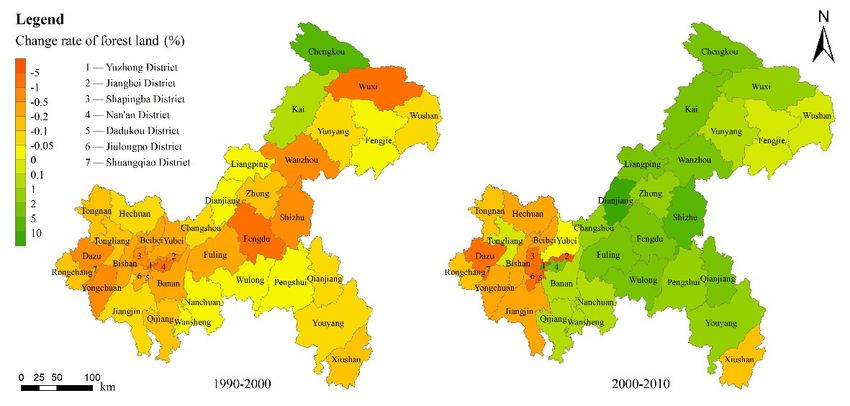
Land 2021, 10, 777                                                                                            6 of 14

                     compared with the absolute value of forest land area, this research only maps the spatial
                     distribution of forest land in 2015 and calculate Gini coefficient and coefficient of variation
                     accordingly, which is sufficient to represent the spatial distribution and concentration de-
                     gree in other years. The coefficients of variation (CV) capturing the extent of variability of
                     change rate of forest cover and the Gini coefficients measuring the degree of spatial con-
                     centration of change rate of forest cover are calculated to quantify the spatial variance of
                     loss/growth rate of forest cover.

                     2.2.3. Analyzing Forest Transition Dynamics
                           A valid land administration and conducive policy making on forest development ne-
                     cessitate the identification and analysis of dynamics of land use transition. While various
                     factors are found related to forest land change, for instance, development and natural ge-
                     ographical factors such as GDP, demographic change, altitude and slope, their influences
                     are discrepant under different natural economic milieu and local context [43–45], which
                     deserves further research. In this research, data of the ratio of forest land to total land area
                     in each district or county in 2000, 2010, and 2015, obtained through remote sensing and
                     GIS technology, are aggregated as dependent variables. Seven independent variables are
                     sought out informed by review and considering data availability (Table 1). Variables re-
                     lated to hydrography and topography include distance to two main rivers in Chongqing,
                     the Yangtze and Jialing River, and the mean slope in each district or county. Data of the
                     distance to rivers are measured through GIS software, referring to the vertical distance
                     (shortest distance) from the administrative center of the chosen city to either Yangtze or
                     Jialing River. Data of the mean slope are obtained from a topographical research about
                     Chongqing [41]. All the following data are obtained from Chongqing Statistical Yearbooks
                     based on the administrative division: variables indicating level of economic development
                     include GDP per square kilometer and forestry output value; road density represents the
                     intensity of construction activities; rural employed population and grain yield efficiency
                     exemplify the level of rural development.

                     Table 1. Dependent and independent variables.

                                      Description             Units       Min      Max    Median     Mean      SD
                                                 Dependent Variables–Forest Land (Ratio)
                           1 Ratio of forest land               %         0.43     64.31   27.13      30.37   17.14
                             2 Forest land area              Sq.km        0.18 2390.40 444.76        773.82   739.89
                                                         Independent Variables
                     Variable 1 Proximity to rivers            km         0.18    113.11    7.76     24.39   26.22
                     Variable 2        Mean slope               -         3.70     28.10   11.26     12.94    6.13
                     Variable 3      GDP intensity     10,000 Yuan/sq.km 113.27 226,783.29 703.93   6429.77 25107.65
                     Variable 4 Forestry output value     10,000 Yuan       0   40,278.27 6399.00   9715.68 9234.01
                     Variable 5 Road network density       km/sq. km        0      3.88     1.54     1.42     0.74
                                    Rural employed
                     Variable 6                          10,000 persons     0      82.42   34.90     33.94    19.80
                                       population
                     Variable 7 Grain yield efficiency     ton/sq. km       0     568.29   294.63    283.34   113.86
                     Source: edited by authors.

                          The random forest regression is used to capture the degree of significance of each
                     factor in forest land transition. Random forests are an ensemble learning method that con-
                     structs a multitude of decision trees for classification or regression. The average prediction
                     of the individual trees is returned for regression. Less expensive than other machine learn-
                     ing methods such as Artificial Intelligence Network [46–48], random forest (RF) is a tree-
                     based algorithm that is mild demanding on quantities of data sources and can compute
                     significance degree of factors under data constraints. Variable importance evaluation with
                     random forests is made by out-of-bag (OOB) error, which is the mean prediction error on
                     each variable using only the trees that did not involve that variable. Two measures are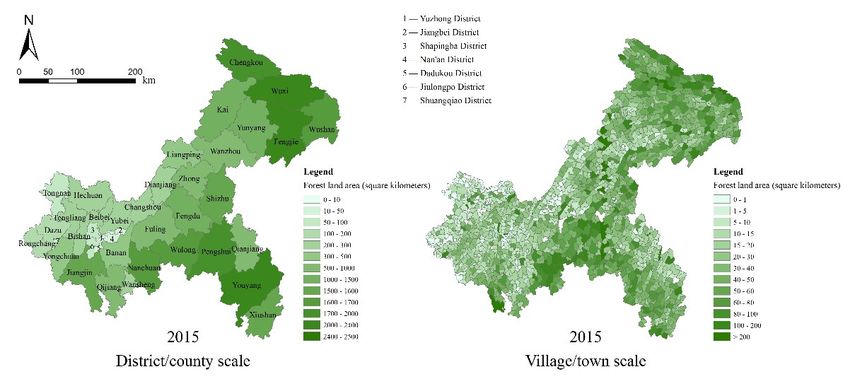
Land 2021, 10, 777                                                                                                        7 of 14

                                   commonly used for the OOB error. One is the percent increase in mean squared error
                                   (%IncMSE) as a result of a variable being permuted. The other is the total decrease in node
                                   impurities (IncNodePurity) from splitting on the variable. The IncNodePurity is measured
                                   by residual sum of squares for regression tasks.

                                   3. Results and Discussions
                                   3.1. Characteristics of Forest Transition in Chongqing
                                        The general source and flow of forest transition are calculated and summarized in
                                   Table 2. From 1990 to 2015, forest land had first decreased from 30,661 km2 to 30,630 km2
                                   during the first 10 years, then increased from 30,630 km2 to 31,063 km2 during the latter 15
                                   years. Though such general trend has experienced fluctuation amidst the process, e.g.,
                                   area of forest land indeed reached the peak to 31,166 km2 in 2010 then dropped thereafter
                                   according to the remote sensing data; this does not prevent forest land change in Chong-
                                   qing from echoing the “U” shape rules in forest transition theory at metropolitan scale.
                                   The Three Gorges project and the rapid expansion of urban area have once threatened the
                                   overall forest land use in Chongqing, especially before 2000. Forest issues have earned
                                   great attentions since the 1998 well-known basin-wide catastrophic flood and reforesta-
                                   tion accelerated thereafter. According to Table 2, during the transition peak of forest from
                                   2000 to 2010, farmland and grassland are two major sources, substantially contributing
                                   323.906 km2 and 297.825 km2 to the transition of forest land, suggesting prominent effects
                                   of the policy of Grain for Green. In the meanwhile, conversion between built-up land,
                                   waters and forests are comparatively insignificant, only 35.143 km2 and 45.110 km2 forest
                                   land was converted to waters and built-up land during the fast urbanization.

           Table 2. Flow rates of forest land use change in Chongqing during 1990–2000, 2000–2010, and 2010–2015 (km2).

     Period                  Flow of Conversion                Total Farmland Grassland     Waters Built-Up Land Unused Land
                                             Value (km2) 173.169         6.151    166.586    0.432      0.000       0.000
                      Conversion to forest
                                                   ,( ) (%) 100.000      3.552     96.198    0.249      0.000       0.000
                                             Value (km2) 202.896 22.739           169.141    0.011     11.006       0.000
   1990–2000         Conversion from forest
                                                 ( ), (%) 100.000       11.207     83.363    0.005      5.424       0.000
                                             Value (km2) −29.727 −16.588           −2.555    0.421    −11.006       0.000
                        Net conversion
                                                     ,   (%) 100.000 −55.801       −8.594    1.416    −37.022       0.000
                                             Value (km2) 686.148 361.727          323.585    0.305      0.302       0.230
                      Conversion to forest
                                                   ,( ) (%) 100.000     52.718     47.160    0.044      0.044       0.034
                                             Value (km2) 144.439 37.821            25.760    35.448    45.411       0.000
   2000–2010         Conversion from forest
                                                 ( ),   (%)  100.000    26.185     17.834    24.541    31.440       0.000
                                             Value (km ) 541.709 323.906
                                                          2                       297.825   −35.143   −45.110       0.230
                        Net conversion
                                                     , (%) 100.000      59.793     54.979    −6.487    −8.327       0.042
                                             Value (km2)       0.030     0.000     0.030     0.000      0.000       0.000
                      Conversion to forest
                                                   ,( )  (%) 100.000     0.000    100.000    0.000      0.000       0.000
                                             Value (km2) 103.620         0.005     3.031     17.494    83.089       0.000
   2010–2015         Conversion from forest
                                                 ( ), (%) 100.000        0.005     2.925     16.88.    80.186       0.000
                                             Value (km2) −103.589 −0.005           −3.001   −17.494   −83.089       0.000
                        Net conversion
                                                     , (%) 100.000      −0.005     −2.897   −16.888   −80.210       0.000
                                                       Source: edited by authors.

                                         A further exploration on annual forest transition on the right side of the “U” shape
                                   in post 2000 suggests a gradualist gain but differed increasing rates of forest land and
                                   forest area, that is, the latter of standing trees excluding shrub and sparse forest land has
                                   gained more area size and grew faster than the former (Figure 3). Forest area is different
                                   from forest land in that the former refers to forest land with a canopy closure of 0.2 or
                                   above, or forest belt with a crown width of 10 m or above, which include both natural or
                                   artificial coniferous forests, broad-leaved forests, mixed coniferous, and broad-leaved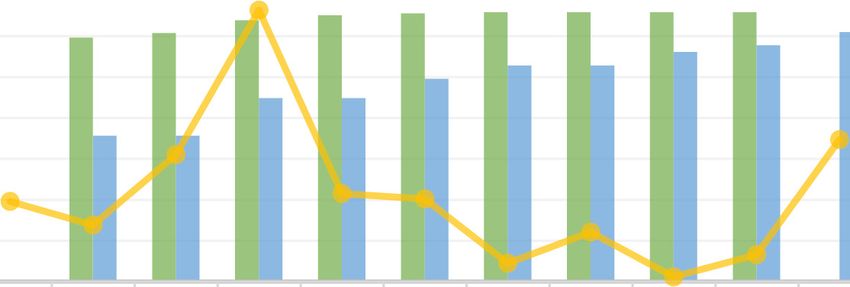
Land 2021, 10, 777                                                                                                                                                                 8 of 14

                                                                 forests but exclude shrub forest land and sparse forest land. In 2001, forest area was only
                                                                 17,790 km2, in 2010, the number has reached 30,490 km2. Meanwhile, data from the China
                                                                 Statistical Yearbook on Environment suggest that substantial artificial plantation were
                                                                 made in this period. This is particularly true in the year 2003 with the peak of 3314 km2
                                                                 plantation area, followed by plantation area of 1732 km2 in 2010 and 1548 km2 in 2002. As
                                                                 annual increase of forest land and forest area is no more than 4583 km2, it can be reasona-
                                                                 bly assumed that considerable increase of overall forest land and forest area comes from
                                                                 the artificial plantation and natural forests may have experienced loss in the same period.
                                                                 This partly explains why carbon emission remains going up despite of the increase of for-
                                                                 est cover areas in the city. It also raises the question of the quality of reforestation in
                                                                 Chongqing. That is, whether the increase of overall forest land manages to provide better
                                                                 ecosystem services, and thus improve the level of carbon sequestration and benefit carbon
                                                                 fixation and reduction. Clarification of the question is important as in places such as Ec-
                                                                 uador and Chile, gains of forest from plantation at the cost of natural forest loss have
                                                                 already been found negatively related to carbon storage [30].

                                                                     350                                                                                                      35
                       RIGHT: ARTIFICIAL PLANTATION
                       LEFT: FOREST LAND AND AREA

                                                                     300                                                                                                      30

                                                                     250                                                                                                      25

                                                                     200                                                                                                      20

                                                                     150                                                                                                      15

                                                                     100                                                                                                      10

                                                                       50                                                                                                     5

                                                                        0                                                                                                     0
                                                                              2000   2001     2002     2003     2004     2005     2006     2007     2008     2009     2010
                                                      Forest Land              0     297.77   303.42   319.02   325.13   327.31   329.15   329.33   329.11   328.81
                                                      Forest Area              0     177.9    177.9    223.73   223.73   247.33   263.72   263.72   280.16   288.4    304.9
                                                      Artificial Plantation   9.76    6.86    15.48    33.14    10.72    10.07     2.19      6       0.53     3.24    17.32

                     Figure 3. Annual forest change in Chongqing (2000–2010); Source: multiple statistical yearbooks.

                                                                       Figure 4 indicates a hollowing pattern of forest land in the city center of the nine
                                                                 districts and reveals that most of the forests are in the two wings area, and the farther
                                                                 away from city center, the larger the forest land area. The southeast wings generally owns
                                                                 more forest land than the northeast wings and are contiguous to the edge of the one-hour
                                                                 economic circle. At district/county scale, Chengkou, Wuxi, and Fengjie in the southeast
                                                                 wings and Youyang in the northeast wing have the largest forest land. At the village/town
                                                                 scale, apart from the aforementioned districts, Nanchuan, Wulong, Fengdu, and Qijiang
                                                                 also have many towns and villages owning large forest land. The spatial concentration
                                                                 degree of forest land area (0.522) is generally higher than that of the ratio of forest land to
                                                                 total area (0.321) at the district/county level as measured by Gini coefficient (Figure 5). The
                                                                 result indicates a mild dispersed spatial patterns of forest land distribution. This mild dis-
                                                                 persion, however, does not mean a spatial balance of forest distribution. As the astonish-
                                                                 ingly high values of coefficient of variations calculated at the district/county scale suggest,
                                                                 spatial distribution of forest land is quite imbalance with all CVs surpassing 1.03 through-
                                                                 out 1990 to 2010. This is also clearly indicated in the change rate of forest land that shows
                                                                 a distinctive differed forest land change in the “one hour, two wings” spatial structure
                                                                 (Figure 6). The year 2000 turns to be the watershed of forest transition. Forest land gener-
                                                                 ally lost during the period of 1990 and 2000 and the loss rate was relatively evenly distrib-
                                                                 uted across the metropolis. The decrease turned around after 2000 that the two wings,
                                                                 especially in its middle section such as Shizhu, Dianjiang, Pengshui, etc., have experienced
                                                                 substantial increase of forest land.
Land 2021, 10, 777 9 of 14
Figure 4. Spatial patterns of forest land area rate at district/county (left) and village/town (right)
level; Source: edited by authors.
100 100
Cumulative percentage of forest land use ratio (%)
Gini = 0.522 90
Gini = 0.321
Cumulative percentage of forest land use (%)
80 80
70
60
60
50
40
40
30
20
20
0 10
0 20 40 60 80 100
0
0 20 40 60 80 100
-20
Cumulative percentage of districts or counties (%) Cumulative percentage of districts or counties (%)
Figure 5. The Lorenz Curve of forest land and its ratio to total land area in 2015; Source: edited by
authors.Land 2021, 10, 777 10 of 14
Figure 6. Spatiotemporal patterns of forest land change rate at district/county (up) and town/vil-
lage (down) level in Chongqing (1990–2010); Source: edited by authors.
3.2. The Significance Degree of Forest Transition Factors in Chongqing
Results of multiple linear regression (MLR) and random forest (RF) are shown in Ta-
ble 3 and Figure 7. In both two models, mean slope, GDP per square kilometer, rural em-
ployed population, and grain yield efficiency are significantly related to ratio of forest
land. Topographical factor, as reflected by mean slope, is overwhelmingly significant
given its least p-value in MLR and greatest value in RF. GDP per square kilometer ranks
2/7 in RF, implying that the level of economy matters for the gain of forest land, which
echoes the economic development pathway of forest transition. However, obviously,
economy is not as important as topography in the case of Chongqing. In other words, the
function of economy in the right side of the “U” shaped curve of forest transition is limited
in Chongqing. This is also reflected in the results of forestry output value which, though
is considered significant in forest transition upon its association with both forest scarcity
and economic development [5,14,36], is proved less so in this research.
Table 3. Results by multiple linear regression and random forest.
Method Multiple Linear Regression Random Forest
Dependent Variables Ratio of Forest Land Ratio of Forest Land
Results
coeff. s.e. t Stat IncMSE IncNode Purity
Variables
Proximity to rivers −0.118 0.061 −1.925 0.2111 0.5791
Mean Slope 0.812 *** 0.063 12.921 0.4283 2.7930
GDP per sq.km −0.271 ** 0.099 −2.723 0.3533 2.3066
Forest output value 0.041 0.066 0.616 0.1405 0.6392
Road network density −0.116 0.079 −1.483 0.0727 0.5817
Rural employed population −0.353 *** 0.075 −4.693 0.2148 0.6874
Grain yield efficiency 0.507 *** 0.082 6.216 0.2348 0.7607
R Square 0.7378
% Var explained 0.8466
Note: For multiple linear regression, * p < 0.05, ** p < 0.01, *** p < 0.001, intercept is the mean for the
response when all the variables value 0, R square assesses the goodness-of-fit for multiple linear
regression; % Var explained in random forest is similar to R square in multiple linear regression.Land 2021, 10, 777 11 of 14
Figure 7. Random Forest result for urban-rural factors and ratio of forest land in Chongqing (in-
creased importance from bottom to top).
In the economic development pathway, there are normally two major mechanisms
assuming to be able to promote the growth of forest land [32]. First, economic growth
directly pushes up the price increase of forest products, thus increasing the value of for-
ests. As forest land is characterized by complicated topography and hard to implement
mechanized plantation, such increase of forestry output value often leads to the rise of
forest land rent price. This is quite different from farmland, which is often situated in flat
areas and is prone to achieve mechanized plantation. Improved production efficiency
could prevent the rent price of farmland from increasing, when rise of rent price of forest
surpasses that of farmland and grass, transition to forest land happens under market reg-
ulation [37]. Here, the increase of forestry output value can be viewed as a constituent
factor of both economic development and forest scarcity pathways. Reduction of forests
(either results from agricultural or urban expansion) leads to shortage of forest products
and decreased function of ecosystem service, but human’s needs for forest service is ine-
lastic. In a normal market1, the price of forest products will go up under this shortage,
thus increase the forestry output value. Yet, in this research, significance of forestry output
value is not so prominent (with p-value surpassed 0.05 in MLR and rank 6/7 in terms of
%IncMSE and 5/8 in terms of IncNodePurity in RF), indicating that increase of forest land
through market mechanism did not work well in rural mountainous city. Second, devel-
opment of economy increases non-agricultural job opportunities thus leads to rural ur-
banization. Non-agricultural sectors absorbed surplus rural labor force and indirectly pro-
pelled higher production efficiency in agricultural sectors. This urbanization-driven in-
crease of forest land through seems work well in this case as significances of agricultural
employees (rank 4/7 in its relation to the ratio of forest land in RF) and grain production
efficiency (rank 3/7 in its relation to ratio of forest land in RF) follow right after mean slope
and GDP per square kilometer and the p-values of both are less than 0.001 in MLR. Assur-
edly, these two factors are not only related to economic development pathway but also
part of land use intensification pathway of forest transition.
Distance to rivers (Yangtze and Jialing Rivers in this research) (rank 5/7 and 7/7 in its
relation to ratio of forest land in RF) is faintly significant but as its p-value almost ap-
proaches 0.05 in MLR, its role in forest land change cannot be overlooked. Like many other
waterfront cities, Chongqing’s initial human settlements developed along the two riversLand 2021, 10, 777 12 of 14
where frequent commercial and trade activities brought prosperity to the surrounding
area. This is especially true for the traditional main city area of Chongqing where the
closer to the two main rivers, the higher the production, commerce, leisure and residence
densities are. Road network density (rank 7/7 and 6/7 in its relation to ratio of forest land
in RF) exemplifying intensity of construction is the least important factor given its rank
and p-value in both results. This well echoes the identified sources and flows of forest land
in Table 2 that conversions between construction land and forest land are quite small com-
pared with those happened between farmland, grass and forests. In other words, accessi-
bility to rivers (river economy) is more to do with forest land change than that to road
(road economy).
4. Conclusions
This research deals with the paucity of in-depth, multiscale studies on forest transi-
tion at intra-urban scale through a case research in a subtropical metropolis, Chongqing,
China, since the 1990s to actualize the three objectives. First, it finds that the general trends
of forest land change in Chongqing have echoed the “U” shaped curve of forest transition
observed in Euro-American countries. Yet, the turning point happens around 2000,
roughly in line with the national forest protective measures, e.g., Natural Forest Protection
Project (launched in 2000), Grain for Green Program (launched in 1999), and Key Shelter-
belt Development Programs along the Yangtze River (launched in 1989 and completed the
first phase of the project in 2000) [49,50]. Second, it pays attention to natural forest loss
and afforestation during the year 2000–2010 and unveils the truth that the overall increase
of forest land in Chongqing is mainly contributed by afforestation while natural forests
have continued loss since 1990s. Third, findings of dynamics of forest land change gener-
ally correspond the economic development pathway of forest transition at the meso-urban
scale, but topography as reflected by mean slope is the overwhelmingly important factor
in mountainous Chongqing. Instead of treating economic development as a factor solely
reflected by GDP, this research looks into its different dimensions through identifying
how variables such as rural employed population, grain yield efficiency, and forestry out-
put value are related to economy, unveiling a variance of relations between forest land
change and economy. The reform of forest property rights and citizen’s demand for forest
protection also do favor to forest land increase, which deserve furtherance research.
Author Contributions: Conceptualization, L.L.; methodology, L.L. and Z.Q.; formal analysis, L.L.;
data curation, Z.Q. and L.L.; writing—original draft preparation, L.L.; writing—review and editing,
L.L., Z.Q., T.Z.; visualization, L.L. and Z.Q.; supervision, L.L.; funding acquisition, Z.Q. All authors
have read and agreed to the published version of the manuscript.
Funding: This research has been supported by the National Key R&D Program of China [Grant No.
2017YFA0604403] and National Science Foundation of China [Grant Number 51808391].
Institutional Review Board Statement: Not applicable.
Informed Consent Statement: Not applicable.
Data Availability Statement: Not applicable.
Conflicts of Interest: The authors declare no conflict of interest.
Notes
1 Noteworthy, if a market is highly controlled, things would be different. For instance, before the market reform, shortage of
forest products did not lead to the price increase of forest products or forestry output value under China’s planned economy.
References
1. Meyfroidt, P.; Lambin, E.F. Global forest transition: Prospects for an end to deforestation. Annu. Rev. Environ. Resour. 2011, 36,
343–371.
2. Mather, A.S.; Needle, C. The forest transition: A theoretical basis. Area 1998, 30, 117–124.Land 2021, 10, 777 13 of 14
3. Grainger, A. The forest transition: An alternative approach. Area 1995, 27, 242–251.
4. Drummond, M.A.; Loveland, T.R. Land-use pressure and a transition to forest-cover loss in the eastern United States. BioScience
2010, 60, 286–298.
5. Mather, A.S.; Fairbairn, J.; Needle, C.L. The course and drivers of the forest transition: The case of France. J. Rural Stud. 1999, 15,
65–90.
6. Yeo, I.-Y.; Huang, C. Revisiting the forest transition theory with historical records and geospatial data: A case study from Mis-
sissippi (USA). Land Use Policy 2013, 32, 1–13.
7. Foster, D.R.; Motzkin, G.; Slater, B. Land-use history as long-term broad-scale disturbance: Regional forest dynamics in central
New England. Ecosystems 1998, 1, 96–119.
8. Mather, A.S. The forest transition. Area 1992, 24, 367–379.
9. Dewi, S.; van Noordwijk, M.; Zulkarnain, M.T.; Dwiputra, A.; Hyman, G.; Prabhu, R.; Nasi, R. Tropical forest-transition land-
scapes: A portfolio for studying people, tree crops and agro-ecological change in context. Int. J. Biodivers. Sci. Ecosyst. Serv. Manag.
2017, 13, 312–329.
10. Singh, M.; Bhojvaid, P.; de Jong, W.; Ashraf, J.; Reddy, S. Forest transition and socio-economic development in India and their
implications for forest transition theory. For. Policy Econ. 2017, 76, 65–71.
11. Calaboni, A.; Tambosi, L.R.; Igari, A.T.; Farinaci, J.S.; Metzger, J.P.; Uriarte, M. The forest transition in São Paulo, Brazil. Ecol.
Soc. 2018, 23, 7, doi:10.5751/ES-10270-230407.
12. Keenan, R.J.; Reams, G.A.; Achard, F.; de Freitas, J.V.; Grainger, A.; Lindquist, E. Dynamics of global forest area: Results from
the FAO Global Forest Resources Assessment. For. Ecol. Manag. 2015, 352, 9–20.
13. Wang, J.; Xin, L.; Wang, Y. Economic growth, government policies, and forest transition in China. Reg. Environ. Chang. 2019, 19,
1023–1033.
14. Mather, A.S. Recent Asian Forest transitions in relation to forest transition theory. Int. For. Rev. 2007, 9, 491–502.
15. Meyfroidt, P.; Rudel, T.K.; Lambin, E.F. Forest transitions, trade, and the global displacement of land use. Proc. Natl. Acad. Sci.
USA 2010, 107, 20917–20922.
16. Wang, S.; Liu, C.; Wilson, B. Is China in a later stage of a U-shaped forest resource curve?—A re-examination of empirical
evidence. For. Policy Econ. 2007, 10, 1–6.
17. Hu, A.G.; Shen, R.M.; Lang, X.J. Verification of the environmental Kuznets curve relationship between changes in China’s forest
resources and economic development: Based on provincial panel data from the second to the seventh national forest statistics.
China Public Admin. Rev. 2013, 15, 61–75.
18. Batty, M. Thinking about Cities as Spatial Events. Environ. Plan. B Plan. Des. 2002, 29, 1–2.
19. Li, X.; Yeh, A.G.-O. Analyzing spatial restructuring of land use patterns in a fast growing region using remote sensing and GIS.
Landsc. Urban Plan. 2004, 69, 335–354.
20. He, C.Y.; Li, J.W.; Zhang, X.L.; Liu, Z.F.; Zhang, D. Will rapid urban expansion in the drylands of northern China continue: A
scenario analysis based on the Land Use Scenario Dynamics-urban model and the Shared Socioeconomic Pathways. J. Clean.
Prod. 2017, 165, 57–69.
21. Sun, Y.; Zhao, S.; Qu, W. Quantifying spatiotemporal patterns of urban expansion in three capital cities in Northeast China over
the past three decades using satellite data sets. Environ. Earth Sci. 2015, 73, 7221–7235.
22. Hassan, M. Mehedy, Monitoring land use/ land cover change, urban growth dynamics and landscape pattern analysis in five
fastest urbanized cities in Bangladesh. Remote Sens. Appl. Soc. Environ. 2017, 7, 69–83.
23. Zhang, T.; Chen, S.S.; Li, G. Exploring the relationships between urban form metrics and the vegetation biomass loss under
urban expansion in China. Environ. Plan. B 2020, 47, 363–380.
24. Tang, J.; Wang, X. Analysis of the land use structure changes based on Lorenz curves. Environ. Monit. Assess. 2009, 151, 175–180.
25. Gibbs, H.K.; Ruesch, A.S.; Achard, F.; Clayton, M.K.; Holmgren, P.; Ramankutty, N.; Foley, J.A. Tropical forests were the pri-
mary sources of new agricultural land in the 1980s and 1990s. Proc. Natl. Acad. Sci. USA 2010, 107, 16732–16737.
26. Hansen, M.C.; Stehman, S.V.; Potapov, P.V. Quantification of global gross forest cover loss. Proc. Natl. Acad. Sci. USA 2010, 107,
8650–8655.
27. Zhang, Y.; Shen, W.; Li, M.; Lv, Y. Assessing spatio-temporal changes in forest cover and fragmentation under urban expansion
in Nanjing, eastern China, from long-term Landsat observations (1987–2017). Appl. Geogr. 2020, 117, 102190.
28. Bonilla-Bedoya, S.; Mora, A.; Vaca, A.; Estrella, A.; Herrera, M.Á. Modelling the relationship between urban expansion processes
and urban forest characteristics: An application to the Metropolitan District of Quito. Comput. Environ. Urban Syst. 2020, 79,
101420.
29. Zhai, D.; Xu, J.; Dai, Z.; Schmidt-Vogt, D. Lost in transition: Forest transition and natural forest loss in tropical China. Plant
Divers. 2017, 39, 149–153.
30. Hall, J.M.; van Holt, T.; Daniels, A.E.; Balthazar, V.; Lambin, E.F. Trade-offs between tree cover, carbon storage and floristic
biodiversity in reforesting landscapes. Landsc. Ecol. 2012, 27, 1135–1147.
31. Sasaki, N.; Putz, F.E. Critical need for new definitions of “forest” and “forest degradation” in global climate change agreements.
Conserv. Lett. 2009, 2, 226–232.
32. Rudel, T.K.; Coomes, O.T.; Moran, E.; Achard, F.; Angelsen, A.; Xu, J.; Lambin, E. Forest transitions: Towards a global under-
standing of land use change. Glob. Environ. Chang. 2005, 15, 23–31.Land 2021, 10, 777 14 of 14
33. Redo, D.J.; Grau, H.R.; Aide, T.M.; Clark, M.L. Asymmetric forest transition driven by the interaction of socioeconomic devel-
opment and environmental heterogeneity in Central America. Proc. Natl. Acad. Sci. USA 2012, 109, 8839–8844.
34. Lambin, E.F.; Meyfroidt, P. Land use transitions: Socio-ecological feedback versus socio-economic change. Land Use Policy 2010,
27, 108–118.
35. Michon, G.; de Foresta, H.; Levang, P.; Verdeaux, F. Domestic forests: A new paradigm for integrating local communities’ for-
estry into tropical forest science. Ecol. Soc. 2007, 12. Available online: http://www.ecologyandsociety.org/vol12/iss2/art1/ (ac-
cessed on 20 May, 2021).
36. Foster, A.D.; Rosenzweig, M.R. Econoimc growth and the riese of forests. Q. J. Econ. 2003, 118, 601–637.
37. Angelsen, A. Forest Cover Change in Space and Time: Combining the Von Thunen and Forest Transition Theories; The World Bank:
Washington, DC, USA, 2007.
38. Klooster, D. Forest transitions in Mexico: Institutions and forests in a globalized countryside. Prof. Geogr. 2003, 55, 227–237.
39. Bakker, M.M.; Govers, G.; van Doorn, A.; Quetier, F.; Chouvardas, D.; Rounsevell, M. The response of soil erosion and sediment
export to land-use change in four areas of Europe: The importance of landscape pattern. Geomorphology 2008, 98, 213–226.
40. Simwanda, M.; Murayama, Y. Spatiotemporal patterns of urban land use change in the rapidly growing city of Lusaka, Zambia:
Implications for sustainable urban development. Sustain. Cities Soc. 2018, 39, 262–274.
41. Jia, L.; Ma, Q.; Du, C.; Hu, G.; Shang, C. Rapid urbanization in a mountainous landscape: Patterns, drivers, and planning impli-
cations. Landsc. Ecol. 2020, 35, 2449–2469.
42. Xu, Y.; Yu, L.; Peng, D.; Zhao, J.; Cheng, Y.; Liu, X.; Li, W.; Meng, R.; Xu, X.; Gong, P. Annual 30-m land use/land cover maps of
China for 1980–2015 from the integration of AVHRR, MODIS and Landsat data using the BFAST. Sci. China Earth Sci. 2020, 63,
1390–1407.
43. Liu, X.; Xun, L.; Xia, L.; Xu, X.; Wang, S. A future land use simulation model (FLUS) for simulating multiple land use scenarios
by coupling human and natural effects. Landsc. Urban Plan. 2017, 168, 94–116.
44. Huang, Z.; Wei, Y.D.; He, C.; Li, H. Urban land expansion under economic transition in China: A multi-level modeling analysis.
Habitat Int. 2015, 47, 69–82.
45. Xian, S.; Li, L.; Qi, Z. Toward a sustainable urban expansion: A case study of Zhuhai, China. J. Clean. Prod. 2019, 230, 276–285.
46. Iannace, G.; Ciaburro, G.; Trematerra, A. Wind Turbine Noise Prediction Using Random Forest Regression. Machines 2019, 7,
69.
47. Rodriguez-Galiano, V.; Sanchez-Castillo, M.; Chica-Olmo, M.; Chica-Rivas, M. Machine learning predictive models for mineral
prospectivity: An evaluation of neural networks, random forest, regression trees and support vector machines. Ore Geol. Rev.
2015, 71, 804–818.
48. Niu, W.-J.; Feng, Z.-K.; Feng, B.-F.; Xu, Y.-S.; Min, Y.-W. Parallel computing and swarm intelligence based artificial intelligence
model for multi-step-ahead hydrological time series prediction. Sustain. Cities Soc. 2021, 66, 102686.
49. Rozelle, S.; Huang, J.; Benziger, V. Forest Exploitation and Protection in Reform China: Assessing the Impact of Policy, Tenure,
and Economic Growth. Working Paper; Unpublished work, 2003.
50. Wang, S.; Cornelis van Kooten, G.; Wilson, B. Mosaic of reform: Forest policy in post-1978 China. Policy Econ 2004, 6, 71–83.
Wenhua, L. Degradation and restoration of forest ecosystems in China. Ecol. Manag. 2004, 201, 33–41.You can also read