APPENDIX 5.0 CITY OF EDMONTON GROWTH STUDY - MARCH 2018
←
→
Page content transcription
If your browser does not render page correctly, please read the page content below
CITY OF EDMONTON ANNEXATION APPLICATION

APPENDIX 5.0
CITY OF EDMONTON GROWTH STUDY

                                  MARCH 2018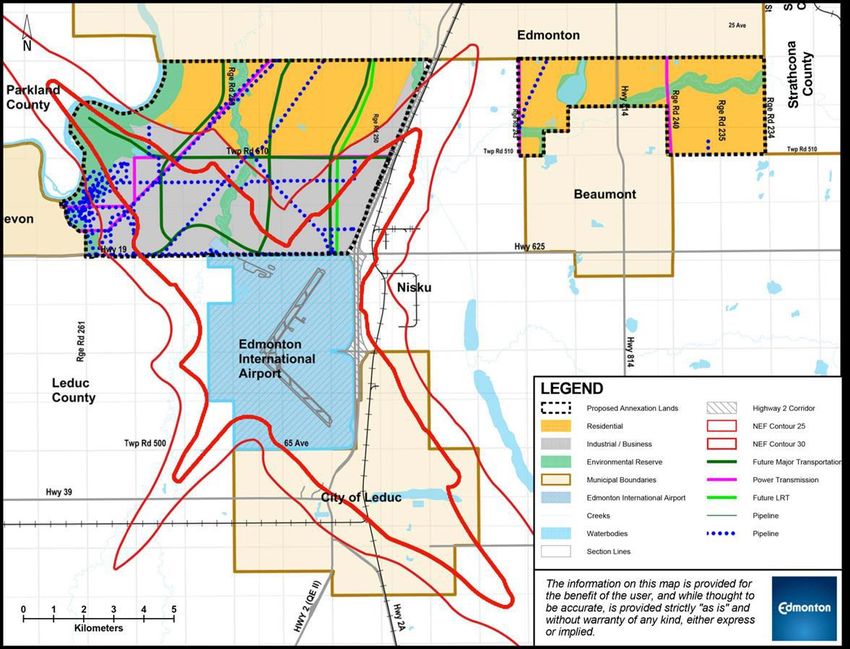
City of Edmonton Growth Study

Submitted to:
City of Edmonton Sustainable Development
Submitted by:
Nichols Applied Management Inc.
Management and Economic Consultants
Suite 2401, 10104 – 103 Avenue NW
Edmonton, Alberta T5J 0H8

March 8, 2018
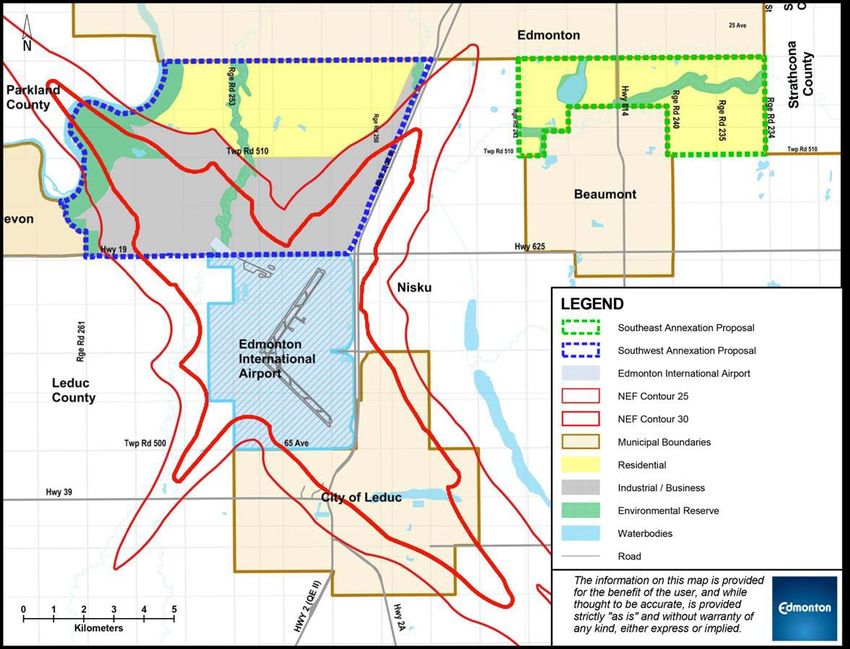
Table of Contents
Table of Contents ...................................................................................................1
1.      Executive Summary...................................................................................3
2.      Background ...............................................................................................4
3.      Edmonton’s Growth Environment ..............................................................5
        3.1     Historical Growth Patterns ............................................................5
        3.2     Regional Setting ...........................................................................8
        3.3     Provincial Setting ........................................................................10
        3.4     Future Growth Outlook ...............................................................12
        3.5     Edmonton’s Regional Role and Importance ...............................13
        3.6     Direction of Growth .....................................................................15
4.      Study Approach .......................................................................................17
        4.1     Residential Land Analysis ..........................................................17
        4.2     Industrial Land Analysis..............................................................18
        4.3     Annexation Area Land Supply ....................................................18
5.      Key Data and Assumptions .....................................................................22
        5.1     City Population Growth ...............................................................22
        5.2     Residential Development ...........................................................24
        5.3     Industrial Development ...............................................................27
        5.4     Annexation Area .........................................................................32
6.      Findings ...................................................................................................39
        6.1     Residential ..................................................................................39
        6.2     Industrial .....................................................................................42
7.      Conclusions .............................................................................................44
8.      References ..............................................................................................45

LIST OF FIGURES
Figure 3.1             City of Edmonton Population, 1916 to 2016 .................................5
Figure 3.2             City of Edmonton Historical Geographic Growth ..........................6
Figure 3.3             City of Edmonton Population 1965 to 2016 ..................................7
Figure 3.4             Housing Starts in the City of Edmonton and Edmonton CMA,
                       1991 to 2016 ...............................................................................10
Figure 3.5             Provincial Average Annual Population Growth Rate ..................11
Figure 3.6             Components of Population Growth, Alberta ...............................12
Figure 3.7             Real GDP Growth for Alberta and Edmonton CMA, Constant
                       dollars .........................................................................................12
Figure 3.8             Edmonton Region Population Forecast Ranges ........................13
Figure 3.9             Regional Growth Constraints .....................................................16
Figure 4.1             Map of Proposed Annexation Lands ..........................................19
Figure 4.2             Visual Representation of Growth Analysis .................................21
Figure 5.1             City Industrial Land Absorption, 2006-2015 (net ha/year)..........29
Figure 5.2             Geographic Distribution of Growth .............................................29
Figure 5.3             Proposed Annexation Area and Land Use .................................33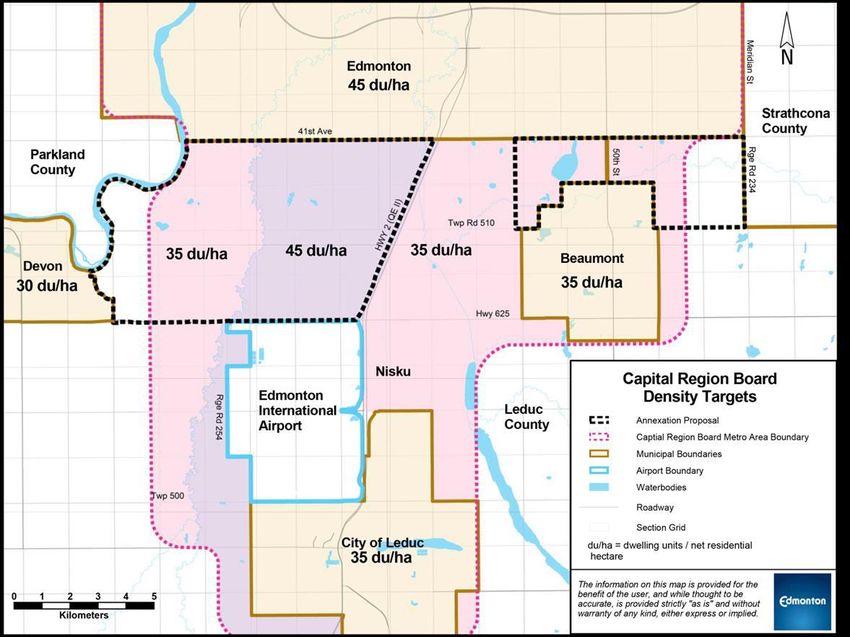
Figure 5.4   Capital Region Board Density Targets .......................................35
Figure 6.1   City Potential Population Growth and Capacity with Annexation
             (Base Case) ................................................................................41
Figure 6.2   City Share of Regional Population .............................................41

LIST OF TABLES
Table 3.1    2016 Regional Population and City Share ...................................8
Table 3.2    Historic Regional Population and City Share ...............................9
Table 5.1    Growth Study Population Forecasts, City of Edmonton .............23
Table 5.2    Housing Types ............................................................................24
Table 5.3    Current Housing Demands by Housing Type, City of Edmonton
             ....................................................................................................24
Table 5.4    Future Demand by Housing Type ..............................................25
Table 5.5    Average Household Size ............................................................25
Table 5.6    Composition of Infill Demand .....................................................26
Table 5.7    City of Edmonton Remaining Supply of Potential Housing Units
             (2015) .........................................................................................27
Table 5.8    Existing Supply of Industrial Lands, City of Edmonton ...............31
Table 5.9    Breakdown of Developable Lands in the Proposed Annexation
             Area ............................................................................................34
Table 5.10   Southeast Area Housing Supply ................................................36
Table 5.11   Southwest Area East of Whitemud Creek Housing Supply........36
Table 5.12   Southwest Area West of Whitemud Creek Housing Supply.......36
Table 6.1    Full Absorption of Existing City Residential Land Supply (year) 1,2
             ....................................................................................................39
Table 6.2    Projected Absorption of Annexation Area Residential Land
             Supply .........................................................................................40
Table 6.3    Exhaustion of Existing Industrial Supply ....................................42
Table A.1    Full Absorption of Existing City Residential Land Supply (year) 1,2
             ....................................................................................................47
Table A.2    Projected Absorption of Annexation Area Residential Land
             Supply .........................................................................................47
Table A.3    Exhaustion of Existing Industrial Supply ....................................47
Table B.1    Key Changes from 2014 Study ..................................................48

APPENDICES
Appendix A   Low Growth Summary ................................................................47
Appendix B   Key Changes from 2014 Report .................................................48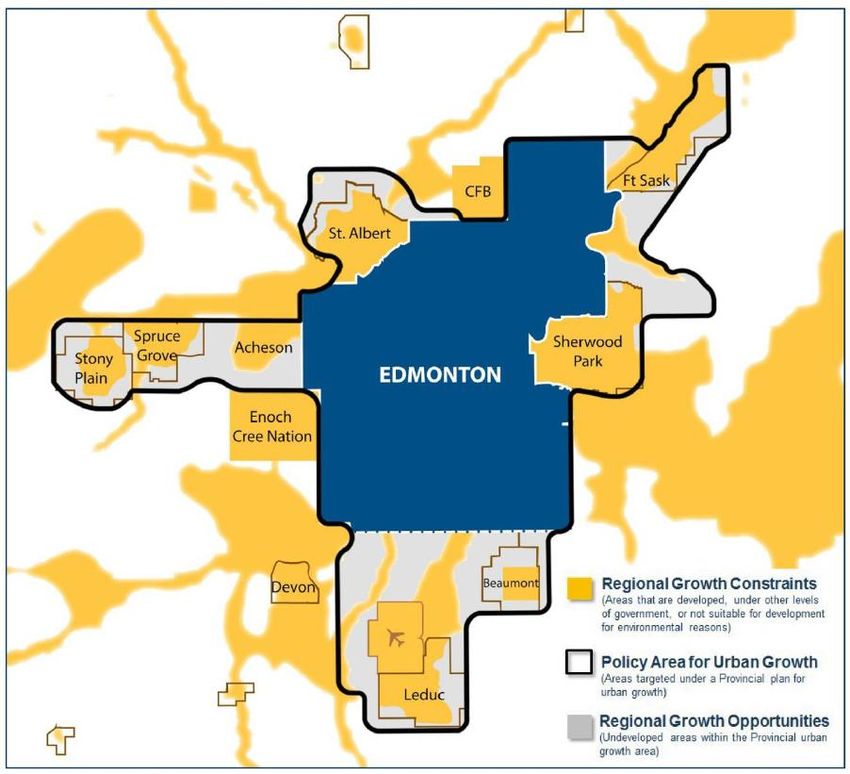
1. Executive Summary
The City of Edmonton has experienced strong long-term growth as the dominant service, industrial,
administrative, and institutional centre in the northern half of Alberta and in the Capital Region. The prominent role
of the City of Edmonton in the broader region has, and will continue to have, a strong positive impact on the
region. The Metro Mayors Alliance report recently identified three particularly important drivers of competitiveness
for city regions such as the Edmonton Metropolitan Region. These include:

•   regional collaboration on economic development;

•   efficient regional public transit; and
•   effective land use planning and infrastructure development.

With approximately 70% of the region’s population and population growth, and a higher percentage of the region’s
jobs, the most comprehensive LRT and bus transit system in the region, and the largest array and highest level of
social infrastructure and services – many of which serve the regional population – the City of Edmonton clearly
has a major role to play in supporting and facilitating improvements in each of these critical areas. Moreover, the
City of Edmonton has the experience and capacity to develop lands at a much higher density than surrounding
communities, making a more efficient use of land and minimizing commuting distances of its residents.

The growth of the City has manifested itself in increasing requirements for land to accommodate the City’s
residential and non-residential development needs. The majority of the City’s growth in the past ten years has
been focused in the southern portion of the City and, as a result, a shortage of residential and industrial lands in
the south part of the City is expected to materialize in approximately 15 and 5 years respectively. When the time
required to plan and service land is taken into account, the City has effectively exhausted its supply of industrial
land to the south.

The proposed annexation area of 8,267 hectares, excluding the Edmonton International Airport, will provide
additional land supply to the City. Specifically, in south Edmonton, the annexation will contribute:
•   lands for the development of low and medium density residential units through to 2051 and 2055 respectively;
    and

•   lands for industrial development through to 2044.

However, if growth materializes as anticipated, the annexation lands will not be sufficient to accommodate all
growth needs of the City beyond 2039. Land shortages in the north are expected in 2039, at which time the
prominent role of the City in the region will begin to erode as growth is captured by other municipalities in the
region if additional lands are not secured.

                                                                                            Growth Study               3
                                                              City of Edmonton – Sustainable Development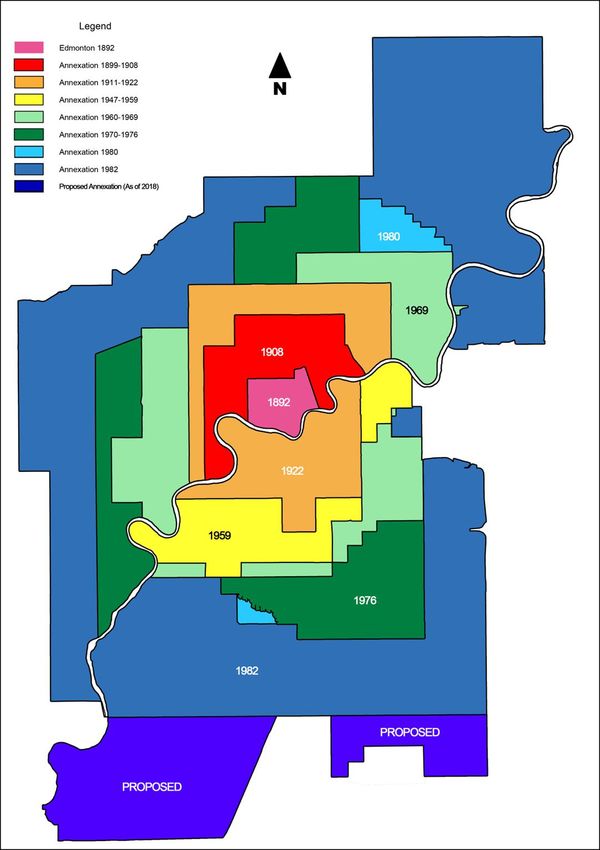
2. Background
In 2013, the City of Edmonton submitted to the Municipal Government Board (MGB) and affected municipal
authorities separate notices of intent to annex lands to the southeast and southwest of the City totaling
approximately 15,700 hectares. The proposed annexation areas were defined on the basis of internal planning
and growth analyses conducted by the City of Edmonton.
Early in 2014, a report: The Case for Annexation was prepared by Nichols Applied Management Inc. (Nichols)
that summarized the City’s growth rationale and needs for the proposed annexation. That summary report was
followed in December 2014 by a full report: City of Edmonton Growth Study, which provided a more extensive
review and quantification of the City’s longer-term growth requirements for land.

These reports and supporting analyses focused primarily on the growth needs of the City to the south. The
Edmonton International Airport lands lie to the south of the annexation area and are not considered within the
analyses in terms of meeting the City’s growth requirements.

In April 2015, the City amended its proposed annexation area in the southeast to include an additional four
quarter sections of land in Leduc County lying adjacent to the northern boundary of the Town of Beaumont. This
amendment increased the City’s potential supply of primarily residential lands by about 260 hectares.

During much of the first half of 2015, the City of Edmonton and Leduc County pursued negotiations during which
the City’s 2014 Growth Study and its underlying assumptions and findings were reviewed extensively in
discussions between the two parties. As the discussions moved to other matters, the City indicated that the initial
Growth Study report would be periodically reviewed and updated to reflect new growth and development data and
relevant changes in local and regional policies and plans.
Over the following months, Nichols assembled and reviewed new municipal census and development data as
they became available, considered updated regional growth forecasts, and examined new local and regional
development policies and other inputs of relevance to an updated growth study. Of particular note was a planned
modification to the proposed annexation area and approved changes to regional density provisions. In August
2016, an interim summary report of the new growth study was prepared and shared with Leduc County on a
confidential basis.

In November of 2016, the City of Edmonton and Leduc County reached an agreement with respect to a modified
annexation area. The revised area implied the need for further changes to the City’s growth study. As well, new
population and other relevant data became available and were incorporated in this updated report. In early 2018,
the City reached an agreement with the Town of Beaumont to further adjust the annexation area to remove nine
quarter-sections of land in the Town of Beaumont from the annexation area. This change necessitated a
subsequent update to the growth analysis which is reflected in this report.

The primary objective of this report is to examine the long-term growth requirements of the City of Edmonton and
to review the implications of and support for the proposed annexation lands within the context of those needs.

                                                                                          Growth Study           4
                                                            City of Edmonton – Sustainable Development
3. Edmonton’s Growth Environment
The foundation for the City of Edmonton’s long-term land requirements will rest on the City’s future economic,
employment, and population growth, which in turn will be strongly tied to growth in the wider region and the
province itself. Edmonton has experienced strong long-term growth as the dominant service, industrial,
administrative, and institutional centre in the northern half of Alberta, and that growth has manifested itself in
increasing requirements for land to accommodate the City’s residential and non-residential development needs.
3.1 Historical Growth Patterns
The City of Edmonton’s long-term growth profile over the past 100 years is shown in Figure 3.1. The City’s growth
trajectory increased significantly in the second half of that period, in parallel with the expanding resource-based
economic growth of the province.
Figure 3.1 City of Edmonton Population, 1916 to 2016
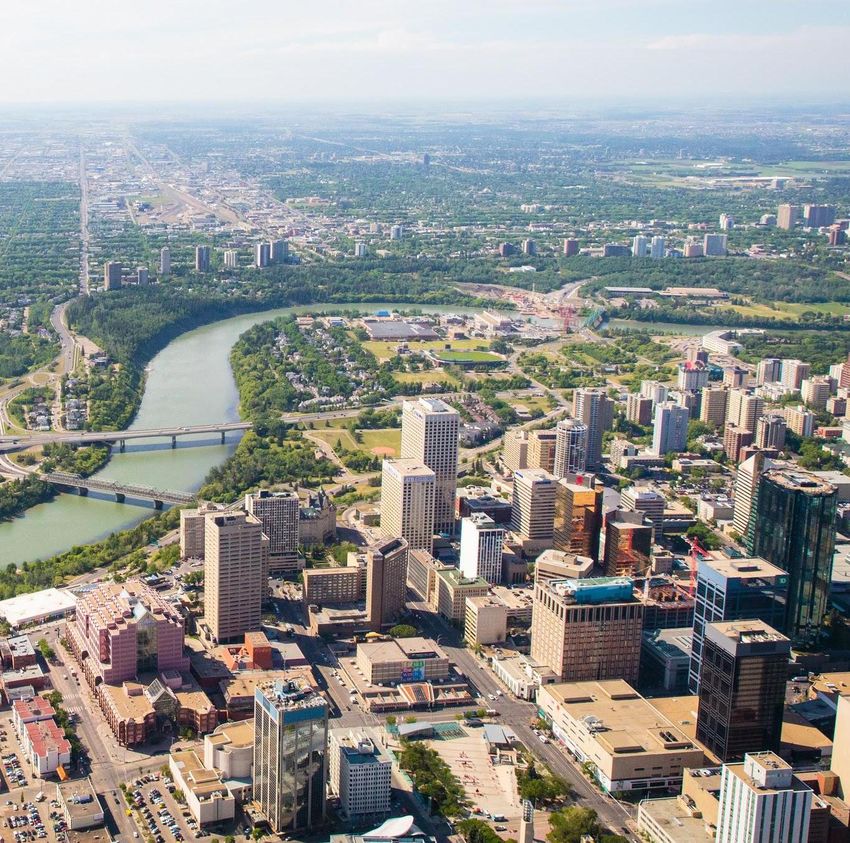
To accommodate that ongoing growth, Edmonton has expanded geographically through periodic annexations to
accommodate new development, as shown in Figure 3.2. The City’s most recent annexation took effect thirty-six
years ago in 1982. The map also identifies the City’s currently proposed annexation, within the context of
historical boundary adjustments.
Growth Study 5
City of Edmonton – Sustainable Development
Figure 3.2   City of Edmonton Historical Geographic Growth

                                                                             Growth Study   6
                                               City of Edmonton – Sustainable Development
Over the years, the City has experienced periodic cycles of faster and slower growth that have reflected changing
levels and fluctuations in global, national, and provincial economic activity. In recent decades, those cycles have
been marked particularly by conditions in the province’s energy sector, which has been an important pillar of the
economy.
Figure 3.3 shows fluctuations in average population growth rates during three distinct periods over the past 50
years:
• The two decades beginning in the mid 1960s and ending in the early 1980s were characterized by strong
population growth of 2.3% annually, slightly below the provincial rate of 2.9%.
• This period of strong growth was followed by nearly two decades of moderate growth – averaging 1.1%
annually, less than the provincial rate of 1.5%.
• Beginning in 2006, the City returned to a period of rapid growth, averaging 2.5% annually – slightly above the
provincial rate of 2.4%.
Over the entire timeframe illustrated, the City accommodated well over an additional one-half million people and
grew by an average of 1.7% annually.
Figure 3.3 City of Edmonton Population 1965 to 2016
1,000
900
800
Population (thousands)
700
2.3% 2.5%
600 per year
per year
500
1.1%
400
per year
300
200
100
-
1966 1971 1976 1981 1986 1991 1996 2001 2006 2011 2016
Data points taken from both municipal and federal censuses.
The strong growth of the City’s population over many years has been driven by both natural population growth
and net in-migration, as rising employment opportunities, particularly during buoyant economic periods, have
drawn new residents from other parts of the country and from overseas. The City has a relatively young
population with an especially large share (33%) of its population comprising young adults within the 20 to 39 year
age cohorts, which is greater than the provincial average (30%).
Growth Study 7
City of Edmonton – Sustainable Development3.2 Regional Setting
The City of Edmonton constitutes the primary centre and dominant urban core of a large metropolitan region
totalling roughly 1.3 million people. The City, with 71% of the region’s population, and more than three-quarters of
the region’s employment1, accommodates the largest and most specialized core of regional commercial,
administrative, education, health care, and housing and social services and facilities. The City serves also as the
central hub for the transportation of people and goods within the region and with other parts of the province. The
City and surrounding region serve as the dominant hub for the northern half of the province and constitute the
northern anchor of the dynamic Edmonton-Calgary corridor economy.
The Edmonton region has doubled its population over 40 years and the Edmonton Metropolitan Region Growth
Plan (EMRGP) anticipates that the region will be home to 2.2 million people by 2044. 2 The City of Edmonton itself
could reach nearly 1.5 million people at that time, according to EMRGP (formerly Capital Region Board)
projections. The City is expected to accommodate a significant share of the region’s growth in the coming
decades.
Several geographic areas have been used by various levels of government to define the broader region
surrounding and serviced by the City of Edmonton including: Census Division 11, the Edmonton Census
Metropolitan Area (CMA), and the Alberta Capital Region/Edmonton Metropolitan Region. Although the actual
geographic boundaries of those regions differ modestly, they all confirm the City’s dominant regional role, as
shown in Table 3.1.
Table 3.1 2016 Regional Population and City Share
City of Edmonton’s
Region Population Share of Region
Census Division 11 1,366,050 68%
Census Metropolitan Area 1,321,426 71%
Capital Region 1,321,498 71%
Source: 2016 population (Statistics Canada 2016c)
The prominence of the City in the broader region is not a recent phenomenon but rather a well-established
characteristic of the region. Census data dating back to 1981 show that the City has, on average, housed 71.3%
of the Capital Region’s population (Table 3.2).
1 Schedule 1. Population and Employment Projections 2014-2044, Edmonton Metropolitan Region Growth Plan. Oct. 13,
2016.
2 Ibid.
Growth Study 8
City of Edmonton – Sustainable DevelopmentTable 3.2 Historic Regional Population and City Share
Capital Region City of Edmonton City of Edmonton’s
Year Population Population Share of Region
1981 731,310 529,924 72.5%
1986 795,249 576,249 72.5%
1991 854,046 618,195 72.4%
1996 870,929 616,306 70.8%
2001 932,556 666,104 71.4%
2006 1,041,479 730,372 70.1%
2011 1,161,593 812,201 69.9%
2016 1,321,499 932,546 70.6%
Source: Alberta Official Population lists, 2016 population (Statistics Canada 2016c)
The City of Edmonton’s Municipal Development Plan: The Way We Grow3 affirms the City’s policy goal to
“identify, support and maintain Edmonton as the major growth centre in the Region” and to maintain the City’s
“share of regional population and business growth within its boundaries in support of the growth of regional
employment centres”.
The City’s significant role in accommodating residential housing is consistent with the City’s share of regional
population growth. Figure 3.4 shows, for illustration purposes, Edmonton’s annual housing starts relative to the
regional total, for the twenty-five year period 1991 to 2016. Housing starts in the City of Edmonton as a proportion
of the Edmonton CMA have increased over the past 25 years from 60% in 1991 to 72% in 2016 (CMHC 2016,
Figure 3.4), a further indication that growth in the broader region has, and continues to be, dominated by the City
of Edmonton. Additionally, the profile of Edmonton’s housing stock itself departs materially from that for other
communities in the region; the City accommodates a much greater share of rental versus owned housing, much
more multi-family and higher-density housing, and a far greater level of affordable and social housing. For
example, in 2016, only 2% of all apartment units and 8.5% of all attached dwellings in the Edmonton CMA were
located in communities outside of the City of Edmonton (Statistics Canada 2016).
3 The Way We Grow, Edmonton Municipal Development Plan. Bylaw 1510, 2010, p.78.
Growth Study 9
City of Edmonton – Sustainable DevelopmentFigure 3.4 Housing Starts in the City of Edmonton and Edmonton CMA, 1991 to 2016
City of Edmonton | Edmonton CMA
10,036
7,263
4,285
2,552
1991 1996 2001 2006 2011 2016
Source: CMHC 2016
The City of Edmonton is also the hub for regional employment. In 2014, the City of Edmonton was home to
approximately 78% of the jobs in the Capital Region (CRB 2015) as compared to 72% of the population. This
comparatively large share of employment to population is a result of the growth of some communities in the region
that meet residential growth needs but which offer fewer employment opportunities, resulting in a resident base
that commutes to a workplace in the City and other parts of the region.
Edmonton’s role in the region as the major employment hub is supported by its central core area, which
accommodates business, governmental, health, and education services; by its large industrial zones in the
south/southeast, northwest, and northeast peripheries; and by substantial commercial office and retail/services
developments accessible to major transportation arteries in various parts of the City. Many of the City’s
commercial businesses and institutional services support a wide regional customer base.
3.3 Provincial Setting
The growth experienced by Edmonton and its encompassing region is linked, to a significant degree, to the
province’s energy sector. Alberta has historically sustained one of the highest population growth rates in the
country, leading all provinces over the past 10 years (Figure 3.5). Despite reduced energy prices in recent years,
the 2016 federal census confirms that the province’s relatively strong growth has been sustained.
Growth Study 10
City of Edmonton – Sustainable DevelopmentFigure 3.5 Provincial Average Annual Population Growth Rate
NS 5 Year NS 10 Year
2011 to 2016 2006 to 2016
NB NB
NL NL
MB PEI
PEI QU
ON ON
QU MB
BC BC
SK SK
AB 2.1% AB 2.2%
0.0% 0.5% 1.0% 1.5% 2.0% 2.5% 0.0% 0.5% 1.0% 1.5% 2.0% 2.5%
Source: Statistics Canada.
The population growth in the province, region, and City is comprised of two primary components, namely natural
growth and migration. Specifically, natural growth is the product of the natural human lifecycle and shaped by the
mortality and fertility rates of the population base whereas the migration component consists of the movement of
people to and from the area, most particularly international and interprovincial migration. Migration is closely tied
to the prevailing economic conditions and employment opportunities. In periods of substantial economic growth,
in-migration is needed to meet local labour requirements.
In Alberta, the natural growth in the population has remained relatively constant since 2001, whereas international
and interprovincial migration has contributed to much of the variability in population growth over time (Figure 3.6).
This relationship between economic growth and in-migration at a provincial level also manifests itself at the
regional and City level.
Growth Study 11
City of Edmonton – Sustainable DevelopmentFigure 3.6 Components of Population Growth, Alberta
Natural Growth | Interprovincial Migration | International Migration
140
120
Number of Persons, thousands
100
80
60
40
20
0
-20
2001 2006 2011 2016
Source: Alberta Treasury Board and Finance 2016.
3.4 Future Growth Outlook
Both Alberta and the Edmonton region are subject to economic cycles that include periods of strong growth and
occasional downturns accompanied by reduced population growth. The strong congruence between the City of
Edmonton and the province as a whole can be seen in Figure 3.7 which depicts the GDP of both the City and
province over time. Despite the recent recessionary conditions that materialized in 2015 in the province, and
within the Edmonton region, the belief is that provincial and regional growth has resumed and in the longer term
will remain generally consistent with historical growth experience. As illustrated in Figure 3.7, the Conference
Board of Canada believes that positive growth returned to the province and the City in 2017 and will continue
through the 2018-2021 period.
Figure 3.7 Real GDP Growth for Alberta and Edmonton CMA, Constant dollars
6%
Percentage Change in GDP
4%
2%
0%
-2%
-4%
-6%
Source: Statistics Canada 2016d, Conference Board of Canada 2017
Growth Study 12
City of Edmonton – Sustainable DevelopmentPopulation forecasts for the Edmonton region prepared by Alberta Treasury Board and Finance as well as the
Capital Region Board suggest a resumption of growth ranging between 1.0% and 2.1% per year as shown in
Figure 3.8.
Figure 3.8 Edmonton Region Population Forecast Ranges
Census Division 11 Capital Region
2,400 2,400
2,200 2,200
2,000 2,000
1,800 1,800
1,600 1,600
1,400 1,400
1,200 1,200
1,000 1,000
2015 2020 2025 2030 2035 2040 2015 2020 2025 2030 2035 2040
Source: Alberta Treasury Board and Finance 2016b, Capital Region Board 2015.
3.5 Edmonton’s Regional Role and Importance
The long-term outlook for the Edmonton region is promising, and the City of Edmonton’s role as the central and
dominant regional hub is expected to remain undiminished. Continued prominence in the region is a goal of the
City, as articulated in its Municipal Development Plan (8.1.2): “… [to] support and maintain Edmonton as the
major growth centre in the Region” the City “will maintain its share of regional population and business growth
within its boundaries”. Important planning policies in support of those planning goals include the following:
3.2.1.1 Ensure a combination of single family and multi-family housing development potential is
available for the next 30 years.
3.2.1.2 Ensure there is sufficient land available to sustain economic opportunities.
3.2.1.3 Achieve a balance between residential, industrial, commercial, institutional, natural and
recreational land uses in the City through land development policies and decisions.
The Edmonton Metropolitan Region Growth Plan, prepared by the Capital Region Board in 2016, provides a 50-
year vision and integrated policy framework for the Edmonton region. The plan incorporates a number of key
strategies for managing the region’s growth, increasing liveability in the region, and improving the region’s global
economic competitiveness. The City of Edmonton provides a number of critical underpinnings and supports
toward the Plan’s goals, including:
• The City’s leadership in achieving responsible regional growth through compact and contiguous development,
and improved efficiency in land use.
Growth Study 13
City of Edmonton – Sustainable Development• Promoting job growth and competitiveness, in part by ensuring the City’s ability to accommodate a variety of
employment activities and to provide the land, services, and infrastructure required to support those activities.
• The City’s role as the major services and infrastructure hub of the region and its efforts to improve the
provision, integration and efficiency of critical regional facilities and services.
• The City’s support for the achievement of complete communities through improved access to jobs, a wide
range of commercial and supportive services, amenities, housing, and the development of multi-modal
transportation systems.
The City’s continued ability to support the region in these and other areas will assist the region in meeting its long-
term strategic goals.
A number of the regional goals and needs identified in the Capital Region Board’s 50-year strategic plan are
echoed in a 2016 report commissioned by nine mayors that represent 95% of the population of the Edmonton
Metropolitan Region: Be Ready or Be Left Behind 4. The report’s objective was to provide advice on how to make
the Metro Region globally competitive. Among the “ingredients” cited by the report as necessary to build a globally
competitive region was the importance of city concentrations:
Regions are strengthened by the concentrations of people, business and services that their municipalities
offer. For instance, a city is often where one finds a wide range of private and non-profit business and
services, specialized health professionals, post-secondary institutions and cultural opportunities. A city
typically has good connectivity, with built-out transit and transportation networks. People and businesses
in a region need their city to be strong and vibrant for two critical reasons: to provide thrust for the overall
region’s economy and to offer greater amenities.
The Metro Mayors Alliance report also identified three particularly important drivers of competitiveness for city-
regions such as the Edmonton Metropolitan Region. These include regional collaboration on economic
development, efficient regional public transit, and effective land use planning and infrastructure development.
With approximately 70% of the region’s population and population growth, and a higher percentage of the region’s
jobs, the most comprehensive LRT and bus transit system in the region, and the largest array and highest level of
social infrastructure and services – many of which serve the regional population – the City of Edmonton clearly
has a major role to play in supporting and facilitating improvements in each of these critical areas.
To sustain the City’s ability to provide these supports and to add further to a strengthened “concentration of
people, business and services”, it is incumbent on the City to continue to accommodate a significant share of
regional growth, and to grow in a balanced way residentially, commercially, industrially, and institutionally.
A recent study published in 2015 by the Organization for Economic Cooperation and Development (OECD),
entitled “The Metropolitan Century, Understanding Urbanisation and its Consequences,” provides an insightful
analysis of global urbanization and the positive implications of larger cities and associated metropolitan areas in
terms of enhanced economic growth and performance, and of the lessons gleaned regarding the elements of
successful cities and regions. The report findings lend further confirmation of the potential local, regional, and
provincial benefits of the continued growth and regional prominence of the City of Edmonton within its region.
In particular, the OECD report notes the following:
4 Be Ready, or Be Left Behind. Report of the Advisory Panel on Metro Edmonton’s Future. May 31, 2016. Page 9.
Growth Study 14
City of Edmonton – Sustainable Development• Larger cities are more productive, the result of deeper labour markets, greater opportunities for specialization
and competition, increased clustering/agglomeration benefits, greater access to desirable amenities and
services, and a diverse intellectual and entrepreneurial environment.
• The potential needs and economic benefits in larger centres for effective public transportation planning,
provision and integration. As the central transportation hub for the region and the locus for a large and inter-
connected bus and LRT system, Edmonton is best positioned to play the major role in ensuring the continued
development of a well-functioning public transport system in the region, with optimal routings, equipment,
schedules, and fares. This in turn requires the City to grow, to achieve required population densities that will
support the transit systems, and to have the financial capacity to develop and operate expanded transit
systems. While larger centres are best positioned to provide effective transportation systems, the OECD
report indicates that better connected cities grow faster.
• The potential negative implications associated with the containment of city growth and limitation on city land
supply. These include effects on city housing prices and the consequent encouragement of longer-distance
commuting to outlying communities, and with that, a reduced access to jobs and to city amenities and
services. This also can place added congestion pressures on regional transportation systems.
In sum, the City’s and the surrounding region’s long-term growth outlook appears strong, and that strength will be
mutually enhanced to the extent that the City of Edmonton is able to grow and to maintain a dominant role in the
region’s continued development.
3.6 Direction of Growth
In its proposed update to the region’s growth plan, the Capital Region Board (now the Edmonton Metropolitan
Region Board) reviewed the region’s ambitions, growth constraints, and attitudes towards limiting urban sprawl,
and has identified opportunities for urban growth in all areas surrounding the City of Edmonton. The Edmonton
Metropolitan Region Growth Plan provides a comprehensive and integrated policy framework for responsible
growth tailored to the regional context. The structure of the Plan's policy framework consists of three policy tiers
(Rural, Metropolitan, and Metropolitan Core) which provide the foundation for managing employment and
population growth in the Region. The City's proposed annexation is within the Metropolitan area - a policy tier
identified to reflect the general direction of future urban growth that optimizes existing and planned infrastructure.
As illustrated in Figure 3.9, growth opportunities for the City are shaped by policy, existing development patterns
and environmental considerations. Given the presence of existing constraints to the west (Acheson, and Enoch
Cree Nation), north (St. Albert, CFB Edmonton, and Fort Saskatchewan), and east (Strathcona County), the most
logical growth path for the City is to the south, where a land supply with the capacity to support a balance of
residential and industrial development has been identified.
Growth Study 15
City of Edmonton – Sustainable DevelopmentFigure 3.9 Regional Growth Constraints
Growth Study 16
City of Edmonton – Sustainable Development4. Study Approach
Nichols has quantified the long-term land requirements of the City of Edmonton for residential, commercial, and
industrial uses under a variety of growth scenarios. Those needs have been compared, in turn, to the remaining
supply of land within the City and also with the additional supply that would accrue under the proposed
annexation. The following sections provide a conceptual overview of the analysis carried out to determine the
future residential and non-residential land needs of the City of Edmonton. The general modelling approach taken
is consistent with that used in the 2014 study; however, this report reflects more recent data, a series of modified
assumptions that incorporate additional analyses conducted by the study team, and intervening changes to a
number of regional and municipal policies with respect to issues such as densities and housing mixes in the
proposed annexation area.
4.1 Residential Land Analysis
The analysis of future residential growth needs in the City of Edmonton was carried out as follows:
1) regional population forecasts to 2044 approved by the Capital Region Board (CRB) in 2015 were used as
a basis for the region’s future growth;
2) a share of regional population growth was allocated to the City of Edmonton;
3) using historical data regarding average household sizes and preferred housing types, the population
growth allocated to the city was translated into additional housing units of various types (i.e., low,
medium, and high density units);
4) the total demand for new housing identified in step (3) was adjusted downwards to reflect infill
development that is expected to meet a portion of new housing needs without requiring new lands; and
5) the balance of the demand for housing units was further apportioned to the north and south parts of the
City in a manner consistent with past and current settlement patterns and preferences.
Having identified the demand for housing units expected to require the development of new lands within the City,
the study team then estimated the remaining supply of land and potential additional housing units that would be
available to accommodate future housing growth from within current City boundaries. In brief:
6) an estimate of planned housing units as identified in area (ASP) and neighborhood (NSP) structure plans
for new growth areas was compiled;
7) an estimate of built housing units as identified in various data sources, including municipal taxation data,
was compiled; and
8) the tabulation of built units in step (7) was subtracted from the estimates of potential units established in
step (6) to arrive at an estimate of the undeveloped supply of potential housing units that remain in new
growth areas within the City’s current boundaries.
Having defined the potential supply of new housing units available in the city’s remaining growth areas and the
anticipated future demand for housing units, the study team then determined when the remaining supply capacity
Growth Study 17
City of Edmonton – Sustainable Developmentfor the various types of housing (low, medium, and high density) would be exhausted in both the north and south
sectors of the city.
The commercial land requirements associated with future residential development in the city’s growth areas are
encompassed within the study’s residential land needs analyses.
4.2 Industrial Land Analysis
The approach taken for the industrial land analysis is similar in concept to that taken for the residential sector. In
brief:
1) The current remaining supply of undeveloped industrial lands within the northwest, northeast and
south/southeast areas of the City was determined, based on City source documents. The industrial lands
were identified and categorized into either conventional industrial or petrochemical uses to reflect the
unique plans for a portion of the new Edmonton Energy and Technology Park (EETP), located in the
City’s northeast.
2) Overall City industrial land absorption levels were projected into the future based on historical levels
indexed in future years to the City’s projected growth in population. The geographic distribution of
demand for industrial land in various areas of the City was determined based on past geographic market
share patterns and anticipated market dynamics. The petrochemical lands within EETP are examined
separately from the conventional industry demand analyses and are assumed to be absorbed within the
City’s projected build-out period for those particular lands. It should be noted that, inherent in this
approach to estimating future industrial land demand, is the maintenance of the historic ratio between
population, employment, and land area required to support particular employment types.
Having defined the existing supply of industrial lands and the anticipated future demands, the study team
determined that the City’s current supply of industrial lands is insufficient to meet the City’s long-term growth
needs. The potential supply deficiency is particularly pressing and indeed imminent within the City’s southern
sector.
4.3 Annexation Area Land Supply
The City’s projected shortage of lands for both residential (including associated commercial) and industrial
purposes was examined within the context of the annexation lands proposed by the City to accommodate growth.
The earlier 2014 study assumed an annexation area of 15,675 gross ha (including the Edmonton International
Airport lands), as defined in the City’s original 2013 Notice of Intent to Annex lands, and included growth areas to
the southeast and southwest of the City. The City subsequently revised its Notice of Intent to Annex on April 15,
2015 to add approximately 260 hectares to the original (2014) proposal. Those additional lands included nine
quarter sections that were once located in Leduc County but were subsequently awarded to the Town of
Beaumont in an annexation order effective January 1, 2017.
Over the 2014-2017 period, as negotiations proceeded between the City of Edmonton and both Leduc County
and the Town of Beaumont, the proposed annexation area was further modified. The net effect being that the
overall annexation area was reduced to 8,267 gross ha, down from the 15,935 ha in the 2015 Notice of Intent.
Most notably, the Edmonton International Airport and, apart from a 1.6 kilometers of right-of-way (ROW) for
Highway #814/50 Street, the nine quarter sections located within the Town of Beaumont were removed.
Growth Study 18
City of Edmonton – Sustainable DevelopmentFigure 4.1 provides a detailed view of the proposed annexation area, identifying those lands under the jurisdiction
of Leduc County and the Town of Beaumont, and identifying as well the location of the predominantly residential
and non-residential land uses that will provide growth opportunities for the City.
Figure 4.1 Map of Proposed Annexation Lands
The proposed annexation area and its land development capacity and supply implications to the City have been
reflected in the City’s growth needs modelling in the following manner:
1) the annexation area was examined by the City in terms of environmental features, utilities rights-of-way,
current land development, and other potential development constraints that may affect the ability of lands
to meet future growth needs;
2) the net developable hectares estimated to be available for residential, as well as associated commercial
development, were translated into the potential supply of housing units using a housing mix and target
density consistent with proposed CRB densities for the subject lands;
Growth Study 19
City of Edmonton – Sustainable Development3) the net developable hectares available for potential industrial development were quantified;
4) the potential supply of housing units identified in step (2) and the future demand for housing not satisfied
by the existing land supply in the City’s south sector were then compared to determine when the supply of
specific housing units (low, medium, and high density) in the annexation area would be exhausted; and
5) the supply of industrial land identified in step (3) and the future demand for industrial land not satisfied by
the existing supply in the City were then compared to determine when the supply of industrial land in the
annexation area would be exhausted. Within this process, recognition was given to the competitive effects
of adjacent County industrial lands on the expected phasing and take-up of the City’s proposed
annexation industrial lands.
The Edmonton International Airport (EIA) lands, which are no longer included in the proposed annexation area,
are not considered in the residential, commercial, and industrial land supply or demand projections within the
growth study modelling. Also, the Highway #814/50 Street ROW is not included in the developable land supply.
A visual representation of the modelling approach and key assumptions, as outlined in the preceding portion of
the report can be seen in Figure 4.2.
Growth Study 20
City of Edmonton – Sustainable DevelopmentFigure 4.2 Visual Representation of Growth Analysis
POPULATION GROWTH
Low and high (base) scenarios to 2044 from Capital Region Board forecast
Extended from 2044-2066 (1.3% per year low, 1.5% per year high)
City captures 70.57% of regional growth
RESIDENTIAL
Housing Mix Household Size Distribution
Density
LDR 55% to 50% LDR 2.8 North 41%
SW 45 and 35 units/ha
MDR-R 10% to 13% MDR-R 2.8 South 59%
RESIDENTIAL SE 35 units/ha
MDR-A 29% to 29% MDR-A 1.8 Infill 13% to 25%
Capacity
HDR 5% to 8% HDR 1.5 (timeframe 20
LDR 30 units/ha
Timeframe 20 years years)
MDR-R 60 units/ha
MDR-A 125 units/ha
CITY DEMAND
HDR 225 units/ha
Projected Demand Distribution Commercial (8% gross)
137 net ha/year 30% NE, 30% NW, 40% S net of EETP
Indexed to population petrochemical development
INDUSTRIAL growth Equal annual development of EETP
Source: Historical city-wide over 50 years from 2018
absorption
Unmet
ANNEXATION
Demand
Available Units
LDR (46,971 south, 59,726 north)
MDR-R (9,692 south,9,634 north)
RESIDENTIAL
MDR-A (29,076 south, 28,901 north)
HDR (11,133 south, 13,945 north)
Source: ASP/NSP less absorbed units
INDUSTRIAL
EXISTING Available Land
CITY SUPPLY SW 1,952 net ha
Available Land Existing industrial land
South 481 net ha development deducted.
NW 684 net ha 70% of demand lost to
INDUSTRIAL NE 122 net ha North Nisku in the short
EETP 3,329 net ha (63% to conventional industry) term
Source: Vacant Industrial Land Supply 2015, Sustainable Development
Department
Growth Study 21
City of Edmonton – Sustainable Development5. Key Data and Assumptions
This section of the report summarizes the key data and assumptions relied on in the Growth Study update.
5.1 City Population Growth
In May 2015, the CRB released updated population projections relating to its member municipalities and to the
region overall. The projections were provided for two scenarios (low and high) and extend over a period of 30
years to 2044. The new CRB projections relied in part on previous CRB population forecasts prepared in 2013
and directed users to rely on both sets to calculate population values at five-year intervals. The CRB forecast
period (2014 to 2044) is not sufficiently long to allow for an investigation of growth over 50 years and does not
reflect the 2016 federal census results.
Accordingly, the study team made the following adjustments to the CRB forecasts, by:
• adjusting 2016 values to align with the 2016 federal census for all CRB communities;
• applied the growth rates inherent in the 2015 CRB study to the 2016 census values;
• extended the forecast beyond 2044 by using the average annual growth rate from the 2029 to 2044 period
(1.29%) in the low growth case; and
• extended the forecast beyond 2044 by using an average annual growth rate of 1.5%, a reduction below the
CRB rate of 1.7% for the 2029 to 2044 period, in the high growth case.
With regard to the City of Edmonton, the CRB forecasts incorporate one notable change between the low and
high growth scenarios. In the low growth scenario, the CRB figures show the City of Edmonton nearly maintaining
over time its present share of the regional population – approximately 70%. In the high growth scenario,
Edmonton’s share of the region’s population is shown to decline to approximately 66% by 2044. In order to draw
the City’s overall share of the region down to 66%, the actual share of new growth being captured by the City
would need to be in the range of 61% to 62% over the forecast period – a significant departure from historic
trends.
The Growth Study therefore modified the CRB work and assumed that, in the absence of land supply constraints,
Edmonton will maintain its current share of regional population over the forecast horizon of 50 years as articulated
in section 3.2. This assumption is consistent with historical data and government policy. The balance of this report
addresses the future growth needs under the high-growth scenario. A series of Tables summarizing the
implications of the low-growth scenario are contained in Appendix A.
Growth Study 22
City of Edmonton – Sustainable DevelopmentTable 5.1 Growth Study Population Forecasts, City of Edmonton
Year ----------Low---------- ----------High1----------
2
Population AAGR Population AAGR
2016 932,500 932,500
2017 949,800 1.88% 954,600 2.37%
2018 967,400 1.88% 977,300 2.38%
2019 985,300 1.88% 1,000,600 2.38%
2020 1,000,800 1.60% 1,020,800 2.02%
2021 1,016,600 1.60% 1,041,400 2.02%
2022 1,032,700 1.60% 1,062,400 2.02%
2023 1,048,900 1.60% 1,083,900 2.02%
2024 1,065,500 1.60% 1,105,900 2.03%
2025 1,082,300 1.60% 1,128,300 2.03%
2026 1,099,400 1.60% 1,151,300 2.03%
2027 1,116,700 1.60% 1,174,700 2.03%
2028 1,134,300 1.60% 1,198,600 2.04%
2029 1,152,200 1.60% 1,223,100 2.04%
2030 1,166,900 1.29% 1,243,100 1.65%
2031 1,181,900 1.29% 1,263,500 1.65%
2032 1,197,000 1.29% 1,284,200 1.65%
2033 1,212,300 1.29% 1,305,300 1.65%
2034 1,227,800 1.29% 1,326,700 1.65%
2035 1,243,500 1.29% 1,348,500 1.65%
2036 1,259,400 1.29% 1,370,700 1.65%
2037 1,275,500 1.30% 1,393,200 1.65%
2038 1,291,900 1.30% 1,416,100 1.65%
2039 1,308,400 1.30% 1,439,500 1.65%
2040 1,325,100 1.30% 1,463,200 1.65%
2041 1,342,100 1.30% 1,487,300 1.65%
2042 1,359,300 1.30% 1,511,800 1.65%
2043 1,376,600 1.30% 1,536,800 1.65%
2044 1,394,300 1.30% 1,562,200 1.65%
2045 1,412,100 1.30% 1,585,600 1.50%
2046 1,430,200 1.30% 1,609,400 1.50%
2047 1,448,500 1.30% 1,633,600 1.50%
2048 1,467,000 1.30% 1,658,100 1.50%
2049 1,485,800 1.30% 1,682,900 1.50%
2050 1,504,800 1.30% 1,708,200 1.50%
2051 1,524,000 1.30% 1,733,800 1.50%
2052 1,543,500 1.30% 1,759,800 1.50%
2053 1,563,300 1.30% 1,786,200 1.50%
2054 1,583,300 1.30% 1,813,000 1.50%
2055 1,603,500 1.30% 1,840,200 1.50%
2056 1,624,100 1.30% 1,867,800 1.50%
2057 1,644,800 1.30% 1,895,800 1.50%
2058 1,665,900 1.30% 1,924,200 1.50%
2059 1,687,200 1.30% 1,953,100 1.50%
2060 1,708,800 1.30% 1,982,400 1.50%
2061 1,730,700 1.30% 2,012,100 1.50%
2062 1,752,800 1.30% 2,042,300 1.50%
2063 1,775,200 1.30% 2,073,000 1.50%
2064 1,797,900 1.30% 2,104,100 1.50%
2065 1,820,900 1.30% 2,135,600 1.50%
2066 1,844,200 1.30% 2,167,700 1.50%
1 The high scenario has been used as the “base case”.
2 Average Annual Growth Rate
3 Numbers rounded for presentation purposes
Growth Study 23
City of Edmonton – Sustainable Development5.2 Residential Development
5.2.1 Housing Demand by Unit Type
The City of Edmonton offers a number of different types of housing units that together meet the unique needs and
preferences of its diverse population. These various housing types are summarized in Table 5.2.
Table 5.2 Housing Types
Unit Type Acronym Description
Low Density LDR Single detached homes, semi-detached homes, duplex units.
Medium Density MDR-R Row housing, triplex units, collective residences.
Row
Medium Density MDR-A Apartment-style housing with less than five stories.
Apartment
High Density HDR Apartment-style housing with five or more stories.
The mix of housing types has a direct bearing on the amount of land required to accommodate the City’s
residential growth. In order to understand how the population growth outlined in Section 5.1 relates to the future
demand for particular housing types, the study team translated the population forecast into demand for various
housing unit types by reviewing previous development trends, average household sizes, and adjusting for
anticipated changes in housing preferences.
Building permits data for the 2006 to 2015 period collected by the City of Edmonton indicate that the demand for
housing types in the City is dominated by a preference for LDR units (55%) followed by low-rise apartments
(29%), row houses (11%), and high-rise apartments (5%), as shown in Table 5.3. A similar profile of the current
demand for housing types in the City can be seen in a number of other data sources, including municipal and
federal censuses and housing data.
Table 5.3 Current Housing Demands by Housing Type, City of Edmonton
Proportion of Building
Unit Type Permits 2006-2015
LDR 55%
MDR-R 11%
MDR-A 29%
HDR 5%
Source: City of Edmonton
Note: Figures have been rounded for presentation purposes
Statistics Canada research demonstrates that housing preferences in Canada’s largest cities are shifting over
time, revealing that demand is indeed shifting from single detached dwellings to attached forms of housing
development. While lifestyle changes may account for some of the shift, the changing demand is also the result of
affordability considerations, increased immigration to mid-sized cities, aging population profiles, shrinking
household sizes, and increasing land costs related to growth and local policies.
In recognition of shifting trends in housing and of municipal and regional policies that emphasize increased
density, the study team adjusted the profile of housing demand when calculating future growth needs.
Specifically, it was assumed that, over a 20-year time period, consumer preferences with respect to dwelling types
Growth Study 24
City of Edmonton – Sustainable Developmentwill evolve from the current profile (Table 5.3) to one which demonstrates an increased desire for medium and
high density units. The future demand profile can be seen in Table 5.4.
Table 5.4 Future Demand by Housing Type
Future Proportion of
Unit Type
Housing Demand (% units)
LDR 50%
MDR-R 13%
MDR-A 29%
HDR 8%
In combination with the foregoing housing profiles, average household sizes as defined in Edmonton’s Terms of
Reference for the Preparation and Amendment of Neighbourhood Structure Plans (Table 5.5) were applied to
distribute the City’s future growth among the specific dwelling unit types.
Table 5.5 Average Household Size
Unit Type Household Size
LDR 2.8
MDR-R 2.8
MDR-A 1.8
HDR 1.5
Source: City of Edmonton Terms of Reference for the Preparation and Amendment of Neighbourhood Structure Plans 2014.
It should be noted that the assumption of an increased housing share for medium- and high-density units has the
effect of reducing the overall amount of land required to accommodate future growth. If consumer preferences do
not change to the extent assumed, the City may require additional lands beyond those estimated in the study.
5.2.2 City Infill Development
The need for new land to accommodate residential growth is related, in part, to the degree of redevelopment
occurring within established and mature areas of the City. Lot subdivision, high density redevelopment and
repurposing, and other forms of residential intensification allow for the accommodation of population growth
without the consumption of new lands. The City of Edmonton has a target to meet 25% of housing demand
through infill development in the future (City of Edmonton 2010).
Between 2006 and 2015, infill development in the city as a proportion of all new residential development varied
between a high of 19.8% in 2008 to a low of 4.9% in 2009, averaging approximately 14% over the ten year period.
In 2016, the City achieved its policy target of seeing 25% of new development occurring in mature
neighbourhood. However, the success in 2016 is not believed to be indicative of a new sustained level of infill and
the variance seen over the 2006 to 2015 period is expected to continue. For the purposes of estimating the
residual future demand for housing units on currently undeveloped land in the outlying growth areas, the study
team has assumed that infill development will increase over a 20-year period from the long term average level of
14% of the total new housing market to the policy target of 25%.
Increasing the proportion of housing demand met by infill has the effect of reducing the rate at which the City’s
current supply of undeveloped land is consumed and limiting the demand for additional lands outside the City. If
Growth Study 25
City of Edmonton – Sustainable Developmentthe City does not achieve the full 25% infill target as rapidly as assumed by the study team, the needs for
additional lands outside the City will be enlarged and advanced.
For the purposes of estimating how infill development will affect the demand for housing units on undeveloped
lands, the study team examined building permits data for mature neighbourhoods, and estimated the demand
profile for infill units to be as defined in Table 5.6. These estimates were applied to the infill housing estimates and
the results netted by type of housing from the aggregate City housing projections in order to yield the housing
demand estimates for developing growth areas.
Table 5.6 Composition of Infill Demand
Future Proportion of
Unit Type Housing Demand (% units)
LDR 23%
MDR-R 8%
MDR-A 53%
HDR 16%
Source: City of Edmonton
5.2.3 Geographic Distribution of Growth
In addition to a preference for particular housing types (Section 5.2.1), households have also displayed clear
geographic preferences within the City. A review of building permits data for the 2006 to 2015 period revealed that
approximately 59% of housing units in Edmonton’s new growth areas were developed south of the North
Saskatchewan River, the remainder to the north5. Accordingly, the future demand for housing units in the City not
met by infill development has been allocated 59% and 41% to the south and the north of the river, respectively.
This geographic distribution of City growth is assumed to persist over the forecast period, and if a shortage of
housing supply materializes in either of the City’s north or south sectors, it has been assumed that the unsatisfied
demand will not transfer to the opposite sector within the City but rather will accrue to other residential locations in
the region within the same geographic sector.
In summary, the future demand for City housing has been refined to reflect a desire for various housing types,
reduced to allow for a portion of demand to be met by infill development, and subsequently allocated
geographically north and south of the river, within the limits permitted by potential City housing supply in each of
those areas.
5.2.4 Market Dynamics
In practice, it is unlikely that the supply of residential land within the City’s existing south sector would become
fully exhausted prior to development extending into the proposed annexation area if annexation occurs.
Development economies in terms of planning, design, servicing, and construction as well as the need to offer an
adequate choice of housing products to the market will likely induce developers to begin developing and
marketing within the annexed area as the available supply begins to dwindle in the City. Accordingly, a portion of
the future demand for housing in the south sector is assumed to begin occurring in the annexation area five years
5 Within the southern portion of the City, growth has historically occurred 62% in the west and 38% in the east quadrants of
the City.
Growth Study 26
City of Edmonton – Sustainable DevelopmentYou can also read