Gender Series Volume III: Gender patterns in Transport, 2013 - Report number
←
→
Page content transcription
If your browser does not render page correctly, please read the page content below
Gender Series Volume III:
                               Gender patterns in Transport, 2013

Report number: 03-10-15
ISBN: 978-0-621-44988-4

Gender Series Volume III: Gender Patterns in Transport, 2013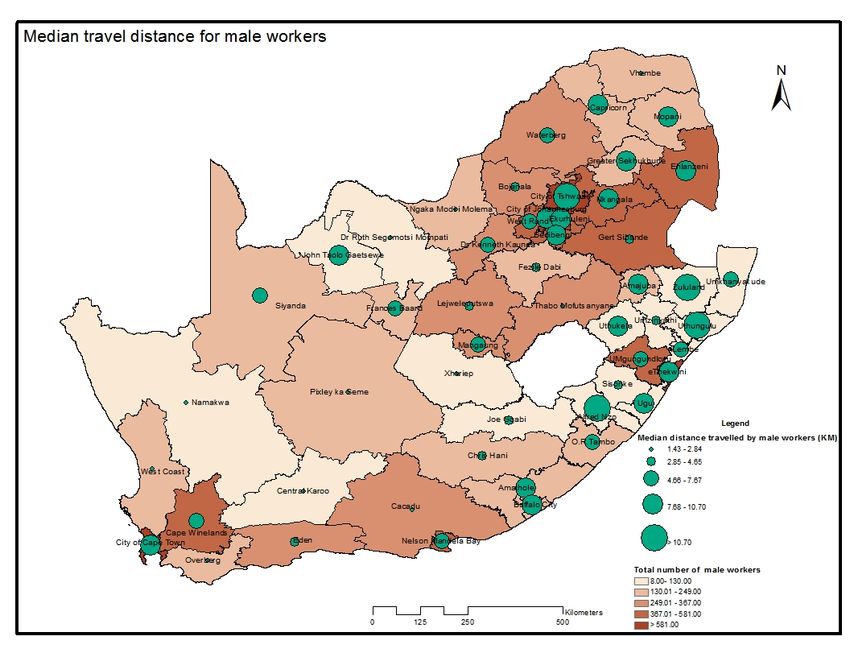
STATISTICS SOUTH AFRICA                                        2

Gender Series Volume III: Gender patterns in Transport, 2013 / Statistics South Africa

Published by Statistics South Africa, Private Bag X44, Pretoria 0001

© Statistics South Africa, 2016
Users may apply or process this data, provided Statistics South Africa (Stats SA) is acknowledged as the
original source of the data; that it is specified that the application and/or analysis is the result of the user's
independent processing of the data; and that neither the basic data nor any reprocessed version or
application thereof may be sold or offered for sale in any form whatsoever without prior permission from Stats
SA.

Stats SA Library Cataloguing-in-Publication (CIP) Data
Gender Series Volume III: Gender patterns in Transport, 2013 / Statistics South Africa. Pretoria: Statistics
South Africa, 2016

Report no. Gender Series Volume III: Gender patterns in Transport, 2013
90pp

ISBN 978-0-621-44988-4

A complete set of Stats SA publications is available at Stats SA Library and the following libraries:

             National Library of South Africa, Pretoria Division
             National Library of South Africa, Cape Town Division
             Library of Parliament, Cape Town
             Bloemfontein Public Library
             Natal Society Library, Pietermaritzburg
             Johannesburg Public Library
             Eastern Cape Library Services, King William’s Town
             Central Regional Library, Polokwane
             Central Reference Library, Mbombela
             Central Reference Collection, Kimberley
             Central Reference Library, Mmabatho

This report is available on the Stats SA website: www.statssa.gov.za

For technical enquiries please contact:
Tshepo Mabela
Email: tshepomab@statssa.gov.za

Gender Series Volume III: Gender Patterns in Transport, 2013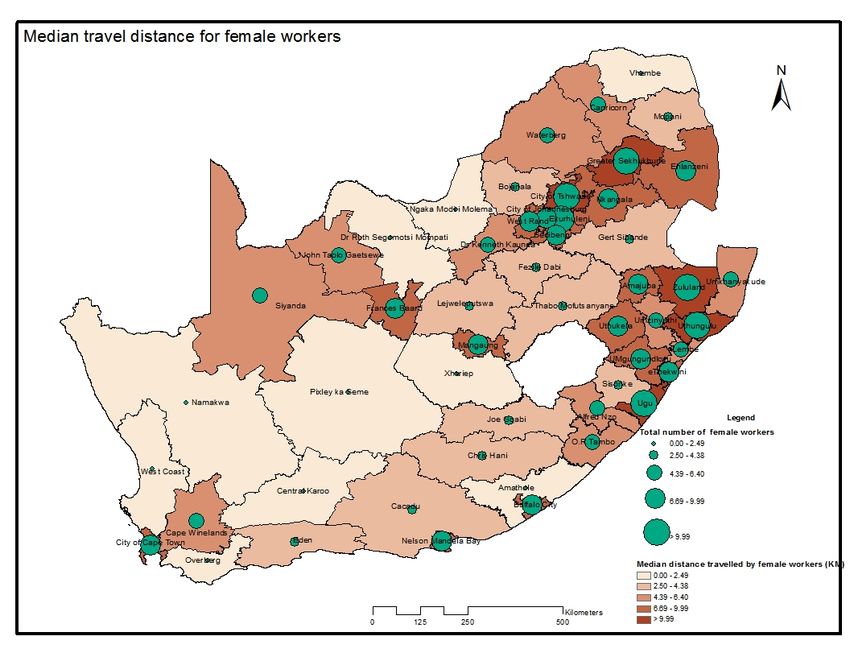
STATISTICS SOUTH AFRICA                                                   3

Contents

List of tables ........................................................................................................................... 4
List of figures ......................................................................................................................... 6
Foreword ................................................................................................................................ 8
CHAPTER 1: INTRODUCTION ............................................................................................. 9
Legislation ............................................................................................................................ 10
Objective and layout of the report ........................................................................................ 11
Data sources ........................................................................................................................ 11
Definitions and abbreviations ............................................................................................... 11
CHAPTER 2: GENERAL PATTERNS IN TRANSPORT...................................................... 13
DAY TRIPS .......................................................................................................................... 13
Reasons for not travelling .................................................................................................... 22
Driver’s licences ................................................................................................................... 24
CHAPTER 3: MODE OF TRANSPORT TO EDUCATION INSTITUTIONS ......................... 27
CHAPTER 4: WORK AND BUSINESS-RELATED GENDER TRAVEL PATTERNS .......... 36
Travel for work ..................................................................................................................... 36
Main mode of travel to place of employment ....................................................................... 37
Distances travelled from places of origin to work................................................................. 68
Travel for business trips ....................................................................................................... 71
Average number of business trips per month ...................................................................... 74
Factors influencing household travel choice ........................................................................ 76
Attitudes and perceptions about transport ........................................................................... 78
CONCLUSION AND RECOMMENDATIONS ...................................................................... 82
APPENDIX A ....................................................................................................................... 88

Gender Series Volume III: Gender Patterns in Transport, 2013
STATISTICS SOUTH AFRICA                                                     4

List of tables

Table 2.1: Day trips by sex and population, 2013 ............................................................................. 14

Table 2.2: Day trips by sex and geotype with gender parity ratios, 2013 ......................................... 15

Table 2.3: Day trips by sex and main mode of transport, 2013 ........................................................ 16

Table 2.4: Overnight trips by sex, main purpose and population group, 2013.................................. 17

Table 2.5: GPR of overnight trips by population group, 2013 ........................................................... 18

Table 2.6: Overnight trips by sex and geotype ................................................................................. 19

Table 2.7: Reasons for not travelling by sex and population group, 2013 ........................................ 22

Table 2.8a: Persons aged 18 years and older who are in possession of a driver's license by
population group and sex, 2003 and 2013........................................................................................ 24

Table 2.8b: The percentage difference of Persons aged 18 years and older who are in possession
of a driver's license by population group and sex, between the year 2003 and 2013 ...................... 25

Table 3.1: GPR of the main mode of transport to pre- and normal school by geotype, 2013 ........... 29

Table 3.2: Reasons for walking to educational institution by sex and geotype, 2013 ....................... 30

Figure 3.3: Municipalities with learners aged 5–20 years, who walk for 30 minutes or more to get to
their education institution .................................................................................................................. 31

Table 3.3: Top 25 municipalities with the highest numbers of male and female learners, aged 5–20
years, who walk for 30 minutes or more to get to their education institution .................................... 32

Table 3.4: Municipalities with a GPR of 1,3 or higher for male and female learners who walk for 30
minutes or more to get to their education institution ......................................................................... 33

Table 4.1: Working-age population by population group and sex, 2013 ........................................... 36

Table 4.2: Main mode of travel to place of employment by sex, 2013 .............................................. 37

.......................................................................................................................................................... 37

Table 4.3: Type of vehicle used to drive to work............................................................................... 38

Table 4.4: Main mode of travel to place of employment by geotype and sex, 2013 ......................... 40

Table 4.5: Main mode of travel to employment for males and females by age................................. 44

Table 4.6: Main mode of transport to place of employment by monthly household income (quintiles),
2013 .................................................................................................................................................. 46

Table 4.7: Main mode of transport used to get to work by presence of a minor child....................... 48

Gender Series Volume III: Gender Patterns in Transport, 2013
STATISTICS SOUTH AFRICA                                                     5

Table 4.8: Time taken to travel to work in minutes by sex, 2013 ...................................................... 53

Table 4.9: Mean travel time in minutes to work by province and sex, 2013 ..................................... 53

Table 4.10: Mean travel time in minutes to work by age groups and sex, 2013 ............................... 54

Table 4.11: Mean travel time in minutes to place of work by province, sex and age groups, 2013 .. 54

Table 4.12: Mean travel time in minutes to place of work by age groups, sex and geotype, 2013 ... 55

Table 4.13: Gender parity ratios for time taken to get to places of employment, 2016 ..................... 57

Table 4.14: Number of different travel modes used to get to work by sex, 2013 .............................. 58

Table 4.15: Number of different travel modes used to travel to place of employment by sex and
province, 2013 .................................................................................................................................. 60

Table 4.16: Gender parity ratios for number of travel modes used to travel to place of employment
by income, 2013 ............................................................................................................................... 62

Table 4.18: Time leaving for work by sex, 2013 ............................................................................... 65

Table 4.19: Time of leaving for work by geotype and sex, 2013....................................................... 65

Table 4.20: Time of leaving for work by sex and population group, 2013......................................... 66

Table 4.21: Mean and median travel distances of men and women in the 25 DC’s where women
had the longest median travel distances to work, by sex, 2013........................................................ 70

Table 4.22: Main mode of travel for business trips, 2013 ................................................................. 71

Table 4.23a: Main mode of travel for those undertaking business trips by province, 2013: Males ... 72

Table 4.23b: Main mode of travel for those undertaking business trips by province, 2013: Females
.......................................................................................................................................................... 72

Table 4.24a: Main mode of travel for business trips by age, 2013: Males ........................................ 73

Table 4.24b: Main mode of travel for business trips by age, 2013: Females.................................... 74

Table 4.25: Factors affecting transport mode of employed persons by sex of the household head,
2013 .................................................................................................................................................. 76

Table 4.26: Factors affecting transport mode to place of employment by population group, 2013 .. 76

Table 4.27: Factors affecting choice of transport mode for business trips by geotype, 2013 ........... 77

Table 4.28: Main transport-related problems experienced by male- and female-headed households,
2013 .................................................................................................................................................. 78

Table 4.29: Satisfaction with bus services, 2013 .............................................................................. 80

Table 4.30: Satisfaction with taxi services, 2013 .............................................................................. 81

Table A1: Mean and median travel distances of men and women by sex, 2013 .............................. 88

Gender Series Volume III: Gender Patterns in Transport, 2013
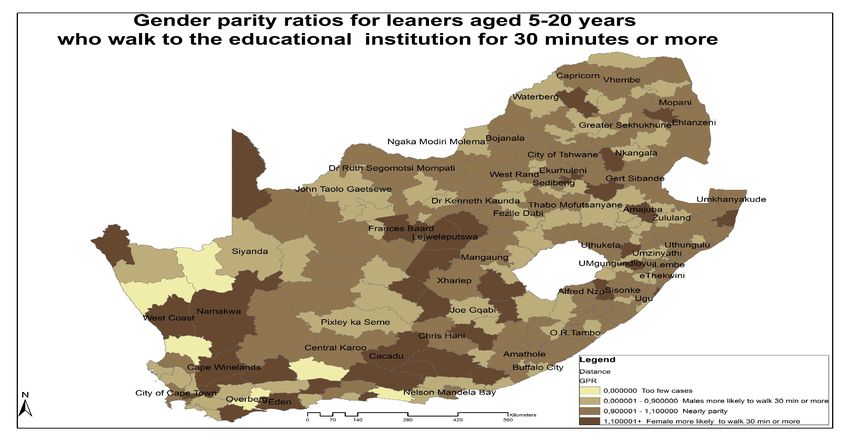
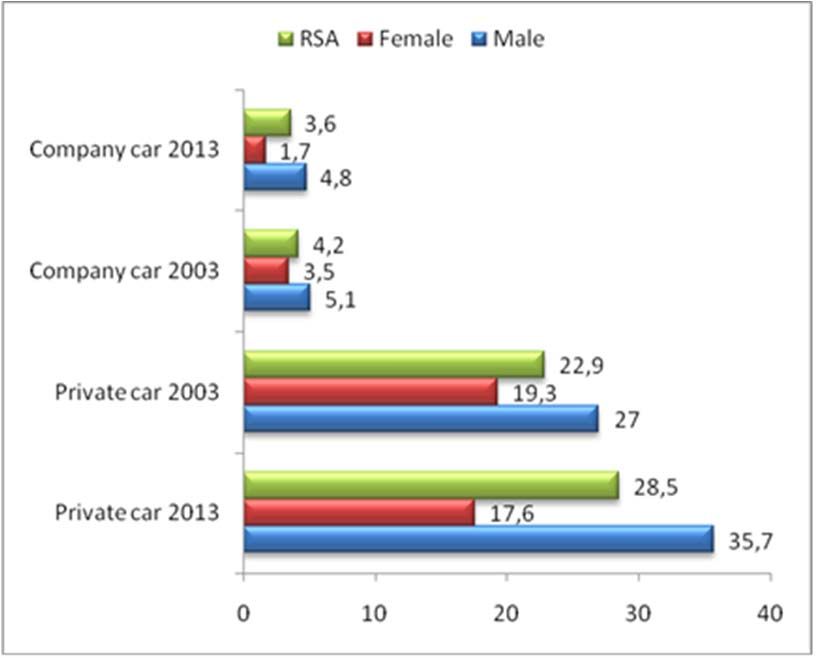
STATISTICS SOUTH AFRICA                                               6

List of figures

Figure 2.1: Health care facility visited first during illness by sex of household head, 2015 .............. 20

Figure 2.2: Mode of travel to health facility by sex ............................................................................ 21

Figure 2.3: Time taken to health care facility by sex, 2015 ............................................................... 21

Figure 2.4: Reasons for not travelling by province, 2013.................................................................. 23

Figure 2.5: Access to company and private cars by sex of the household head, 2003 and 2013 .... 25

Figure 3.1: Main mode of transport to a PSET facility by sex and population group, 2013 .............. 27

Figure 3.2: Main mode of transport to pre- and grade (1-12) school by sex and geotype, 2013 ...... 28

Map 3.1: GPR per municipality for male and female learners who walk for 30 minutes or more to get
to their education institution .............................................................................................................. 34

Figure 4.1: Main mode of travel to place of employment by sex, 2013............................................. 37

Figure 4.2: Percentages of males and females who dropped off or picked up passengers on the way
to and from work by geotype, 2013................................................................................................... 38

Figure 4.3: Main mode of travel to place of employment by geotype, 2013 ..................................... 39

Figure 4.4: Walking, cycling and driving all the way to work by sex and geotype, 2013................... 40

Figure 4.5a: Main modes of transport to places of work by province: Males .................................... 41

Figure 4.5b: Main modes of transport to places of work by province: Females ................................ 42

Figure 4.5c: Gender parity ratios for main modes of transport to places of work by province .......... 43

Figure 4.6: Gender parity ratios for main modes of transport to places of work by age ................... 45

Figure 4.7: The use of public transport by household income (quintiles) and sex 2013 ................... 47

Figure 4.8: Percentages of males and females who needed a vehicle at places of employment for
work purposes on the travel day by geotype, 2013 .......................................................................... 47

Figure 4.9: Male and female percentage point differences in main mode of transport used to get to
work by presence of a minor child .................................................................................................... 49

Figure 4.10a: Main mode of travel to work by number of minor children present in a household and
sex: For metros, 2013 ....................................................................................................................... 50

Figure 4.10b: Main mode of travel to work by number of minor children by sex: Urban, 2013 ......... 51

Figure 4.10c: Main mode of travel to work by number of minor children by sex: Rural, 2013 .......... 52

Gender Series Volume III: Gender Patterns in Transport, 2013
STATISTICS SOUTH AFRICA                                                     7

Figure 4.11: Time taken to travel to work – total in minutes, 2013 ................................................... 53

Figure 4.12: Time taken to get to places of employment by sex and municipalities-persons who
travelled 30 minutes or more, 2016 .................................................................................................. 56

Figure 4.13: Number of travel modes used to travel to place of employment by sex and geotype,
2013 .................................................................................................................................................. 58

Figure 4.14: Number of travel modes used to travel to place of employment by population group and
sex, 2013 .......................................................................................................................................... 59

Figure 4.15: Gender parity ratios for number of travel modes used to travel to place of employment
by population group, 2013 ................................................................................................................ 60

Figure 4.16: Monthly income quintiles by number of travel modes used to travel to work, 2013...... 61

Figure 4.17: Average monthly cost of travel by transport modes used to travel to work and sex, 2013
.......................................................................................................................................................... 62

Figure 4.18: Percentages of males and females who received cash for public transport to travel to
and from work by geotype, 2013 ...................................................................................................... 64

Figure 4.19: Percentage differences in time for leaving for work for males and females by geotype,
2013 .................................................................................................................................................. 66

Figure 4.20: Gender parity ratios for time of leaving for work to travel to places of employment ..... 67

by population group, 2013 ................................................................................................................ 67

Map 4.1: Percentage of male workers per district council and their median travel distances from
their place of origin to work ............................................................................................................... 68

Map 4.2: Percentage of male workers per district council and their median travel distances from
their place of origin to work ............................................................................................................... 69

Figure 4:21: Average number of business trips per month, age group and sex, 2013 ..................... 74

Figure 4:22: Average number of business trips per month by population group and sex, 2013 ....... 75

Figure 4.23: Percentage differences in main problem experienced by male- and female-headed
households, 2013 ............................................................................................................................. 79

Gender Series Volume III: Gender Patterns in Transport, 2013
STATISTICS SOUTH AFRICA                                        8

Foreword

Provision of transportation services in the pre-democratic era was treated as the privilege for a few.
The task to ensure an inclusive transportation system by government has been an enormous one.
This improved system has to be effective and sensitive to individuals’ unique demographic and
socio-economic needs. Through the legislative framework, which recognises that transport is pivotal
to efforts to ensure participation of the majority of South Africans in the economy, the country has
made noticeable improvements to the transport system since 1994. However, in recent years, there
have been calls to explore the extent to which existing frameworks respond to the needs of the most
vulnerable members of the society such as women, children and persons with disabilities. The focus
of this report is therefore to analyse data from the National Household Travel Survey of 2013
through a gendered lens. This is done to provide a broader understanding of experiences and
needs of males and females in terms of access and the reliability of transportation services.

While implementing an inclusive change is a long and daunting task, it is crucial to constantly
measure the direction in which the country is moving. Neglecting issues of gender in policy reform
work post the democratic elections would be setting the country’s transformation agenda back.
Transport, the world over, has been known to prioritise the needs of men over those of women. This
could be attributed to cultural practices that insisted on the domestication of women and ignored
that even domestic duties require viable transportation systems. As the findings of this report will
point out, women’s general travel patterns reflect that they are still expected to carry out duties
associated with the provision of care. This alone forces government to perceive transport with a
gendered lens. .

The transport patterns revealed in this report also suggest that the opening of doors to previously
male-dominated sectors, such as education and the labour market, to females inadvertently lead to
increased demands for affordable and effective transport systems. As you will see, females were
more likely to use public forms of transportation to travel to institutions of learning and to work. A
lack of accessible public transport therefore undermines the gains made by governments in its plans
for the economic emancipation of girls and women. This report purposely advances our
understanding about how inadequate access to transport could affect men and women.

Dr Pali Lehohla
Statistician-General

Gender Series Volume III: Gender Patterns in Transport, 2013
STATISTICS SOUTH AFRICA                                              9

CHAPTER 1: INTRODUCTION

In recent years, South Africa has seen a growing number of publications relating to travel mode
choices. Various studies have considered a range of impact factors, including individual and
household socio-demographics. Although gender has played an important role in international
literature regarding transport since about 1980 (Uteng 2006)1, gendered travel mode patterns, a
focus of, amongst other factors, car deficient households and system attributes in the country, is a
newly emerging focal area in transport-related research. The purpose of this report is therefore to
build onto existing research by looking at transport with a gendered view. The report aims to
highlight gender differences in not only general travel patterns but also types of modes of transport
used by males and females for travel.

A number of key theories drawn from work on gender differences in travel behaviour are discussed
below to explain travel behaviour differences between men and women. Despite a certain amount of
overlap, these theories are associated with various disciplines and hypothetical perspectives. Even
though the theories discussed are mainly based on international research, they nonetheless provide
a context under which the results of the current report can be understood.

Economic power theories: Gender differences in economic resources and related gendered
power structures are highlighted in feminist research and economics. Most prominent is a focus on
women's relatively low incomes and restricted access to labour markets (Blumen, 1994)2 due to
occupational segregation and women's 'spatial entrapment' in certain spatial contexts (MacDonald,
1999)3. Even between partners who share their household budget or bank account, inequality in
economic power may be at play because of unequal contributions to this budget. In an extended
form the economic power hypothesis may be termed 'access to resources', among which money is
only the most prominent.

Social roles theories: Sociological theories highlight social roles that may commit women more so
than men to taking on household and family responsibilities that limit their economic independence.
In transport studies this hypothesis was developed mainly in the 1980s. Wen and Koppelman
(2000)4 support this framework by arguing that in households with fewer cars than drivers, the
allocation of cars is dependent on activity allocation. Accordingly, 'male roles' as well as 'female
roles', i.e. employment as well as maintenance activity obligations (household work, childcare) may
increase a household member's chances of accessing a car.

Patriarchy theories: Feminist theory highlights patriarchal power relations that may operate over
and above economic inequalities. This 'dual system oppression' borne by capitalism and patriarchy
(Walby, 1990)5 impacts social role patterns, the availability of resources, and norms. Observed
gender differences in travel mode choice and activity patterns are thus subject to power relations,
particularly to women's weak negotiating positions in the household or in the labour market.

1
    Uteng Priya, T. 2006. Mobility: Discourses from the non-western immigrant groups in Norway, Mobilities 1(3) pp. 435-462.
2
    Blumen, O. 1994. Gender differences in the journey to work. Urban Geography 15(3), 223-245.
3
    MacDonald, H. I. 1999. Women’s employment and commuting: explaining the links. Journal of Planning Literature 13(3), 267-283.
4
    Wen, C.H., Koppelman, F.S. 2000. A conceptual and methodological framework for the generation of activity-travel patterns.
Transportation 27(1), 5-23.
5
    Walby, S. 1990. Theorizing Patriarchy. London: Blackwell.

Gender Series Volume III: Gender Patterns in Transport, 2013
STATISTICS SOUTH AFRICA 10 These hypotheses should not be understood as being independent of each other. For instance, gendered social roles on the intra-household level may be an outcome or a driver of inequality between two partners' economic power. Patriarchy may drive economic inequality, but economic inequality may also help maintain patriarchy over time. The notion of preference assumes individual freedom of choice, but preferences may have their roots in societal traditions and may therefore operate on the basis of patriarchy, inequality and culturally defined social roles. Thus, preferences may mirror societal power relationships rather than having much explanatory power in themselves. Legislation This section presents the legislative framework in terms of policies and measures put in place in South Africa to ensure effective and accessible transportation systems. The Department of Transport sees itself as having a fundamental responsibility to conduct sector research, formulate legislation and policy to set the strategic direction of subsectors, assign responsibilities to public entities and other levels of government, regulate through setting norms and standards, and monitor implementation. The following legislation has thus been put in place: The White Paper on Transport of 1996 is perceived as the key policy document in transport whose over-arching goal is to guide legislation and planning for all transport sectors. National Land Transport Act of 2009. The act aims to provide for the transformation and restructuring of the national land transport system. It regulates and governs the transportation of passengers for reward. This Act was built upon the National Land Transportation Act of 2000 which laid the foundation for the restructuring and transformation of land transport. National Transport Master Plan (Natmap) 2050: This presents the long-term vision which is believed will sustain South Africa’s projected growth and focus on integrated transport planning to ensure that the different modes of transport complement one another. The National Development Plan (NDP) 2030: The transport sector is viewed as critical toward realising the implementation of the NDP 2030 which is government’s vision of advanced economic development, job creation, growth, and provision of equitable access to opportunities and services for all, while fostering an inclusive society and economy. While the Department of Transport has taken the redress of apartheid policies, which treated the delivery of effective transport services as a privilege, in its stride there remains a scant legislative framework which directly addresses issues of gender in transport. Legislated undertakings on gender would aid the Department of Transport in its efforts to ensure sustainable and equitable mobility. Gender explicit policies are necessary as literature stresses that men and women have varying transportation needs6. 6 Mashiri, M., Buiten, D., Mahapa, S., Zukulu, R. 2005. Towards setting a research agenda around mainstreaming gender in the transport sector. CSIR. Gender Series Volume III: Gender Patterns in Transport, 2013
STATISTICS SOUTH AFRICA                                        11

Objective and layout of the report

The purpose of this report is to provide analysis relating to gender and transport using secondary
data from Stats SA’s National Household Travel Survey (NHTS) and the Community Survey of
2016. Chapter 1 is introductory and briefly discusses transport in relation to gender and theory. This
chapter also seeks to establish the rationale for producing the report. The rest of the report employs
descriptive analysis to provide male and female differences in travel patterns as well as in modes
used to travel for the years 2013 and 2016. Analyses in this report mainly focused on three broad
areas. General transport patterns and establishing transport patterns in education, which are
discussed in chapters 2 and 3 respectively, while transport, work and gender are covered in chapter
4. Chapter 5 concludes the report by providing a summary of key findings and recommendations.
The present report titled “Gender Series III” lays the foundation for a series of future reports within
the theme of gender and transport. The data published with each report released from this series
aims to move away from the narrow confines of transport-related studies by highlighting that gender
has a significant impact on transport and travel patterns.

Data sources

Statistics South Africa’s National Household Travel Survey (NHTS) of 2013 was used as the primary
data source to compile this report. The NHTS is a joint venture between Statistics South Africa
(Stats SA) and the Department of Transport (DoT). Its data collection took place between January
and March 2013 where a total of 51 341 households and/or dwelling units were sampled using a
random stratified sample design. The findings that emanate from this survey are useful to various
government spheres as they help with policy planning, development and implementation strategies.
As additional data sources, both the 2016 Community Survey (CS) and the 2015 General
Household Survey (GHS) which were conducted by Stats SA were used. For the Community
Survey, Stats SA visited approximately 1,3 million sampled households across the country. Unlike
a census, not every household was visited; only those that were sampled. The CS is the
biggest survey that Stats SA undertakes outside of the census. The GHS is an annual household
survey conducted by Stats SA since 2002. The survey replaced the October Household Survey
(OHS) which was introduced in 1993 and was terminated in 1999. The survey is an omnibus
household-based instrument aimed at determining the progress of development in the country. It
measures, on a regular basis, the performance of programmes as well as the quality of service
delivery in a number of key service sectors in the country.

Definitions and abbreviations

Bakkie – A light delivery vehicle which is a truck of one ton or less.

BRT bus – Bus Rapid Transit bus system

Bus – A road-based public transport vehicle that can carry more than about 18 passengers.

Business trip – A trip taken during the course of one’s work for business purposes. It does not
include trips to one’s usual place of work but focuses on trips 20 km or more away from the usual
place of work. A business trip can be a day or overnight trip or both.

Gender Series Volume III: Gender Patterns in Transport, 2013
STATISTICS SOUTH AFRICA                                        12

Gautrain – An 80-kilometre (50 mile) mass rapid transit railway system in Gauteng province, South
Africa, which links Johannesburg, Pretoria, EkuRhuleni and OR Tambo International Airport.

Gender parity ratio – Refers to the proportion of males to females in a given population, usually
expressed as the number of males per 100 females.

IRT bus – Integrated Rapid Transit bus system

Main destination – The place which was visited in order to accomplish the main purpose of the trip.

Main purpose of the trip – The purpose in the absence of which the trip would not have been
made to a given destination. A travel party, i.e. a group of people making a trip together, has by
conversion only one main purpose for the trip. For example, a person accompanying his/her spouse
on a business trip will still have the main purpose as business.

Metered taxi – A sedan, cab or minibus which contains a meter which enables the operator to
charge a passenger a rate per kilometre travelled.

Metro – Metropolitan municipalities defined by the Municipal Structures Act which include the entire
jurisdictions of Cape Town, EkuRhuleni, eThekwini, Nelson Mandela Bay, Buffalo City, Mangaung,
Johannesburg and Tshwane.

Minibus-taxi – A 10–16 seater vehicle which operates an unscheduled public transport service for
a reward.

Mode of travel – Types or means of transport used for travel purposes. This includes non-
motorised transport e.g. walking all the way or animal-drawn vehicles.

Overnight trip – A trip where one night is or more are spent away from the dwelling unit. The focus
was on trips 20 km or more away from the usual place of residence.

Public transport – All transport services for which passengers made payment including trains,
buses and taxis.

Travel day – One randomly selected day of the week for which the detailed travel patterns of
household members were recorded.

Travel time – Time between departure from home and arrival at the destination.

Trip – A one way movement from an origin to a destination to fulfil a specific purpose or undertake
an activity.

 ABBREVIATIONS

DoT – Department of Transport

GPR – Gender parity ratios

NHTS – National Household Travel Survey

PSET – Post-School Education and Training

Stats SA – Statistics South Africa

Gender Series Volume III: Gender Patterns in Transport, 2013
STATISTICS SOUTH AFRICA                                        13

CHAPTER 2: GENERAL PATTERNS IN TRANSPORT
                                                                                                                               7
Transport should not be perceived as a gender neutral phenomenon according to the World Bank .
Females and males have varying transport needs and travel patterns that transport policies should
take into cognisance. These could help to ensure equitable access to eminent resources such as
education, health care and the labour market. This section presents data taken from the National
Household Travel Survey of 2013 on general travel patterns of South Africans. It also aims to
showcase different modes of transport utilised by males and females.

DAY TRIPS
The analysis below looks at day trips which, according to the NHTS 2013, were defined as trips
taken to the destination from the usual place of residence. These trips exclude trips taken to
education facilities and work. NHTS 2013 data were used to detail different gender patterns in travel
by population groups, geographic location and transport mode used for travel.

7
 Making transport work for women and men: Challenges and opportunities in the Middle East. Lessons from case studies (2011) World
Bank Report, Middle East and North Africa region, Transport and Energy Unit.

Gender Series Volume III: Gender Patterns in Transport, 2013
STATISTICS SOUTH AFRICA 14
Table 2.1: Day trips by sex and population, 2013
Main purpose of day trip Male Female
Black African Coloured Indian/Asian White RSA Black African Coloured Indian/Asian White RSA
No % No % No % No % No % No % No % No % No % No %
Home for leisure/holiday 330 391 4,0 21 898 2,9 15880 5,0 96 700 7,4 464 869 4,4 306 858 3,3 28 102 3,4 14288 4,8 93 119 6,8 442 367 3,8
Leisure/holiday
176 377 2,1 91 060 12,1 31983 10,1 304 968 23,4 604 388 5,7 174 016 1,9 97 715 11,7 32996 11,1 288 722 20,9 593 448 5,1
Shopping –business 267 157 3,2 23 873 3,2 23164 7,3 103 159 7,9 417 353 3,9 211 266 2,3 26 224 3,1 8578 2,9 72 214 5,2 318 282 2,7
28,
Shopping – personal 2 362 822 28,6 178 179 23,7 114640 36,0 341 856 26,2 2 997 498
2
3 096 723 33,6 245 429 29,5 121394 40,9 412 288 29,9 3 875 834 33
Sporting – spectator 107 800 1,3 8 319 1,1 6824 2,1 23 450 1,8 146 393 1,4 37 240 0,4 4 476 0,5 3368 1,1 23 870 1,7 68 954 0,6
Sporting –participant 128 354 1,6 4 977 0,7 5050 1,6 31 236 2,4 169 617 1,6 42 492 0,5 2 428 0,3 1103 0,4 15 964 1,2 61 987 0,5
Home to visit 13,
1 255 831 15,2 51 772 6,9 22233 7,0 72 459 5,6 1 402 296 1 229 818 13,3 58 720 7,0 19810 6,7 77 694 5,6 1 386 041 11,8
friends/family 2
22,
Visit friends/family 1 861 739 22,5 250 033 33,3 514864 16,2 228 161 17,5 2 391 419
5
1 648 019 17,9 234 916 28,2 49524 16,7 270 023 19,6 2 202 482 18,8
Funeral 808 933 9,8 44 830 6,0 14669 4,6 12 909 1,0 881 342 8,3 1 066 518 11,6 52 143 6,3 18079 6,1 16 859 1,2 1 153 599 9,8
Medical 184 475 2,2 17 149 2,3 5413 1,7 29 333 2,2 236 369 2,2 358 296 3,9 19 801 2,4 8097 2,7 41 244 3,0 427 438 3,6
Wellness (e.g. spa, health
12 022 0,1 3 458 0,5 910 0,3 5 273 0,4 21 663 0,2 23 416 0,3 1 663 0,2 1844 0,6 8 820 0,6 35 742 0,3
farm)
Religious 389 133 4,7 31 788 4,2 16963 5,3 19 342 1,5 457 227 4,3 627 387 6,8 39 755 4,8 12681 4,3 27 496 2 707 319 6,0
Wedding 132 698 1,6 9 373 1,2 4278 1,3 16 384 1,3 162 733 1,5 191 287 2,1 11 429 1,4 2521 0,8 15 075 1,1 220 312 1,9
Other 249 771 3,0 14 936 2,0 4518 1,4 19 065 1,5 288 291 2,7 214 824 2,3 10 414 1,2 2402 0,8 14 927 1,1 242 567 2,1
Total 8 267 502 100 751 645 100 318017 100 13 04295 100 10 641 458 100 9 228 160 100 833 215 100 296684 100 1 378 315 100 11 736 372 100
Source: NHTS 2013
Gender Series Volume III: Gender Patterns in Transport, 2013STATISTICS SOUTH AFRICA 15
Table 2.1 provides an illustration of the day travel patterns of both males and females. In 2013,
most people undertook day trips to engage in shopping-related activities for personal reasons. This
was true across all population groups, with higher percentages observed among Indian/Asian and
black African population groups. In all population groups, more females travelled for this reason
compared to their male counterparts. The second most popular reason provided for day travel for all
persons was ‘visiting family and friends’. High percentages were observed among coloured males
(33,3%) and females (28,2%).
Data shown in Table 2.1 indicate little disparities between males and females about reasons for
trips during the day, except for trips taken for medical reasons (that means trip taken because either
the respondent needed medical attention or they brought someone else for medical attention). For
all population groups, females were more likely than males to take trips for medical reasons. Sex
differences were biggest in the black African population group with 1,7 percentage points, while the
coloured population group recorded the least differences with only a 0,1 percentage point difference
between males and females. This finding possibly reflects the fact that the burden of health care
often falls in the hands of women. Women often make trips to medical facilities not only for their
8
well-being but to also ensure the well-being of those in their immediate surroundings . It is for this
reason that proper infrastructure, which ensures easy access to medical and health facilities, is
important.
Table 2.2: Day trips by sex and geotype with gender parity ratios, 2013
Metro Urban Rural
Main purpose of day trip Male Female Male Female Male Female
GPR GPR GPR
Per cent Per cent Per cent
Home for leisure/holiday 7,7 7,1 1,0 2,6 2,4 0,9 1,5 1,1 0,9
Leisure/holiday 10,0 9,4 1,0 3,7 3,4 0,9 1,7 1,5 1,1
Shopping – business 4,7 3,4 0,7 3,7 2,4 0,6 3,1 2,2 0,9
Shopping – personal 20,4 25,3 1,3 32,2 35,7 1,1 35,0 39,6 1,4
Sporting – spectator 1,8 0,7 0,4 1,1 0,5 0,5 1,1 0,5 0,5
Sporting – participant 1,3 0,6 0,5 1,7 0,5 0,2 1,9 0,5 0,3
Home to visit friends/family 14,4 13,6 1,0 13,4 12,1 0,9 11,3 9,7 1,1
Visit friends/family 24,0 21,2 0,9 22,0 19,7 0,9 20,8 15,3 0,9
Funeral 6,5 7,1 1,1 9,3 10,2 1,1 9,8 12,6 1,6
Medical 1,5 2,4 1,7 2,2 3,4 1,6 3,2 5,2 2,0
Wellness (e,g. spa, health farm) 0,8 0,2 0,2 0,9 0,2 0,4 2,20 0,2 0,3
Religious 4,3 6,0 1,5 3,6 5,4 1,6 5,0 6,5 1,6
Wedding 1,4 1 1,2 1,3 1,7 1,3 1,9 2,3 1,5
Other 1,8 1,3 0,7 3,1 2,3 0,7 3,5 2,8 1,0
Total 100 100 100 100 100 100
Source: NHTS 2013
8
Cheryl-Ann Potgieter, Renay Pillay, Sharmla Rama. 2008. Women, Development and Transport in Rural Eastern Cape, South Africa.
HSRC Press.
Gender Series Volume III: Gender Patterns in Transport, 2013STATISTICS SOUTH AFRICA 16
Table 2.2 depicts gender parity ratios (GPR) for day trips undertaken for the three geographic areas
in the country. Parity (equality) is reached at 1,0. Any score below 1,0 reflects inequalities in favour
of males, while a score above 1,0 shows disparities in favour of females. The table shows great
gender differences in day trips taken for medical purposes. The analysis above found similar
patterns to those observed in Table 2.1. Gender parity ratios confirm that women were more likely
than men to undertake day trips for medical purposes. The GPR calculated for medical day trips
was above one across all three geographical areas. Again, this shows that more females than
males undertook day trips for medical reasons. Gender ratios for rural areas were highest at 2,0.
This was followed by urban and metropolitan areas which recorded 1,6 and 1,5 respectively.
Notable gender differences were also observed for day trips taken for activities relating to sports. A
higher percentage of males than females travelled during the day to participate in sports or as
spectators. Females were significantly less likely to travel to participate in sports, with the largest
differences observed in urban and rural areas (GPR=0,2 and 0,3 respectively).
Table 2.3: Day trips by sex and main mode of transport, 2013
Black Coloured Indian White RSA
Male Female Male Female Male Female Male Female Male Female
Train 1,3 1,2 2,6 2,4 0,3 0,4 1,0 0,3 1,4 1,1
Bus 6,3 7,5 2,4 2,6 2,4 2,9 0,4 0,4 5,2 6,2
Taxi 53,2 59,9 23,3 27,3 11,3 13,0 0,8 1,0 43,4 49,5
Car driver 12,4 3,8 31,0 7,5 53,8 20,0 71,5 35,7 22,2 8,2
Car passenger 9,4 13,8 24,7 45,0 24,5 57,1 22,0 58,6 12,5 22,3
Walking all the way 1,1 0,8 1,5 1,5 3,8 4,0 3,5 2,4 1,5 1,1
Other 16,2 13,2 14,6 13,7 3,8 2,6 0,8 1,5 13,9 11,6
Source: NHTS 2013
Table 2.3 shows data for the main mode of transport used for day trips taken in the past seven
days. In 2013, the most used mode of transport for day travel was as passenger in a taxi or
car/bakkie. As the table shows, the usage of public transport, particularly taxis, remains skewed
toward black African and coloured population groups with females reporting a higher usage than
males. The difference between males and females who reported to have utilised taxis was 6,7 and 4
percentage points for black Africans and coloureds respectively, while it was less than two per cent
for both Indians/Asians and whites. The table also shows that black Africans were least likely9 to be
either drivers or passengers in cars compared to other population groups. Black African and
coloured women had the lowest likelihood of being drivers compared to their male counterparts i.e.
12,4% (males) and 3,8% (females) for black Africans and 31% (males) and 7,5% (females) for
coloureds.
9
Likelihood in this report refers to denote percentage difference (a certain group has a high chance). It is not used in multivariate terms.
Gender Series Volume III: Gender Patterns in Transport, 2013STATISTICS SOUTH AFRICA 17
OVERNIGHT TRIPS
This section ascertains gender differences in reasons for taking overnight trips. The NHTS defines an overnight trip as a trip where one or more
nights are spent away from the dwelling unit. It collects information about both the trip to the destination and back to the usual place of
residence.
Table 2.4: Overnight trips by sex, main purpose and population group, 2013
Male Female
Main purpose for
Black African Coloured Indian/Asian White RSA Black African Coloured Indian/Asian White RSA
overnight trip
No % No % No % No % No % No % No % No % No % No %
Home for
393 554 7,9 19 225 5,3 16 113 11,5 107 440 11,8 536 331 8,4 357 523 6,2 23 032 5,5 14 970 11,6 105 515 11,1 501 040 6,9
leisure/holiday
Leisure/holiday 200 869 4,0 84 360 23,4 39 548 28,2 409 559 45,1 734 336 11,5 228 911 3,9 97 134 23,4 42 262 32,7 418 477 44,1 786 785 10,8
Shopping –
69 460 1,4 5 474 1,5 9 006 6,4 51 988 5,7 135 927 2,1 42 907 0,7 2 580 0,6 3 001 2,3 19 621 2,1 68 109 0,9
business
Shopping –
43 361 0,9 2 049 0,6 2 757 2 6 593 0,7 54760,3 0,9 52 320 0,9 4 070 1 1 671 1,3 7 702 0,8 65 763 0,9
personal
Sporting –
10 668 0,2 298 0,1 910 0,6 2 508 0,3 14384,3 0,2 6 291 0,1 1 345 0,3 245 0,2 3 353 0,4 11 235 0,2
Spectator
Sporting-participant 30 195 0,6 2 355 0,7 940 0,7 8 139 0,9 41629,4 0,7 11 216 0,2 1 528 0,4 6 803 0,7 19 547 0,3
Home to visit
1 736 047 34,9 51 119 14,1 31 637 22,6 96 538 10,6 1 915 340 30,0 1 821 007 31,3 65 245 15,7 27 649 21,4 99 272 10,5 2 013 173 27,6
friends/family
Visit friends/family 1 285 723 25,8 136 954 37,9 29 276 20,9 172 838 19 1 624 791 25,4 1 510 729 26 152 017 36,6 27 590 21,3 238 686 25,1 1 929 023 26,4
Funeral 596 398 12 29 489 8,2 3 648 2,6 6 927 0,8 636 463 10,0 942 104 16,2 37 129 8,9 4 782 3,7 11 684 1,2 995 700 13,6
Medical 42 981 0,9 3 261 0,9 5 475 0,6 51717,1 0,8 89 269 1,5 5 799 1,4 7 434 0,8 102 502 1,4
Wellness (e.g. spa,
2 812 0,1 1 101 0,1 3912,65 0,1 6 430 0,1 181 0 1 101 0,1 7 711 0,1
health farm)
Religious 323 974 6,5 9 189 2,5 1 400 1 4 199 0,5 338 762 5,3 504 570 8,7 12 064 2,9 4 863 3,8 3 714 0,4 525 212 7,2
Wedding 109 094 2,2 6 186 1,7 3 527 2,5 12 352 1,4 131 159 2,1 148 922 2,6 8 521 2,1 2 025 1,6 15 131 1,6 174 600 2,4
Other 132 713 2,7 11 305 3,1 1 481 1,1 22 371 2,5 167 870 2,6 88 899 1,5 4 803 1,2 371 0,3 10 905 1,1 104 978 1,4
Total 4 977 849 100 361 264 100 140 241 100 908 028 100 6 387 382 100 5 811 100 100 415 447 100 129 429 100 949 400 100 7 305 375 100
Source: NHTS 2013
Gender Series Volume III: Gender Patterns in Transport, 2013STATISTICS SOUTH AFRICA 18
Table 2.4 summarises the main purpose for overnight trips. The table shows that Indian/Asian and
white population groups recorded higher percentages for trips taken for holidays/leisure. Among the
Indian/Asian population group 32,7% of females and 28,2% of males reported this reason while
among the white population groups male percentages were slightly higher (45,1%) than females
(44,1%). For both these population groups there were slightly more females than males who
reportedly took overnight trips to visit friends/family.
The pattern for overnight travel was slightly different for the coloured and black African population
groups. For example, among the coloured population group, there were slightly more males (1,3
percentage points difference) who reported having taken overnight trips to visit friends/family, than
females. Going on holiday also recorded equal percentages for both males and females with 23,4%.
Among the black African population group, going home, visiting family/friends and attending
funerals were the top three reasons for taking overnight trips. The percentage of females who
reported taking overnight trips to attend funerals was higher by 4,2 percentage points when
compared to males.
Table 2.5: GPR of overnight trips by population group, 2013
Black
African Coloured Indian/Asian White RSA
Home for leisure/holiday 0,9 1,2 0,9 1,0 0,9
Leisure/holiday 1,1 1,2 1,1 1,0 1,1
Shopping – business 0,6 0,5 0,3 0,4 0,5
Shopping – personal 1,2 2,0 0,6 1,2 1,2
Sporting – spectator 0,6 4,5 0,3 1,3 0,8
Sporting participant 0,4 0,6 0,0 0,8 0,5
Home to visit friends/family 1,0 1,3 0,9 1,0 1,1
Visit friends/family 1,2 1,1 0,9 1,4 1,2
Funeral 1,6 1,3 1,3 1,7 1,6
Medical 2,1 1,8 0,0 1,4 2,0
Wellness (e.g. spa, health farm) 2,3 0 0,0 1 2,0
Religious 1,6 1,3 3,5 0,9 1,6
Wedding 1,4 1,4 0,6 1,2 1,3
Other 0,7 0,4 0,3 0,5 0,6
Source: NHTS 2013
Table 2.5 is an illustration of gender parity ratios for overnight trips by population groups. Gender
parity ratios (GPR) for overnight trips by sex and population group reflect slight differences in
percentages of males and females (table 2.5). Ratios above 1 are favourable toward females for
medical, wellness, religious and attending funerals. What this table also indicates is that females
across population groups were more likely to take overnight trips for medical purposes than their
male counterparts10.
10
The subsample of Indians/Asians is relatively small. This finding therefore does not mean that this population group did not take
medical trips.
Gender Series Volume III: Gender Patterns in Transport, 2013STATISTICS SOUTH AFRICA 19
Table 2.6: Overnight trips by sex and geotype
Metro Urban Rural RSA
Main purpose for overnight trip
by geotype Male Female GPR Male Female GPR Male Female GPR Percent GPR
Home for leisure/holiday 13,1 12,1 0,96 5,9 5,1 0,9 3,5 1,9 0,8 7,6 0,9
Leisure/holiday 18,2 18,4 1,05 8,7 8,2 1,0 3,6 3,7 1,4 11,1 1,1
Shopping – business 3,3 1,5 0,5 1,3 0,5 0,4 1,2 0,6 0,7 1,5 0,5
Shopping – personal 0,5 0,5 1,2 1,0 1,1 1,2 1,4 1,2 1,2 0,9 1,2
Sporting – spectator 0,3 0,2 0,6 0,2 0,1 1,0 0,2 0,1 1,0 0,2 0,8
Sporting – participant 0,6 0,4 0,7 0,6 0,3 0,5 0,8 0,1 0,2 0,4 0,5
Home to visit friends/family 30,8 29,9 1,0 32,2 28,8 1,0 26,1 23,6 1,3 28,7 1,1
Visit friends/family 19,6 20,9 1,1 29,1 29,8 1,1 30,8 30,2 1,4 26,0 1,2
Funeral 6,8 8,3 1,3 10,3 13,7 1,4 14,8 20,2 1,9 11,9 1,6
Medical 0,3 0,5 2,1 0,8 1,6 2,1 1,7 2,3 1,9 1,1 2,0
Wellness (e.g. spa, health farm) 0,0 0,1 2,3 0,1 0,2 3,7 0,1 0,1 1,0 0,1 2,0
Religious 3,2 4,5 1,5 5,1 6,7 1,4 9,0 10,9 1,7 6,3 1,6
Wedding 1,5 1,7 1,2 2,3 2,5 1,2 2,7 3,1 1,6 2,2 1,3
Other 2,0 1,1 0,6 2,4 1,3 0,6 4,0 1,9 0,7 2,0 0,6
Total 100 100 100 100 100 100 100
Source: NHTS 2013
When data for overnight trips were analysed according to geographical area it showed that across
all geographical areas, taking overnight trips to visit friends/family, going home and travelling for
leisure/holiday ranked higher than other reasons. People who reside in rural areas recorded the
highest percentages for visiting friends while it was going home which had highest percentages for
those in metropolitan areas. For rural areas there were no differences between sexes in as far as
visiting friends/family is concerned, while in the metros, males (30,8%) were more likely than
females (29,9%) to travel home.
People who reside in the metros were more likely than those from urban and rural areas to take
overnight trips for leisure/holiday with virtually no difference between sexes.
When overnight trips for medical reasons were analysed, the results showed that females were
more likely than males to take overnight trips, with a gender parity ratio of 2,1 for both metros and
urban areas and 1,9 for rural areas.
Gender Series Volume III: Gender Patterns in Transport, 2013STATISTICS SOUTH AFRICA 20
Figure 2.1: Health care facility visited first during illness by sex of household head, 2015
Other
Traditional healer
Private doctor/Specialist
Private Clinic
Private Hospital
Other in public sector
Public Clinic
Public Hospital
Private
Public Other in Private Traditional
Public Clinic Private Clinic doctor/Speci Other
Hospital public sector Hospital healer
alist
Male 8,0 57,0 0,6 3,0 2,1 27,6 0,5 1,2
Female 7,5 70,8 0,4 1,4 1,4 17,6 0,4 0,5
Male Female
Source: GHS, 2015
Figure 2.1 shows data for the type of health care facilities visited first when a member of the
household is ill. The data were disaggregated by the sex of the household head. The figure
illustrates that public clinics recorded highest percentages of health care facilities visited first, with
female-headed households recording higher percentages (70,8%) than males (57%). Second
highest percentages were observed for visits to a private doctor/specialist. Male-headed households
had higher percentages than female-headed households with a difference of 10 percentage points.
Other health care facilities recorded less than 10% with marginal differences between male- and
female-headed households.
Gender Series Volume III: Gender Patterns in Transport, 2013STATISTICS SOUTH AFRICA 21
Figure 2.2: Mode of travel to health facility by sex
52,4
Walking
42,9
13,9
Own transport
28,8
31,1
Minibus taxi/ Sedan/bakkie taxi
25,0
1,2
Other
1,8
1,2
Bus
1,0
0,1
Bicycle/Motorcycle
0,4
0,2
Train
0,3
0,0 10,0 20,0 30,0 40,0 50,0 60,0
Female Male
Source: GHS, 2015
Figure 2.2 is an illustration of mode of travel to a health care facility by sex of household head.
Walking to a health care facility recorded the highest percentages for both male- and female-
headed household with female-headed households recording a higher percentage (52,4%) than
male-headed households (42,9%). Male-headed households reportedly used own transport more
than female-headed households, with a 14,9 percentage point difference. Female-headed
households recorded higher percentages for the usage of taxis, with 31,1% compared to 25% of
males.
Figure 2.3: Time taken to health care facility by sex, 2015
36,2
Less than 15 minutes
43,3
43,9
15-29 minutes
41,3
17,6
30-89 minutes
13,9
2,0
90 minutes and more
1,5
0,2
Do not know
0,1
0,0 5,0 10,0 15,0 20,0 25,0 30,0 35,0 40,0 45,0 50,0
Female Male
Source: GHS, 2015
Gender Series Volume III: Gender Patterns in Transport, 2013STATISTICS SOUTH AFRICA 22
Figure 2.3 illustrates the amount of time taken to reach a health care facility by sex of the household
head. As shown in the figure, it was male-headed households who recorded higher percentages for
the shortest time travelled to a health care facility, with 43,3% compared to 36,2% of female-headed
households.
There were more people from female-headed households than male-headed households who
reportedly took between 15–29 minutes to reach a health care facility with a percentage point
difference of 2,6. The same pattern was also observed for those who took between 30–89 minutes,
with female-headed households recording 17,6% and males 13,9%. Households who reportedly
travelled for 90 minutes and more recorded the smallest percentages.
Reasons for not travelling
Table 2.7: Reasons for not travelling by sex and population group, 2013
Reasons for not
travelling Black African Coloured Indian/Asian White RSA
Male Female Male Female Male Female Male Female Male Female
Did not need to travel 41,0 43,3 51,2 49,1 39,9 47,0 43,6 50,1 41,8 44,1
Financial reasons (not
enough money) 13,2 11,3 9,2 8,6 4,5 4,9 3,2 3,3 12,2 10,6
Not well enough to travel 3,8 3,6 4,7 4,2 3,3 4,6 4,1 4,0 3,9 3,7
Too expensive 2,1 1,7 1,5 2,8 1,6 1,0 0,6 0,7 1,9 1,7
Not enough time to travel 0,9 1,0 0,4 0,5 4,2 0,2 1,1 1,4 1,0 1,0
Usual transport not
available 0,1 0,1 0,2 0,0 0,0 0,0 0,4 0,6 0,1 0,1
No available public
transport 0,1 0,1 0,2 0,2 0,5 0,0 0,1 0,8 0,1 0,1
Disabled: unable to leave
the house 1,8 1,1 3,0 2,9 1,4 1,5 1,8 1,4 1,8 1,3
Disabled: transport
inaccessible 0,3 0,2 0,5 0,3 0,3 0,4 0,3 0,2 0,4 0,2
Too old/young to travel 25,1 22,0 19,0 16,5 29,5 29,0 16,0 18,6 24,4 21,6
Worried about
safety/security 0,0 0,1 0,0 0,6 0,0 0,2 0,2 1,1 0,0 0,2
No interest/nothing appeals 1,2 1,0 1,1 1,4 0,7 1,2 4,9 3,5 1,4 1,2
Taking care of
children/sick/elderly 0,5 5,1 0,7 4,7 0,0 5,2 0,9 4,9 0,6 5,0
No particular reason 9,0 8,7 6,6 7,3 8,0 4,0 22,1 9,3 9,4 8,5
Transport strike 0,1 0,0 0,0 0,1 0,0 0,0 0,0 0,0 0,1 0,0
Other 0,7 0,6 1,6 0,8 6,1 0,8 0,5 0,2 0,9 0,6
Grand total 100 100 100 100 100 100 100 100 100 100
Source: NHTS 2013
Table 2.7 summarises the reasons for not travelling in the past week. Across all population groups,
a higher percentage of males and females reported that they did not need to travel. However the
coloured population showed a different pattern from all population groups with males reporting this
reason more than females. This was followed by individuals who felt they were too old or too young
to travel. A high percentage of black African and coloured males stated this reason more than their
female counterparts. In contrast, it was white females more so than white males who felt too
old/young to travel.
Gender Series Volume III: Gender Patterns in Transport, 2013STATISTICS SOUTH AFRICA 23
Furthermore, the table shows that it was mainly females who were less likely to travel because they
had to care for children, the sick and the elderly. Amongst the Indian/Asian population, 5,2% of
women could not travel due to “caring duties”, while none of their male counterparts reported
“caring” as the reason they could not travel. Among the black African population, 5,1% of females
compared to only 0,5% of males indicated that caring duties prevented them from travelling. A
similar pattern was observed among the coloured population group having similar proportions of
4,7% for females and 0,7% for males, and the white population with 4,9% for females and 0,9% for
males. This points to an important issue often highlighted in gender and development literature that
caring work is often the responsibility of females. Furthermore such work is usually unpaid, thus
preventing women from attending to other aspects of their lives.
Not having enough money was recorded as the third highest reason for not travelling, with black
African and coloured males recording higher percentages than their female counterparts.
While being worried about safety and security was cited by a very small amount of respondents, it is
worth noting that slightly more females than males indicated this as the reason for not travelling. As
shown in Table 2.7, it was the white and coloured population groups that recorded the highest sex
differences. It was one per cent of both white and coloured females compared to none of their male
counterparts who indicated that they could not travel due to worries about safety.
Figure 2.4: Reasons for not travelling by province, 2013
Male Female
0,6
RSA 24,4
3,1
41,8
RSA 10,7
0,5 43,1
Limpopo 23,6
37,5 6,1
Limpopo 12,8
0,7 39,0
Mpumalanga 37,2
36,9 4,5
Mpumalanga 17,0
0,8 43,1
Gauteng 19,0
37,8 5,4
Gauteng 14,5
0,4 41,9
North West 21,2
41,1 8,1
North West 13,2
0,3
KwaZulu- Natal 28,7 40,2
43,1 3,8
KwaZulu- Natal 13,0
0,5
Free State 27,8 45,3
38,8 4,9
0,4 Free State 14,3
Northern Cape 32,4 47,2
37,8 6,1
0,6 Northern Cape 21,5
Eastern Cape 23,3 42,4
44,8 4,2
1,2 Eastern Cape 12,3
Western Cape 15,5 45,6
53,8 5,4
Western Cape 19,3
Taking care of children/sick/ elderly 53,8
Too old/young to travel Taking care of children/sick/ elderly
Too old/young to travel
Did not need to travel
Did not need to travel
Source: NHTS 2013
Gender Series Volume III: Gender Patterns in Transport, 2013You can also read