Bridgend Local Development Plan 2006-2021 - Background Paper 2: Population and Housing - Population and Housing 2012 ...
←
→
Page content transcription
If your browser does not render page correctly, please read the page content below

Cyngor Bwrdeistref Sirol
                                                             r
                                                           gw

                                                       O
                                         n-y-b o nt ar
Bridgend Local Development Plan

                                      Pe
                                        BRIDGEND
                        2006-2021      County Borough Council

Background Paper 2: Population and Housing
                              Revised May 2012
Background Paper 2:

                        Population and Housing

                            Revised May 2012

Development Planning
Regeneration and Development
Communities Directorate
Bridgend County Borough Council
Angel Street, Bridgend
CF31 4WB
Contents

1.0   Introduction                                                            2

2.0   National Policy Context                                                 3
2.1   One Wales
2.2    Wales Spatial Plan (2008)
2.3   Planning Policy Wales (Edition 3 / July 2010)
2.4   Technical Advice Note 1: Joint Housing Land Availability Studies
      (2006)
2.5   Technical Advice Note 2: Planning and Affordable Housing (2006)
2.6   Affordable Housing Toolkit (2006)
2.7   Local Housing Market Assessment Guide (2006)
2.8   Statutory Code of Practice on Racial Equality in Housing – Wales

3.0    Regional and Local Context                                             11
3.1   South East Wales Regional Housing Market Study
3.2   Community Strategy
3.3   Local Housing Market Assessment (2009 & Update 2012)
3.4   Local Housing Strategy (2009 - 2014)

4     Development of Population and Household Figures in the LDP              16
4.1   Pre-Deposit Proposals / LDP Preferred Strategy
4.2   Examination of alternative Population Projections for Bridgend County
      Borough
4.3   Projections used in the Bridgend Deposit Local Development Plan
4.4   Population and Housing Requirement Conclusions and relationship with
      latest Assembly Government Projections.

5     Housing Land Supply                                                     32
5.1   Introduction
5.2   Housing Allocations
5.3   Allowance for Windfall Sites
5.4   Allowance for Small Sites
5.5   Allowance for Demolitions
5.6   Housing Land Calculation

6     Conclusions                                                             38

Appendices

Appendix 1 Historical Housing Completions

Appendix 2   Further exposition of the CE methodology

Appendix 3 LDP Housing Allocations

                                     ‐1‐
1.0   Introduction

1.1   Population and household growth has a fundamental influence on the
      preparation of Bridgend Local Development Plan (LDP) and its policies, in
      particular on housing numbers but also for growth of employment, retail and the
      consequential impacts on community facilities, areas of public open space as
      well as transport and service infrastructure.

1.2   The earlier stages of the LDP were informed by a number of studies and
      projections which established likely levels of growth over the Plan period, based
      on an analysis of long-term trends. The level of growth identified was one that
      carried on these longer term trends and was supported by stakeholders during
      consultation stages as a level that would cater for future demand without
      harming the character or environment of the County Borough. In line with
      Government guidance the level of growth could be accommodated primarily on
      brown-field sites within existing settlement limits. This approach was set out in
      the Preferred Strategy that informs the development of the Deposit Plan.
      However WAG 2006-based household projections published in June 2009
      forecast a substantial increase in the number of households in the County
      Borough over the Plan period.

1.3   This background paper sets out justification for the level of population and
      housing growth proposed in the LDP and explains why it differs from the 2006
      and 2008 based WAG projections for the County Borough.

                                    ‐2‐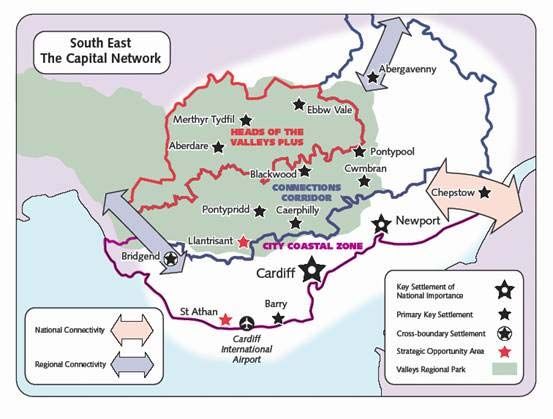
2.0 National Policy Context
2.0.1 This section identifies national policy that has been considered in the formulation
of policies for the Local Development Plan.
2.1 One Wales
2.1.1 One Wales presents the high level strategic direction agreed by the Labour and
Plaid Cymru groups in the National Assembly. The aspirations of the agreed
agenda for governance are presented under the following themes:
A Healthy Future
Living Communities
A Fair and Just Society
A Rich and Diverse Culture
A Prosperous Society
Learning for Life
A Sustainable Environment
2.1.2 The ‘Living Community’ theme has particular relevance to population and
housing with it acknowledging that a lack of good-quality housing affects people’s
health and well-being, and influences their long-term life chances. It states that
everyone has the right to an affordable home as owner, as part-owner or as
tenant. A stock of good-quality, affordable homes is the foundation of thriving
local communities in all four corners of Wales.
2.1.3 The shortage of affordable housing, to rent or to buy, is one of the greatest
challenges facing many communities in Wales. Many places are already
experiencing very considerable housing pressure, with local people effectively
priced out of the housing market, unable to afford a home. The resulting impact
on individuals, families and communities is all too evident across Wales.
2.1.4 Our ambition is to ensure that all households, in all communities and irrespective
of their means, can afford a decent home. Working together, we will create new
tools to ensure that housing is affordable in the areas of most severe housing
pressure. We will also ensure that the supply of affordable housing increases by
at least 6,500 over the next four years.
‐3‐
2.1.5 This programme of government is committed to:
• Meeting housing need
• Improving access to housing
• Increasing the supply of affordable housing
• Ensuring 21st-century housing
2.2 Peoples, Places, Futures: The Wales Spatial Plan (2008 Update)
2.2.1 The Wales Spatial Plan (WSP) was first adopted by the National Assembly for
Wales in 2004; it was subsequently updated in 2008 and provides a national
vision which states:
We will sustain our communities by tackling the
challenges presented by population and
economic change. We will grow in ways which
will increase Wales’ competitiveness while
assisting less well-off areas to catch up on
general prosperity levels and reducing negative
environmental impacts. We will enhance the
natural and built environment and we will
sustain our distinctive identity.
2.2.2 The WSP states that the scale of population growth that needs to be
accommodated is challenging, with a projected growth of 330,000 persons
across Wales between 2006 and 2031 (ONS, 2007). Equally important is the
need to maintain a mix of tenure and size of housing to ensure balanced
communities. To address this to the Welsh Assembly Government is committed
to delivering 6,500 new affordable homes by 2011.
2.2.3 The general principles for new housing growth are:
it should be linked to public transport nodes, including walking and cycling
networks;
it should take account of environmental constraints, including flooding risk;
and
it should meet high standards of energy efficiency.
2.2.4 Housing developed near public transport modes should be at higher than current
densities to promote use of public transport and to increase opportunities for
combined heat and power systems. Accommodating appropriate development in
smaller settlements and rural areas is vital for supporting the development of
more rural communities.
‐4‐
2.2.5 The Plan also contains a detailed strategy for the six spatial plan areas of Wales.
      This includes South East Wales (The Capital Network) within which Bridgend
      County Borough is situated. The vision for this area is:

       “An innovative skilled area offering a high quality of life - international yet
       distinctively Welsh. It will compete internationally by increasing its global
       visibility through stronger links between the Valleys and the coast and with
       the UK and Europe, helping to spread prosperity within the area and
       benefiting other parts of Wales.”

2.2.6 South East Wales is recognised as Wales’ most populated area but
      characterised by major economic and social disparities. Its coastal zone is its
      main economic driver, and the competitiveness of the region needs to be
      ‘sustained to help raise the economic potential of Wales. The heavy commuting
      flows between the Valleys and the coast mean that the area functions as an
      interdependent but unplanned urban network. This gives rise to pressure on
      transport infrastructure’. As a ‘key centre’ in the region Bridgend is seen as
      having a close functional relationship with Cardiff and other neighbouring towns.

2.2.7 The Area Framework for South East Wales - The Capital Network, divides the
      region into three distinctive ‘spatial subsets’ or sub-regions, (see figure 2.1) all of
      which traverse Bridgend County Borough. The ‘City Coast zone’ of the Spatial
      Plan area in particular is seen as having ‘high quality employment sites’,
      particularly where they represent locational or large site opportunities for inward
      investment, which should be reserved for uses which maximise strategic
      economic benefits.

       Figure 2.2 Wales Spatial Plan: South East Wales

                                       ‐5‐
2.2.8 The Area Framework envisages that at the heart of the vision for the region there
will be a network of strong, sustainable communities spreading prosperity from
Cardiff and Newport to the valleys across the region.
2.2.9 The provision of affordable housing is identified as an objective, along with the
strengthening of the Valleys as a desirable place to live, work and visit, with a
wider mix of types of housing. It is recognised that private house building and the
improvement of public sector housing stock have a key role to play in
regeneration in the Valleys.
2.2.10 The main priorities of relevance to population and housing are highlighted below:
Building Sustainable Communities
The Plan reiterates the need for South East Wales to function as a city-
region, spreading prosperity from the two major centres of Cardiff and
Newport northwards.
Achieving the Vision is dependent on realising the potential and managing
any pressures from existing development opportunities
Development will need to be carefully managed to avoid excessive strain on
infrastructure and other essential services and to ensure environmental
impact is minimised.
Achieving Sustainable Accessibility
Public transport should operate sufficiently frequently that passengers can
“turn up and go”
Seating capacity should be sufficient to meet normal demand, reducing the
need for passengers to stand for the journey
Ensure that the road network is used with maximum efficiency with innovative
approaches to demand management
Safe cycling and walking routes should be identified for commuters and
communities
Promoting a Sustainable Economy
The area needs to develop a stronger presence in higher value services and
the knowledge economy
Supporting and developing higher and further education.
Strategic interventions, focussed on regeneration and investment in the most
deprived areas of the region should be along sustainable transport corridors
and support key settlements.
Valuing Our Environment
Getting the best of both high quality urban living and close proximity to
stunning countryside
Reducing levels of traffic congestion and developing effective public transport
‐6‐
Sustaining and developing places that are safe for people to walk and cycle,
and for reducing crime
Respecting Distinctiveness
Each town needs to foster its own distinct sense of identity, building on its
heritage and culture
Creating a network of settlements with real character that complement each
other and add strength to the attractiveness of the region as a whole
2.3 Planning Policy Wales (Edition 4 / February 2011)
2.3.1 Planning Policy Wales (PPW) sets out the Welsh Assembly
Government's land use policies for the development of new
build and renovated housing for both the market and
affordable housing sectors. PPW is supported by a series of
Technical Advice Notes (TANs).
2.3.2 The Assembly Government’s vision for housing is for
everyone in Wales to have the opportunity to live in good
quality, affordable housing, to be able to choose where they
live and to decide whether buying or renting is best for them
and their families. The objectives are to provide:
homes that are in good condition, in safe neighbourhoods and sustainable
communities; and
greater choice for people over the type of housing and the location they live
in, recognising the needs of all, including those in need of affordable or
special needs housing in both urban and rural areas.
2.3.3 PPW states that the Assembly Government will seek to ensure that:
previously developed land is used in preference to greenfield sites;
new housing and residential environments are well designed, meeting
national standards for the sustainability of new homes4 and making a
significant contribution to promoting community regeneration and improving
the quality of life; and that
the overall result of new housing development in villages, towns or edge of
settlement is a mix of affordable and market housing that retains and, where
practical, enhances important landscape and wildlife features in the
development.
2.3.4 In respect of housing and development plans paragraph 9.2.1 states that in
planning the provision for new housing, local planning authorities must work in
collaboration with housing authorities, registered social landlords, house builders,
developers, land owners and the community and must take account of the
following:
‐7‐
People , Places, Futures - The Wales Spatial Plan;
Statutory Code of Practice on Racial Equality in Housing - Wales;
The Assembly Government’s latest household projections;
Local Housing Strategies;
Community Strategies;
Local Housing Requirements (needs and demands);
The needs of the local and national economy;
Social Considerations (including unmet need);
The capacity of an area in terms of social, environmental and cultural factors
(including consideration of the Welsh language) to accommodate more
housing;
The environmental implications, including sustainable building, energy
consumption, greenhouse gas emissions and flood risk;
The capacity of the existing or planned infrastructure; and
The need to tackle the causes and consequences of climate change.
2.3.5 Paragraph 9.2.2 states that the latest Assembly Government local authority level
Household Projections for Wales should form the starting point for assessing
housing requirements. Household projections provide estimates of the future
numbers of households and are based on population projections and
assumptions about household composition and characteristics. Local planning
authorities should consider the appropriateness of the projections for their area,
based upon all sources of local evidence, including the need for affordable
housing identified by their Local Housing Market Assessment. Where housing
market areas cross local authority boundaries, authorities may wish to consult
with neighbouring authorities in addressing their housing requirements. Where
local planning authorities seek to deviate from the Assembly Government
projections, they must justify their own preferred policy-based projections by
explaining the rationale behind them in terms of the issues listed above.
2.4 Technical Advice Note 1: Joint Housing Land Availability Studies (2006)
2.4.1 The Technical Advice Notes issued by the Welsh Assembly Government (WAG)
are part of a series of documents that support and expand on the National
Planning Guidance provided by ‘Planning Policy Wales’.
2.4.2 Technical Advice Note 1: Joint Housing Land Availability Study (2006) should be
viewed in conjunction with Chapter 9 of PPW (2011). Local planning authorities
are required to ensure that land for housing genuinely available for a 5-year land
supply, and where this is not being achieved, local authorities need to consider
how to increase supply. A Study group comprising Welsh Assembly Government
(WAG), Caerphilly County Borough Council, house-builder representatives and
other bodies as appropriate are responsible for agreeing the schedule of sites.
The subsequent report represents the agreed view of the Group involved in its
preparation.
‐8‐2.5 Technical Advice Note 2: Planning and Affordable Housing (2006)
2.5.1 Technical Advice Note 2: Planning and Affordable Housing (TAN2) should be
viewed in conjunction with Chapter 9 of PPW (2011) as part of proposals seeking
to increase the supply of affordable housing,.
2.5.2 Land use planning is one of the mechanisms that can be used to provide
affordable housing. The purpose of TAN 2 is to provide practical guidance on the
role of the planning system in delivering such housing. The guidance defines
affordable housing for the purposes of this TAN and provides advice to local
planning authorities on how to determine affordability. The need to work
collaboratively is stressed, including the requirement for housing and planning
authorities to undertake Local Housing Market Assessments in consultation with
key stakeholders to determine the need for affordable housing.
2.5.3 TAN 2 expands on earlier advice to explain the role of local planning authorities
alongside housing departments, registered social landlords, private developers
and other bodies in seeking to define and quantify the need for affordable
housing. This information will be used to inform development plan policies, which
aims to secure affordable housing that meets the identified need and contributes
to sustainable mixed communities.
2.6 Affordable Housing Toolkit (2006)
2.6.1 The Affordable Housing Toolkit seeks to complement other documents by
providing practical advice to enable local authorities and their partners to
increase the supply of affordable housing in line with their housing needs and
circumstances. It highlights the tools and powers available and provides
examples of good practice in the field of affordable housing.
2.7 Local Housing Market Assessment Guide (2006)
2.7.1 The Local Housing Assessment Guide is a technical document providing
practical advice to enable local authorities, as strategic housing bodies, along
with partners to understand the nature and level of housing demand and need in
their local housing markets.
2.7.2 The purpose of the guidance is to integrate the existing approach to assessing
housing need into an understanding of how the wider housing market operates.
The key objective is to provide clear advice to practitioners on assessing the
number of households requiring additional housing, including affordable housing,
in their areas. Local Housing Market Assessments are a crucial element of the
evidence base underpinning the preparation of Local Development Plans and
Local Housing Strategies and will form the evidence base to support affordable
housing policies included in the LDP.
‐9‐2.8 Statutory Code of Practice on Racial Equality in Housing – Wales
2.8.1 PPW (2011) identifies that in the preparation of development plans, local
planning authorities should take account of racial equality in housing, including
Gypsies and Travellers. The Statutory Code of Practice on Racial Equality in
Housing - Wales identifies the legal framework of racial equality and highlights
good practice in the field of housing. It is noted that the ethnic minority population
of Wales has grown in size and diversity due to EU migration, as well as an
asylum seekers and refugees, and account should be taken of the housing needs
of these groups.
‐ 10 ‐3.0 Regional and Local Context
3.0.1 The Local Development Plan (LDP) must have regard to other strategies and
policy documents produced locally and at regional level in order to ensure
consistency. This section seeks to review the key elements of strategies and
studies that form part of the population and housing evidence base at a regional
and local level.
3.1 South East Wales Regional Housing Market Study
3.1.1 A study has been undertaken for the South East Wales Regional Housing Forum
on the South East Wales Regional Housing Market. This study provides a
comprehensive assessment of the sub-regional housing market and helps to
identify 3 Housing Market Areas (HMAs) operating within Bridgend County
Borough. These HMAs are:
Mid-Valleys
North of M4
Bridgend
3.1.2 The boundaries of these market areas have been defined through quantitative
and qualitative analysis undertaken as part of the Housing Market Study and are
shown below:
South East Wales Strategic Planning Group (SEWSPG) - Housing
Apportionment
3.1.3 In June 2006, the Welsh Assembly Government (WAG) published Ministerial
Interim Planning Policy Statement (MIPPS) 01/2006: Housing, which stated that
within each region local planning authorities should work together collaboratively,
and with appropriate stakeholders to apportion to each authority the Welsh
Assembly Government household projections, or agree their own regional policy-
‐ 11 ‐based projections and that the Wales Spatial Plan should be used as the basis
for the exercise.
3.1.4 The South East Wales Strategic Planning Group (SEWSPG) agreed to apportion
the Sub National Household Projection of 108,900 additional households for
South- East Wales from 2006 - 2021 between its 10 constituent Local Planning
Authorities. Initial housing assessments, based on existing UDP and LDP work
was undertaken by all the local authorities, and was used as the basis for further
discussions and consultation within SEWSPG.
3.1.5 The result of this collaborative exercise is contained in the South-East Wales
Regional Apportionment Memorandum of Understanding. It represents a
working hypothesis for future housing apportionment in South-East Wales, and is
intended to inform the preparation of LDPs in the region.
3.1.6 As part of the process Bridgend County Borough has been apportioned 500
dwellings per annum from 2006 to 2021, which equates to a requirement of 7,500
dwellings over the LDP period. However, this figure was considered to be
flexible, with the overall apportionment being monitored by SEWSPG and any
variations from it reconsidered.
3.2 Bright Future – A Community Strategy for Bridgend County 2009 – 2012
3.2.1 Bridgend County’s Community Strategy was published in 2009. The Bridgend
Local Service Board (LSB) is co-ordinating strategic action across the County so
that agencies work together to realise the vision for Bridgend:
A bright future that celebrates and builds on the
successes of our past and present. Our:
Strong Communities
Young Voices
Healthy Living
New Opportunities
Proud Past
Green Spaces
3.2.2 Relevant commitments within the Community Strategy of particular relevance to
population and housing include:
Strong Communities
Develop the support and training available for local businesses,
community and voluntary groups
‐ 12 ‐ Support local voluntary and community groups to be better able to
influence local and national policy and strategy
Young Voices
Increase the range of learning opportunities for all children and young
people, including those who find formal learning difficult.
Provide the guidance, help and support to enable children and young
people to develop the skills they need, and the personal attributes to apply
them, to make the best of their talents.
Healthy Living
Helping employers to improve the health of their staff by promoting healthy
lifestyles and making the workplace a safe and healthy place to be.
New Opportunities
Ensure that help is available for local people currently out of work so that they
can get the right skills to be able to find work locally and that companies are
confident that they can find local people with the skills they need.
Increase the number of contracts given to local companies to provide
goods and services to the council and other public sector organisations,
making procurement more sustainable.
Provide a good range of adult and community learning opportunities for
people to study the things that are important to them and to employers.
Encourage organisations work together to help all people who find
difficulty with reading, writing and using numbers.
Proud Past
Improve our historic town centres and support the improvement of town
centre buildings
Implement the regeneration proposals for Porthcawl.
Develop and support training available for local businesses, community
and voluntary groups.
Green Spaces
Work towards a sustainable transport infrastructure which reduces the
dependency on the car, recognises the benefits of public and community
transport and encourages walking and cycling.
Create a rural business centre developing rural skills and encouraging
social enterprises.
3.3 Bridgend Local Housing Market Assessment (2009 and Update 2012)
3.3.1 Fordham Research was commissioned to conduct a Local Housing Market
Assessment (LHMA) for Bridgend County Borough. The report presents a
comprehensive analysis of the Bridgend County Borough Housing Market. It
‐ 13 ‐includes a review of the current local situation, a discussion of the housing
market dynamics and recommendations as to the appropriate action in Bridgend
County Borough. The report follows the general structure of the Welsh Assembly
Government (WAG) Local Housing Market Assessment Guide of March 2006 as
well as meeting the requirements of Technical Advice Note 2 (TAN2) ‘Planning
and Affordable Housing’ (June 2006).
3.3.2 The LHMA intends to enable a better understanding of the local housing market,
the key drivers of local housing demand and supply and the level of affordable
housing need within the County Borough. It forms a key part of the robust
evidence base to inform the development of housing and planning policies.
3.3.3 The 2009 Local Housing Market Assessment concluded that there is an overall
annual requirement for affordable housing of 1,514. This compares to the 7 year
trend in provision between 2000 and 2007 of 70 affordable houses per annum,
and a projected UDP build-rate of both market and affordable housing of 498
dwellings per annum.
3.3.4 Part of the 2009 assessment suggested In terms of the size of affordable housing
required, a split of 40% smaller (one and two bedroom) dwellings and 60% larger
(three and four bedroom) properties could be pursued by the Council.
Bridgend County Borough Council LHMA Update 2012
3.3.5 The 2012 LHMA study provides an update of the original 2009 LHMA. It was
required because of continued market turbulence and a new initiative within the
affordable sector, Rent First - Intermediate Rent, the scope of which needed to
be established. The study documents the changes that have been recorded in
the County Borough in the last two years as a result of the economic downturn
and identifies the appropriate policy response.
3.3.6 Following the steps of the needs assessment model specified by the Welsh
Government Local Housing Market Assessment Guide, results in a net need
estimate of 1,762 affordable dwellings per year in Bridgend County Borough.
This represents a slight increase from the equivalent figure of 1,514 calculated in
the 2009 Study.
3.3.7 However, the 2012 update undertook sensitivity testing as it was considered that
the Housing Needs Assessment model requirement of 1,762 additional
affordable homes per year did not equate logically with the planned total build
rate of 600 dwellings a year for the LDP period. This is because the Welsh
Government needs assessment model is a technical exercise that presents an
assessment of the need for affordable housing, however it does not account of
the functioning of the current local housing market.
3.3.8 The sensitivity testing factored in higher affordability thresholds that households
in the private rented sector pay in current market conditions and the supply of
private rented accommodation (via Local Housing Allowance) to house those
‐ 14 ‐requiring affordable housing. The study concluded that these two factors would
reduce the need for new affordable units to 292 per year.
3.3.9 The 2012 LHMA update further concluded that an affordable housing target of
around 40-45% would be ideal as this reflects the continued high level of housing
need and also the ongoing requirement to address market imbalance. However
the study concluded that it was up to the Council to determine what target is most
useful considering current viability limitations. This position is comparable to the
original 2009 study conclusion.
3.3.10 In the 2009 LHMA report outputs from the WG needs assessment model and the
long-term market balance model were used to suggest a target of 19% of
affordable housing as intermediate. The 2012 update report has been able to
examine the potential intermediate sector in more detail as further guidance is
now available on Intermediate Rent.
3.3.11 Further analysis of the affordability of households suggests that upwards of a
quarter of new affordable accommodation could be intermediate, (depending on
the number of households it would be acceptable to use Local Housing
Allowance to pay part of their rent) the long-term market balance model suggests
that between half and two-thirds of new affordable housing could be
intermediate. It is clear that there is latent potential demand for this form of
accommodation and because of the low level of existing stock, new intermediate
accommodation should be a priority over the short-term. It is therefore
recommended that half of new affordable housing in the County Borough be
intermediate.
3.3.12 The LHMA (2009 & 2012 update) and the related Housing Viability Study and the
development of the LDPs Affordable Housing policy and target is discussed in
more detail in Background Paper 8: Affordable Housing.
3.4 Local Housing Strategy (2009 – 2014)
3.4.1 The Local Housing Strategy sets out the current local housing situation and
strategic vision across all tenures in Bridgend and includes an Action Plan which
is updated annually. It seeks to support the regeneration of communities and
sets out a framework for meeting housing need and the needs of specific groups.
3.4.2 One of its key strategic objectives is to increase the supply of affordable housing,
with particular focus on the needs of smaller households to support demographic
change, including developing appropriate housing options for an increasingly
ageing population.
‐ 15 ‐4.0 Development of Population and Housing figures in the LDP
4.0.1 Estimating future levels of population is an important element of the Local
Development Plan process. Future levels of anticipated growth raise some very
significant issues which have a major influence on all land requirements such as
housing, employment and retail.
4.1 Pre-Deposit Proposals / LDP Preferred Strategy
4.1.1 The Bridgend LDP Pre-Deposit Proposals considered a range of alternative
Growth Options for the future level of development and their wider spatial
implications in Bridgend County Borough, that would best achieve the Vision,
address the identified Key Needs and Issues and meet the LDP Objectives. It
was considered that reasonable alternative options for growth needed to be
identified and evaluated if the LDP was to develop a sound, coherent and
effective Strategy.
4.1.2 Eight growth options were developed, 5 focusing on population and household
growth and 3 considering employment growth. The population and household
growth options ranged from a ‘Do Nothing Strategy’ which was based on a 6930
dwelling requirement (462 dwellings per annum) and a 6828 population change
between 2006 and 2021, to a ‘Very High Growth Option’ which was based on a
10530 dwelling requirement (702 dwellings per annum) and a 15930 population
change between 2006 and 2021.
4.1.3 To complement the Population and Household Growth Options, three
Employment Growth Options were considered which ranged from a ‘Low Growth
Option’ which retained 70-80 hectares of “committed” employment land and re-
assessed 130-140 hectares of the UDP employment allocation to a ‘High
Employment Growth Option’ which retained 217 hectares of employment land
and investigate the possibility of allocating additional employment land in areas
of the County Borough which were not adequately provided for.
4.1.4 Having considered and assessed the range of alternative growth options to
determine the most appropriate and future level of growth in the County Borough,
it was also necessary to consider how the preferred level of growth for
population, housing and employment should be spatially distributed to best
achieve the LDP Vision, address the key needs and issues and meet the Plan’s
objectives. Three alternative Spatial Strategies were formulated which
incorporate differing methodologies for distributing growth up to 2021.
4.1.5 Strategy 1 was ‘Economic Led’ which distributed future development, in particular
housing and related facilities, in close proximity to areas with future employment
development. Strategy 2 was ‘Regeneration Led’ which distributed development
in line with the regeneration priorities of the County Borough. Strategy 3 was
‘Population and Settlement Led’ which would have seen a dispersal of
development according to the existing population and size of settlement.
‐ 16 ‐4.1.6 Each of the 8 Alternative Growth Options and 3 Spatial Options were evaluated
to broadly assess their potential to achieve the LDP Vision, the high-level
strategic objectives of the LDP, and their fit with national and regional policies.
The culmination of this process was the Preferred Strategy and strategic Policies
which form the development framework and basis for meeting the key economic,
social and environmental needs of the County Borough over the Plan period up
to 2021. The Preferred Strategy in the Pre-Deposit Proposals consisted of the
following 3 elements:
Regeneration Led Spatial Strategy will require the Council to focus
development across the County Borough in accordance with its Regeneration
priorities. This will necessitate directing development to those areas currently
subject to area based Regeneration Strategies and other priority areas where
regeneration and investment is needed to address an identified and
acknowledged decline in the social, economic and physical environment and
provide much needed new development and facilities.
Trend-Based Growth Option is based on the average long-term annual dwelling
completion rate in the County Borough from 1991-2006 which was 540 dwellings
per annum. The Growth Option would result in an overall dwelling requirement
between 2006 and 2021 of 8,100 dwellings, with a corresponding population at 2021 of
141,378, an increase of 9,774 above the 2006 level. That part of the population in
economic activity would increase by 1,283 by 2021.
Medium Employment Growth Option retains 160-170 hectares of the
“committed” employment land primarily for B class and sui-generis employment
uses and waste facilities. It re-assesses the remaining 40-50 hectares of UDP
employment allocations for alternative and/or mixed use developments. There is
also a requirement to investigate the possibility of allocating additional
employment land to better serve those parts of the County Borough currently not
provided for.
4.1.7 The Bridgend LDP: Pre-Deposit Proposals was published for public consultation
for six week period from 12th February 2009 until 31st March 2009.
4.1.8 The results of the consultation exercise on the Bridgend LDP: Pre-Deposit
Proposals were subsequently reported to the LDP Steering Group on the 24th
September 2009 and Council on the 9th October 2009. In response to the
representations received a number of Actions were identified that required further
development of the evidence base underpinning the plan. In respect of
population, housing and employment the following specific actions were
identified:
Reference to, and the implications of, the new 2006-based household
projections will be included in the Deposit LDP; and
‐ 17 ‐ The Council acknowledges that there is currently an apparent incompatibility
between the employment forecasts in the LDP Trend Based Growth option
(produced by the Chelmer Population & Housing Model) , and the
employment forecasts undertaken by Cambridge Econometrics for Bridgend
County Borough Regeneration Strategy “Fit for the Future”. Further work is
being undertaken to examine these relationships. Details of the outcome of
this work will be included in the Deposit LDP.
4.1.9 As noted, during the consultation exercise of the Pre-Deposit Proposals the
Welsh Assembly Government (WAG) released its own population and household
projections for Bridgend County Borough, which show stronger population and
household growth than was proposed in the LDP Preferred Strategy. In this
respect WAG planning policy, as set out at the time in paragraph 9.2.2 Housing
Ministerial Interim Policy Statement 01/2006 Housing, stated that national
household projections form the starting point for assessing housing
requirements. It is for local planning authorities to consider the appropriateness
of the projections for their area, based upon all sources of local evidence,
including the need for affordable housing indentified by the Local Housing Market
Assessment (LHMA).
4.1.10 Local planning authorities are advised that they have the ability to deviate from
the Assembly Government’s household projections if they have robust evidence
and policy context. They can also undertake their own policy-based projections,
but they must justify their reasons for doing so and explain the rationale behind
their own projections.
4.1.11 In addition to the above the general economic environment had worsened since
the projections used in the Pre-Deposit Proposals were prepared. Therefore the
link between housing provision, population and employment needed to be
considered in further detail and reassessed to respond to the issues raised.
4.2 Examination of alternative Population Projections for Bridgend County
Borough
4.2.1 In response to the representations received at the Pre-Deposit Proposals and the
significant changes to the national, regional and local context Bridgend County
Borough Council (BCBC) commissioned Cambridge Econometrics (CE) to further
strengthen and develop the evidence base underpinning the LDP. The particular
focus of the study was to reassess the link between planned dwellings provision,
population and employment targets.
4.2.2 The Examining Alternative Demographic and Labour Market Projections Study
was tasked with providing BCBC with a deeper understanding of the underlying
trends for population and employment in the County Borough. The study initially
reviewed the alternative demographic projections for Bridgend and the
‐ 18 ‐assumptions underpinning them. It then considerd the implications of the
housing numbers proposed on the LDP Pre-Deposit Proposals for population in
Bridgend given the latest demographic trends and reviewed them alongside
projections for employment in the Borough. It also considered the population and
employment trends in neighbouring local authorities and the possible impact of
these upon Bridgend. Finally, it drew together the implications of these analyses
for housing and employment related policy in Bridgend.
4.2.3 This required:
assessing the sources of variation in the various population, household
and labour force projections that exist for BCBC;
understanding the impact that incorporating the 2006-based projections of
trends in average household size have on the dwellings-led scenarios
produced by Chelmer;
re-assessing the prospects for underlying employment growth locally
given current views on the nature of the recession and subsequent
recovery; and
examining the labour market prospects in neighbouring economies.
4.2.4 The Examining Alternative Demographic and Labour Market Projections
Study can be viewed at the following web address:
http://www.bridgend.gov.uk/web/groups/public/documents/report/081513.pdf
4.2.5 The projections examined represented the range that was available both around
the time of the LDP’s Pre-Deposit Proposal and at the time of the production of
the report. The projections that were examined were:
BCBC Chelmer-based projections used in the LDP Pre-Deposit Proposals;
Welsh Assembly Government (WAG) 2006-based population / household
projections;
CE population projections for Bridgend and for Wales (prepared in July
2009)
Latest Chelmer Model standard short-term migration projection for
Bridgend; and
Bridgend BCBC Chelmer-based projections used in the LDP Pre-Deposit
Proposals using updated model;
‐ 19 ‐4.2.6 The differences in resulting population levels, that the projections produce, are
illustrated in Table 1 below, whilst Table 2 illustrates the number of dwellings
implied by the projections examined.
TABLE 1: ALTERNATIVE POPULATION PROJECTIONS FOR
BRIDGEND
Thousands
2006 2011 2016 2021 2026
BCBC ‘trend-based’
projections 131.6 134.6 137.7 141.4
WAG 2006-based projections 132.6 136.8 141.4 146.0 150.1
Chelmer (current short-term
migration) 132.6 137.7 142.7 147.5 152.0
CE (July 2009) 132.6 137.0 140.6 144.6 148.4
BCBC ‘trend-based’
projections (using
updated model) 132.6 135.5 138.6 142.4 146.6
TABLE 2: COMPARISON OF ALTERNATIVE DWELLINGS
PROJECTIONS FOR BRIDGEND
Total Annual
Require
ment
2006- 2011- 2016- 2006- (whole
2011 2016 2021 2021 units)
Additional dwellings
requirement
BCBC ‘trend-based’
projections 2,700 2,700 2,700 8100 540
WAG 2006-based
projections 3,709 3,950 3,725 11384 759
Chelmer (current short-
term migration) 3,387 3,341 3,006 9734 649
CE (July 2009) 1,939 2,681 4,379 8999 600
BCBC ‘trend-based’
projections
(using updated model) 2,700 2,700 2,700 8100 540
‐ 20 ‐Prospects for Employment in Bridgend County Borough
4.2.7 The Bridgend LDP Pre-Deposit Proposals included projections of employment
produced by Cambridge Econometrics (CE). These economic projections were
produced as an input to the work undertaken by SQW Consulting for BCBC on a
regeneration strategy for the Borough – Fit for the Future. The projections were
prepared in the first half of 2007 although the study reported in June 2008. The
projections were therefore prepared at around what has turned out to be the
peak in the economy, before the onset of the credit crisis and ensuing global
recession.
4..2.8 The impact of the recession means the number of jobs now predicted for 2021 is
some way below that projected in 2007, although the long-term growth prospects
are little-changed. The current projections project an overall fall of 600 jobs over
2006-21 compared to an increase of 3,850 additional jobs indicated in the 2007-
based projections. The principle reason for the lower net additional jobs is the
impact of the recent recession and the weak recovery that is now projected.
Employment in Bridgend is now projected to have fallen in 2008 and further year-
on-year falls are expected to 2011. However, in the 2015-21 period, the
underlying rate of employment growth projected now is not very much different
from that in the 2007-based projections (0.3% pa compared to 0.4% pa now).
4.2.9 The pattern of employment change over 2006-21 as a whole differs from that of
the earlier projections, though again it is informative to consider the period 2006-
12 separately from 2012 onwards, when the economy is likely to have adjusted
towards its long term prospects. The pattern of growth in the long term is similar
to that projected in the 2007-based projections, with strong growth in financial &
business services and distribution, hotels & catering, and further falls in
manufacturing employment. The main difference between the two sets of long-
term projections is that the underlying growth in employment in government &
other services has been greatly revised downwards.
TABLE 3: EMPLOYMENT PROJECTIONS FOR BRIDGEND
Thousands Growth, 2006-21
2000 2006 2012 2021 (Thousands) (% pa)
Agriculture etc 0.3 0.4 0.3 0.3 -0.1 -1.9
Mining & quarrying 0.1 0.2 0.1 0.1 -0.1 -4.5
Manufacturing 12.4 10.1 9.3 8.5 -1.6 -1.2
Electricity, gas &
water 0.0 0.1 0.0 0.0 -0.1 -100.0
Construction 2.7 5.7 3.6 3.9 -1.8 -2.4
Distrib, hotels &
catering 12.5 13.6 12.5 13.6 0.0 0.0
Transport & comms 1.8 1.8 2.0 2.1 0.3 1.0
Financial & bus.
services 5.4 7.9 9.6 11.1 3.2 2.3
‐ 21 ‐Government & other
services 19.8 23.3 22.4 22.9 -0.4 -0.1
Total 55.1 63.0 60.0 62.4 -0.6 -0.1
Key Findings
4.2.10 Cambridge Econometrics drew out a number of key points from the analysis.
Initially they noted that the alternative demographic projections reviewed varied
in vintage and in methodology, covering both trend-based projections and
dwelling-led projections. They concluded that it is not the case that one
approach is inherently ‘better’ or ‘worse’ than the other.
4.2.11 The trend-based projections and dwelling-led projections are two different ways
of thinking about future developments, and each assumes different responses
that need to be tested locally. Dwellings-led projections assume that all housing
constructed will be occupied, while trend-based projections assume that the
associated housing demand will be met.
4.2.12 Comparing the previous preferred dwellings allocation of 540 new dwellings pa
with the implications from the WAG 2006-based projections of approximately 780
new dwellings per annum is not a direct ‘like for like’ comparison.
4.2.13 Cambridge Econometrics considers the CE projections to be the more robust
trend-based projections. The approach used by CE to produce its district
projections seeks to take the strengths of the pure trend-based projections
developed in a detailed demographic model and to refine them through a link to
economic activity. In this case through population projections for Wales that are
informed by relative economic prospects. To this extent they consider the CE
projections to be more robustly based than the Chelmer / WAG trend projections.
4.2.14 The population outcome of the CE (July 2009) projection would result in 9,000
additional households between 2006-21. Equating increases in households to
dwellings, this equates to an annual increase in dwellings of 600 pa over the
period. The projection indicates the largest number of additional dwellings would
be required over 2016-21 at around 880 pa, with much lower numbers required in
the preceding period.
4.2.15 Employment in Bridgend in 2021 is projected to be below that in 2006, and there
is a realistic risk that the gap will be lower than indicated. Demographic
projections using latest underlying trends and employing the assumptions for
additional housing set out in the LDP’s preferred growth option (net annual
increase of 540 dwelling over 2006-21) indicate little change in the size of the
labour force in Bridgend to 2021, and so are broadly in line with the employment
prospects.
4.2.16 The changing industrial structure of employment in Bridgend will result in fewer
manufacturing-related jobs and more managerial, professional and associate-
professional-type jobs. The likely increase in local opportunities of higher value
jobs may mean Bridgend is able to retain more of those who currently commute
out of the district, thereby further increasing its ability to meet its employment
growth.
‐ 22 ‐Implications for the Deposit LDP
4.2.17 In terms of population, housing and employment, the key findings from the study
had the following land-use policy implications for the LDP’s Preferred Strategy
and the Deposit LDP, which in order to be ‘sound’ should be founded on an up-
to-date information base and accommodate the anticipated level of future
development.
4.2.18 Notwithstanding the assessment that the existing level of housing growth as
proposed in the Pre-Deposit Proposals, of 540 dwellings pa, is broadly in line
with economic prospects; CE’s projected population up to 2021 of 144,600,
which implies an average house-building requirement between 2006 and 2021 of
9,000 or 600 dwellings per annum would take the strengths of the pure trend-
based projections developed in any detailed demographic model and refine them
through a link to economic activity.
4.2.19 The future economic context of the LDP is very different to that envisaged at the
time of the Pre-Deposit Proposals, with employment growth overall not expected
to be as strong as previously projected. This will impact on the scale, character
and timing of future employment land provision and allocations in the LDP. The
Deposit LDP should reflect this change in economic context, taking account of
sectoral changes and changes to the underlying industrial base brought about
through the recession.
4.3 Projections used in the Bridgend Deposit Local Development Plan
CE’s 2009-based population projections
4.3.1 CE’s district-level population projections are produced to accompany CE’s
district-level employment projections. The method:
takes account of trend-based projections for the locality published national
statistical offices and departments.
results in projections consistent with independent forecasts for population
in the nations and regions of the UK published by Cambridge
Econometrics.
4.3.2 CE's district level population projections are constructed by applying the growth
rates from the ONS sub-regional population projections by district to the ONS’s
current mid-year population estimates by district, for seven summary age groups;
0-15, 16-24, 25-34, 35-44, 45-59, 60-64, 65+, and then scaling these initial
district estimates to CE's published population forecast for the relevant region (in
this case Wales).
4.3.3 CE’s population forecasts for Wales result from CE's regionalised model of the
UK economy in which the population of Wales is determined by underlying trends
in births and death rates as well as the impact of the relative performance of the
Wales economy on net migration (the prospects for growth in Wales shown in
‐ 23 ‐Table 5 is expected to lead to net migration of 7,000 pa of working-age into
Wales). In particular, migration by those of working age is influenced by the
economic performance of the region in relation to other regions, relative house
prices and relative wages. The underlying trends in birth and death rates are
taken from the latest ONS projections for Wales. CE’s projections of the
population of Wales and the other nations and regions of the UK are in turn made
consistent with overarching projection for UK population, based on the latest
projections published by the Government's Actuaries Department (GAD).
4.3.4 Compared with the ONS migration assumptions for Wales, CE’s view on
migration is for net in-migration of 6,000-7,000 pa, this is lower than is assumed
in WAG projections. This is an important factor differentiating CE’s forecasts of
future population in Wales from those of WAG and hence for Bridgend.
4.3.5 This approach therefore seeks to take the strengths of the detailed methods used
to produce the official projections, such as the detailed analysis of underlying
trends in mortality and birth rates (and the relative attraction of areas to
immigration) and to augment them with a view of overall migration into Wales
that is informed by the prospects for the relative performance of the Welsh
economy. The Council believes that this makes them more ‘robust’ than purely
trend-based projections.
4.3.6 Table 4 shows the population of Bridgend implied by CE’s 2009-based
projections. Under these projections the population of Bridgend rises from
132,600 in 2006 to 144,600 by 2021 and 148,420 in 2026, an increase of 0.5%
pa over the period. The rate of increase is initially higher than this at 0.7% pa
over 2006-2011. Over the remainder of the period it fluctuates between 0.4% pa
and 0.6% pa. CE’s underlying forecast for Wales has the population increasing
from just less than 3m in 2006 to almost 3.2m in 2021, an increase of around
0.5% pa.
TABLE 4: POPULATION OF BRIDGEND
Thousands
2006 2011 2016 2021 2026
Total
population 132.6 137.0 140.6 144.6 148.4
4.3.7 Chart 1 below shows the breakdown of this total population for Bridgend by
broad age-band. This shows that much of the future increase in total population
in Bridgend is expected to come from the 65+ age-band. Bridgend is no different
from most other local authorities in this respect and this trend reflects the
increasing life-expectancy evident throughout the UK. In 2006 those aged 65+
made up just fewer than 17% of total population. By 2026 this proportion is
expected to increase to a little more than 23%. The proportion of the total
population accounted for by those aged 0-15 is projected to decline relatively
sharply to 2011. However, it then levels off and remains at around 17% of the
total population to 2026.
‐ 24 ‐CHART 1: POPULATION BY AGE‐BAND
65+
45‐59
0‐15
25‐34
16‐24 35‐44‐
60‐64
Employment
4.3.8 Cambridge Econometrics’ population projections are partially based on their view
of economic prospects as this affects the attractiveness of an area to population.
Table 5 compares the employment prospects for Bridgend, Wales and the UK.
TABLE 5: EMPLOYMENT PROSPECTS FOR BRIDGEND
% pa
1990-
2000 2000-2006 2008-2012 2012-2015 2015-2021
Bridgend 0.6 2.3 -1.7 0.6 0.4
Wales -0.1 1.6 -1.4 0.8 0.5
UK 0.1 1.0 -1.1 0.5 0.5
4.3.9 The underlying data on which the employment projections are based is the
employment data (number of jobs) from the Annual Business Inquiry (ABI)
although several adjustments are made to the data to produce data consistent
with the latest employment estimates for Wales provided to CE by ONS.
ABI data on employees jobs for all districts in Wales are scaled to the latest
June-based estimates
-This scaling is undertaken separately for each sector and status by sector
and is necessary because the ABI data are not revised as frequently as the
quarterly estimates of employment in Wales published by ONS.
Estimates of self-employment by sector in the district are made
-Rates of self-employment as a proportion of employees in employment by
sector in Wales are applied to local estimates of employees in employment
in the sector.
‐ 25 ‐4.3.10 The projections for Bridgend have been produced using a version of CE’s Local
Economy Forecasting Model (LEFM) calibrated to the locality. These baseline
projections employ the same methodology as was used to develop the previous
2007-based projections used in previous analysis carried out for BCBC, namely
the rationale that the past performance of a sector locally relative to the
performance of the sector in Wales as a whole indicates its future relative
performance. Note that this method does not mean that the future growth in
employment in an industry in Bridgend will be at the same rate as seen in the
past. This will depend whether the underlying prospect for growth in the industry
in Wales is in line with past trends. For those services that mainly serve the local
population, the baseline projection is developed by relating per capita
employment growth in the local area to its counterpart in the UK as a whole.
4.3.11 Table 6 shows the sectoral prospects for employment growth. The pattern of
growth in the long term is for strong growth in financial & business services and
distribution, hotels & catering, and further falls in manufacturing employment.
However, the expectation in these projections was for a fall in employment of
about 600 over the period 2006-2021.
TABLE6: EMPLOYMENT PROJECTIONS FOR BRIDGEND
Thousands Growth, 2006-21
2000 2006 2012 2021 (Thousands) (% pa)
Agriculture etc 0.3 0.4 0.3 0.3 -0.1 -1.9
Mining & 0.1 0.2 0.1 0.1 -0.1 -4.5
quarrying
Manufacturing 12.4 10.1 9.3 8.5 -1.6 -1.2
Electricity, gas & 0.0 0.1 0.0 0.0 -0.1 -100.0
water
Construction 2.7 5.7 3.6 3.9 -1.8 -2.4
Distrib, hotels & 12.5 13.6 12.5 13.6 0.0 0.0
catering
Transport & 1.8 1.8 2.0 2.1 0.3 1.0
comms
Financial & bus. 5.4 7.9 9.6 11.1 3.2 2.3
services
Government & 19.8 23.3 22.4 22.9 -0.4 -0.1
other services
Total 55.1 63.0 60.0 62.4 -0.6 -0.1
Households
4.3.12 CE’s household projections for Bridgend are part of a consistent set of
projections for each unitary authority projections in Wales. In general terms the
local household projections are calculated by:
applying assumptions for average household size locally to the population
projections
‐ 26 ‐ scaling the resulting estimates of households by local authority to the
households forecast for Wales
4.313 Historical estimates for the number of households by unitary authority are taken
from published data. Given the population estimates, this provides an estimate
of average size of households locally.
4.3.14 An initial estimate for future average household size in a locality are made by
applying the growth in average household size from the most recent relevant
projections published by a statistical office or government department. For CE's
July 2009 projections for local authorities in Wales, these trend projections were
the 2006-based projections from the Welsh Assembly Government.
4.3.15 Applying these estimates for average household size in a locality to the
population projections for the area gives an initial estimate of households by
locality. These initial estimates for the number of households locally are scaled
to CE's forecasts for the nations and regions of the UK. For Bridgend this means
that household totals for local authorities are scaled to be consistent with CE's
household forecasts for Wales.
4.3.16 The contextual forecast for total households in Wales is derived from the
projected population according to projected level an assumed level of the
average household size. Historical data of the average household size are
calculated from data on population and the number of households. These data
are projected over the forecast period by applying official projections of the
average household size.
Implications for Dwellings
4.3.17 CE’s projections do not contain projections for dwellings directly. The dwelling
numbers associated with CE’s population and household projections are implied
from the change in the number of households and the assumption is that there is
a one-to-one relationship between the increase in households and the increase
in dwellings. Where households and dwellings are not assumed to be equal this
is usually for one of two reasons: (1) there are shared dwellings (more than one
household in a dwelling) and/or (2) there are vacant dwellings.
4.3.18 Implicit in equating the increase in households with the increase in dwellings is
an assumption that the number of vacant dwellings will not alter from their current
level (which given the increase in the households means that the number of
vacant properties as a proportion of the total number of dwellings will fall) and the
number of shared dwellings will also remain unchanged. Table 7 shows the
implied dwellings requirement resulting from CE’s population and household
projections.
‐ 27 ‐You can also read