Severn preliminary flood risk assessment - December 2018 - Natural Resources ...
←
→
Page content transcription
If your browser does not render page correctly, please read the page content below
Severn preliminary flood risk assessment
December 2018
The Environment Agency in England and Natural Resources Wales have
worked together to produce this report.
We work together to manage flooding on the River Severn and its tributaries. The cover
photo shows how important this is. This is an area in Wales where the River Vyrnwy joins
the River Severn. Historically, river embankments (known locally as ‘argaes’) were built to
stop farmland from flooding. In large flood events, these overtop from the river at different
times and floodwater gets stored on the floodplain. This helps to reduce the impact of river
flooding downstream in England in towns like Shrewsbury and Ironbridge. Photo credit:
Richard Becker / Alamy Stock Photo

About the Environment Agency
We are the Environment Agency. We protect and improve the environment.
We help people and wildlife adapt to climate change and reduce its impacts,
including flooding, drought, sea level rise and coastal erosion.
We improve the quality of our water, land and air by tackling pollution. We
work with businesses to help them comply with environmental regulations. A
healthy and diverse environment enhances people's lives and contributes to
economic growth.
We can’t do this alone. We work as part of the Defra group (Department for
Environment, Food & Rural Affairs), with the rest of government, local
councils, businesses, civil society groups and local communities to create a
better place for people and wildlife.
Published by:
Environment Agency
Horizon House, Deanery Road,
Bristol BS1 5AH
Email: enquiries@environment-agency.gov.uk
Environment Agency website
Further copies of this report are available from our publications catalogue: Publications
catalogue or our National Customer Contact Centre: 03708 506 506
Email: enquiries@environment-agency.gov.uk

       2 of 54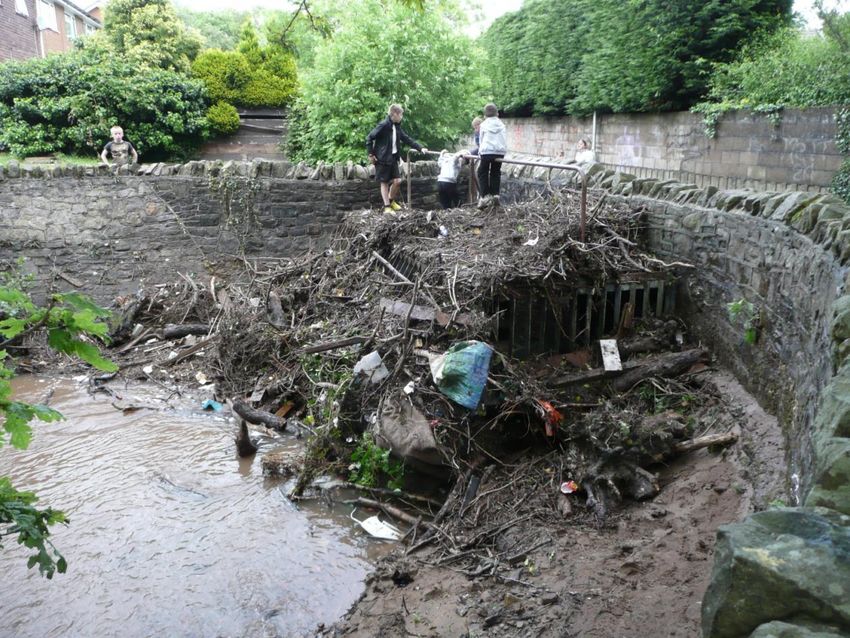
Published by:
Natural Resources Wales
Cambria House
29 Newport Road
Cardiff
CF24 0TP
0300 065 3000 (Mon-Fri, 8am - 6pm)
enquiries@naturalresourceswales.gov.uk
www.naturalresourceswales.gov.uk

© Natural Resources Wales and Environment Agency 2018
All rights reserved. This document may be reproduced with prior permission of
Natural Resources Wales and the Environment Agency
Working together
The River Severn is the longest river in Britain. It starts in the Welsh
mountains and flows for 350km through the Welsh and English countryside
until it meets the sea in the Bristol Channel in England. There are many
towns and cities in the river basin district, including Newtown, Welshpool,
Newport and Cardiff in Wales and Shrewsbury, Worcester, Coventry,
Gloucester, Hereford and Bristol in England.
The 2013 / 14 winter storms and flooding had significant impacts on many
communities, businesses, infrastructure and the environment in the
catchment. In the future a changing climate could create more weather
extremes leading to more frequent and more severe flooding.
The Environment Agency and Natural Resources Wales (NRW) work
together to manage flood risk in the Severn river basin district. We have
jointly produced this report to meet our requirements in the European Floods
Directive (2007/60/EC). These requirements are transposed into the Flood
Risk Regulations (2009) in England and Wales.
The Regulations require us to complete a flood risk assessment and produce
supporting maps of the river basin district. This is known as a preliminary
flood risk assessment (PFRA). We have considered both past and potential
future floods and their impact on human health, the economy, the
environment and cultural heritage.
We have then used this information to identify areas where there is a
significant risk of flooding. These are known as flood risk areas (FRAs). This
will help us prioritise our flood risk management interventions for people, the
economy and the environment (including cultural heritage) by focussing our
efforts on those communities with the greatest risk from flooding.
We will jointly produce flood risk and flood hazard mapping by the end of
2019 and flood risk management plans (FRMPs) by the end of 2021 for FRAs
to meet the next steps under the regulations. FRMPs will include actions to
address the risks within FRAs.
This report has identified nine FRAs in the Severn river basin district and
these will be our priority over this flood risk regulations cycle. We will continue
to plan for and manage the risk of flooding to all communities at risk in the
Severn river basin district, whether they are within in a FRA or not to ensure
people, the economy and the environment are resilient now and in the future.

      4 of 54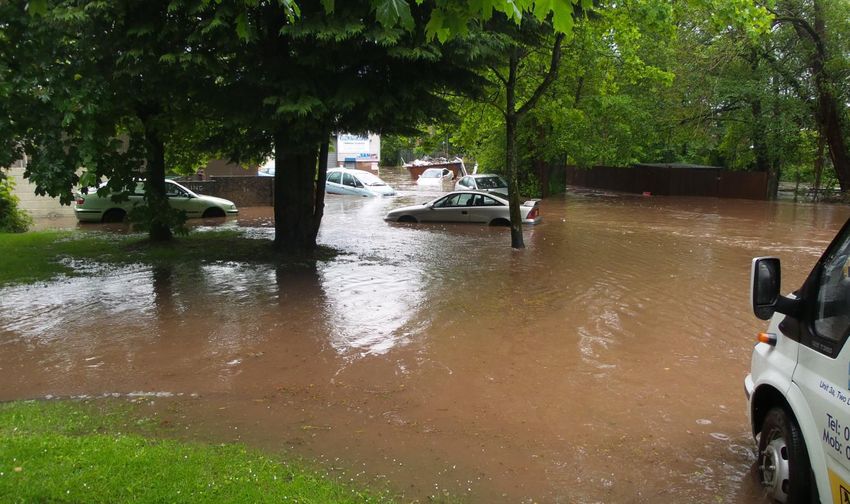
Contents
   Severn preliminary flood risk assessment ........................................................................1
Working together ...............................................................................................................4
Contents .............................................................................................................................5
   Introduction ....................................................................................................................7
   About preliminary flood risk assessments ........................................................................7
   The Severn river basin district (RBD) ...............................................................................7
   Working together ............................................................................................................12
   What this report covers in England (in section A) ...........................................................13
   What this report covers in Wales (in section B) ..............................................................13
Section A: The Severn RBD in England .........................................................................14
   Past flooding ................................................................................................................14
   A brief history of recent flooding in the Severn RBD from rivers and the sea .................14
   How do we use information on past flooding? ................................................................16
   Reservoir flooding...........................................................................................................17
   Potential flooding.........................................................................................................18
   Risk of flooding from main rivers and the sea .................................................................18
      The Risk of Flooding from Rivers and the Sea map ................................................................................................. 19

   How we map floodplains for river and sea flooding ........................................................20
      The flood map for planning ....................................................................................................................................... 20

   How we check the modelling is realistic .........................................................................22
   The impact of climate change and long-term developments ..........................................22
   RBD flood risk information .........................................................................................24
   How we assess the consequences of potential floods ....................................................24
      Human health consequences ................................................................................................................................... 24
      Economic consequences .......................................................................................................................................... 24
      Environmental consequences .................................................................................................................................. 24
      Cultural heritage consequences ............................................................................................................................... 25

   Rivers and sea................................................................................................................25
   Reservoirs ......................................................................................................................25
      The risk of flooding from reservoirs map .................................................................................................................. 26

   Flood risk areas ...........................................................................................................27
   What is a flood risk area? ...............................................................................................27
   How we have defined flood risk areas ............................................................................27
   Calculating the community risk score .............................................................................27
   Using the community risk score ......................................................................................29

            5 of 54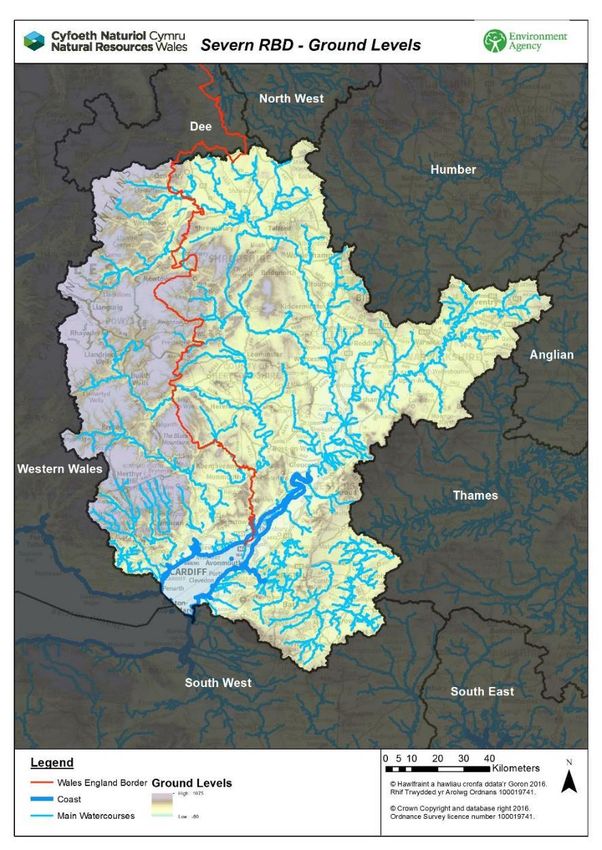
Identified flood risk areas ................................................................................................29
Section B: The Severn RBD in Wales.............................................................................31
  Roles and Responsibilities .............................................................................................31
  What this section contains ..............................................................................................31
   Methodology ................................................................................................................32
  Thresholds ......................................................................................................................32
   Past Flood Risk ............................................................................................................33
  Groundwater flooding .....................................................................................................36
  Reservoir flooding...........................................................................................................36
   Potential Flood Risk ....................................................................................................37
  The impact of climate change .........................................................................................37
  Consequences for people, the environment, cultural heritage and economic activity.....38
  Groundwater flooding .....................................................................................................39
  Reservoir flooding...........................................................................................................39
   Flood Risk Areas..........................................................................................................40
  Methodology for defining flood risk areas .......................................................................42
  Flood risk areas ..............................................................................................................42
                                                                                 ...................................................44
  Flood risk areas in the Severn RBD ...............................................................................44
  Next steps.......................................................................................................................45
    References .................................................................................................................47
    Glossary .....................................................................................................................51

Map of proposed flood risk areas in England
This is available separately to the report. This map shows how the proposed flood risk
areas are distributed around England. It is a larger version of the map you can find in
Chapter 5 of this report. You can find it on data.gov.uk.

         6 of 54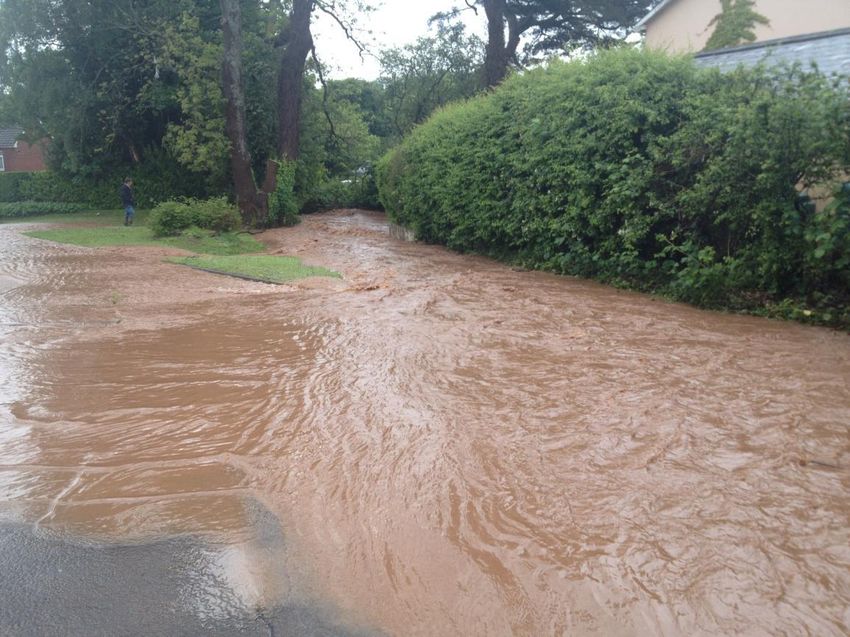
Introduction
This report covers the Severn river basin district (RBD) and meets the requirements of the
Flood Risk Regulations (2009). The Environment Agency and Natural Resources Wales
have worked together to produce the report.

About preliminary flood risk assessments
The European Floods Directive (2007/60/EC) requires EU member states to assess and
map flood risk and plan for managing it. These requirements are transposed into the Flood
Risk Regulations (2009), which set out the process for completing an assessment of flood
risk known as a preliminary flood risk assessment (PFRA) and producing maps of river
basin districts (RBDs). The Regulations require us to use this information to identify areas
where there is a significant risk of flooding.
Flood risk areas (FRAs) are areas where the risk of flooding is likely to be significant for
people, the economy or the environment including cultural heritage. By risk we mean not
just the chance that flooding will occur (the probability), but also the impact of the flooding.
For FRAs, we will undertake flood risk and hazard mapping and produce flood risk
management plans (FRMPs). We will use FRAs to help us identify those locations where
engagement and partnership working to develop a FRMP will help resolve complex
flooding issues. For areas not identified as FRAs, we will also continue to manage flood
risk as necessary.
In England and Wales, the regulations direct the Environment Agency (for England) and
Natural Resources Wales (NRW) (for Wales) to undertake PFRAs and identify FRAs for
river, sea and reservoir flooding. Lead local flood authorities (LLFAs) do this work for
surface water, smaller watercourses and groundwater flooding and collaborate closely with
the Environment Agency and NRW to ensure that all sources of flood risk are managed
within the RBD. The cycle of work repeats every six years. Flood hazard and flood risk
maps are due in 2019 and FRMPs in 2021 for this cycle.
LLFAs completed PFRAs and an assessment of FRAs in 2017:
   – you can find these for England on GOV.UK. English LLFA PFRAs
   – you can find these for Wales on the NRW website (naturalresources.wales) Welsh
     PFRAs (English)

The Severn river basin district (RBD)
We present information at a large river catchment scale and these areas are known as
river basin districts (RBDs). A RBD covers an entire river system, including rivers, lakes,
groundwater, estuaries and coastal waters.
The Severn RBD covers an area of 21,500 kilometres squared. Part of the RBD is in
England and part of it is in Wales. The Severn is the longest river in Britain, stretching 350
kilometres from its source to the mouth of the Bristol Channel. The RBD has a varied
landscape, from the uplands of Wales, to the valleys and rolling hills of central England
and the lowlands of the Severn Estuary. The main tributaries in England are the
Warwickshire Avon, Teme, Wye and Bristol Avon. The main tributaries in Wales are the
Wye, Usk and Taf.

       7 of 54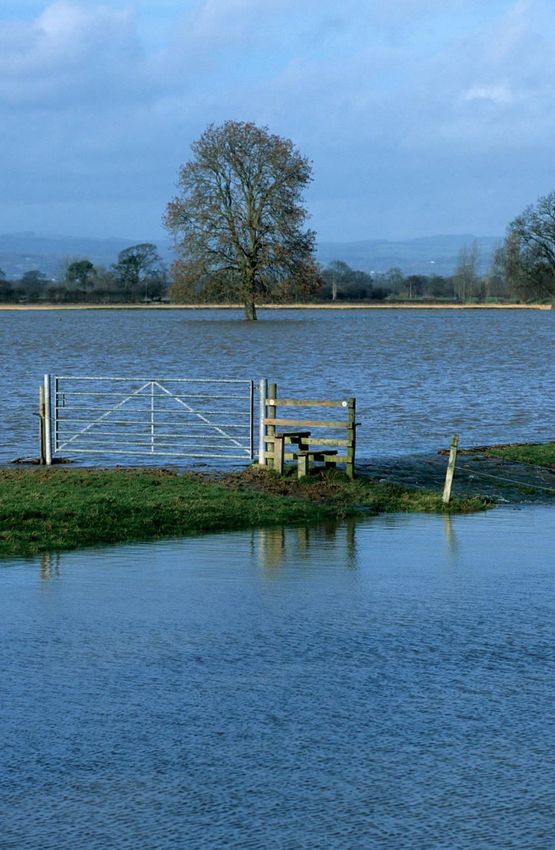
The maps below show where the Severn RBD is compared to the other RBDs in England
and Wales.
Figure 1. Location and map of the Severn RBD
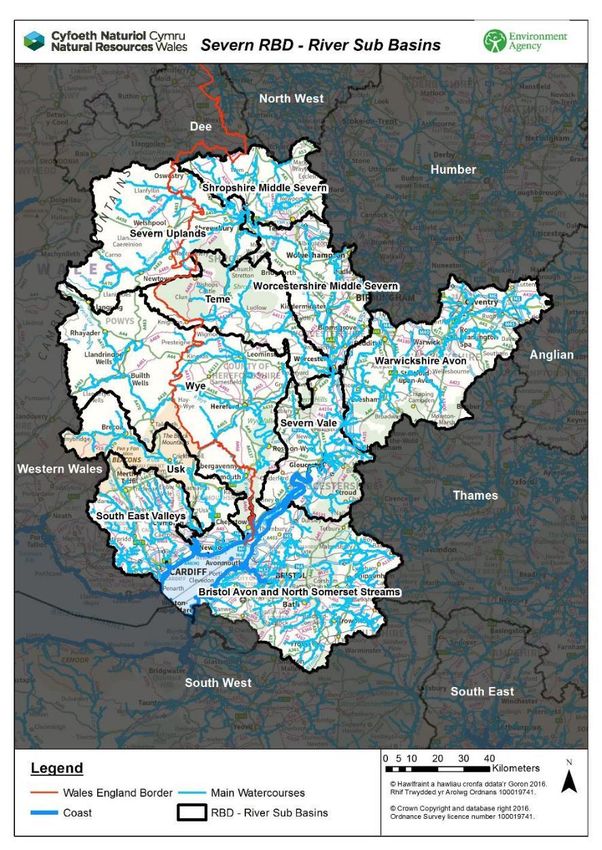
We have also prepared preliminary flood risk assessment maps to show:
– River sub basins (sub catchments in the Severn RBD (Figure 2)
– Topography (the variation in ground levels) in the Severn RBD (Figure 3)
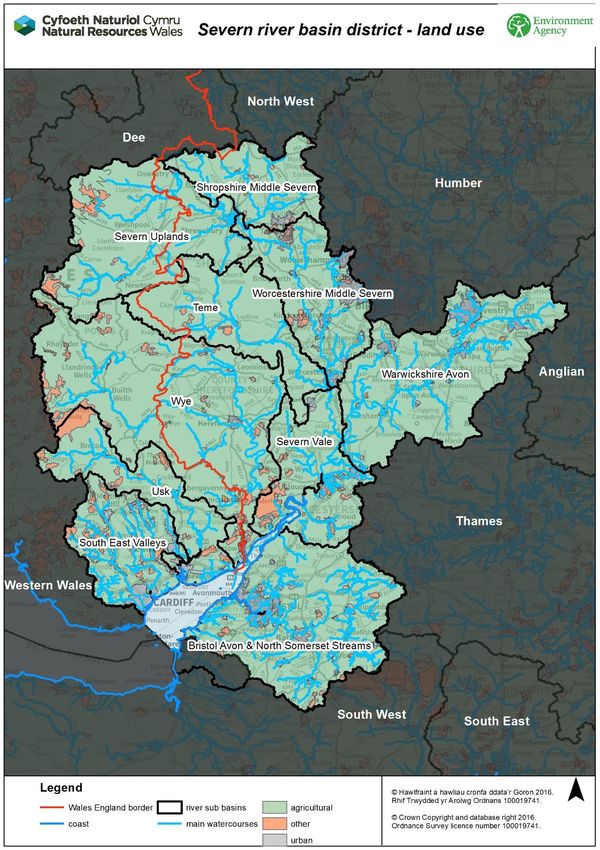
– Land use in the Severn RBD (Figure 4)
These maps also show the RBD, any sub RBD boundaries and the coastline.
8 of 54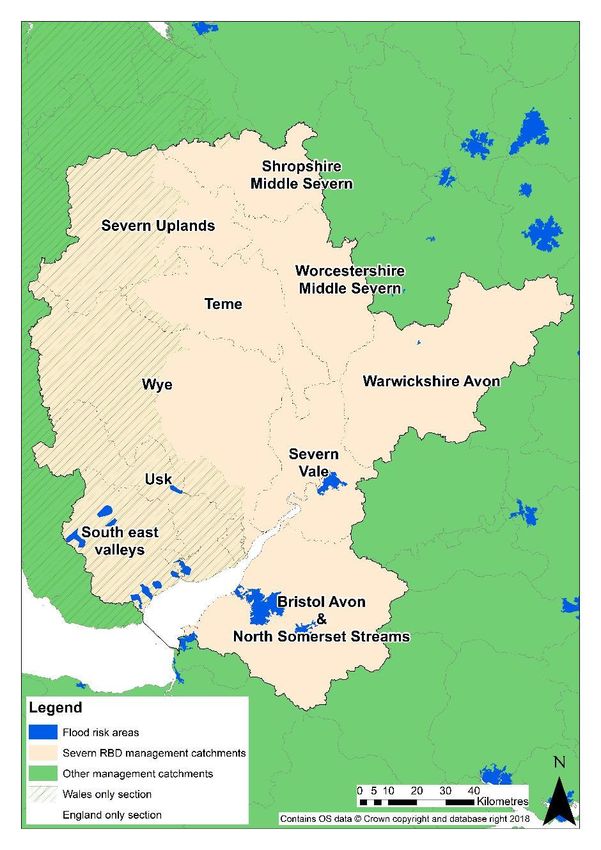
Figure 2. Map of river sub basins in the Severn RBD

       9 of 54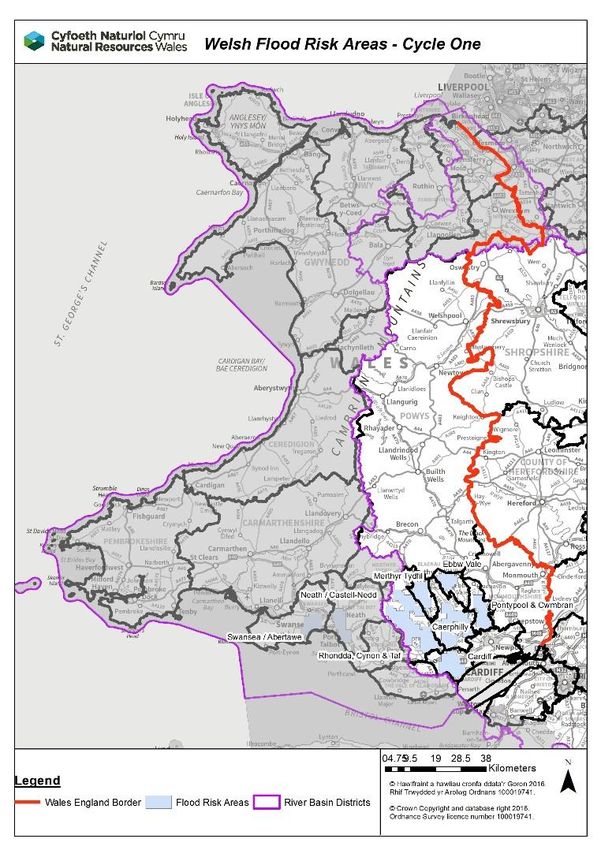
Figure 3. Map of ground levels in the Severn RBD

       10 of 54
Figure 4. Map of land use in the Severn RBD
11 of 54The Severn RBD is home to more than 5.75 million people, and includes major urban
centres such as Bristol, Cardiff, Coventry, Worcester, Shrewsbury and Gloucester. Outside
these areas, it is mostly rural, with land managed for agriculture and forestry.
The water bodies of the Severn RBD are made up of 7,512 kilometres of river, 76 lakes,
36 canals, 40 groundwater bodies and 545 kilometres squared of estuary. The sheer size
of the RBD gives rise to the huge variety of land uses, geology and topography. The
catchment contains a wide range of habitats associated with its upland areas, river valleys
and floodplains, farmed landscapes and urban areas. The natural environment is also
valued for its navigational and recreation uses and is an attraction for the people who live
and work there, plus the many tourists who visit. The Environment Agency and NRW also
use RBDs to plan water quality work through river basin management plans (RBMP).
RBMPs set out how organisations, stakeholders and communities will work together to
improve the water environment. RBMPs were published in 2015:
– You can find these for England on GOV.UK. River basin management plans 2015
– You can find these for Wales on River basin management plans published 2015-
2021 (English)
RBDs are similar to the catchment boundaries used by Regional Flood and Coastal
Committees (RFCCs). RFCCs are committees established by the Environment Agency
under the Flood and Water Management Act (2010). They are made of members
appointed by LLFAs and independent people with relevant experience. The Environment
Agency must consult with RFCCs about flood and coastal risk management work in their
region and take their comments into account. In England the English Severn and Wye and
Wessex RFCCs (for the Bristol Avon catchment) cover the Severn RBD.
RFCCs do not exist in Wales. The recently formed Welsh Flood and Coastal Erosion
Committee covers the Welsh parts of the Dee RBD, and advises Welsh Government
Ministers on all aspects of flood risk management. The Flood and Coastal Erosion
Committee replaces the previous Flood Risk Management Wales committee, which was
the Wales equivalent of an RFCC for Natural Resources Wales.
Working together
The Environment Agency and NRW work together to manage flood risk in the Severn RBD
and a formal agreement sets out how we do this. We do take different approaches but we
share data and regularly liaise on the planning and delivery of FRM services. For example,
we work together to forecast and warn for floods as they pass through the Severn
catchment and we make sure that flood schemes do not make flooding worse up or
downstream.
There is a Wales/England cross border group to oversee our work under the Regulations
and ensure it is joined up. For the Severn RBD:
– We have produced a shared PFRA (this document)
– We will work together on flood risk and hazard maps (due in 2019)
– We will work together on FRMPs (due in 2021)
We have presented the next sections of the report in two different parts. Part A covers
England and Part B covers Wales. This is because we take different but complementary
approaches to how we assess flood risk.
12 of 54What this report covers in England (in section A)
This preliminary assessment report provides information on past and potential future flood
risk from main rivers, reservoirs and coastal flooding. You can find more information about
main rivers and a map online on GOV.UK main river map for England.
We have reviewed past flooding events and used our understanding of flood risk to assess
what could be affected by flooding. We then have used this information to identify
significant FRAs. We then set out the work we are going to do next to meet the
requirements of the Regulations.
To find information on flooding from surface water, smaller watercourses and groundwater
flooding, please view the LLFA PFRAs and FRAs.
What this report covers in Wales (in section B)
This preliminary assessment report provides information on past and potential future
floods from any source: main river, reservoirs, the sea, surface water, ground water and
from ordinary watercourses. There are not separate reports for Lead Local Flood
Authorities and for NRW, it is consolidated in one report.
We have reviewed past flooding events and used our understanding of flood risk to assess
what could be affected by flooding. We then have used this information to identify
significant FRAs for all sources of flooding. Following this, we set out the work we are
going to do next to meet the requirements of the Regulations.
13 of 54Section A: The Severn RBD in England
Past flooding
England has experienced major flooding from the rivers and the sea in the
past. We have explored here the most significant floods in recent history that
have helped us to learn more as a nation about the nature of flooding.
Historic records tell us that flooding has occurred dating back hundreds (and
even thousands) of years. This information is largely based on historical
information, such as newspaper stories and pictures, rather than scientific
records.
A brief history of recent flooding in the Severn RBD from rivers
and the sea
Due to its size, river basin district-wide events are extremely rare, though large parts of the
RBD have been affected during individual incidents. The most recent major events that
impacted over large parts of the RBD include 1947, 1968, 1998, 2000 and 2007. The 2007
event was the largest flood in England in recent history.
Other smaller more localised events, such as those experienced in 2014, can be very
disruptive to communities within the area affected. Historically, infrastructure and many of
the transport links connecting communities have been built within floodplains. Road
flooding causes access issues and travel disruption. Water can take many weeks to drain
from the floodplain and this delays the recovery of the communities affected by flooding.
Flooding events have been recorded throughout the RBD since the thirteenth century.
We know most about the flooding that has happened in the last 50-100 years because
better records have been kept. We have hundreds of records about flooding that have
informed what we know about the causes and consequences of it happening. The main
sources are flooding from the sea and flooding from prolonged rainfall, torrential rainfall
and rapid snow melt. We have explored these in more detail below.
Although unusual in England, rapidly melting snow can cause major and
widespread flooding and loss of life. In the winter of 1946-1947, heavy snow fell for
55 days that caused a large build-up of snow. This melted rapidly in March 1947,
leading to widespread flooding in the Severn catchment, including Worcester, Bewdley,
Gloucester and Shrewsbury. In December 1965 snow melted rapidly and there was major
flooding on the River Frome.
Torrential rainfall can cause flash flooding in smaller river catchments. Many of the
smaller steeper catchments like Much Wenlock and Church Stretton in Shropshire and
Chew Magna in Somerset are particularly vulnerable to this type of flooding and have
suffered from repeated flash flooding.
Combined high tides and a sea surge during storms causes the most severe
flooding on the coast. In December 2000, a high tide combined with high river levels
flooded 45 properties in the Gloucester and Tewkesbury areas. In the lower reaches of the
River Wye tidal flooding has also impacted on communities around Chepstow such as
14 of 54Brockweir and Tintern. The most recent events occurred in 2014 with the previous highest
recorded event occurring in December 1981.
Continuous heavy rainfall over a long time causes major and widespread flooding,
especially when this follows earlier rainfall and the ground is already wet. There was
major river flooding in 1968 on the River Avon at Warwick and Evesham. In Easter 1998,
heavy rain fell in the Midlands resulting in extensive flooding which tragically led to 2
deaths. Over 1,000 properties and 1,400 caravans were flooded in the Severn RBD.
Widespread flooding of highways and farmland particularly affected the Warwickshire
Avon.
Autumn 2000 was the wettest recorded in the British Isles and rivers rose to record levels.
Communities affected by these floods included Tewkesbury, Upton-upon-Severn and
Gloucester.
More recently in 2007, prolonged heavy rainfall in June and July caused widespread
flooding throughout the Severn catchment. An estimated 10,000 properties were affected
in the Severn RBD. Towns and villages became cut off and the M5, M40 and M50 were
closed. 350,000 people were without drinking water when Mythe water treatment works
flooded. Road and rail passengers were stranded and the estimated damage in
Worcestershire alone was up to £6.4m a week. We worked with emergency services and
the military to help prevent the loss of electricity at Walham and Castle Meads sub
stations.
We have summarised below the most significant flood events to have affected the Severn
RBD from 2011, which is when the first cycle of flood risk management planning began
under the regulations. These floods had significant harmful consequences at a national
level to human health, the economy, the environment and/or cultural heritage. They have
also significantly improved our understanding of flood risk and changed how we approach
and manage flooding.
In autumn 2012 a series of heavy rainfall events, including 4 major storms in one week in
November, caused widespread river flooding because they fell on saturated ground.
15 of 54Figure 5. The impacts of the 2012 floods in the Severn RBD
Between December 2013 and March 2014, high tides and series of heavy rainfall events
caused tidal flooding and repeat river flooding. It was the stormiest weather in England for
20 years.
Figure 6. The impacts of the Winter 2013-14 floods in the Severn RBD
In March 2016, heavy rainfall overnight caused flooding in the Warwickshire Avon
catchment. Up to 70 low-lying properties were affected and there was localised road and
rail disruption. It was the worst flooding in the area since Easter 1998.
How do we use information on past flooding?
Our understanding of flood risk is not static and it has changed over time with each major
flood. We learn more about what causes flooding and how severe it might be by observing
16 of 54our weather conditions, how flooding happened and recording where flooded. We use this
information to:
– Map the largest recorded extent of flooding known to have happened. We call this
our historic flood map
– Understand how extensive the flooding was, the depth and flow, what it affected
and the route flooding took . This information is often very detailed and locally
specific. Such information can sometimes be found on Lead Local Flood Authority
(LLFA) websites in their flood investigation reports
– Inform estimates of the highest rainfall totals, maximum river flows and highest tide
levels that might be expected over a given time period. We use this to inform our
computer models that generate floodplain extents and inform our predictive flood
maps
– After major floods, such as 1953, 1998, 2000 and 2007, the government
commissioned lessons learnt reports. These document what happened and have
informed how we and others have adapted our approaches to managing flood risk
over time. You can find these reports on GOV.UK
Reservoir flooding
There are 132 reservoirs in England and 135 reservoirs in Wales in the Severn RBD.
Reservoirs have different purposes. They have been built to feed canals, reduce flood risk,
irrigate farm land, for fisheries and provide water supply. The larger reservoirs, such as
Clywedog, Elan and Vyrnwy in Wales, were mainly constructed for water supply. They
have a limited effect on flood flows downstream, although they can help to locally
attenuate flood waters.
Reservoir flooding is extremely unlikely to happen. All large reservoirs must be inspected
and supervised by specialist Reservoir Engineers. We enforce the 1975 Reservoirs Act in
England and we make sure that that reservoirs are inspected regularly and important
safety work is done.
Our legislation is also kept under review to ensure reservoirs are managed to high
standards by third parties and a consistent level of operation is maintained.
There has been no reservoir flooding in England resulting in a loss of life since 1870, when
a reservoir at Rishton, Lancashire failed. The last event in England causing major loss of
life was slightly earlier in Yorkshire in 1864, when the Dale Dyke Reservoir failed whilst it
was being filled for the first time, leading to 250 fatalities in the Sheffield area. The
government made reforms to reservoir standards following the tragedy.
17 of 54Potential flooding
We use computer modelling to map floodplains so that we can understand
the areas most likely to flood. And we use historic records to check our
results are representative of what we know has happened in the past. This
helps us to have a consistent understanding of flood risk across the country
regardless of the records available for a given area. We also consider the
flood risk impacts of climate change and planned development. We use this
information to inform actions that we and others take to manage flood risk
and to raise awareness in communities that could be affected.
Risk of flooding from main rivers and the sea
The Environment Agency undertake a national assessment of flood risk across the entire
country, taking into account the likelihood of flooding and potential consequences known
as the National Flood Risk Assessment (NaFRA). NaFRA has recently been updated to
include the results of the survey of all the flood defences in England we completed after
the winter 2013/14 flooding. NaFRA tells us how risk levels vary across the floodplain and
shows the reduction in risk where we have defences. We have assessed different
scenarios so that we could see how much difference current flood defences and
maintenance work make to flood risk. We now use this information to make decisions
about future investment in flood defences and other interventions to increase the resilience
of local communities.
Risk management authorities (RMAs) have worked together to reduce the risk to many
thousands of properties. Since 2007, RMAs have constructed or improved flood defence
schemes in the Severn RBD reducing the risk of flooding to communities. In England
these include:
• flood defence schemes along the River Severn, at Shrewsbury, Bewdley, Worcester
(Hylton Road), Kempsey, Upton–upon-Severn, Uckinghall, Deerhurst, Prestbury and
Cheltenham;
• flood defence schemes on the River Wye, protecting areas of Hereford, Hampton Bishop
and Ross-on-Wye;
• flood defence schemes on Horsbere and Daniels brooks, protecting parts of Gloucester;
• a flood defence scheme on the Warwickshire Avon in Rugby protecting large parts of the
town;
• a flood storage area to the north of Kidderminster, which reduces the risk of flooding in
the town centre from the River Stour;
• new flood defences in the Bristol Avon catchment, protecting communities such as
Wrington, Chew Magna and Radstock.
Flood defences have also been constructed in smaller communities and some of these
have been community-led. Many of these schemes protected properties from flooding in
2012 and 2014. RMAs have spent over £65 million building new defences and maintain
existing ones since the 2007 floods. By 2021, they plan to spend a further £50 million to
protect about 3,000 homes and maintain existing defences.
18 of 54The Risk of Flooding from Rivers and the Sea map
The Risk of Flooding from Rivers and the Sea map is a summary version of the NaFRA
that we publish on the government website. It shows the chance of flooding from rivers
and the sea presented in categories that take account of flood defences and the condition
they are in. The categories are:
– high risk means that each year, there is a 3.3% chance or greater of flooding
– medium risk means that each year, there is between a 1% and 3.3% chance of
flooding
– low risk means that each year, there is between a 0.1% and 1% chance of flooding
– very low risk means that each year, there is less than 0.1% chance of flooding
Figure 7. Extracts from the risk of flooding from rivers and the sea
You can view this map at find out if you're at risk of flooding in England.
19 of 54How we map floodplains for river and sea flooding
How we map floodplains has changed over time from plotting the extent of previous floods
to taking full advantage of modern technology and using computers to process large
amounts of data. We have summarised how we do this below.
Figure 8. How we model floodplains
The Environment Agency publishes a national scale map of mapped floodplains known as
'the flood map for planning'. This is available through GOV.UK (add link) and is a collection
of local detailed modelling, high level national scale modelling and historic flood extents.
Developers and local planning authorities use this map to help make decisions on the
locations and suitability of planned future development, so the most vulnerable
development can be located to areas with the lowest likelihood of flooding.
The flood extents don't take into account flood defences and so they are precautionary.
This is because not all flood defences are the same: they offer different standards of
protection and are in different conditions. There is always a chance that flooding could
occur behind defences if they are overtopped in an extreme flood and/ or fail. The flood
map for planning allows us to take this into account in long term land use planning
decisions.
The flood map for planning
The flood map for planning shows river and sea flooding across different flood zones.
These flood zones have different flood likelihoods. National planning policy tells planners
and developers how to use these flood zones to inform planning decisions. This map
shows:
– Flood zone 1: Low probability: less than a 0.1% chance of main river and sea
flooding in any given year
– Flood zone 2: Medium probability: between a 1% and 0.1% chance of main river
flooding in any given year or 0.5% and 0.1% chance of sea flooding in any given
year
20 of 54– Flood zone 3: High probability: greater or equal to a 1% chance of main river
flooding in any given year or greater than a 0.5% chance of sea flooding in any
given year
– the routes of major flood defences
– areas that benefit from major flood defences
– main rivers: the larger rivers that we undertake flood risk management on
– flood storage areas (none on this example)
Figure 9. Extract from the flood map for planning
You can view this map at flood map for planning.
21 of 54How we check the modelling is realistic
We use data from past flooding to check that the outputs of our river models are realistic.
The data can include:
– recorded flood levels and flows from river gauging stations
– the amount of rain that fell
– recorded flood extents e.g. from photos and mapping where a flood has left debris
behind, and
– recorded flow paths e.g. from accounts of how things flooded
If the checking shows that the predicted flooding for flood event that is a similar size to one
that has been experienced is not quite right, we amend our model until we get it to
represent as closely as possible what happened. The amount of data available to check
our models varies from place to place and this affects how much we can check our
models.
Often there is less information available to check models for extreme flood events. After
the flooding in winter 2015-16, when some flood defences were overwhelmed, we wanted
to understand more about how extreme flooding could get. Scientists did this by
calculating the most likely extreme rainfall and sea levels we might get and mapping the
extent of flooding that would happen. The extents of flooding compared well to the existing
extreme flooding information that the emergency services use to plan for flood response.
This gives us confidence that our extreme flood outlines (a combination of flood zones 2
and 3 on the flood map for planning) represent realistic severe fluvial and tidal flooding.
The impact of climate change and long-term developments
Flood risk changes over time. There are many reasons for this - population increase, new
development and changes in the way land is managed – but the main reason is climate
change. Our climate is influenced by both naturally occurring variations in the climate
system and human activity, such as increasing greenhouse gas emissions. General
climate change projections show an increased chance of warmer, wetter winters and
hotter, drier summers with a higher likelihood of more frequent and intense rainfall. We
expect to see an increase in severe events, such as flooding. At the same time, sea levels
are gradually rising, as the oceans warm up and ice caps melt. Based on recent
observations, we already know that:
– 2017 was the fifth warmest year over land in a record that began in 1910
– nine of the ten warmest years in the UK have been since 2002 and the top ten have
all occurred since 1990
– seven of the ten wettest years for the UK have been since 1998
– sea levels have risen by about 16cm since the beginning of the twentieth century,
when corrected for land movement. (This is the way that the land mass of the
England is changing after the last ice age. The huge mass of the ice weighed down
the land and it is now readjusting, rising in the north west and sinking in the south
east)
Damages from flooding and coastal change are already high, averaging an estimated £1
billion per year in the UK. The Climate Change Risk Assessment says that under the 4°C
warming scenario (by this we mean the scenario for the 2050s that shows average
temperatures are 4°C warmer than today), the number of households at a significant
22 of 54chance of flooding (3.33% chance of flooding in any one year) is projected to increase
from 860,000 today to 1.9 million by the 2050s. Whilst government is committed to limit
global warming to well below 2 ºC, planning for a reasonable worst case scenario (4 ºC)
allows us to take a risk based approach.
The Environment Agency has published climate change guidance on GOV.UK which sets
out how to make an allowance for climate change when estimating future river flows, sea
levels and rainfall intensity. We and others use this when designing new flood and coastal
defences and making decisions about the safety of new developments. The guidance is
based on climate change projections from 2009 and different scenarios of carbon dioxide
(CO2) emissions to the atmosphere. There are different allowances for different periods of
time over the next century. It is important to remember though that there is uncertainty
about future climate change and the exact way this will affect flood risk.
Scientists are currently updating the climate change projections for the UK. These are due
to be published in late 2018 and will give greater regional detail. We will consider the
impact the new projections will have on future flooding and reissue the guidelines after
publication for the full set of river, sea and rainfall projections.
As well as climate change, flood risk in the future will also be affected by:
– new developments that can generate more and faster runoff from rainfall that enters
our rivers
– the number of properties that will be built on floodplains
– population growth, as more people live and work in areas at risk
– ageing assets, like flood embankments and underground culverts that are more
likely to fail as they age
Decisions about investment in flood defences and the range of different actions we take to
adapt to climate change will also affect future flood risk. We will need to invest in
measures that work alongside traditional flood defences to help manage future flood risk.
This includes property resilience, natural flood management and temporary barriers. We
must continue to increase our understanding of flood risk under a changing climate and
maintain policy and implementation by the Environment Agency, local authorities and
developers to manage future flood damages and create resilient places. Current policy
steers the most vulnerable development away from areas at high risk of flooding, but
where development does need to go ahead there are policy safeguards to ensure
development will remain resilient to the long-term effects of flooding, including climate
change impacts.
23 of 54RBD flood risk information
How we assess the consequences of potential floods
The information below describes the metrics we have used in this section and how these
meet our requirements to explore flood consequences in the Regulations.
Human health consequences
How we have measured it: The number of people at risk of flooding, based on how many
residential properties could be affected and multiplying this using statistical evidence on
how many people live in these properties.
Other indicators: The impacts on both physical and mental human health are wide
ranging. Flooding can also affect people in different ways, for example, depending on their
age and levels of social deprivation. This information is harder to measure consistently at
a national and strategic level.
Economic consequences
How we have measured it: The number of non-residential properties (businesses) and
key services at risk of flooding. This can tell us the scale of the likely impact on the local
economy at a nationally consistent scale. However, locally it does not tell the full picture as
some businesses are larger than others e.g. large local employers compared to small
independent businesses.
Other indicators: There are many other measures of economic damage, such as the
financial losses to businesses, agriculture and due to infrastructure loss. The length of
road and rail affected can also be calculated.
Impacts can also be felt wider than the immediately flooded area e.g. when roads are
closed and people struggle to get to work or when gas lines are disrupted, affecting fuel
supplies.
However, given the national and strategic nature of this report, the location of businesses
and key services provides a high-level overview of economic impact.
Environmental consequences
How we have measured it: The area of Special Area of Conservation (SAC) has been
used as an indicator at a national level of internationally significant conservation sites that
could be affected by flooding.
Other indicators: There are other environmental designations such as regionally and
nationally important sites e.g. Sites of Special Scientific Interest (SSSI), international
designations such as RAMSAR and Special Protection Areas (SPAs) and information on
protected species.
However, given the national and strategic nature of this report, the area of SAC affected
provides a high-level overview of environmental impact.
24 of 54Cultural heritage consequences
How we have measured it: The number of listed buildings (LBs) at risk has been used as
an indicator at a national level of significant cultural heritage sites that could be affected by
flooding.
Other indicators: There are other cultural heritage designations such as World Heritage
Sites, Scheduled Monuments and Registered parks and gardens.
However, given the national and strategic nature of this report, the number of LBs affected
provides a high-level overview of the scale of impact of flooding on cultural heritage.
Rivers and sea
The table below shows the risk to human health, the economy, the environment and
cultural heritage in the Severn RBD in England for river and sea flooding.
Table 1: Risk from river and sea flooding in the Severn RBD
People at risk Non-residential Key services at SACs at risk Listed buildings
properties at risk at risk
risk
17,213 2,031 306 5,967 956
Reservoirs
The likelihood of flooding from a reservoir is far lower than for other types of flooding.
Legislation ensures reservoirs are regularly inspected by trained civil engineers and
owners are legally required to do essential safety works. There are very high safety
standards for reservoirs in the UK which makes the likelihood of a failure very low.
We have mapped the maximum flood extent in the event of reservoir breach. Our maps
are an absolute worst-case scenario, which assumes reservoirs are full at the time of
breach, that there are no emergency reservoir operating measures and that lots of
different reservoirs fail at the same time.
We assess risk by counting how many people, properties and cultural sites are within the
maximum flood extent and the area of environmental sites affected. We have shown this
data by RBD in table 1. Reservoir flooding is highly unlikely and these numbers are
precautionary for the reasons given above. It would take all the reservoirs in any RBD
failing at the same time to cause the impact our numbers show. The information for the
Severn and Dee RBD includes Wales as we did the work together. You should not directly
compare the impacts of reservoir flooding in table 2 with river and coastal flooding in table
1 as the reservoir flood mapping shows a much less likely flood.
In the extremely unlikely event that reservoirs failed, the highest risk to people would be in
the Thames RBD, with the lowest risk in the Dee, South East and Solway Tweed RBDs.
The risk to the economy is highest in the Humber and Thames RBD and lowest in the
Dee, South East and Solway Tweed RBDs. The risk to SACs is highest is the Anglian and
Severn RBDs and lowest in the Thames, South East and Northumbria RBDs. The risk to
cultural heritage is highest in the Humber, Severn and Thames RBDs and lowest in the
South East, Solway Tweed and Dee RBDs.
25 of 54We are currently updating our reservoir mapping to make the most of new data and
technical advances. The new mapping will consider different scenarios by considering
differences in the condition of a reservoir and the catchment it is in at the time it fails. It will
be available at the end of 2019.
The risk of flooding from reservoirs map
The flood risk from reservoirs map on GOV.UK shows the maximum extent of flooding,
depth and speed of flow in the unlikely event that a reservoir fails.
Figure 10. Extract from the flood map for reservoirs map
You can view this map at find out if you're at risk of flooding in England.
Table 2. Risk from reservoir flooding in the Severn RBD
People at risk Non-residential Key services at SACs at risk Listed buildings
properties at risk at risk
risk
261,750 36,620 732 6,050 3,360
26 of 54Flood risk areas
We have used the latest information on flood risk to human health, the
economy and environmental and cultural heritage sites to assess which areas
nationally are the most significantly affected from river and sea flooding.
What is a flood risk area?
FRAs are areas where the risk of flooding is likely to be significant for people, the
economy or the environment (including cultural heritage). By risk we mean not just the
chance that flooding will occur (the probability), but also the impact or consequence. In an
area with few people or few properties, the consequences of flooding may be relatively low
even if the likelihood of flooding is high. In comparison, in areas with high numbers of
people, property, infrastructure or assets the consequences are likely to be higher but the
probability of flooding may be much lower because there are flood defences.
How we have defined flood risk areas
We identified communities at risk of flooding using datasets on flood risk, properties and
communities. The data we used are:
– Flood risk: Risk of flooding from rivers and the sea. This shows the results of
NaFRA and the chance of flooding from rivers and the sea, presented in four flood
risk likelihood categories.
– Properties: National receptor database. This allows us to assign the level of flood
risk to individual properties. We made sure we included schools, hospitals, care
homes, infrastructure and other services as well as homes and businesses.
– Communities: Office for National Statistics built-up areas (from the 2011 census).
This data provides information on the villages, towns and cities where people live,
and allows comparisons between people living in built-up areas and those living
elsewhere.
We then analysed the information at a community level to calculate a “community risk
score” to each community. The community risk score is based on:
– the number of properties (residential and non-residential) within the community
which are at high, medium, low or very low risk of flooding
– the annual likelihood of flooding for each individual property at risk within the
community
– the percentage of all properties within the community that are properties at risk of
flooding
Calculating the community risk score
We have shown how we have done this using the worked example below.
27 of 54Step 1: We defined the community using the built up area data
In this example, there are 11 properties identified within this built-up-area.
Step 2: We used the NaFRA data to identify which properties are at flood risk
Step 3: We used the NaFRA data to identify how likely each property is to flood
Then we added these up to produce the total flood risk within the community (i.e. in this
example 14.9%).
Then we divide the total risk by the number of properties to get the average annual
probability of flooding for all the properties within the community (in this example this is
14.9%/11 which gives an average annual probability for this community of 1.35%).
Step 4: We generated the community risk score
We multiplied the total flood risk of the community by the average annual probability of
flooding for all properties within the community.
28 of 54This allows us to distinguish between two communities that share the same average
annual probability of flooding for all properties. This means that we have considered both
large and small communities on an equal footing.
In this example, the calculation would be 14.9% x 1.35% giving a community risk score of
20.1. We have used this risk score to rank communities.
Using the community risk score
We ranked communities according to their risk score to understand how they contribute to
overall national flood risk. We initially selected communities that represented 50% of total
risk across the country as a starting point. We then engaged with local experts to check,
adapt and refine the selection based on best available knowledge, including:
– sites that are import for the environment or cultural heritage
– roads, rail and other similar infrastructure
– the location of industrial sites that could cause major pollution to happen
– vulnerable local sites, such as caravan parks or camp sites
– future planned development
Identified flood risk areas
We have identified 116 communities that are at significant risk of flooding in England and
you can see these on the map below. We have also provided a more detailed map of
these separately to accompany the report. You can also download this as data from
data.gov.uk
The number FRAs varies around the country:
– The highest number are in Humber RBD (40) followed by Thames RBD (25)
– There are a similar number in Anglian RBD (18) and South West RBD (17)
– There are also a similar number in South East RBD (8), North West RBD (8) and
Severn RBD (5)
– There are no FRAs in Dee RBD, Northumbria RBD or the Solway Tweed RBD
– There are two FRAs that overlap RBD boundaries: one between South East and
Thames RBDs (Whitstable) and one between Severn and South West RBDs
(Weston-super-Mare)
29 of 54Figure 11. Identified flood risk areas
30 of 54Section B: The Severn RBD in Wales
The Welsh Government are seeking an approach for this cycle in the
regulations that brings together all sources of flooding. This involves
identifying hotspots of flooding from combined flood sources and seeks to
optimise resource efforts for all risk management authorities by working
together across all sources of flood risk to meet the regulations. This provides
a more consistent and coordinated approach to flood risk management in
Wales.
Roles and Responsibilities
The Floods and Water Management Act 2010 clarified the roles and responsibilities for the
different sources of flooding that could affect Wales. In addition, the Welsh Government
National Flood and Coastal Erosion Risk Management Strategy identified all the risk
management authorities in Wales that need to work together.
In 2013, NRW became responsible for the management of flood risk from main rivers,
reservoirs and the sea in Wales. NRW have produced the Welsh part of the Severn RBD
report jointly with Welsh LLFAs (given their responsibility for surface water, ordinary
watercourses and groundwater), Welsh Government and the Welsh Local Government
Agency (WLGA).
The LLFAs in Wales that are covered by the Severn RBD are Powys County Council,
Monmouthshire County Council, Blaenau Gwent County Borough Council, Torfaen County
Borough Council, Merthyr Tydfil County Borough Council, Rhondda Cynon Taff County
Borough Council, Caerphilly County Borough Council, Cardiff County Borough Council,
Newport County Borough Council, Vale of Glamorgan County Borough Council (small part
within RBD boundary only), Carmarthenshire County Council (small part within RBD
boundary only) and Ceredigion County Council (small part within RBD boundary only).
The Minister for the Environment and Cultural Heritage has set the threshold for FRAs in
Wales.
What this section contains
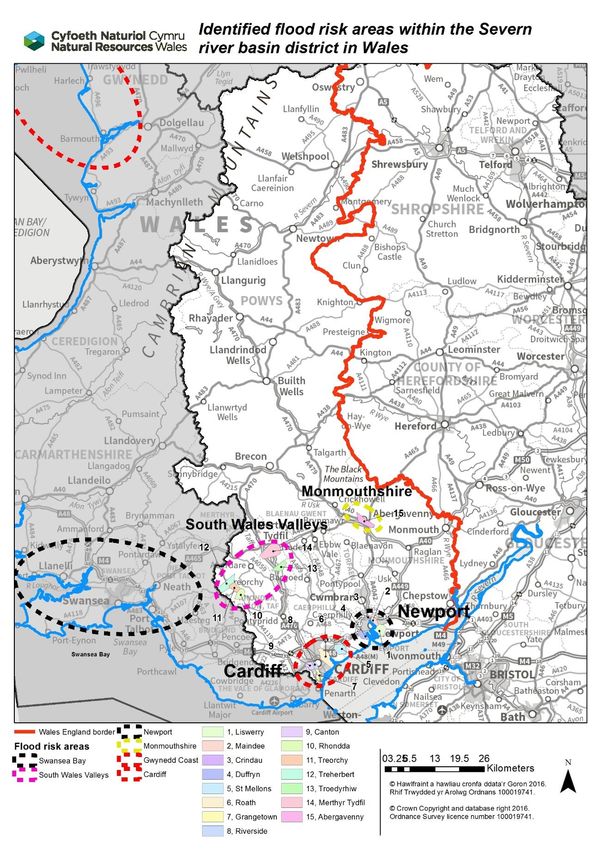
We have assessed and identified those areas within the Welsh part of the Severn RBD
that are most at risk of flooding from any source or combination of sources (main river,
reservoirs, the sea, surface water, ground water and from ordinary watercourses) in this
section. We have assessed significant past flooding that has affected the Severn RBD in
Wales since 2011 and then considered the potential harmful consequences of future
flooding. Using this information, we have then identified those areas within Wales where
most significant flood risks exist. These are known as FRAs. For these FRAs, we will
complete flood hazard and flood risk mapping completed by 22 December 2019 then
FRMPs by 22 December 2021.
31 of 54Methodology
The PFRA is a high-level screening exercise to identify areas where the risk
of flooding is considered to be significant. We have used this to prioritise
areas that require more detailed flood mapping and action planning. We have
used existing information to write this PFRA and to identify FRAs.
Both the Regulations and the Directive clearly state what the PFRA should comprise, but
they do not provide a definition of ‘significant’ flood risk to apply. In cycle 1, LLFAs made
local decisions about what was locally significant with regards to past flood events and
future flood risk. This led to a range of thresholds being used, particularly for recording
past flood events. As this PFRA seeks to achieve a consolidated and consistent approach
by including flood risk from multiple sources, we have standardised the methodology and
thresholds to ensure we can report consistently across Wales.
Thresholds
We have summarised below the thresholds we have agreed to define significant flood risk
across Wales for this PFRA.
Past flood events: Flood events are deemed to be significant in Wales for the purpose of
this report if 20 or more residential properties were flooded per town or postcode area. We
have included flood events exceeding this threshold for fluvial, tidal and surface water
sources since 2011 in this report.
Future flood risk: Information and statistics included within this report for future flooding
are based upon the 0.1% Annual Exceedance Probability (AEP) for risk of flooding.
The central climate change allowance1 has been used for climate change flood flow
estimates.
The following sections cover past flooding and potential future flooding and describe some
of the information we have used to help us identify FRAs.
1
The central climate change allowance equates to the 50th percentile of a medium (A1B) emissions scenario,
as derived from research into regionalised data of climate change on flood flows (EA/DEFRA). It was
previously known as the ‘change factor’.
32 of 54Past Flood Risk
We have used historical flood records held by NRW and LLFAs for flooding
from rivers, the sea, reservoir, surface water and groundwater. We have
identified floods since the production of cycle 1 PFRAs in 2011 that exceed
our definition of a significant flood event (20 or more residential properties
were flooded in a town or village from any source). There was only one event
that exceeded this threshold in the Severn RBD in Wales. We have explored
this further below.
Flood events have been captured by community rather than date. We recognise that
through setting the threshold in this way that there may be some communities which
experience regular flooding but are not captured in this assessment as less than 20
properties have been affected.
When there has been flooding experienced, we combine information on the flood extent
with data on the areas affected, from the National Receptor Database (NRD). The NRD
enables us to capture information regarding social, economic, environmental and cultural
receptors to help us understand the consequences from the flood. We also look at the
pathways by which flooding occurred, or flood conveyance routes. We use flood extents,
conveyance routes and the impacts of past floods to improve our flood models that identify
where flooding may happen in future.
For the Welsh part of the Severn RBD, there was one flood incident that met the above
criteria for significant flooding. This occurred in Cwmbran in May 2014.
Cwmbran Flood, May 2014
Extreme rainfall caused flooding in the Cwmbran area of Torfaen County Borough Council
on 22nd May 2014. The likelihood of the event was assessed as being greater than 1%,
which means that each year there is a greater than 1% chance of a similar event
occurring. The Met Office data gave a peak intensity of at least of 78 mm/ hour for 30
minutes. There was internal flooding to 198 properties, which were identified by the LLFA
who worked together with South Wales Fire and Rescue Service, NRW, Bron Afon and
Dŵr Cymru Welsh Water.
Table 3. Number of properties flooded in areas of Cwmbran
Area of Cwmbran Properties flooded
Greenmeadow/Fairwater 71
Pontnewydd 35
Llantarnam 25
Two Locks 18
St Dials 12
Thornhill 8
33 of 54You can also read