Cleaner and Safer Roads for NSW - JUNE 2019 - Supported by - Electric Vehicle Council
←
→
Page content transcription
If your browser does not render page correctly, please read the page content below
JUNE 2019

Cleaner and
Safer Roads
for NSW

              Supported by
© Electric Vehicle Council 2019

PUBLISHED BY THE ELECTRIC VEHICLE COUNCIL AND ASTHMA AUSTRALIA
Electric Vehicle Council

The Electric Vehicle Council is the national body representing the electric
vehicle industry in Australia. As the world’s largest vehicle markets and
companies set their course for a future where road transport is powered by
zero emissions vehicles, the Electric Vehicle Council works to highlight the
important role and opportunities for Australia in this global transition. This
means overcoming the current challenges in Australia’s electric vehicle market
through policy and industry development so that Australian consumers and
industry can be leaders in the future of mobility.

Asthma Australia

For over 50 years Asthma Australia has been the leader in asthma health care,
research and support. Asthma Australia delivers evidence-based preventative
health strategies to over 500,000 people every year and provides support,
training and resources to the primary health care sector. The organisation funds
vital basic science and population health research contributing to national and
international understandings of asthma and how best to manage the disease.

ACKNOWLEDGEMENTS
The Electric Vehicle Council and Asthma Australia would like to thank all those
who assisted with the production of this report, particularly Doctors for the
Environment Australia who provided valuable feedback prior to publication.

Electric Vehicle Council                Asthma Australia
                                                                                   Graphic Design by Made Visual

Suite 302, 90 Pitt Street,              Level 13, Tower B, 799 Pacific Highway
Sydney NSW 2000                         Chatswood, NSW 2067
T +61 2 9221 4030                       T +61 2 9906 3233

electricvehiclecouncil.com.au           asthmaaustralia.org.au

           @EVCouncil                             @AsthmaAustralia
Contents

1.    Executive Summary                                            1

2.    Summary of Recommendations                                  5

3.    Air Pollution on NSW Roads                                   7

4.    Electric vehicles will reduce NSW’s air pollution problem   14

5.    Noise Pollution in NSW                                      21

6.    EVs are a Noise Pollution Solution                          23

7.    Road Safety                                                 25

8.    EV Policy Recommendations                                   29

9.    Appendix                                                    32

10.   References                                                  37

1

Executive
Summary

1.
Executive Summary                                                                                                                                          2

This report summarises                                THE IMPACT OF AIR AND NOISE POLLUTION
the health impact of                                  The World Health Organisation considers air pollution to be the single
air and noise pollution                               largest environmental danger to public health globally.1 At the same time,
                                                      a wealth of international evidence now shows that there is no safe level of
on NSW’s roads and                                    air pollution. The existence of any air pollution at all causes negative health
explains how electric                                 impacts.
vehicle (EV) adoption                                 The OECD estimates that approximately half of air pollution in member
can help to address                                   countries is due to motor vehicles.2 This is because, unlike with industrial or
                                                      agricultural processes, motor vehicle pollution is pumped straight onto our
these issues while
                                                      streets where we live and breathe.
improving road safety.
                                                      Australia and NSW are not exempt from this insidious global phenomenon.
                                                      Air pollution from motor vehicles kills over 1,700 Australians per year.3
                                                      Around 650 of those deaths occur in NSW.4 This loss of life is 60% higher
                                                      than loss of life caused by motor vehicle crashes in the state. In total,
                                                      vehicle emissions are causing around 21,000 serious health impacts
                                                      annually in NSW.5

                                                      To make matters worse, air pollution disproportionately affects the most
                                                      vulnerable members of society including unborn babies, children, the
                                                      elderly, and those with pre-existing health conditions.6

                                                      Using data collected by the NSW Department of Environment and
                                                      Conservation, the annual health costs of air pollution from vehicles is
                                                      estimated to be $3.0 billion in the Sydney-Newcastle-Wollongong region.7
                                                      That means that each internal combustion engine vehicle (ICEV) creates
                                                      average health costs of $7,110 over a ten-year lifetime. Around half of that
                                                      pollution comes from exhaust emissions while the remainder comes from
                                                      non-exhaust emissions such as tyre and brake wear.

                                                      While ambient air quality in NSW has benefited from stricter exhaust
                                                      emission standards over the last two decades, that improvement is now
                                                      plateauing.8 This means that policymakers need to look at new ways of
                                                      protecting citizens from air pollution.

                                                      Electric vehicles (EVs) produce zero exhaust emissions so widespread
                                                      adoption of EVs would make marked improvements to NSW’s air quality.
                                                      This report estimates that for each EV that replaces an ICEV, NSW will save
                                                      at least $2,400 in health costs.

1
    World Health Organisation Regional Office for Europe (2017).
2
    OECD (2014), p. 63.
3
    Schofield et al. (2017).
4
    Based on data from NSW Department of Environment and Conservation (2005). This figure is for the Sydney-Newcastle-Wollongong region only. The figure
    across NSW will be higher. See appendix for further calculation data and explanations.
5
    Based on data from NSW Department of Environment and Conservation (2005). This figure is for the Sydney-Newcastle-Wollongong region only. The figure
    across NSW will be higher. See appendix for further calculation data and explanations.
6
    NSW Health (2013).
7
    NSW Department of Environment and Conservation (2005).
8
    NSW Environment Protection Agency (2017), p. 3.
3                                                                                            Cleaner and Safer Roads for NSW

Given that the most recent data available on NSW              SAFETY BENEFITS OF EVS
health costs of air pollution is from 2005, this report
                                                              The Australasia New Car Assessment Program
makes recommendations as to the frequency and
                                                              (ANCAP) has found that electric vehicles achieve
type of data that should be recorded and analysed
                                                              equivalent safety results to internal combustion
by the NSW Government in order to better inform
                                                              vehicles. Every electric vehicle tested in the last five
decisions made about health, environment, and
                                                              years has received a 5-star ANCAP safety rating.
transport policies.
                                                              EVs are actually likely to be safer than conventional
Conventional vehicles are also responsible for
                                                              vehicles. The US National Highway Traffic Safety
significant noise pollution. In fact, noise pollution
                                                              Administration (NHTSA) found that EVs are less likely
from road traffic is estimated to cause $1.4 billion
                                                              to roll over during crashes due to a lower centre of
in social costs per year in NSW. Electric vehicles,
                                                              gravity.9 ANCAP does not currently undertake rollover
particularly heavy electric vehicles, are much quieter
                                                              testing despite rollovers being involved in one in
than their combustion engine counterparts and
                                                              every three to four vehicle fatalities in Australia.10
would help reduce this harm.
                                                              EVs are also less likely to suffer potentially dangerous
                                                              mechanical failures because they have far fewer
                                                              moving parts and, importantly, don’t have any
                                                              dangerous powertrain components such as the
                                                              gearbox and engine which makes intrusion less likely
                                                              in a crash.

                                                              Fire & Rescue NSW do not consider EVs as more
                                                              dangerous than ICEVs. A report prepared for the
                                                              NHTSA concluded that the propensity and severity of
                                                              EV battery fires was equal or less than conventional
                                                              liquid fuel fires.11

9
     Cleantechnica (2108), p. 14.
10
     Bambach, Mitchel, Mattos, Grzebieta & McIntosh (2014).
11
     Stephens, D. et al (2017) p. xvii.
ELECTRIC VEHICLES IN NSW

                                                                       50%
 650
                people in NSW die each year
                from vehicle emissions,                            of air pollution health
                ICEVs cause 21,000 serious                         costs in OECD countries
                health impacts annually                            are from vehicle emissions

           10%                                     10%                                     50%
           If EVs make up 10% of                   If EVs make up 10% for                  If EVS make up 50% of
           new car sales for a year,               another year, that’s another            new car sales for a year,
           27 deaths are prevented                 27 deaths prevented,                    137 deaths prevented,
           and 910 significant health               another 910 significant                  4551 significant health
           impacts are prevented                   health impacts prevented                impacts prevented

                                                                                   60        %       more people
           Each EV on NSW
                                                                                                     die from vehicle
           roads will save
                                                                                                     emissions than

           $2,400
                                                                                                     from car crashes

           in health costs
                                              Every EV tested in the last
                                                five years has a 5-star
                                                ANCAP safety rating

                                                                            $3 BILLION
                   $1.4
Noise pollution               BILLION                                       The annual health costs of air pollution
costs NSW                     per year                                      from vehicles in the Sydney-Newcastle-
                                                                            Wollongong region

Figure 1: Infographic.
5

Summary of
Recommendations

2.
Summary of Recommendations                                                            6

This report makes two sets of recommendations to the NSW
Government: first, measures to improve our understanding
of health and safety issues in NSW; and second, measures to
support EV adoption and industry development in NSW.

   HEALTH AND SAFETY RECOMMENDATIONS

   1.                           2.                         3.
   Include deaths due           Increase availability of   Enable ANCAP
   to vehicle emissions         data regarding health      to perform
   in the NSW road toll.        impact of motor            rollover testing.
                                vehicle noise and air
                                pollution in NSW.

   EV RECOMMENDATIONS

   1.                           2.                         3.
   Transition the NSW           Provide short-term         Support the rollout of
   Government fleet             financial incentives       charging infrastructure.
   to be electric with a        to NSW residents and
   staged target of 50%         businesses to decrease
   electrification by 2025      the upfront cost of
   and 100% by 2030             purchasing electric
   (where appropriate).         vehicles.
7

Air Pollution
on NSW Roads

3.
Air Pollution on NSW Roads                                                                                                                                  8

Air pollution has been                                 Air pollution is a serious and consistent concern in NSW, particularly in
declared the single                                    metropolitan areas where population density is higher. Each year air
                                                       pollution is responsible for hundreds of deaths and thousands of hospital
largest environment                                    admissions in Sydney alone.13
risk to global health
                                                       At the same time, the myth that there can exist a ‘safe’ level of pollution
by the World Health                                    has been well and truly debunked.14 It is now established that the
Organisation.12                                        existence of any pollution in the air we breathe will increase health effects.
                                                       Given that there is no safe level of air pollution, air pollution reductions are
Exposure to air
                                                       necessary. Such reductions work: documented examples have consistently
pollutants can result in                               shown that when air quality improves, so does population health.15
a wide range of serious                                According to the NSW Government, motor vehicles are a “significant
health effects including                               contributor” to air emissions in NSW.16 More importantly, pollution from
asthma, heart disease,                                 motor vehicles has a disproportionate health impact. This is because,
                                                       unlike industrial or agricultural sources, vehicles produce their pollution
stroke, lung cancer, and                               in heavily populated areas. A relatively small reduction in pollution from
chronic obstructive                                    vehicles therefore yields greater health benefits than similar reductions in
pulmonary disease.                                     other areas.

                                                       VEHICLE EMISSIONS MORTALITY AND MORBIDITY
                                                       According to the National Environment Science Programme, air pollution
                                                       from vehicle emissions caused the deaths of 1,715 Australians in 2015.17
                                                       Using mortality data from a NSW Department of Environment and
                                                       Conservation report, it is estimated that vehicle emissions are responsible
                                                       for around 650 deaths in the state annually.18 This is 60% higher than the
                                                       number of deaths from motor vehicle crashes in NSW.19 In fact, in NSW,
                                                       vehicle emissions are responsible for four times the number of deaths as
                                                       crashes where speeding is a factor, and over ten times as many deaths
                                                       as crashes where alcohol is involved. Vehicle emissions also have serious
                                                       morbidity impacts. Each year, vehicle emissions in NSW are estimated to
                                                       be responsible for over 21,000 significant health consequences such as
                                                       restricted activity days, hospitalisations and chronic diseases.20

12
     World Health Organisation Regional Office for Europe (2017).
13
     NSW Government (2016).
14
     Barnett (2014).
15
     State of Global Air (2017), p. 1.
16
     NSW Government (2017).
17
     Schofield et al. (2017).
18
     Based on data from NSW Department of Environment and Conservation (2005). This figure is for the Sydney-Newcastle-Wollongong region only. The figure
     across NSW will be higher. See appendix for further calculation data and explanations.
19
     Transport for NSW (2017).
20
     Based on data from NSW Department of Environment and Conservation (2005). This figure is for the Sydney-Newcastle-Wollongong region only. The figure
     across NSW will be higher. See appendix for further calculation data and explanations.
9 Cleaner and Safer Roads for NSW
“Deaths from vehicle
emissions in NSW are
60% higher than the
number of deaths from
motor vehicle crashes.”
THE ANNUAL ROAD TOLL IN NSW
649
Deaths per year
389
167
74
55
Alcohol Fatigue Speeding All Crash Fatalities Vehicle Emissions
Figure 2: Crash deaths in NSW in 2017 where alcohol, fatigue, and speeding were a factor and total crash fatalities
compared to estimated deaths from vehicle emissions.21 Vehicle emissions deaths calculated based on NSW Department
of Environment and Conservation report.22
21
Transport for NSW (2017).
22
See appendix for further calculation data and explanations.Air Pollution on NSW Roads 10
RECOMMENDATION 1:
Include deaths due to vehicle emissions in the NSW road toll.
The road toll is a measure of the effectiveness of government policy at keeping people safe on NSW roads.
The distinction between a death due to a car colliding with someone and a death due to a car poisoning
their body is arbitrary and outdated. The NSW Government has a responsibility to do all it can to keep
people safe from vehicle emissions just as it has a responsibility to do what it can to keep people safe from
vehicle crashes. Given the parity between these harms, the annual road toll should be updated to include
deaths due to vehicle emissions.
VEHICLE EMISSIONS FINANCIAL HEALTH COSTS
In 2005, the NSW Department of Environment and
“The air pollution
Conservation estimated the annual health costs of air
pollution in the Sydney-Newcastle-Wollongong region from each ICEV
to be $6.9 billion.23 Since that report, there has been
no data released estimating the health costs of air
pollution in NSW, so this is the best available data.
on the road has
In that report, the estimation was made by examining
the health impact of particulate matter measuring
an average health
10 micrometres or less in diameter, known as PM10.
PM10 has numerous health effects including irritation impact of $7,100.”
of mucous membranes, infections, allergic effects,
toxic effects, respiratory problems, and cancer. Recent
epidemiological research also indicates that there is no
threshold at which health effects do not occur.24
According to the Bureau of Infrastructure, Transport and
Regional Economics (BITRE), 43% of annual average
PM10 exposure is due to motor vehicles.25 Using the
Department of Environment and Conservation’s figure
of $6.9 billion for all air pollution health costs in the
Sydney-Newcastle-Wollongong region, it is estimated
that 43% of that cost – $3.0 billion per annum – is due to
PM10 exposure from motor vehicles. Given that there are
approximately 4.2 million internal combustion engine
vehicles (ICEVs) in that region, each ICEV is therefore
responsible for PM10 exposure resulting in health costs
around $7,100, assuming a vehicle lifetime of ten years.26
23
NSW Department of Environment and Conservation (2005). Figures have been adjusted to 2018 Australian dollars to account for inflation.
24
Australian Government Department of the Environment and Energy (2013).
25
Australian Government Bureau of Transport and Regional Economics (2005), p. 78. ‘Sydney’ jurisdiction includes Newcastle and Wollongong, aligning well with
GMR boundaries.
26
The average age of a vehicle on NSW roads is 9.5 years, see Australian Bureau of Statistics (2018c). This means that an average vehicle lifetime can reasonably
be estimated to be at least 10 years if not longer. See appendix for further calculation data and explanations.11 Cleaner and Safer Roads for NSW
THE TRUE HEALTH COSTS OF ICEVS IS LIKELY WORSE
THAN ESTIMATED “More thorough data
The calculations of mortality, morbidity, and the
associated financial costs within this report are likely to and reporting of the
be underestimations. There are several reasons for this.
First, these estimates are based on a report by the health impact of
NSW Department of Environment and Conservation
and that report itself noted that its approach would
“probably underestimate the impact of air pollution.”27
ICEVs are necessary
The study used PM10 as the single indicator of the
health impacts of common ambient air pollutants so that this issue
but combustion engines emit many other pollutants
including hydrocarbons, carbon monoxide, and sulphur
dioxide that are recognised as causing respiratory and
does not continue
cardiovascular problems.28 Combustion engines also
emit chemicals such as nitrogen oxides (NOx) and to be ignored.”
Volatile Organic Compounds (VOCs) that react with
sunlight to form ozone. When this occurs at ground
level, that ozone can create toxic smog.29 Further, the
study did not quantify a number of significant PM10-
related health effects – such as extra cancer cases – and
only estimated the impact of PM10 above a defined
baseline microgram concentration thus excluding the
impact of some finer particles which may have an even Third, as new and more accurate, research methods are
greater health impact than PM10.30, 31 developed, the extent of air pollution health impacts
continues to grow.34 Evidence also suggests that there
Second, since that report was released, stronger
are many air pollution health impacts that are still
vehicle emission restrictions have been introduced but
currently unquantifiable.
recent data from the NSW Office of Environment and
Heritage shows that levels of PM10 have not declined.32 As such, these calculations are likely to be significantly
Meanwhile, population density in NSW has increased under-estimating the actual impact of vehicle air
such that the same levels of particulate pollution are pollution. More recent and thorough data and reporting
likely to impact more people, causing higher mortality, of the health impact of ICEVs are necessary so that this
morbidity, and health costs.33 issue does not continue to be ignored by policymakers.
27
NSW Department of Environment and Conservation (2005), ‘Summary’.
28
PM10 was used as the single indicator emission in that report in order to avoid double counting where the health impacts of separate emissions overlap.
However, this does mean that some health impacts are overlooked, leading to underestimation.
29
Australian Government Department of the Environment and Heritage (2005)
30
Doctors for the Environment Australia (2016).
31
NSW Department of Environment and Conservation (2005), ‘Summary’.
32
NSW Office of Environment and Heritage (2014a), p. 6.
33
Australian Bureau of Statistics (2016).
34
Schofield et al. (2017).Air Pollution on NSW Roads 12
RECOMMENDATION 2:
Increase availability of data regarding health impact of motor vehicle noise
and air pollution in NSW.
—— Estimate deaths and morbidity due to vehicle air pollution in NSW annually.
—— The EPA should complete a report assessing the health costs of air pollution in the Greater Sydney
Metropolitan Region. Such a report has not been completed since 2005.
—— Commit EPA to publishing ‘Air Emissions Inventory for GMR’ every four years. 2013 data was meant to be
released at the beginning of 2018 but, as of May 2019, the latest available data is still from 2008.
—— Investigate potential differences between the health impact of exhaust and non-exhaust emissions of
particulate matter to better inform policy prioritisation.
—— Measure street level concentrations of NOx and PM2.5 throughout NSW. This would help estimate health
costs and create a map of pollution hotspots that could then be focused on.
—— Investigate social costs due to vehicle noise pollution in NSW.
VULNERABLE POPULATIONS Vehicle pollution can begin harming children even
before they are born. Unborn babies whose mothers are
Vehicle air emissions disproportionately impact the
exposed to high levels of air pollution for long periods of
health of already vulnerable people. According to NSW
time may suffer adverse pregnancy outcomes such as
Health, children are particularly harmed by air pollution.
reduced birth weight or preterm birth. Anthropogenic
This is because children’s respiratory, immune, and
PM2.5 has been associated with 12-24% of pre-term
cardiovascular systems are underdeveloped and they
births.39 Exposure to such ultrafine particles can also
suffer from frequent respiratory infections that are
lead to neurodevelopmental harm such as ADHD and
exacerbated by pollution.35 In addition, children spend
reduced cognition and IQ.40
more of their lives outdoors exposing them to outdoor
pollution for longer periods of time. Vehicle pollution At the other end of life, the elderly also suffer from air
is even more significant in the case of children’s health pollution more than others because of their relatively
because schools are often built near main roads to poor health.41 Indeed, anyone with pre-existing
increase accessibility. Such exposure can have lifelong medical conditions such as asthma, lung disease, or
effects; children living within 75 metres of a major cardiovascular disease is more susceptible. Such people
road have a 29% increased risk of lifetime asthma.36 suffer more frequent and more serious symptoms when
In Melbourne’s City of Maribyrnong – where 21,000 exposed to air pollution. Middle-aged people are also
trucks pass through each day – the asthma incidence not exempt; people in their 40s and 50s living less than
for children is double the national rate.37 According 200 metres from a major road were found to have
to a recent cross-sectional study of 2,000 Australian higher rates of asthma and reduced lung function.42
children, adverse respiratory health effects occur even
when exposure is relatively low.38
35
NSW Health (2013).
36
McConnell et al. (2006).
37
Australian Commission on Safety and Quality in Health Care (2015), Chapter 6.4.
38
Knibbs et al. (2018).
39
Malley et al. (2017).
40
Canfield, Henderson, & Cory-Slechta (2003).
41
NSW Health (2013).
42
Bowatte et al. (2017).13 Cleaner and Safer Roads for NSW
“There is little that There is evidence that some of these health impacts are
epigenetic, causing changes to gene expression that
these vulnerable are passed on to future generations.43 In this way, the
effects of vehicle pollution today will likely be felt for
many years into the future by people who are not even
populations can do alive yet.
There is little that these vulnerable populations can do
to mitigate their to mitigate their exposure to vehicle pollution while still
leading a normal life. This places a particular obligation
exposure to vehicle on the government to step in and minimise that harm.
AMENITY
pollution while still The NSW Government has recognised that air pollution
also impacts amenity.44 Given the proximity of most
leading a normal life.” of the NSW population to traffic-related air pollution,
reducing vehicle emissions is one clear way to directly
improve the liveability of NSW.
43
Jiang, Jones, Sava, Kobor, & Carlsten (2014).
44
NSW Office of Environment and Heritage.14 Electric vehicles will reduce NSW’s air pollution problem 4.
15                                                                                                     Cleaner and Safer Roads for NSW

Despite increasingly                                Within the Sydney-Newcastle-Wollongong region, historical government
tight vehicle emission                              policies of ‘urban consolidation’ have long been recognised as resulting in
                                                    increased traffic emissions.45 Further pressures on future air quality include
standards over the last                             population growth, urbanisation, and climate change-related dust storms
40 years, the EPA says                              and bushfires.46
the situation is currently                          These pressures explain why levels of air pollution are no longer improving.47
set to get worse.                                   New policy approaches are required in order to improve health outcomes
                                                    for people across the state. Electric vehicles are an important part of a
                                                    multi-faceted solution that also includes encouraging active and public
                                                    transport, improving vehicle emission standards, and promoting renewable
                                                    energy production.

                                                    The OECD estimates that approximately half of the health impact of air
                                                    pollution is due to motor vehicles.48 This is because, unlike with industrial or
                                                    agricultural processes, motor vehicle pollution is pumped straight onto our
                                                    streets where we live and breathe. As such, electric vehicles are one of the
                                                    best ways of significantly and cost-effectively reducing the health impact of
                                                    air pollution.

                                                    THE ELECTRIC VEHICLE REVOLUTION
                                                    Around the world, the EV industry is booming. In 2015, total EV sales hit
                                                    one million.49 In December last year, they hit five million, with one million
                                                    of those added in only six months. In China, 5% of 2018 new car sales were
                                                    EVs. In California, it’s 7%. In Norway, it’s 50%. Uptake in Europe is expected
                                                    to increase sharply in the coming years due to the EU’s combined EV target
                                                    which will put around eight to nine million EVs on the road by 2020.

                                                    This overseas success has been driven by forward-thinking government
                                                    policy that is helping to kickstart this revolutionary industry. In Australia,
                                                    however, a lack of EV policy leadership has meant that our nation is lagging
                                                    behind – EVs account for only 0.1% of new car sales compared to the global
                                                    average of 1.3%.50 Without government action, market uncertainty prevents
                                                    automakers from bringing more and cheaper EVs to Australian shores,
                                                    preventing many consumers from taking part in this technological shift. This
                                                    means that people in NSW and the rest of Australia are missing out on the
                                                    substantial benefits that EVs offer, particularly in regard to improving the
                                                    quality of our air.

45
     NSW Department of Environment and Conservation (2003).
46
     NSW Environment Protection Agency (2017), p. 6.
47
     NSW Government (2017), p. 5.
48
     OECD (2014), p. 63.
49
     EV Volumes (2018).
50
     McKinsey (2018).
Electric vehicles will reduce NSW’s air pollution problem 16
ELECTRIC VEHICLE EXHAUST EMISSIONS
Unlike ICEVs, EVs produce no exhaust emissions at
all. This means that EV adoption has the potential to
eliminate a significant portion of harmful air pollution.
In fact, mass EV adoption would eliminate all vehicle
emissions of carbon monoxide and nitrogen oxide, and
reduce vehicle emissions of PM10 and VOCs by around
half. Meanwhile, vehicle PM2.5 emissions – thought to be
one of the most harmful pollutants – would be reduced
by nearly two thirds.51 The high rate of exposure to
vehicle emissions – because the pollution is produced
in high population areas – means that relatively small
reductions in pollution from vehicles yields greater
health benefits than similar reductions in other areas.
PROPORTION OF EXHAUT TO NON-EXHAUST VEHICLE EMISSIONS FROM COMMON POLLUTANTS
Proportion of vehicle emissions from source (%)
100 100 48 61 50
52 50
39
CO NOX PM10 PM2.5 VOC’s
Exhaust Non-exhaust
Figure 3: Comparison of exhaust and non-exhaust contribution to pollution of vehicles. All exhaust emissions are eliminated
by replacing ICEVs with EVs.52,53
51
United States Environmental Protection Agency (2018).
52
NSW Office of Environment and Heritage (2014a).
53
NSW Office of Environment and Heritage (2014b).17 Cleaner and Safer Roads for NSW
“At 10% of new EVS WILL PREVENT AN ENORMOUS NUMBER OF
HEALTH COSTS
vehicle sales, EVs The NSW Department of Environment and
Conservation calculated air pollution health costs in
the Sydney-Newcastle-Wollongong region to be 1,509
will prevent 27 deaths, 50,244 significant health impacts, and $6.9
billion.54 It is estimated that slightly under 20% of these
deaths and 910 health costs – or approximately 312 deaths, 10,370
significant health impacts, and $1.4 billion – are a result
of the exhaust emissions of ICEVs.55 Given that EVs
significant health do not produce exhaust emissions, the electrification
of NSW’s fleet would eliminate these costs. Based
impacts in NSW.” on Government data, we can estimate the reduction
in mortality and morbidity that would occur as EV
sales increase. The following assumes that the EVs are
charged with renewable energy.
EV share of NSW new vehicle Annual EV sales Deaths prevented Significant health impacts
sales prevented
1% 3,645 3 91
5% 18,224 14 455
10% 36,449 27 910
25% 91,122 68 2,276
50% 182,243 137 4,551
100% 364,486 273 9,103
Table 1: Deaths and significant health impacts prevented at particular EV new vehicle market shares. Note that these
figures estimate deaths and significant health impacts prevented over a vehicle’s lifetime. For example, if EVs comprise 1%
of new vehicle sales for a year, there will be a total of 91 health impacts prevented over the next 10 years that those vehicles
are operating.
54
NSW Department of Environment and Conservation (2005). See appendix for calculation data and explanations.
55
See appendix for calculation data and explanations.Electric vehicles will reduce NSW’s air pollution problem 18
Preventing all deaths and health impacts from vehicle
exhaust emissions would result in health savings around “Each EV sold
$1.3 billion.56 When distributed over the number of
vehicles in the Sydney-Newcastle-Wollongong region,
that means that each EV sold instead of an ICEV will
instead of an
save NSW approximately $2,400 in health costs.57 It
should be noted that while these calculations use ICEV will save
the best available data, that data comes from a range
of sources and years and so these calculations are
intended to provide an estimation of values rather
NSW $2,400 in
than exact amounts.58 It should also be noted that, as
explained earlier in this report, the actual health costs health costs.”
of ICEVs – including mortality and morbidity – is likely
to be higher than estimated. As such, the health costs
prevented by a transition to EVs are also likely to be
higher than estimated.
Annual health costs in Sydney- Health costs per vehicle over lifetime
Newcastle-Wollongong region
Health costs of all air pollution $6.9 billion N/A
Health costs of all vehicle emissions $3.0 billion $7,110
Health costs of vehicle exhaust $1.4 billion $3,420
emissions
Health costs saved if EVs replace $1.3 billion $2,400
ICEVs, adjusted for NPV
Table 2: Collection of different health costs for ICEVs. Note that these health costs are based on the NSW Department of
Environment and Conservation report cited earlier and only include PM10 health costs. The actual health costs are likely to
be higher. NPV value is with annual discount rate of 7%.
56
When adjusted for NPV at a discount rate of 7%. See Table 2, and appendix for further calculation data and explanations.
57
The average age of a vehicle on Australian roads is around 10 years. This means that an average vehicle lifetime can reasonably be estimated to be at least 10
years if not longer. See appendix for further calculation data and explanations.
58
See appendix for calculation data and explanations.19 Cleaner and Safer Roads for NSW
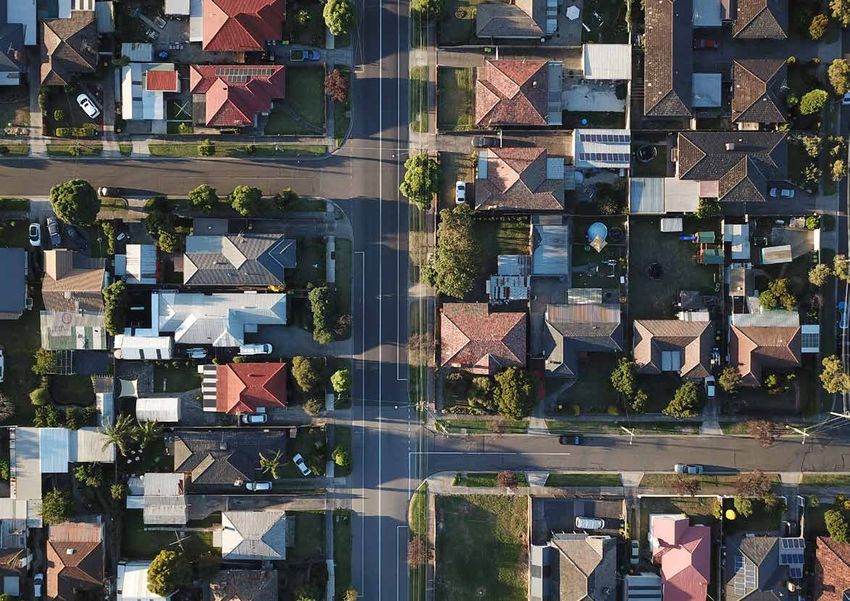
HEALTH COSTS OF EXHAUST EMISSIONS PER VEHICLE
$4,000
$3,500
Health costs over vehicle’s lifetime ($)
$3,420
$3,000
$2,500
$2,000
$1,500
50
$1,000
$500
$0
ICEVs EVs
Figure 4: A comparison of health costs from exhaust emissions from ICEVs and EVs. Note that this is based on the NSW
Department of Environment and Conservation report and only includes health costs for PM10 emissions. Lifetime of vehicle
is assumed to be ten years. There is evidence that non-exhaust emissions would also be reduced by EV adoption but that
has not been accounted for in this chart.
Further, transport emissions account for 20% of NSW’s
greenhouse gas emissions, making this sector the
second largest contributor in the state.59 Emissions
from electricity generation, such as carbon dioxide,
can also be reduced to zero if renewable sources are
used. This means that electric vehicles purchased
now will continue to get cleaner as renewable energy
becomes more available. ICEVs bought today will
continue to produce greenhouse gases for their entire
operating lifetime.
59
Australian Department of Environment and Heritage.Electric vehicles will reduce NSW’s air pollution problem 20
ELECTRIC VEHICLE NON-EXHAUST EMISSIONS
EVs do still produce non-exhaust emissions. These
emissions include tyre wear, brake wear, road
surface wear, and the resuspension of road dust, and
are mostly unavoidable. One study that received
media attention suggested that EVs produce more
non-exhaust emissions due to their greater weight.
However, a correction was later published for that
study noting that it had not been carried out in
connection with the University of Edinburgh as the
authors had claimed, and that the primary author
had later disclosed that he received non-financial
support from Innas B.V., a consultancy specialising
in combustion engine technology.60 Contrary to the
findings in that study, several papers have suggested
that EVs actually produce less non-exhaust emissions
due to their regenerative braking. There is limited
experimental evidence but a range of studies suggest
such technology may reduce brake wear by 50 to
95%, reducing total non-exhaust emissions to be
lower than ICEVs.61, 62
In New Zealand, a number of garbage trucks
operated by EnviroWaste were retrofitted by
Australian company, SEA Electric, to be fully electric
with regenerative brakes. One of these trucks has
been operating for 12 months and is yet to have its
brake linings replaced. Meanwhile EnviroWaste’s
diesel trucks have brake linings replaced every three
months. EnviroWaste estimates that the regenerative
braking has reduced brake wear by at least 10 times.
For cases like this, where heavy vehicles start and
stop frequently, reducing brake wear can significantly
reduce non-exhaust emissions and improve the
health of people in NSW.
The Australian Government, in its 2016 State of the
Environment report, said that increasing vehicle traffic
and greater congestion are a pressure on future air
quality unless counterbalanced by reduced emissions
per vehicle.63 EVs provide a clear path to achieve this.
60
Corrigendum to “Non-exhaust PM emissions from electric vehicles” (2016).
61
Amato (2018), p. 278.
62
Chattanooga University Center for Energy, Transportation and the Environment.
63
Australian Department of the Environment and Energy (2016), p. 77.21 Noise Pollution in NSW 5.
Noise Pollution in NSW                                                                                                                    22

Ambient noise levels                                       A Department of Environment and Conservation report in 2004 had 46% of
have been shown                                            respondents in NSW report that they considered road traffic noise to be a
                                                           problem in their neighbourhood.65
to have a significant
                                                           Meanwhile, the World Health Organisation ranked noise second among
impact on public
                                                           environmental threats to public health, the first being air pollution. The
health and amenity. In                                     health effects of excessive noise pollution are significant. It can cause
fact, road traffic noise                                   disturbed sleep, anxiety, and increased risk of heart disease and heart
                                                           attack.66, 67
is identified in NSW’s
Road Noise Policy                                          There is also reliable evidence that road traffic noise can impair cognition in
                                                           children and have a negative impact on school performance.68, 69, 70
document as the
                                                           Victoria’s Environment Protection Agency estimates that social costs due to
main issue affecting                                       noise amount to $250 per vehicle per annum.71 By applying that figure to
neighbourhood                                              NSW, we can estimate the social costs from vehicle noise to be $1.4 billion
amenity in the state.64                                    annually.72 This is nearly one quarter of the social costs of smoking in NSW.73

                                                             Annual social cost of noise pollution per vehicle             $250

                                                             Number of vehicles in NSW                                     5,618,385

                                                             Annual social cost of vehicle noise pollution in NSW          $1.4 billion

                                                           “We can estimate the social
                                                            costs from vehicle noise to
                                                            be $1.4 billion annually.”

64
     NSW Department of Environment, Climate Change & Water (2011).
65
     NSW Department of Environment, Climate Change & Water (2011).
66
     World Health Organisation Regional Office for Europe (2011).
67
     NSW Department of Environment, Climate Change & Water (2011).
68
     Institute for Environmental Health (1997).
69
     World Health Organisation Regional Office for Europe (2011), p. 51.
70
     Environmental Health Standing Committee (2004), p. 24.
71
     Victorian Environment Protection Agency (2013).
72
     Number of registered vehicles in NSW is 5,618,285, see Australian Bureau of Statistics (2018c).
73
     NSW Department of Health (2010).
23 EVs are a Noise Pollution Solution 6.
EVs as Noise Pollution Solution                                                                                                   24

According to the                                       Conventional buses and trucks often reach sound levels of 80 decibels, 100
NSW Department of                                      times louder than a typical residential street.75 Aside from causing health
                                                       problems, loud vehicles can become a safety hazard for pedestrians when
Environment, Climate                                   they drown out the sound of other approaching vehicles. Electrified heavy
Change & Water, tougher                                vehicles, meanwhile, produce significantly less noise. Australian company,
noise emission limits will                             SEA Electric, produces its own heavy vehicles as well as retrofitting
                                                       conventional vehicles with electric motors. In decibel testing required by
be less impactful than                                 the Australian Design Rules for commercial vehicles, SEA Electric’s vehicles
increasing EV adoption.74                              were deemed to be effectively ‘zero noise’.

                                                       Electric passenger vehicles are also quieter than conventional counterparts,
                                                       producing approximately 5 decibels less noise at speeds less than 30km/h.76
                                                       At higher speeds, the difference in sound becomes negligible. There are
                                                       concerns that quiet vehicles pose their own hazards to vulnerable road
                                                       users who may not hear them approach. However, heavy vehicles still
                                                       come equipped with reversing sound emitters – as required by Australian
                                                       regulations – and most EV passenger vehicles sold in Australia are already
                                                       equipped with noise emitters that operate to alert vulnerable road users
                                                       when traveling at low speed. This is because manufacturers have already
                                                       begun to comply with European Parliament legislation which requires such
                                                       systems on all new electric and hybrid-electric vehicles by July 2019. Around
                                                       the world, automakers have signalled a clear willingness to comply with
                                                       such regulations to ensure the safety of vulnerable road users.

74
     NSW Department of Environment, Climate Change & Water (2011), p. 1.
75
     NSW Environment Protection Agency (2013), Figure 2.2.
76
     Danish Road Directorate (2015).
25 Road Safety 7.
Road Safety                                                                                                                                                       26

The safety of road users is a clear priority for manufacturers, government,
and the public. The Australasia New Car Assessment Program (ANCAP),
in its submission to the Senate Committee on Electric Vehicles, said that
electric vehicles achieved equivalent safety results to internal combustion
vehicles. Indeed, every electric vehicle tested in the last five years has
received a 5-star ANCAP safety rating.77

                                     ELECTRIC VEHICLE FACTS

                                                                                                                      EVs hold the top three positions
                                                                                                                      in NHTSA rollover safety testing

                                                                                                                                  Tesla

                                                             RECHARGING                                                   Tesla  Model  S Chevrolet

No gearbox or engine means                                                                                               Model X            Volt
  less chance of intrusion                                       encourages drivers to                                      EQUAL       1ST             EQUAL
       during a crash                                             stop, revive, survive                                    2ND                          2ND

                                                                                                                                    LOWER CENTRE
                                                                                                                                      OF GRAVITY
SAFER                                                                          17 VS 2000                                             That means better
                                                                                                                                      and safer handling
Liquid fuel is protected                                                         EVs have around
by millimetres of plastic while batteries                                     17 moving parts while
are protected by centimetres of metal                                         ICEVs have over 2000

                                             NOISE EMITTERS
                                             standard on almost all EVs in Australia despite no
                                             regulation because manufacturers are committed to safety
Figure 5: Infographic.

77
     The 5-star ANCAP ratings given to EVs include specific electrical safety testing to ensure the safety of occupants and rescuers following a crash. ANCAP’s
     Strategic Objectives 2018-2023 will discuss whether any further EV-specific testing provisions will be necessary.
27 Cleaner and Safer Roads for NSW
MORE TECHNOLOGY, LESS COMPLICATED LOWERED CENTRE OF GRAVITY
EVs are technological flagships for manufacturers Most EVs have their batteries beneath the passenger
and usually come fitted with all available active safety cabin. The batteries, being one of the heaviest parts of
technology. Given EVs already require sophisticated an EV, therefore lower the vehicle’s centre of gravity
computer systems and software, the integration compared to an ICEV whose engine is higher up.
of these safety features is more efficient than for
The primary benefit of this is in crashes where rollovers
conventional vehicles. At the same time, EVs have
may occur. Rollovers are involved in one in every three
simpler powertrains, requiring fewer liquids and
to four vehicle fatalities in Australia.80 Current ANCAP
moving parts. According to the Victorian Automobile
testing does not include a test to reflect vehicle safety
Chamber of Commerce (VACC), EVs typically have
in the case of a rollover incident. This means that the
around 17 moving parts or less, as opposed to around
decreased risk of rollovers in EVs is easily overlooked.
2,000 moving parts in an ICEV.78 This makes EVs
more reliable79, decreasing the chance of dangerous Testing carried out by the National Highway Traffic
mechanical malfunctions. A lack of major conventional Safety Administration (NHTSA) in the US showed that
powertrain components in EVs also provides safety Tesla’s model S was the least likely to rollover out of any
benefits to occupants. According to ANCAP, “large vehicle ever tested.81 Tesla’s model X and the Chevrolet
solid objects, such as an engine or gearbox, cannot be Volt were equal second. Meanwhile the Nissan Leaf
crushed – and if not carefully managed can intrude was less likely to rollover than either the Ford Focus
into the occupant cell”. EVs have neither engines or Toyota Corolla, two of the most popular passenger
nor gearboxes, immediately eliminating some of the vehicles in Australia.
potentially dangerous components of conventional
According to multiple major automakers, EVs’ lower
vehicles. Having fewer powertrain parts also affords
centres of gravity also afford drivers greater traction,
manufacturers more design flexibility. For example,
road handling, and control, potentially reducing the
Tesla’s model X and S have increased frontal crumple
chance of crashes. Positioning the battery underneath
space where an engine would normally be. This
the cabin can also allow for the cabin to sit higher, as in
combination of complex safety features and simplified
the case of BMW’s i models, improving driver vision on
design goes some way to explain why EVs are
the road. These features have the potential to reduce
surpassing all safety requirements.
the chance of crashes occurring in the first place.
The weight of these batteries means that EVs typically
weigh more than equivalent ICEVs. According to
ANCAP, increased mass may increase the possibility of
intrusion but modern vehicles “typically have structural
elements that manage the crash energy well”. In fact,
there is some evidence that increasing vehicle weight
increases occupant safety even when accounting for
vehicle size.82
78
Victorian Automobile Chamber of Commerce (2017).
79
Victorian Automobile Chamber of Commerce (2017).
80
Bambach, Mitchel, Mattos, Grzebieta & McIntosh (2014).
81
Cleantechnica (2018), p. 14.
82
Titheridge,Tolouei, & Maher (2011).Road Safety 28
RECOMMENDATION 3:
Enable ANCAP to perform rollover testing.
Rollovers are involved in approximately one in every three vehicle fatalities in Australia. Current ANCAP
testing does not include a test to reflect vehicle safety in the case of a rollover incident, unlike comparable
programs such as the NHTSA in the US. The NSW Government, as a member of ANCAP, could push for or
provide extra funding that would allow ANCAP to undertake this testing. This would increase the rigour of
safety tests and help ensure peace of mind for Australian drivers.
BATTERY SAFETY This may help explain why Clean Technica’s analysis of
NHTSA data showed fires are nearly twice as likely to
Examples of EV batteries malfunctioning have received
occur in fatal crashes involving conventional vehicles
widespread media attention as is to be expected for
compared to hybrid vehicles.85 Tesla has also claimed
any new technology. However, the evidence suggests
that fires occur in its vehicles at a rate 11 times lower
that these lithium-ion batteries are in fact as safe or
than conventional vehicles.86
even safer than conventional fuel.
A multi-year investigation undertaken by NHTSA DRIVER FATIGUE
concluded that “the propensity and severity of
fires and explosions from the accidental ignition of Fatigue is one of the three main killers on NSW roads.87
flammable electrolytic solvents used in Li-ion battery From 2013 to 2017, more people in NSW died in fatigue-
systems are anticipated to be somewhat comparable related crashes than drink driving incidents. EVs force
to or perhaps slightly less than those for gasoline or drivers to ‘stop, revive, survive’ because most EVs need
diesel vehicular fuels.”83 to recharge after three to five hours of highway driving.
Charging would take only 15 minutes using super-fast
Fire & Rescue NSW do not consider EVs as more chargers, such as those installed on the Queensland
dangerous than ICEVs and say that “all vehicles have Government’s Electric Super Highway, but even a short
potential hazards that need to be managed properly”. rest will reduce the chance of fatigue-induced crashes.
EV batteries are also better protected than fuel
canisters. While batteries are often situated in the PEDESTRIAN SAFETY
strongest part of a vehicle’s frame – where they are
As mentioned previously, most EVs in Australia are
less likely to be impacted – and surrounded by several
already voluntarily equipped with noise emitters
centimetres of metal casing, fuel tanks are usually
to alert vulnerable road users. These emitters meet
placed at the back of vehicles and protected by
the standards required by legislation already put in
only one to two millimetres of plastic. This means
place by the European Parliament. Manufacturers are
that when a crash occurs from behind, the fuel tank
committed to safety and have been cooperative and
can more easily be compromised and spark plugs
supportive of such measures.
or headlights can ignite the fuel. Such nose-to-tail
collisions are the most common type of car crash on
Australian roads, with 4,204 such crashes occurring in
2017.84 This was nearly double the next most common
type of crash.
83
Stephens, D. et al (2017) p.xvii.
84
Transport for NSW (2017).
85
Cleantechnica (2018).
86
CNN (2018).
87
Transport for NSW (2018).29 EV Policy Recommendations 8.
EV Policy Recommendations                                                                                    30

The electric vehicle             The NSW Government announced its EV policy in January 2019 as part of
                                 the NSW Electric and Hybrid Vehicle Plan. This signalled a positive shift in
revolution is happening          attitudes towards this new technology but stronger policy commitments
around the world but             are still required to ensure NSW does not fall behind. With the correct policy
government policy is still       platform, NSW can lead Australia by providing its citizens with cleaner,
                                 quieter, and safer roads. That platform needs to be as significant as the
necessary to overcome            problem it aims to address. The Road Safety 2021 Plan, part of the NSW
the initial barriers that        Government’s ‘Toward Zero’ campaign, is receiving $1.9 billion over five years.
the industry faces.              Given that vehicle emissions are killing nearly twice as many people as road
                                 crashes, policies that address this issue should receive at least the same
                                 attention and funding as The Road Safety 2021 Plan.

   EV POLICY RECOMMENDATIONS:

                            1.   Transition the NSW Government fleet to be
                                 electric.
                                 A staged target of 50% electrification by 2025 and 100% by 2030
                                 (where appropriate) should be set. A complementary ‘buy electric
                                 first’ preference should also be adopted. This would mean that,
                                 where available, a suitable electric model would be purchased
                                 instead of conventional alternatives.

                                 In January 2019, the NSW Government announced a target
                                 of 10% – including hybrid vehicles – by 2021/2022. The NSW
                                 Government needs to increase this target and lead the way in
                                 ensuring the state’s air is as clean and breathable as possible. The
                                 NSW Government’s current fleet includes 22,000 passenger and
                                 light commercial vehicles – most of which are leased – so a 50%
                                 fleet target would be a relatively simple way to provide a notable
                                 increase in market certainty. This would encourage automakers
                                 to bring more EVs to NSW while also creating a viable secondary
                                 market when government vehicles are replaced.
31 Cleaner and Safer Roads for NSW
EV POLICY RECOMMENDATIONS:
2. Provide short-term financial incentives to
decrease the upfront cost of purchasing electric
vehicles.
Provide a temporary Stamp Duty exemption for electric vehicles in NSW.
While the total ownership costs of EVs are already comparable to
ICEVs, up-front costs are predicted to remain higher until 2024
according to Bloomberg. A report by Energeia and the Australian
Renewable Energy Agency (ARENA) found that reductions in up-front
costs have the biggest influence on EV purchase decisions. As such,
consumer incentives are one of the most effective tools available
to policymakers hoping to increase EV uptake. This conclusion is
supported by evidence from around the world where consumer
incentives have consistently helped to jumpstart EV markets. As the
market matures and scales of operation increase, manufacturers will
be encouraged to reshape our market by providing a greater number
of EV models to Australian consumers, thereby increasing choice
and affordability to better reflect international vehicle markets. These
incentives can then be rolled back.
3. Support the rollout of Charging Infrastructure.
The NSW Government announced in January 2019 that it would
co-invest $5 million in EV chargers. This is a good start but more
funding is necessary to truly impact consumers’ range anxiety. This
concern could be reduced through incentives such as providing low
interest loans to households purchasing home chargers and to small
and medium enterprises and councils delivering electric vehicle
charging infrastructure. Such a loan scheme could be provided in a
similar way to the NSW Farm Innovation Fund.
Concerns about charging site availability has been identified as a major
barrier to consumers considering purchasing electric vehicles. In its
2019 Infrastructure Priority List, Infrastructure Australia labelled the
creation of a national network of EV chargers a “high priority”. These
types of incentives are not just effective, they’re also popular with the
public. A poll by The Australia Institute found that 79% of Australians
supported the government building a network of charging stations.32 Appendix 9.
33                                                                                         Cleaner and Safer Roads for NSW

       PRELIMINARY NOTES:

       —— Lifetime of vehicles: The average age of           —— The following calculations assume the electric
          vehicles in NSW is 9.5 years.88 We can                vehicles are charged using renewable energy.
          therefore easily expect an average vehicle            This assumption is reasonable for several
          to be driven for 10 years. This is the average        reasons. First, NSW’s energy grid is continually
          lifetime used throughout this report.                 becoming cleaner as renewable energy
       —— Number of vehicles in the GMR: There are              becomes cheaper. Second, most public
          696 registered vehicles in NSW per 1000               chargers are powered by renewable energy.
          population.89 Approximately 75% of NSW’s              Third, those who purchase EVs are more likely
          population lives in the GMR.90 The population         to be environmentally conscientious and use
          of NSW is approximately 7,955,000.91 Based            renewable energy.
          on those figures, it is estimated that there are   —— In the body of this report, the Greater
          4,152,510 or 4.15M vehicles in the GMR. This is       Metropolitan Region is referred to as the
          the figure used throughout this report.               Sydney-Newcastle-Wollongong Region for
                                                                greater clarity.

88
     Australian Bureau of Statistics (2018c).
89
     Australian Bureau of Statistics (2018c).
90
     NSW Environment Protection Agency (2012).
91
     Australian Bureau of Statistics (2018a).
Appendix 34
A.
SUMMARY OF VEHICLE EMISSIONS DEATHS CALCULATIONS Aim:
Aim: Calculate the number of deaths prevented once EVs
reach particular new vehicle market shares.
Calculate the number of air pollution deaths in the
GMR that are due to vehicle emissions. Notes: ‘Total deaths prevented’ is calculated over a
10-year vehicle lifetime. For example, if EVs comprise
Method:
1% of new car sales for a year, there will be a total of
1. Midpoint of GMR Mortality Incidence from PM10 air 3 deaths prevented over the next 10 years that those
pollution = 1,509 deaths per year92 vehicles are operating.
2. ICEVs responsible for 43%93 of annual average PM10
exposure levels in Sydney. Therefore, PM10 from ICEVs Deaths prevented per 10,000 EVs 7.5
responsible for 649 deaths per year. replacing ICEVs, over lifetime of
vehicles97
Aim:
Calculate the number of air pollution deaths in the Vehicle sales in NSW per year (2017)98 364,486
GMR that are separately due to non-exhaust and
exhaust emissions. Total deaths prevented, 3
Method: EVs 1% new car sales
1. PM10 emissions from ICEVs responsible for 649
Total deaths prevented, 14
deaths per year.94
EVs 5% new car sales
2. 48%95 of PM10 on-road ICEV emissions in Sydney due
to exhaust emissions as opposed to non-exhaust Total deaths prevented, 27
emissions. Therefore, ICEV exhaust emissions responsible EVs 10% new car sales
for 312 deaths per year. ICEV non-exhaust emission
account for the remainder; 337 deaths per year. Total deaths prevented, 68
Aim: EVs 25% new car sales
Calculate the number of deaths due to exhaust
Total deaths prevented, 137
emissions per 10,000 ICEVs.
EVs 50% new car sales
Deaths due to ICEV exhaust emissions 312
Total deaths prevented, 273
per year96
EVs 100% new car sales
Vehicles in GMR 4,152,510
Deaths due to exhaust emissions per 7.5
10,000 ICEVs, over lifetime of vehicles
92
NSW Department of Environment and Conservation (2005), Table A.2. Midpoint is 1509. As discussed earlier in this report, these are the latest available
estimations for NSW and at the time, the DoE acknowledged they were conservative estimates.
93
Australian Government Bureau of Transport and Regional Economics (2005), p. 78. ‘Sydney’ jurisdiction includes Newcastle and Wollongong, aligning well with
GMR boundaries. This is also in line with more recent estimates by the OECD in 2014 that say that roughly 50% of air pollution health costs in OECD countries
are attributable to motor vehicles.
94
As calculated above.
95
NSW Office of Environment and Heritage (2014b), p. 12. Note that this is for Sydney not GMR but there is little to suggest the ratio between exhaust and non-
exhaust emissions would differ significantly for vehicles elsewhere in the GMR.
96
As calculated above.
97
As EVs produce no exhaust emissions, deaths due to exhaust emissions from 10,000 ICEVs will be eliminated by replacing those vehicles with 10,000 EVs.
98
Australian Bureau of Statisics (2017).35 Cleaner and Safer Roads for NSW
B.
SUMMARY OF VEHICLE EMISSIONS HEALTH Aim:
IMPACTS CALCULATIONS
Calculate the number of health impacts prevented
Method: once EVs reach particular new vehicle market shares.
1. Midpoint of GMR Health Impact Incidence from PM10 Note: ‘Total health impacts prevented’ is calculated over
air pollution = 50,244 per year99 a 10-year vehicle lifetime. For example, if EVs comprise
1% of new car sales for a year, there will be a total of 91
2. ICEVs responsible for 43%100 of annual average PM10
health impacts prevented over the next 10 years that
exposure levels in Sydney. Therefore, PM10 from ICEVs
those vehicles are operating.
responsible for 21,605 health impacts per year.
Aim:
Health impacts prevented per 10,000 250
Calculate the number of health impacts in GMR EVs replacing ICEVs, over lifetime of
that are separately due to non-exhaust and exhaust vehicle104
emissions.
Method: Vehicle sales in NSW per year (2017)105 364,486
1. PM10 emissions from ICEVs responsible for 21,605 Total health impacts prevented, 91
health impacts per year.101 EVs 1% new car sales
2. 48%102 of PM10 on-road ICEV emissions in Sydney
due to exhaust emissions as opposed to non-exhaust Total health impacts prevented, 455
emissions. Therefore, ICEV exhaust emissions EVs 5% new car sales
responsible for 10,370 health impacts per year. ICEV
non-exhaust emission account for the remainder; Total health impacts prevented, 910
11235 health impacts per year. EVs 10% new car sales
Aim:
Total health impacts prevented, 2,276
Calculate the number of health impacts due to exhaust
EVs 25% new car sales
emissions per 10,000 ICEVs in GMR.
Total health impacts prevented, 4,551
Health impacts due to ICEV exhaust 10,370 EVs 50% new car sales
emissions per year103
Total health impacts prevented, 9,103
Vehicles in GMR 4,152,510 EVs 100% new car sales
Health impacts due to exhaust 250
emissions per 10,000 ICEVs, over
lifetime of vehicles
99
NSW Department of Environment and Conservation (2005), Table A.2. Midpoint is 1509. As discussed earlier in this report, these are the latest available
estimations for NSW and at the time, the DoE acknowledged they were conservative estimates.
100
Australian Government Bureau of Transport and Regional Economics (2005), p. 78. ‘Sydney’ jurisdiction includes Newcastle and Wollongong, aligning well with
GMR boundaries. This is also in line with more recent estimates by the OECD in 2014 that say that roughly 50% of air pollution health costs in OECD countries
are attributable to motor vehicles.
101
As calculated above.
102
NSW Office of Environment and Heritage (2014b), p. 12. Note that this is for Sydney not GMR but there is little to suggest the ratio between exhaust and non-
exhaust emissions would differ significantly for vehicles elsewhere in the GMR.
103
As calculated above.
104
As EVs produce no exhaust emissions, health impacts due to exhaust emissions from 10,000 ICEVs will be eliminated by replacing those vehicles with 10,000 EVs.
105
Australian Bureau of Statisics (2017).You can also read