Access to an Electronic Health Record: A Polish National Survey - MDPI
←
→
Page content transcription
If your browser does not render page correctly, please read the page content below
International Journal of
           Environmental Research
           and Public Health

Article
Access to an Electronic Health Record: A Polish
National Survey
Maria Magdalena Bujnowska-Fedak *                     and Łukasz Wysoczański
 Department of Family Medicine, Wroclaw Medical University, 51-141 Wrocław, Poland;
 lukasz.wysoczanski@student.umed.wroc.pl
 * Correspondence: maria.bujnowska-fedak@umed.wroc.pl; Tel.: +48-71-3266876

 Received: 14 July 2020; Accepted: 18 August 2020; Published: 25 August 2020

 Abstract: In Poland, as in many countries around the world, e-health services are becoming more and
 more popular. Obligatory e-sick leave was implemented, followed by e-prescriptions and e-referrals.
 Therefore, it is worth considering the introduction of a complete electronic health record (EHR) that
 can be accessed by doctors and patients. The main aim of the study is to find out whether patients
 want to have access to their EHRs and if they would agree to pay for such a service. The research was
 based on three surveys conducted among 1000 Polish adults in 2007, 2012, and 2018. The sample
 collection was carried out by the national opinion poll agency, with the use of computer-assisted
 telephone interviews. Over 60% of respondents were interested in the possibility of accessing EHRs
 in general, and almost 50% of them were ready to pay for it. Nevertheless, when analyzing all the
 year-on-year trends, they were subject to a gradual decrease. The youngest age group was the one
 most interested in EHRs, while the group comprising respondents in middle age was the one most
 willing to pay for it. There is still great potential in implementing EHRs on a bigger scale.

 Keywords: electronic health record (EHR); e-health;                             telemedicine;   year-on-year trends;
 national survey

1. Introduction
     Currently, we are undergoing a digital revolution that dominates most areas of our life. We are
experiencing this more distinctly in medicine. The vast majority of the population possess telephones,
tablets, and computers with internet access. These devices are used, among other functions,
for health-related purposes [1]. E-health services are becoming more and more a necessity [1].
Especially in the current situation, with the pandemic of SARS-CoV-2 announced by the World
Health Organization (WHO), e-health services play a key role in the functioning of primary and
outpatient healthcare [2]. The trend associated with the increasing use of e-health services has been
observed all over the world. For example, e-prescriptions have been available in the Netherlands since
1998 [3], in Great Britain since 2003 [4], in the USA since 2008 [5,6], and in the Czech Republic since
2020 [7]. In Poland, obligatory e-sick leave was implemented in 2019, and then e-prescription was
introduced. Since 2020, it has been the only form of prescription used in everyday medical practice [8,9].
The introduction of e-referrals is planned for 2021, and the system is currently operating on a pilot
platform [9]. In the beginning, these solutions aroused some fears and aversion, but ultimately they have
greatly improved the Polish healthcare system and their function has been permanently adopted [8].
All these e-health services comprise a complete electronic health record (EHR), which provides
uniform access to medical documentation for healthcare specialists and patients, gathering as much
data as possible in one system. According to WHO, national EHRs work successfully in many
countries, for example, the Netherlands, the United Kingdom, Italy, Germany, Scandinavia, Canada,
and Australia [10,11], as well as in the United States [12]. Despite the much earlier introduction

Int. J. Environ. Res. Public Health 2020, 17, 6165; doi:10.3390/ijerph17176165               www.mdpi.com/journal/ijerph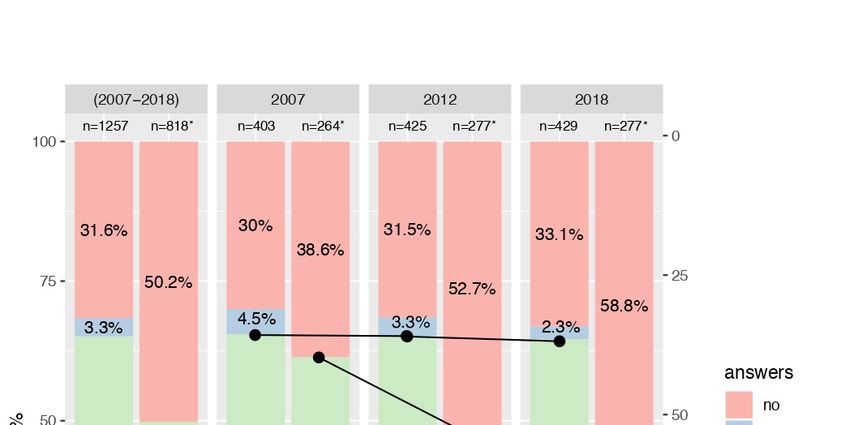
Int. J. Environ. Res. Public Health 2020, 17, 6165                                                 2 of 17

of electronic health services in some countries, the usage of EHRs is still at a development stage
and is constantly being improved [3,12–14]. However, the implementation and use of EHRs are
certainly challenging. Its deployment is associated with the learning of new IT systems, ensuring
the computerization of all medical facilities and security of data collection and transmission [15].
The United States was one of the first countries to introduce EHRs, which constitutes one of the most
developed and refined medical databases. There has been a significant upward trend in the use of this
system over the years [16]. In Europe, EHRs are being developed in many countries. The function
and assumptions of these systems are slightly different, but the European Union is trying to introduce
general standards for them within the European community [14]. Standardization and widespread
distribution of EHR systems improve the work of medical personnel in the interdisciplinary care of
patients, enable better medical and insurance-allowance supervision, increase patient safety, and serve
as financially beneficial solutions for the healthcare systems [17]. In Poland, the requirement that EHRs
should be mandatory is gradually being introduced and increasingly extended. Having that in mind,
the aim of this research project is to find out whether Polish patients want to have access to their EHRs
and to determine if they would agree to pay for such a service. Analysis of the trends concerning
interest in EHRs is also carried out.

2. Materials and Methods

2.1. Study Design
     The research project was based on three national surveys conducted in the years 2007, 2012,
and 2017/2018. Each survey was carried out by a national opinion poll agency (Kantar TNS and
TNS-OBOP) among 1000 Polish adults using computer-assisted telephone interviews (CATIs). The total
number of respondents in the three analyzed surveys was 3000 people. The course of the study was
constantly monitored by experienced supervisors who controlled the work of the interviewers in a
CATI studio. While selecting telephone numbers, an equal distribution was maintained in terms of
age, sex, size of the place of residence, and the region of the country. Both landlines and cell phones
were included. During the study, the geographical distribution for the voivodships and the size
of the cities/villages for the entire sample was controlled in order to ensure its representativeness.
The respondents were selected on the basis of compliance with the imposed quotas, ensuring that
the respondents with the required sociodemographic characteristics were reached. The sample was
selected in terms of parameters as a nationwide, representative sample of adults, then stratified
according to the voivodship and size of the place of residence, and quoted according to sex and age.
A nonresponding group included incorrect numbers or cases of not answering the phone, people
who did not want to participate in the interview, and those who were too sick to take part. The vast
majority of the nonrespondents were people who refused to participate in the survey without giving
any reason. Every nonresponding telephone number was replaced by another one with the same or
similar characteristic until 1000 questionnaires were collected in each survey. The response rate was
32.8%, 34.2%, and 5.2%, respectively, in the 2007, 2012, and 2018 surveys. The 2018 survey response
rate was significantly lower than the previous ones, but the representativeness of the survey was
achieved. The factor that contributed most to such a low response rate was not answering the phone
(19,200 people). The 2018 survey was conducted from December to January, which is a holiday period.
There is also a growing reluctance to answer unwanted calls. Nowadays, hardly anyone without a
publicly available telephone number responds to such calls [18].
     All the subjects gave their informed consent before they participated in the study. The study was
conducted in accordance with the Declaration of Helsinki, and the protocol was approved by the Ethics
Committee of Wroclaw Medical University (ST 481/2010, ST C290.17.040).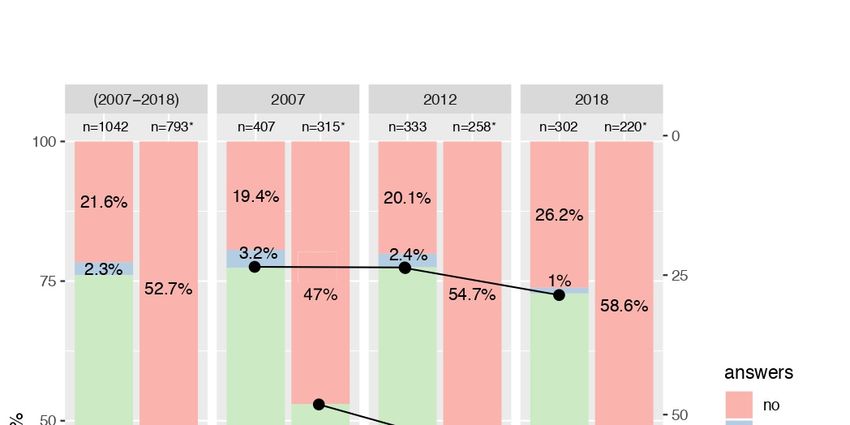
Int. J. Environ. Res. Public Health 2020, 17, 6165                                                     3 of 17

2.2. Questionnaire
     The study was a part of three national surveys prepared on the basis of our previous research
concerning trends and patterns of health-related internet use [1,19–25]. The survey conducted in 2007,
which was also part of a survey on WHO/European e-health consumer trends [24,26], contained 24
original questions in Polish compared to the surveys carried out in 2012 and 2017/18 that contained
22 questions each (see the questionnaires in the supplementary materials, Questionnaires S1 and S2).
Due to the fact that there is only one official language commonly used in Poland, there was no other
language version of the survey. This study was focused on one complex question, which was exactly
repeated in each survey.
     In the first part of the questionnaire, the respondents were asked if they would use their online
EHR, assuming that they have access to the internet. The next part of this questionnaire concerned
their willingness to pay approximately EUR 30 per year for such a service.
     The respondent had the possibility to answer “yes” or “no”, with an additional option of “I do
not know”.
     Supplementary demographic data of respondents, such as sex, age, education, the size of the
place of residence, or professional situation, were also obtained.

2.3. Data Analyses
     A general group of all respondents and the three distinguished groups from the three surveys
were taken into account for analyses. A descriptive analysis, followed by statistical analysis, was
carried out in order to identify significant associations between the participant independent variables
and changes in their attitude over the years, setting the trend. The statistical packages R software
(version 3.6.3, 29 February 2020, R Foundation for Statistical Computing, Vienna, Austria) and G*Power
software (version 3.1.9.6, G*Power—Erdfelder, Faul & Buchner, Düsseldorf, Germany) were used in
the calculations. All tested variables were of a qualitative type.
     For the analysis, the chi-square test of independence and homogeneity was used. Statistical
hypotheses were verified at the significance level of 0.05, and, in each case, the test power (1−β)
was calculated by the posthoc method. Then, 95% confidence intervals were determined for certain
frequencies (attached in the supplementary materials, Table S1).
     Subsequently, correspondence analysis was conducted. This method provides information similar
to the interpretation of the results of factor analysis, but on qualitative variables. Analysis of statistics
and figures proposed by this method allows simple and intuitive inference about the relationships
occurring between the categories of variables. With the help of the correspondence analysis, the profile
of the most likely EHR user was determined. A profile was defined for the respondents of the study in
2018 as it is important to determine the most current EHR user profile.
     Each of the variables used in the analysis of correspondence is a 2–5 categorical feature to
ensure the best subsequent interpretation of the clusters on a two-dimensional figure. As a result
of correspondence analysis carried out on a set of categorical variables, a two-dimensional graph is
obtained, which is a set of points where each point corresponds to one category. The set of points
can form clusters, i.e., subsets of points located closer to each other. The correspondence analysis
method is rooted in the fact that the categories (points) belonging to clusters are interpreted as related
to each other.
     Percentages at the coordinate axes indicate which dimension has a greater effect on the distance
between the points. In our case, Dimension 1 is by far the most influential, so there are lines, L1 and L2,
in the figure. These lines mark the boundaries of three hypothetical clusters around EHR category
points: a, b, c.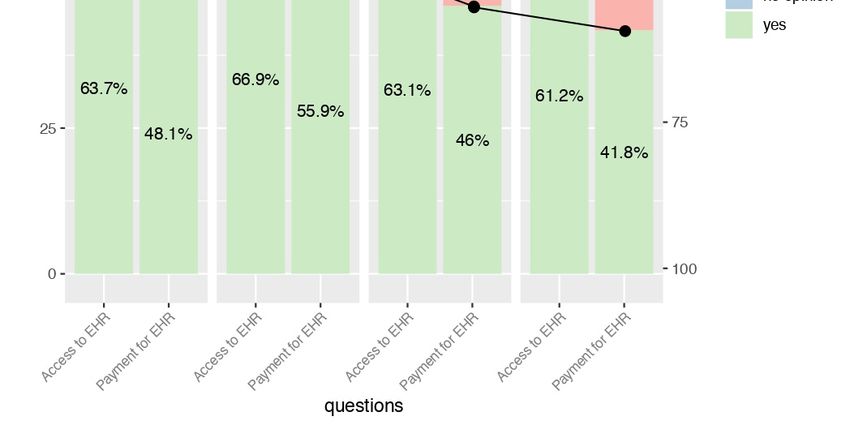
Int. J. Environ. Res. Public Health 2020, 17, 6165 4 of 17
3. Results
3.1. Characteristics of the Respondents
The study group consisted of 1598 women (53.3%) and 1402 men (46.7%). Three age groups were
distinguished: young (15–35 years-old (y.o.), who constituted 1042 individuals (34.7%), middle-aged
(36–59 y.o.), who accounted for 1257 people (41.9%), and older (60–94 y.o.), in the number of 701
respondents (23.4%). With regard to the size of the place of residence among the studied population,
the distribution was comparable to big cities (31%), small towns (31%), and villages/rural areas (38%).
This applied to both the entire population and the distribution in individual surveys carried out in
2007, 2012, and 2018. The vast majority of respondents (86%) lived with someone else.
Out of all respondents, 1912 people were interested in access to EHRs (63.7%), 996 individuals
were not interested (33.2%), and 92 respondents had no opinion (3.1%). Additionally, 920 people
agreed to pay for access to EHRs (30.7% of all respondents), and 48.1% of individuals from this group
were interested in accessing EHRs. In contrast, 992 people did not agree to pay (33.1% of the studied
group), and 51.9% of this group were interested in EHR. People who were not interested in accessing
EHRs or had no opinion did not answer the question concerning consent to pay for access to EHRs.
Detailed information on the study population is provided in Table 1.
Table 1. Characteristics of respondents in total and in subsequent years 2007, 2012, and 2018.
Characteristics of Respondents Overall Year of the Study
2007 2012 2018
(n = 3000) (n = 1000) (n = 1000) (n = 1000)
Characteristics Categories n % n % n % n %
Age (a) 15–35 years old 1042 34.7 407 40.7 333 33.3 302 30.2
(b) 36–59 years old 1257 41.9 403 40.3 425 42.5 429 42.9
(c) 60+ years old 701 23.4 190 19 242 24.2 269 26.9
Sex (a) male 1402 46.7 484 48.4 476 47.6 442 44.2
(b) female 1598 53.3 516 51.6 524 52.4 558 55.8
Education (a) primary 693 34.6 0 NaN * 354 35.4 339 33.9
(b) secondary 741 37.0 0 NaN * 368 36.8 373 37.3
(c) higher 566 28.3 0 NaN * 278 27.8 288 28.8
Inhabitancy (a) alone 281 14.1 0 NaN * 138 13.8 143 14.3
(b) with someone else 1716 85.9 0 NaN * 860 86.2 856 85.7
Residence (a) village/rural area 1136 38.0 372 37.2 377 38 387 38.7
(b) small town (100.000 residents) 931 31.1 329 32.9 316 31.8 286 28.6
Professional situation (a) student 291 9.7 172 17.2 75 7.5 44 4.4
(b) working 1662 55.5 504 50.5 564 56.6 594 59.4
(c) pensioner 868 29.0 260 26 291 29.2 317 31.7
(d) unemployed 175 5.8 63 6.3 67 6.7 45 4.5
Frequency of (a) everyday 1503 50.2 414 41.5 507 50.9 582 58.2
internet usage (b) at least once a month 634 21.2 216 21.6 222 22.3 196 19.6
(c) at least once a year 69 2.3 37 3.7 15 1.5 17 1.7
(d) never 788 26.3 331 33.2 252 25.3 205 20.5
Frequency of (a) everyday 74 3.2 24 3.6 17 2.3 33 3.7
health internet usage (b) at least once a month 1240 54.1 345 52.1 452 61.1 443 49.8
(c) at least once a month 576 25.1 147 22.2 184 24.9 245 27.5
(d) less than once a year 48 2.1 0 0 0 0 48 5.4
(e) never 354 15.4 146 22.1 87 11.8 121 13.6
Subjective health (a) good/very good 1737 58.2 592 59.4 575 57.8 570 57.5
assessment (b) average 1036 34.7 338 33.9 351 35.3 347 35
(c) bad/very bad 209 7.0 66 6.6 69 6.9 74 7.5
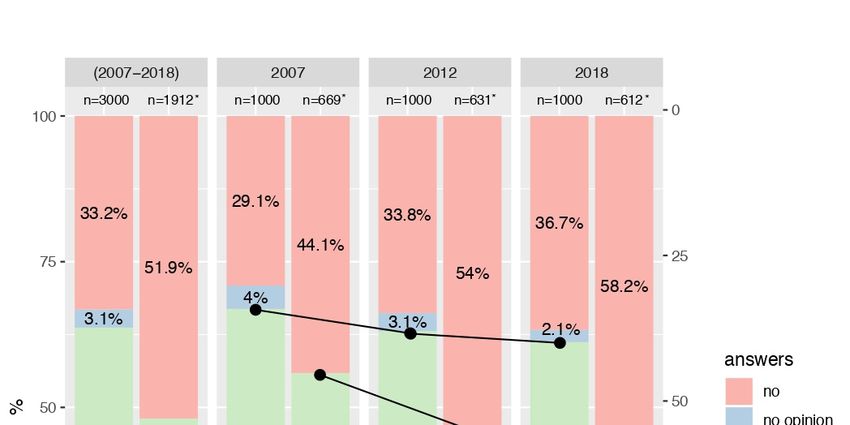
Interest in access to EHRs (a) yes 1912 63.7 669 66.9 631 63.1 612 61.2
(b) no 996 33.2 291 29.1 338 33.8 367 36.7
(c) I do not know 92 3.1 40 4 31 3.1 21 2.1
Consent to payment
(a) yes 920 48.1 374 55.9 290 46 256 41.8
for access to EHRs **
(b) no 992 51.9 295 44.1 341 54 356 58.2
Using a cell phone (a) yes 1848 92.4 0 NaN * 891 89.1 957 95.7
(b) no 152 7.6 0 NaN * 109 10.9 43 4.3
* NaN—the value could not be calculated due to lack of data in the 2007 study. ** People who were not interested in
accessing electronic health records (EHRs) or had no opinion did not answer the question concerning consent to
payment for access to EHRs.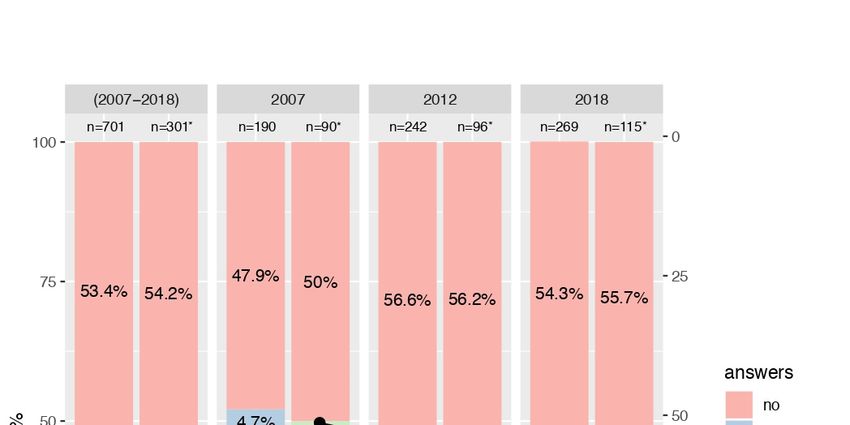
Int. J. Environ. Res. Public Health 2020, 17, 6165                                                              5 of 17

3.2.
Int. J.Interest
        Environ. in
                 Res.Access  to EHRs
                      Public Health 2020, 17, x                                                                 5 of 19

      Interestvalue
* NaN—the       in access
                     couldto
                           notEHRs   significantly
                               be calculated due todecreased
                                                    lack of dataininthe
                                                                     thegeneral  population
                                                                         2007 study. ** Peoplein thewere
                                                                                               who   years 2007,
                                                                                                         not      2012,
                                                                                                             interested
and  2018  (69.7%,    65.1%,  and  62.5%,  respectively;  p =  0.003;   see Figure 1).  There  was  also a significant
in accessing electronic health records (EHRs) or had no opinion did not answer the question concerning consent
relationship
to payment forbetween       EHRs. in access to EHRs and the age of the study participants (p < 0.001).
                  access to interest
Generally, the highest interest was shown by young individuals (76.1%, Figure 2), then by middle-aged
respondents
3.2. Interest in(65.1%,
                  Access Figure
                          to EHRs 3), and the lowest level of interest was expressed by older people (42.9%,
Figure 4).
      Interest in access to EHRs significantly decreased in the general population in the years 2007,
      Analyzing the individual age groups, interest in access to EHRs among young people in the
2012, and 2018 (69.7%, 65.1%, and 62.5%, respectively; p = 0.003; see Figure 1). There was also a
two studies carried out in 2007 and 2012 remained relatively stable (77.4% and 77.5%). Nevertheless,
significant relationship between interest in access to EHRs and the age of the study participants (p <
a decrease to the level of 72.8% was detected in 2018 (see Figure 2). With regard to the group of
0.001). Generally, the highest interest was shown by young individuals (76.1%, Figure 2), then by
middle-aged people, interest in access to EHRs remained relatively steady in subsequent years of study
middle-aged respondents (65.1%, Figure 3), and the lowest level of interest was expressed by older
(65.5%, 65.2%, and 64.6%, respectively; see Figure 3), and in the group of older people, the observed
people (42.9%, Figure 4).
trend fluctuated in a sinusoidal pattern (47.4%, 39.7%, and 42.8%; see Figure 4). For more details,
see Table S3 in the supplementary materials.

      Figure 1. General
      Figure 1.  General interest
                         interest in
                                  in access
                                      access to
                                              to EHR
                                                 EHR and
                                                      and consent
                                                           consent to
                                                                   to payment
                                                                      payment for
                                                                               for access
                                                                                   access to
                                                                                          to EHR
                                                                                             EHR inin 2007,
                                                                                                      2007, 2012
                                                                                                            2012
      and
      and 2018.
          2018. ** People
                   People who
                          who were
                               were notnot interested
                                           interested in
                                                      in accessing
                                                         accessing EHR
                                                                   EHR or
                                                                        or had
                                                                           had no
                                                                               no opinion,
                                                                                   opinion, did
                                                                                             did not
                                                                                                 not answer
                                                                                                     answer the
                                                                                                              the
      question  concerning consent   to pay  for access to
      question concerning consent to pay for access to EHR.EHR.

     Analyzing the individual age groups, interest in access to EHRs among young people in the two
studies carried out in 2007 and 2012 remained relatively stable (77.4% and 77.5%). Nevertheless, a
decrease to the level of 72.8% was detected in 2018 (see Figure 2). With regard to the group of middle-
aged people, interest in access to EHRs remained relatively steady in subsequent years of study
(65.5%, 65.2%, and 64.6%, respectively; see Figure 3), and in the group of older people, the observed
trend fluctuated in a sinusoidal pattern (47.4%, 39.7%, and 42.8%; see Figure 4). For more details, see
Table S3 in the supplementary materials.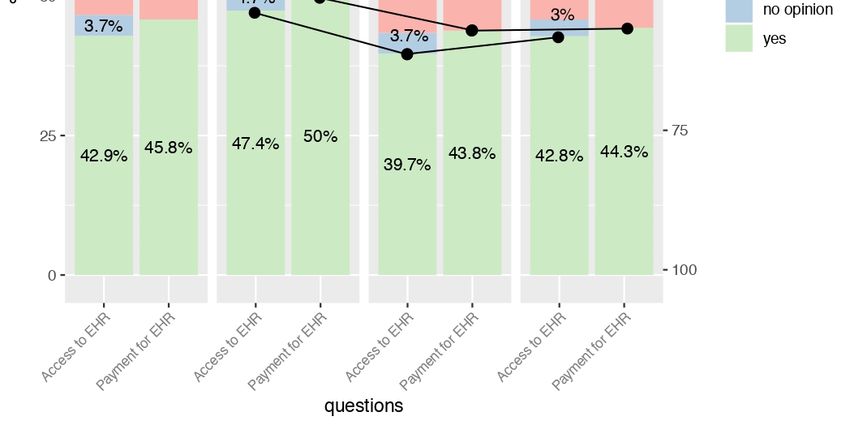
Int. J. Environ. Res. Public Health 2020, 17, x                                                            6 of 19

Int. J. Environ. Res. Public Health 2020, 17, 6165                                                                      6 of 17

       Int. J. Environ. Res. Public Health 2020, 17, x                                                            7 of 19
      Figure 2. Interest
           Figure         in access
                  2. Interest         to to
                               in access  EHR
                                            EHRand
                                                 andconsent
                                                      consent to
                                                               to payment   foraccess
                                                                  payment for   accesstotoEHREHR   among
                                                                                                 among      respondents
                                                                                                        respondents
      aged 15–35  yearsyears
           aged 15–35   in 2007,   20122012
                              in 2007,   andand
                                              2018. * People
                                                 2018.        who
                                                       * People  whowere
                                                                     werenot
                                                                           notinterested
                                                                               interested in accessing
                                                                                               accessingEHR
                                                                                                         EHRororhad
                                                                                                                 had no
           no opinion,
      opinion, did notdid   not answer
                        answer           the question
                                  the question        concerning
                                                concerning        consent
                                                             consent      to pay
                                                                       to pay  forfor accesstotoEHR.
                                                                                    access       EHR.

      Figure 3. Interest
           Figure          in access
                   3. Interest         to to
                                in access  EHR
                                             EHRand
                                                  andconsent
                                                       consent to
                                                                to payment   foraccess
                                                                   payment for   accesstotoEHREHR   among
                                                                                                  among      respondents
                                                                                                         respondents
      aged 36–59  yearsyears
           aged 36–59    in 2007,   20122012
                               in 2007,   andand
                                               2018. * People
                                                  2018.        who
                                                        * People  whowere
                                                                      werenot
                                                                            notinterested
                                                                                interested in accessing
                                                                                                accessingEHR
                                                                                                          EHRororhad
                                                                                                                  had no
           no opinion,
      opinion, did not did   not answer
                         answer           the question
                                   the question        concerning
                                                 concerning        consent
                                                              consent      to pay
                                                                        to pay  forfor accesstotoEHR.
                                                                                     access       EHR.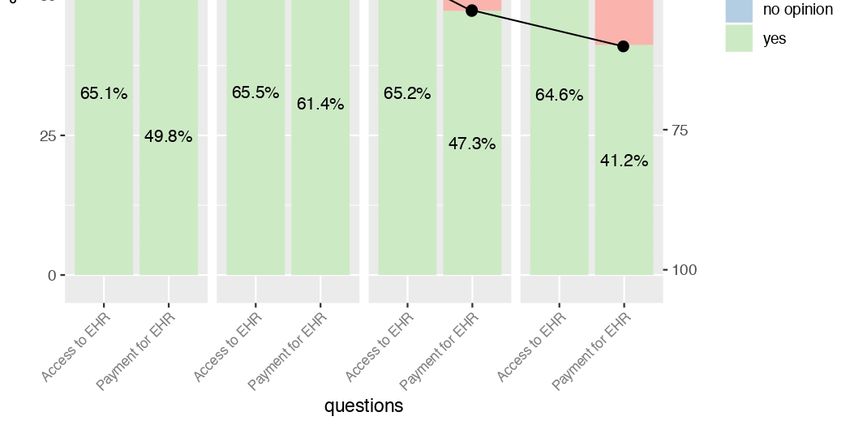
Int. J. Environ. Res. Public Health 2020, 17, x                                                                  8 of 19

Int. J. Environ. Res. Public Health 2020, 17, 6165                                                               7 of 17

      Figure  4. Interest
      Figure 4.   Interestininaccess
                               accesstotoEHR
                                          EHR and consent
                                                and       to payment
                                                     consent          for access
                                                             to payment          to EHR
                                                                          for access     among
                                                                                     to EHR     respondents
                                                                                             among           aged
                                                                                                      respondents
      60+ years  in 2007,  2012  and  2018. * People who  were not interested in accessing EHR  or had no
      aged 60+ years in 2007, 2012 and 2018. * People who were not interested in accessing EHR or had no  opinion,
      did not answer
      opinion,  did notthe   question
                          answer   the concerning  consent toconsent
                                        question concerning   pay fortoaccess to EHR.
                                                                         pay for access to EHR.
3.3. Consent to Payment for Access to EHRs
3.3. Consent to Payment for Access to EHRs
     Generally, consent to pay for access to EHRs was declared by 48.1% of the entire surveyed
      Generally, consent to pay for access to EHRs was declared by 48.1% of the entire surveyed
population. In the subsequent years, the level of acceptance of payment decreased significantly (55.9%,
population. In the subsequent years, the level of acceptance of payment decreased significantly
46%, and 41.8%; p < 0.001). More information is presented in Figure 1. The average percentage
(55.9%, 46%, and 41.8%; p < 0,001). More information is presented in Figure 1. The average percentage
of people in each age group declaring their consent to pay for access to EHRs was estimated at
of people in each age group declaring their consent to pay for access to EHRs was estimated at 47.3%
47.3% for young people (Figure 2), 49.8% for middle-aged individuals (Figure 3), and 45.8% for older
for young people (Figure 2), 49.8% for middle-aged individuals (Figure 3), and 45.8% for older people
people (Figure 4). There was no statistically significant relationship between them (see Table S2 in the
(Figure 4). There was no statistically significant relationship between them (see Table S2 in the
supplementary materials).
supplementary materials).
     The trend in the number of people who would agree to pay for access to EHRs decreased in all
      The trend in the number of people who would agree to pay for access to EHRs decreased in all
age groups. In the group of young people, it declined from the level of 53.0% in 2007 to 45.3% in 2012
age groups. In the group of young people, it declined from the level of 53.0% in 2007 to 45.3% in 2012
and to 41.4% in 2018 (p = 0.022; see Figure 2). With regard to the middle-aged respondents, it was
and to 41.4% in 2018 (p = 0.022; see Figure 2). With regard to the middle-aged respondents, it was
61.4%, 47.3%, and 41.2%, respectively (p < 0.001; see Figure 3). For the group of elderly individuals,
61.4%, 47.3%, and 41.2%, respectively (p < 0.001; see Figure 3). For the group of elderly individuals, it
it was the only age group where this distribution was not statistically significant. However, starting
was the only age group where this distribution was not statistically significant. However, starting
from 50% in the 2007 study, it collapsed to 43.8% in 2012 and remained almost constant at 44.3% in
from 50% in the 2007 study, it collapsed to 43.8% in 2012 and remained almost constant at 44.3% in
2018 (see Figure 4). For more details, see Table S3 in the supplementary materials.
2018 (see Figure 4). For more details, see Table S3 in the supplementary materials.
3.4. Impact of Sociodemographic Variables on Interest in Access to EHRs
3.4. Impact of Sociodemographic Variables on Interest in Access to EHRs
      Interest in access to EHRs was higher among men than women (66% versus 61.8%; p = 0.044),
among Interest  in access
        those living   withtosomeone
                              EHRs waselsehigher  among
                                           than alone     menversus
                                                      (64.1%   than women
                                                                     50.5%; p (66%  versus
                                                                              < 0.001), and 61.8%;   p = 0.044),
                                                                                            when comparing
among using
people    thosea living
                  mobilewith
                           phonesomeone
                                  to thoseelse
                                            whothan
                                                 werealone   (64.1%versus
                                                       not (64.6%    versus   50.5%;
                                                                           32.9%; p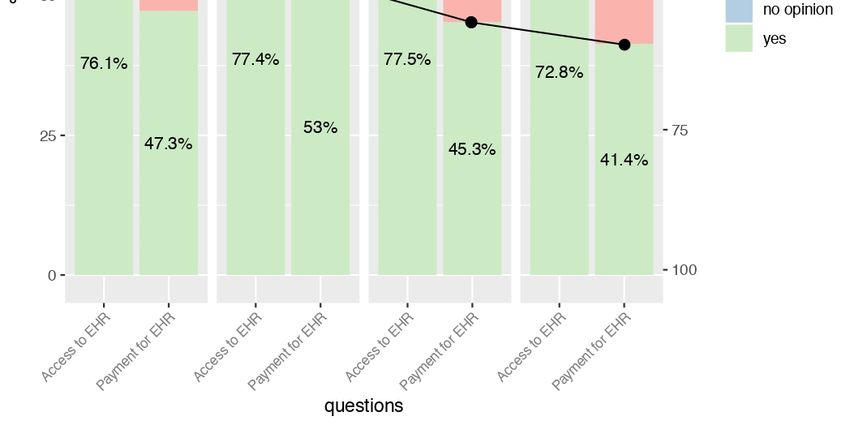
Int. J. Environ. Res. Public Health 2020, 17, 6165                                                                              8 of 17

the greatest interest was shown by people using the internet every day (76.4%; p < 0.001), followed
by people using it at least once a year (63.8%; p < 0.001). It is interesting that as much as 43.4% of
people who have never used the internet were still interested in accessing EHRs. Analyzing the group
of people using the internet for health purposes (HI-users), the interest in accessing EHRs increased
with a higher frequency of using the internet for health purposes (p < 0.001). In the group of general
internet users, interest was demonstrated by 52% of people not using the internet for health purposes
(non-HI-users). Access to EHRs gained the greatest popularity among students (78.7%) and the lowest
interest among pensioners (45.7%); p < 0.001. Detailed data are included in Table 2.

      Table 2. Impact of sociodemographic variables on the distribution of answers about interest in EHRs.

                   Characteristics of Respondents                                   Interest in Access to EHRs
                                                                          (a) yes           (b) no     (c) I don’t know     p
            Variable                               Categories            n       %         n     %       n        %       1−β
              Sex                                    (a) male           925      66       440   31.4     37       2.6     0.044
                                                   (b) female           987     61.8      556   34.8     55       3.4     0.604
           Education                              (a) primary           334     48.2      334   48.2     25       3.6       0        *
                                                (b) secondary           481     64.9      239   32.3     21       2.8       1
                                                   (c) higher           428     75.6      132   23.3      6       1.1
          Inhabitancy                               (a) alone           142     50.5      125   44.5     14        5        0        *
                                          (b) with someone else         1100    64.1      578   33.7     38       2.2     0.992
           Residence                       (a) village/rural area       650     57.2      447   39.3     39       3.4       0        *
                                  (b) small town (100.000 residents)   648     69.6      254   27.3     29       3.1
     Professional situation                       (a) student           229     78.7       57   19.6      5       1.7       0        *
                                                 (b) working            1175    70.7      440   26.5     47       2.8       1
                                                (c) pensioner           397     45.7      438   50.5     33       3.8
                                              (d) unemployed            109     62.3       59   33.7      7        4
  Frequency of internet usage                    (a) everyday           1148    76.4      326   21.7     29       1.9       0        *
                                        (b) at least once a month       376     59.3      236   37.2     22       3.5       1
                                          (c) at least once a year       44     63.8       25   36.2      0        0
                                                    (d) never           342     43.4      405   51.4     41       5.2
         Frequency of                            (a) everyday            58     78.4       14   18.9      2       2.7       0        *
     health internet usage              (b) at least once a month       918      74       296   23.9     26       2.1       1
                                          (c) at least once a year      411     71.4      155   26.9     10       1.7
                                         (d) less than one a year        30     62.5       17   35.4      1       2.1
                                                    (e) never           184      52       155   43.8     15       4.2
 Subjective health assessment               (a) good/very good          1221    70.3      465   26.8     51       2.9       0        *
                                                  (b) average           585     56.5      421   40.6     30       2.9       1
                                              (c) bad/very bad           97     46.4      101   48.3     11       5.3
      Using a cell phone                              (a) yes           1193    64.6      613   33.2     42       2.3       0        *
                                                      (b) no             50     32.9       92   60.5     10       6.6       1
                                                     * p = 0 means p < 0.001.

3.5. Impact of Sociodemographic Variables on Consent to Payment for Access to EHRs
      The only statistically significant factor affecting the consent to pay for access to EHRs was the
frequency of using the internet for health purposes (p = 0.048). Most often, such consent was given by
everyday HI-users. Similarly, as to interest in access to EHRs, it is surprising that 44.6% of non-HI-users
were willing to pay for such access. The consent to pay for access to EHRs was not affected by sex,
education, living with someone or alone, the size of the place of residence, professional situation,
frequency of internet use, subjective assessment of health, or use of a mobile phone. All these variables
had a significant impact on interest in access to EHRs, although they were not statistically significant
in relation to consent to pay for such a service. More details are included in Table 3.
Int. J. Environ. Res. Public Health 2020, 17, 6165 9 of 17
Table 3. Impact of sociodemographic variables on the distribution of answers about consent to payment
for access to EHRs.
Consent to Payment for Access to
Characteristics of Respondents
EHRs *
(a) yes (b) no p
Variable Categories n % n % 1−β
Sex (a) male 450 48.6 475 51.4 0.686
(b) female 470 47.6 517 52.4 0.069
Education (a) primary 148 44.3 186 55.7 0.985
(b) secondary 211 43.9 270 56.1 0.053
(c) higher 187 43.7 241 56.3
Inhabitancy (a) alone 55 38.7 87 61.3 0.213
(b) with someone else 491 44.6 609 55.4 0.238
Residence (a) village/rural area 330 50.8 320 49.2 0.15
(b) small town (100.000 residents) 294 45.4 354 54.6
Professional situation (a) student 100 43.7 129 56.3 0.528
(b) working 575 48.9 600 51.1 0.210
(c) pensioner 191 48.1 206 51.9
(d) unemployed 54 49.5 55 50.5
Frequency of internet usage (a) everyday 537 46.8 611 53.2 0.521
(b) at least once a month 191 50.8 185 49.2 0.213
(c) at least once a year 21 47.7 23 52.3
(d) never 170 49.7 172 50.3
Frequency of (a) everyday 30 51.7 28 48.3 0.048
health internet usage (b) at least once a month 461 50.2 457 49.8 0.694
(c) at least once a year 174 42.3 237 57.7
(d) less than one a year 11 36.7 19 63.3
(e) never 82 44.6 102 55.4
Subjective health assessment (a) good/very good 576 47.2 645 52.8 0.548
(b) average 292 49.9 293 50.1 0.151
(c) bad/very bad 46 47.4 51 52.6
Using a cell phone (a) yes 529 44.3 664 55.7 0.194
(b) no 17 34 33 66 0.196
* People who were not interested in accessing EHRs or had no opinion did not answer the question concerning
consent to pay for access to EHRs.
3.6. Profile of the Potential EHR User
Correspondence analysis of interest in access to EHRs based on the most recent data from the 2018
survey presented three clusters of more frequent coexistence of categories of the studied variables:
a (people interested in access to EHR), b (people not interested in access to EHR) and c (people with no
opinion on access to EHR); see Figure 5.
Belonging to a young or middle-aged group, having secondary or higher education, living with a
family in a small town or big city, studying, working, or perchance being unemployed, using a mobile
phone, using the internet every day and any use of the internet for health purposes, and good or very
good subjective health assessment were positively correlated with greater interest in access to EHRs.
On the other hand, living alone in the countryside, having primary education, using the internet
at least once a month, and an average subjective assessment of health contributed to the reluctance to
access EHR.
Other characteristics, such as older age, being a pensioner, using the internet at least once a year
or never and not using it for health purposes, not having a cell phone, and assessing health as bad,
were typical of those who had no opinion about accessing EHRs.
The analysis of correspondence for the consent to pay for access to EHRs did not show any
differences between the clusters for a given category (yes or no). In the figure, the two categories are
close together, even sharing the same x-axis coordinate. This is the reason why it was impossible to
identify the characteristics of the person who would most likely pay for access to EHRs (see Figure S1
in the supplementary materials).Int. J. Environ. Res. Public Health 2020, 17, x 11 of 19
Int. J. Environ. Res. Public Health 2020, 17, 6165 10 of 17
Figure
Figure 5.5. Profile
Profileofofpersons
personsinterested or or
interested notnot
interested in access
interested to EHR
in access in 2018
to EHR year year
in 2018 basedbased
on on
correspondence analysis (legend in Supplementary Materials, Table
correspondence analysis (legend in Supplementary Materials, Table S4). S4).
4. Discussion
Belonging to a young or middle-aged group, having secondary or higher education, living with
a family in a small town or big city, studying, working, or perchance being unemployed, using a
4.1. Trends
mobile Regarding
phone, Interest
using the in Access
internet every dayto EHRs
and any use of the internet for health purposes, and good
or very good subjective health assessment
As our study shows, a general interest in were positively
access tocorrelated with greater
EHRs remains at a interest in access
relatively high level.
to EHRs.
However, it has significantly decreased in studies carried out in 2007, 2012, and 2018. This fact seems
to beOn the otherbecause
awkward hand, living alone
the use ofinEHRs
the countryside, having
in healthcare primary education,
is constantly increasing.using
Onthe
theinternet
other hand,
at least once a month, and an average subjective assessment of health contributed to the reluctance
the downward trend may be the result of several changes that have occurred in societies. It appears to
to access EHR.
be related, inter alia, to the commonly observed aging of the population, and the fact that older people
Other characteristics, such as older age, being a pensioner, using the internet at least once a year
use the internet less often [27,28]. Another important issue is that there is an increase in awareness
or never and not using it for health purposes, not having a cell phone, and assessing health as bad,
among internet users, and a lot of data leaks have been publicized [29,30]. The fear of internet threats
were typical of those who had no opinion about accessing EHRs.
is growing [31]. Network security, despite its constant development, does not guarantee full data
The analysis of correspondence for the consent to pay for access to EHRs did not show any
security [32,33].
differences betweenIt the
should alsofor
clusters beaconsidered
given categorythat(yes
access to EHRs
or no). has been
In the figure, the implemented
two categories in
aremany
countries around the world [11], so, as a result, a large proportion of patients have already
close together, even sharing the same x-axis coordinate. This is the reason why it was impossible to experienced
EHRs, which
identify nowadays seems
the characteristics of theto have greater
person value
who would for likely
most doctors than
pay for for patients
access [34,35].
to EHRs (see Figure
S1 in Analyzing the individual
the supplementary age groups, it can be seen that the greatest interest in access to EHRs
materials).
is shown by young people, but this has also decreased over the years. One of the reasons for
this can be a growing pace of life [36,37]. Busy young people usually leave health decisions to
their physicians without using EHRs personally, and they expect fast and effective service from aInt. J. Environ. Res. Public Health 2020, 17, 6165 11 of 17
doctor [38,39]. Nevertheless, access to EHRs positively affects the satisfaction of patients who receive
made-to-measure medical services. The next important factor explaining the lower interest among
young people may be associated with the low morbidity in this age group [40]. In turn, the middle-aged
group is the most stable in terms of trend analysis. According to many authors’ reports, middle-age is
the time when the risk of developing lifestyle diseases increases significantly [41,42]. The need for
multispecialist consultations in this group of patients has an impact on maintaining a high interest in
access to EHRs [41,42]. Among older people, the sinusoidal trend may be due to the fact that many of
them do not really understand what EHRs are exactly, but often want to keep up with news [43,44].
These people also have more free time that they can devote to an interest in health. Moreover, as also
confirmed by other authors, the majority of them are afraid of social isolation and exclusion, which may
explain the desire to keep up with the latest trends [44,45].
4.2. Trends Regarding Consent to Payment for Access to EHRs
Trends concerning consent to pay for access to EHRs are related to a decrease in general interest
in this service. In subsequent studies carried out in 2008, 2012, and 2018, the overall acceptance of a fee
for this service has gradually declined.
Such a situation is observed in particular age groups as well. Among young people, a greater
reluctance to make payments may be due to low earnings at the beginning of their careers and
increasing spending when starting a new family [46,47]. According to many other authors, because
of convenience and increasing demands for high comfort in life, they become independent later,
so their health is cared for by their families [47,48]. Middle-aged people statistically showed the
highest willingness to pay for access to EHRs, but at the same time, the highest downward trend
year-on-year was observed in this group. The decrease can be associated with the popularization of
employer-paid medical care subscriptions as an additional bonus to salary and the more frequent use of
the private healthcare sector, where access to EHRs is often provided in the price of the service [49–51].
The percentage of older people agreeing to pay for access to EHRs has been relatively steady over the
years. Health expenses are becoming the main cost of living in this age group and have the highest
priority [52,53]. However, when comparing this age group with others, the biggest reluctance to pay
for access to EHRs is visible. This may be related to their large expenditure on health [52,53].
In addition to the above, the study shows a very interesting phenomenon that even part of
non-HI-users and those who do not use the internet at all are interested in accessing EHRs, and,
furthermore, they even agree to pay for this service. Unfortunately, there is not enough data to explain
this unclear finding. One of the explanations could be the fact that health is very valuable. Possibly,
in their view, interest in accessing EHRs is simply health-oriented behavior and not a direct benefit
for themselves [54–56]. Likewise, it may indicate their willingness to provide such access to family
members or medical staff. It is also possible that after receiving such access, they would start using the
internet for health and/or general purposes [54–57].
4.3. Impact of Sociodemographic Variables on Interest in Access and Consent to Pay for EHRs
The study shows that all analyzed sociodemographic variables had a statistically significant
effect on interest in accessing EHRs. Men are more interested in access to EHRs, as confirmed by
many studies. This is probably due to more frequent professional contact with e-services [58,59].
People living with someone else showed similar higher interest, which could be explained by the
willingness to share information in the household and care for other family members [57,60]. The use
of a mobile phone is also positively related to interest in access to EHRs as it is a sign of technological
progress [61,62]. The positive relationships with higher education and living in a larger city may result
from greater openness to new opportunities, being surrounded by all sorts of innovations, and greater
awareness of healthy behaviors [63,64]. It also concerns students who travel a lot, therefore needing
portable medical records [65,66]. Retirees are a group who is least interested in access to EHRs as
they are the least computerized and most analog group in a digital world [67,68]. Subjective healthInt. J. Environ. Res. Public Health 2020, 17, 6165 12 of 17
assessment also influences the interest in access to EHRs, which increases with better assessments.
People who assess their health poorly may be more resigned and indifferent, so they are usually not
interested in access to EHRs [69–71].
On the basis of the correspondence analysis, it is possible to distinguish the characteristics of the
person who would most likely have accessed EHRs recently. The so-called “super-user” of EHRs is a
man or woman, aged 15–59, living with family in the city. He is well educated and is still studying or
working. He believes that his health is at least good, he has a mobile phone, and he eagerly uses the
internet for health purposes on a daily basis (see Figure 5).
In contrast to interest in accessing EHRs, the willingness to pay for such a service depends only on
the use of the internet for health purposes. As many other authors have confirmed, frequent HI-users
have better-defined needs and requirements, which results from better knowledge of the possibilities
and availability of the e-health sector’s services [72,73]. Trying to obtain the most reliable information,
they become a partner to the doctor in decisions regarding their health [74], which seems to positively
affect their acceptance to pay for access to EHRs.
4.4. Comparison with Other Countries and Implication for the Future
Although there are not many similar recent studies from other countries, comparing the situation
related to willingness to access EHRs is crucial. Referring to the publication by Paccoud, Baumann et al.
from 2020, based on surveys conducted in Luxembourg, Belgium, France, and Germany, on average,
82.6% of respondents were interested in accessing EHRs compared to 63.7% in our study [75]. It is
worth mentioning that although we do not have such data from Poland due to a lack of implementation
of EHRs so far, in Luxembourg, Belgium, France, and Germany, only 7.5% of respondents actually have
access to EHRs, and only 3.5% intend to use EHRs regularly [75]. In Western countries, as in Poland,
the interest in access to EHRs is positively correlated with a higher education level, and negatively
correlated with older age. In Western countries, women have expressed greater interest in access to
EHRs, while in Poland, men were a bit more interested [75]. The general interest in access to EHRs is
lower in Poland than in Western countries. However, it should be noted that physical access to EHRs
in every country remains low.
Efforts from each side are undoubtedly needed to promote EHRs and implement them on a bigger
scale. The government could create a coherent platform that is easy and intuitive to use. It could also
financially support the computerization of healthcare entities. Medical institutions should create a
common, unified network that is cloud-based, which must be secure [76]. It would also be a good
idea to organize EHR training for personnel, demonstrating to them how to use EHRs easily and
pointing to the capabilities and advantages [77]. On the other hand, patients should be informed about
the benefits of using EHRs, such as ensuring continuity of care and its holistic nature, by enabling
every physician who contributes to the diagnostic and therapeutic process to have full insight into the
patient’s documentation [78]. This is also a convenience for patients, who will not have to provide,
in person, the results of consultations from other specialists, which helps to avoid the increasingly
frequent problem of polypharmacy [79].
4.5. Limitations
The study has several limitations. First of all, there were few variables, such as education,
inhabitancy, and mobile phone use, that were not included in the survey in 2007. Therefore, it was
not possible to fully observe how and if these characteristics changed over time and to analyze the
corresponding designation of the trend line.
The method of sample collection, reporting, and analyzing data was exactly the same for all three
surveys. However, the study did not follow the same individuals over the study period, and because
of that, the observed changes could be analyzed only from the perspective of the general population or
distinguished subgroups and cannot represent the attitudes and opinions of the individual participants
in the study.Int. J. Environ. Res. Public Health 2020, 17, 6165 13 of 17
It should be noted that in the subsequent studies, there was an increased percentage of older
people. Such a distribution, however, best reflects the changes taking place in the structure of an aging
society and is necessary to maintain the representativeness of the study group.
The question about money and income is always a tricky one and is often associated with the
feeling of discomfort. On the one hand, a large part of the population may not want to be considered
poor or scanty, and on the other hand, another part of society may be trying to hide their assets.
Therefore, it was not possible to relate the financial status of respondents with the consent to pay for
access to EHRs.
Finally, it should also be mentioned that although the survey carried out in 2018 is recent,
the current situation may already vary due to the rapid development of telemedicine in the course of
the SARS–CoV-2 pandemic. As a result, there is a need for further studies that can precisely analyze
the current situation.
5. Conclusions
The development of e-health services, which is progressing around the world, seems to be the
answer to the needs of doctors and patients. New solutions are constantly being introduced. During our
11-year observation, our research has shown that both interest in access to EHRs and consent to pay for
it has generally remained at the same level, with an average interest of over 60%, of which more than
half of the respondents are willing to pay for this service. However, despite this, a slight decrease in
the year-on-year trend line is noted. The youngest age group showed the highest general interest in
access to EHRs, and middle-aged people were the most willing to pay for it. The group of older people
accounted for the lowest percentage of affirmative answers in both categories. The sociodemographic
factors that had the most distinct impact on interest in access to EHRs included higher education,
being professionally active or being a student, having a high subjective health assessment, using a
mobile phone, using the internet on a daily basis, and frequently using the internet for health purposes.
The last factor was also the only one significantly influencing the greater willingness to pay for access
to EHRs. In summary, there is still a big demand for EHRs, and it has been an invariable segment
of the health market for many years. The majority of people are open to innovations in e-health
services, especially when they care about their health. That is why it is so important to educate
patients, introduce a unified system that is friendly for medical attendants, and firmly implement
EHRs, which have great potential to improve healthcare significantly for both patients and doctors.
Supplementary Materials: The following are available online at http://www.mdpi.com/1660-4601/17/17/6165/s1.
Table S1: Distribution of “yes” and “no” answers about interest in access to EHRs in subsequent trials in total and
separately for each age group, with 95% confidence intervals (CI1, CI2). Table S2: Distribution of answers about
interest in access to EHRs and consent to payment for such access in age groups for all trials combined. Table S3:
Distribution of answers about interest in access to EHRs and consent to payment for such access in subsequent
trials, separately for each age group. Table S4: Legend to Figure 5 and Figure S1. Figure S1: Profile of persons
willing or not willing to pay for access to EHRs in 2018 based on correspondence analysis (legend in supplementary
files, Table S4). Questionnaire S1: 2007 year survey questionnaire (originally in English). Questionnaire S2: 2012
and 2018 survey questionnaires (translated to English).
Author Contributions: M.M.B.-F. conceptualized the study and prepared the questionnaire design. Analysis and
interpretation of data were conducted by M.M.B.-F., and Ł.W. Ł.W. prepared the first draft of the manuscript.
M.M.B.-F. revised the manuscript several times with a critical revision of important intellectual content. All authors
have read and agreed to the published version of the manuscript.
Funding: This research was funded by statutory grants of Wroclaw Medical University (ST 481/2010,
ST C290.17.040).
Acknowledgments: This article forms a part of national surveys on the use of internet and e-health services in
Poland conducted by Wroclaw Medical University. The authors would like to thank Tomasz Kujawa for his help
on methodology and statistics.
Conflicts of Interest: The authors declare no conflict of interest.Int. J. Environ. Res. Public Health 2020, 17, 6165 14 of 17
References
1. Bujnowska-Fedak, M.M.; W˛egierek, P. The impact of online health information on patient health behaviours
and making decisions concerning health. Int. J. Environ. Res. Public Health 2020, 17, 880. [CrossRef] [PubMed]
2. Novel Coronavirus Pneumonia Emergency Response Epidemiology Team. The epidemiological
characteristics of an outbreak of 2019 novel coronavirus diseases (COVID-19) in China. Zhonghua Liu
Xing Bing Xue Za Zhi 2020, 41, 145–151. [CrossRef]
3. Deetjen, U. European E-Prescriptions: Benefits and Success Factors; Cyber Studies Programmme: Oxford, UK,
2016.
4. Carnicero Giménez de Azcárate, J.; Rojas, D. Economic Commission for Latin America and the Caribbean.
Social Development Division. In Application of Information and Communication Technologies for Health Systems
in Belgium, Denmark, Spain, the United Kingdom and Sweden; Naciones Unidas, CEPAL: Santiago, Chile, 2010;
ISBN 9789211217469.
5. Hufstader, M.; Swain, M.; Furukawa, M.F. State Variation in E-Prescribing Trends in the United States—ONC
Data Brief. No. 4 November 2012; ONC: Washington, DC, USA, 2012.
6. Porterfield, A.; Engelbert, K.; Coustasse, A. Electronic prescribing: Improving the efficiency and accuracy of
prescribing in the ambulatory care setting. Perspect. Health Inf. Manag. 2014, 11, 1g. [PubMed]
7. The ePrescription System: Draft Amending the Act on Medicines is under Discussion in the Parliament of
the Czech Republic—Lexology. Available online: https://www.lexology.com/library/detail.aspx?g=a82ee2c5-
4bfc-46d4-bbf9-f83d04f452a8& (accessed on 1 April 2020).
8. Kiljan, A.; Romaszewski, A.; Kopański, Z.; Liniarski, M.; Dyl, S.; Rowiński, J. The benefits of using an
e-prescription. J. Public Health Nurs. Med. Rescue 2019, 289, 32–34.
9. Czerska, I.; Trojanowska, A.; Korpak, T. Przyszłość Opieki Zdrowotnej w Polsce—Nowe Horyzonty [The
Future of Healthcare in Poland—New Horizons.]. In E-Wydawnictwo. Prawnicza i Ekon. Bibl. Cyfrowa. Wydz.
Prawa, Adm. i Ekon. Uniw. Wrocławskiego; E-Wydawnictwo: Portal, Poland, 2019; pp. 197–214. [CrossRef]
10. National EHR System Exists—European Health Information Gateway. Available online: https://gateway.
euro.who.int/en/indicators/ehealth_survey_84-has-a-national-ehr-system/ (accessed on 1 April 2020).
11. Jha, A.K.; Doolan, D.; Grandt, D.; Scott, T.; Bates, D.W. The use of health information technology in seven
nations. Int. J. Med. Inform. 2008, 77, 848–854. [CrossRef]
12. Adler-Milstein, J.; DesRoches, C.M.; Kralovec, P.; Foster, G.; Worzala, C.; Charles, D.; Searcy, T.; Jha, A.K.
Electronic health record adoption in us hospitals: Progress continues, but challenges persist. Health Aff. 2015,
34, 2174–2180. [CrossRef]
13. Stroetmann, K.A.; Artmann, J.; Stroetmann, V.N.; Protti, D.; Dumortier, J.; Giest, S.; Walossek, U.;
Whitehouse, D. eHealth Strategies—European Countries on their Journey towards National eHealth
Infractructers—Final European Progress Report; European Commission: Luxembourg, 2011; pp. 1–60. Available
online: http://ec.europa.eu/information_society/ehealth (accessed on 23 March 2020).
14. Bonomi, S. The Electronic Health Record: A Comparison of Some European Countries. Inf. Commun. Technol.
Organ. Soc. 2016, 15, 205–214. [CrossRef]
15. Adler-Milstein, J.; DesRoches, C.M.; Furukawa, M.F.; Worzala, C.; Charles, D.; Kralovec, P.; Stalley, S.;
Jha, A.K. More than half of US hospitals have at least a basic EHR, but stage 2 criteria remain challenging for
most. Health Aff. 2014, 33, 1664–1671. [CrossRef]
16. Hsiao, C.J.; Hing, E.; Ashman, J. Trends in Electronic Health Record System Use Among Office-based
Physicians: United States, 2007–2012. Natl. Health Stat. Report. 2014, 75, 1–17.
17. Zlabek, J.A.; Wickus, J.W.; Mathiason, M.A. Early cost and safety benefits of an inpatient electronic health
record. J. Am. Med. Inform. Assoc. 2011, 18, 169–172. [CrossRef]
18. Christensen, L. The Role of Web Interviews as Part of a National Travel Survey. In Transport Survey Methods:
Best Practice for Decision Making; Emerald Group Publishing Limited: Bingley, UK, 2013; pp. 115–154.
19. Bujnowska-Fedak, M.M.; Kurpas, D. The influence of online health information on the attitude and behavior
of people aged 50+. Adv. Exp. Med. Biol. 2015, 861, 1–17. [CrossRef] [PubMed]
20. Santana, S.; Lausen, B.; Bujnowska-Fedak, M.; Chronaki, C.E.; Prokosch, H.U.; Wynn, R. Informed citizen and
empowered citizen in health: Results from an European survey. BMC Fam. Pract. 2011, 12, 20. [CrossRef]
[PubMed]Int. J. Environ. Res. Public Health 2020, 17, 6165 15 of 17
21. Bujnowska-Fedak, M.M.; Mastalerz-Migas, A. Usage of Medical Internet and E-Health Services by the Elderly.
In Advances in Experimental Medicine and Biology; Springer: New York, NY, USA, 2014; Volume 834, pp. 75–80.
22. Bujnowska-Fedak, M.M.; Waligóra, J.; Mastalerz-Migas, A. The Internet as a Source of Health Information
and Services. In Advances in Experimental Medicine and Biology; Springer: Singapore, 2019; Volume 1211,
pp. 1–16.
23. Waligóra, J.; Bujnowska–Fedak, M.M. Online Health Technologies and Mobile Devices: Attitudes, Needs, and
Future. In Advances in Experimental Medicine and Biology; Springer: New York, NY, USA, 2019; Volume 1153,
pp. 19–29.
24. Andreassen, H.K.; Bujnowska-Fedak, M.M.; Chronaki, C.E.; Dumitru, R.C.; Pudule, I.; Santana, S.; Voss, H.;
Wynn, R. European citizens’ use of E-health services: A study of seven countries. BMC Public Health 2007,
7, 53. [CrossRef]
25. Bujnowska-Fedak, M.M. Trends in the use of the Internet for health purposes in Poland. BMC Public Health
2015, 15, 194. [CrossRef] [PubMed]
26. Kummervold, P.E.; Chronaki, C.E.; Lausen, B.; Prokosch, H.-U.; Rasmussen, J.; Santana, S.; Staniszewski, A.;
Wangberg, S.C. eHealth trends in Europe 2005–2007: A population-based survey. J. Med. Internet Res. 2008,
10, e42. [CrossRef] [PubMed]
27. Pang, Z.; Yuan, H.; Zhang, Y.T.; Packirisamy, M. Guest Editorial Health Engineering Driven by the Industry
4.0 for Aging Society. IEEE J. Biomed. Health Inform. 2018, 22, 1709–1710. [CrossRef]
28. Carbonaro, G.; Leanza, E.; McCann, P.; Medda, F. Demographic Decline, Population Aging, and Modern
Financial Approaches to Urban Policy. Int. Reg. Sci. Rev. 2018, 41, 210–232. [CrossRef]
29. Xuming, L.; Lina, C.; Peng, J.; Xiao, G.; Shuo, C. Current status and future prospects of data leakage
prevention technology: A brief review. J. Phys. Conf. Ser. 2019, 1345, 22010. [CrossRef]
30. Flynn, T.; Grispos, G.; Glisson, W.; Mahoney, W. Knock! Knock! Who Is There? Investigating Data Leakage
from a Medical Internet of Things Hijacking Attack. In Proceedings of the 53rd Hawaii International
Conference on System Sciences, Hawaii, HI, USA, 7–10 January 2020.
31. Mou, J.; Shin, D.H.; Cohen, J.F. Trust and risk in consumer acceptance of e-services. Electron. Commer. Res.
2017, 17, 255–288. [CrossRef]
32. Jara, A.J.; Bocchi, Y. GEO-Trust: Geo-aware security protocol for enabling cross-border trustable operations
and data exchange in a global digital economy. In Proceedings of the 2019 IEEE 1st Sustainable Cities Latin
America Conference, SCLA 2019, Arequpar, Peru, 26–29 August 2019.
33. Massarczyk, P.; Winzer, E. Influence of the Perceived Data Security, Credibility, Trust and Confidence on the Usage
Frequency of Internet Services and the Provision of Security Measures; IEEE: Piscataway Township, NJ, USA, 2019.
34. Campanella, N.; Srl, N.; Benedetto del Tronto, S.; Piceno, A.; Pierpaolo Morosini, I.; Sampaolo, G.; Wright, H.
Satisfaction of Medical Doctors in Handling the Citizen’s Electronic Health Record. Qual. Primaty Care 2017,
25, 267–272.
35. Osop, H.; Sahama, T. Doctors’ perception of the potential of EHR: A Singapore insight. ACSW ’18 Proc.
Australas. Comput. Sci. Week Multiconference 2017, 6, 1–6. [CrossRef]
36. Frison, E.; Eggermont, S. “Harder, Better, Faster, Stronger”: Negative Comparison on Facebook and
Adolescents’ Life Satisfaction Are Reciprocally Related. Cyberpsychol. Behav. Soc. Netw. 2016, 19, 158–164.
[CrossRef] [PubMed]
37. Ruiz-Palomino, E.; Giménez-García, C.; Ballester-Arnal, R.; Gil-Llario, M.D. Health promotion in young
people: Identifying the predisposing factors of self-care health habits. J. Health Psychol. 2018. [CrossRef]
[PubMed]
38. Bensing, J.M.; Verhaak, P.F.M. Somatisation: A joint responsibility of doctor and patient. Lancet 2006, 367,
452–454. [CrossRef]
39. Sobczak, K.; Leoniuk, K.; Pawłowski, L.; Spolak, N. Clinical communication—A comparison of patients’ and
doctors’ opinions. Pomeranian J. Life Sci. 2017, 62. [CrossRef]
40. Currie, C.; Hurrlemann, K.; Settertobulte, W.; Smith, R.; Todd, J. Health and Health Behaviour Among Young
People: International Report. In WHO Policy Series: Health Policy for Children and Adolescents; WHO Regional
Office for Europe: Copenhagen, Danmark, 2000.
41. Verhaeghe, R.; Mak, R.; Van Maele, G.; Kornitzer, M.; De Backer, G. Job stress among middle-aged health
care workers and its relation to sickness absence. Stress Health 2003, 19, 265–274. [CrossRef]Int. J. Environ. Res. Public Health 2020, 17, 6165 16 of 17
42. Luster, J.; Ratz, D.; Wei, M.Y. Predictors of social participation among middle-aged and older Americans:
Data from the Health and Retirement Study. In Proceedings of the APHA’s 2019 Annual Meeting and Expo,
Philadelphia, PA, USA, 2–6 November 2019.
43. Zarina, I.; Circenis, K.; Erts, R. Measuring the technophobia among middle-aged and older adults in Latvia:
A pilot study. SHS Web Conf. 2018, 51, 02003. [CrossRef]
44. Chiu, C.-J.; Liu, C.-W. Understanding Older Adult’s Technology Adoption and Withdrawal for Elderly Care
and Education: Mixed Method Analysis from National Survey. J. Med. Internet Res. 2017, 19, e374. [CrossRef]
45. Benyamini, Y.; Leventhal, E.A.; Leventhal, H. Elderly people’s ratings of the importance of health-related
factors to their self-assessments of health. Soc. Sci. Med. 2003, 56, 1661–1667. [CrossRef]
46. Binelli, C. Employment and Earnings Expectations of Jobless Young Skilled: Evidence from Italy. Soc. Indic. Res.
2019, 145, 201–231. [CrossRef]
47. Dotti Sani, G.M.; Acciai, C. Two hearts and a loan? Mortgages, employment insecurity and earnings among
young couples in six European countries. Urban. Stud. 2018, 55, 2451–2469. [CrossRef]
48. Poggenpoel, M.; Jacobs, F.E.; Myburgh, C.P.H.; Temane, A.M. Young families become mindful of their
possibilities through the appreciation of their family life. Health SA Gesondheid 2017, 22, a948. [CrossRef]
49. Jin, Y.; Hou, Z.; Zhang, D. Determinants of health insurance coverage among people aged 45 and over in
China: Who buys public, private and multiple insurance. PLoS ONE 2016, 11, e0161774. [CrossRef]
50. Phanie Baggio Id, S.; Dupuis, M.; Wolff, H.; Bodenmann, P. Associations of lack of voluntary private insurance
and out-of-pocket expenditures with health inequalities. Evidence from an international longitudinal survey
in countries with universal health coverage. PLoS ONE 2018, 13, e0204666. [CrossRef]
51. Lewis, S.; Collyer, F.; Willis, K.; Harley, K.; Marcus, K.; Calnan, M.; Gabe, J. Healthcare in the news media:
The privileging of private over public. J. Sociol. 2018, 54, 574–590. [CrossRef]
52. Dolls, M.; Doerrenberg, P.; Peichl, A.; Stichnoth, H. Do retirement savings increase in response to information
about retirement and expected pensions? J. Public Econ. 2018, 158, 168–179. [CrossRef]
53. Giovanis, E.; Ozdamar, O. Health status, mental health and air quality: Evidence from pensioners in Europe.
Environ. Sci. Pollut. Res. 2018, 25, 14206–14225. [CrossRef]
54. Stafford, M.; Steventon, A.; Thorlby, R.; Fisher, R.; Turton, C.; Deeny, S. Briefing: Understanding the Health Care
Needs of People with Multiple Health Conditions; The Health Foundation: London, UK, 2018.
55. Zhang, Y.; Coello, P.A.; Brozek, J.; Wiercioch, W.; Etxeandia-Ikobaltzeta, I.; Akl, E.A.; Meerpohl, J.J.;
Alhazzani, W.; Carrasco-Labra, A.; Morgan, R.L.; et al. Using patient values and preferences to inform
the importance of health outcomes in practice guideline development following the GRADE approach.
Health Qual. Life Outcomes 2017, 15, 1–10. [CrossRef]
56. Lamu, A.N.; Olsen, J.A. The relative importance of health, income and social relations for subjective
well-being: An integrative analysis. Soc. Sci. Med. 2016, 152, 176–185. [CrossRef]
57. Yamashita, N.; Kuzuoka, H.; Kudo, T.; Hirata, K.; Aramaki, E.; Hattori, K. How Information Sharing About
Care Recipients by Family Caregivers Impacts Family Communication. In Proceedings of the Conference on
Human Factors in Computing Systems—Proceedings; Association for Computing Machinery: New York,
NY, USA, 2018; pp. 1–13.
58. Cortés, P.; Pan, J. When time binds: Substitutes for household production, returns to working long hours,
and the skilled gender wage gap. J. Labor Econ. 2019, 37, 351–398. [CrossRef]
59. Mulyaningsih, T.; Purwaningsih, Y.; Anggun, K. The Monetary Value of Market Replaceable Household
Production: An Empirical Study of the Economic Significance of Housewives’ Roles. Makara Hubs-Asia 2018,
22, 43–55. [CrossRef]
60. Verbakel, E. How to understand informal caregiving patterns in Europe? The role of formal long-term care
provisions and family care norms. Scand. J. Public Health 2018, 46, 436–447. [CrossRef]
61. Carroll, J.K.; Moorhead, A.; Bond, R.; LeBlanc, W.G.; Petrella, R.J.; Fiscella, K. Who uses mobile phone
health apps and does use matter? A secondary data analytics approach. J. Med. Internet Res. 2017, 19, e125.
[CrossRef]
62. Fennell, C.; Barkley, J.E.; Lepp, A. The relationship between cell phone use, physical activity, and sedentary
behavior in adults aged 18–80. Comput. Human Behav. 2019, 90, 53–59. [CrossRef]
63. Zajacova, A.; Lawrence, E.M. The Relationship Between Education and Health: Reducing Disparities
Through a Contextual Approach. Annu. Rev. Public Health 2018, 39, 273–289. [CrossRef]You can also read