Strategic Operations Framework 2016 - 2020 UN in Zimbabwe - United Nations Sustainable ...
←
→
Page content transcription
If your browser does not render page correctly, please read the page content below
2016 - 2020 UN in Zimbabwe
      Strategic Operations Framework
      Supporting Inclusive Growth & Sustainable Development

Empowered lives.
Resilient nations.

       www.zw.one.un.org   @UNZimbabwe      / www.zw.one.un.org
2016 - 2020 ST R ATEG I C O P ER ATI ON S F R A M EWOR K   UN I T ED N AT I ON S I N Z I M BA BW E
                                                                                                     UnitedÊNationsÊ
                                                                                                      Zimbabwe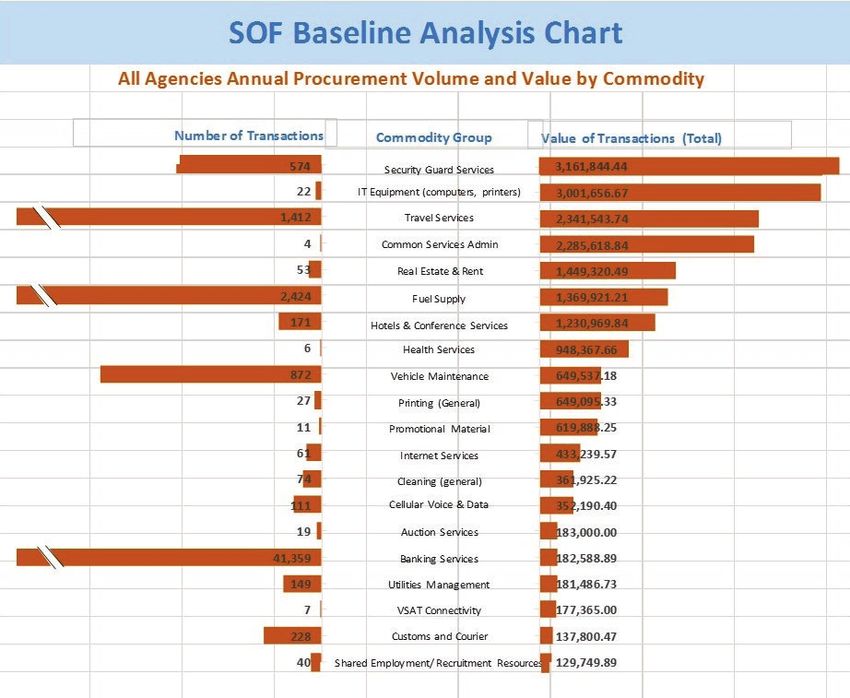
Contents
01   FOREWORD

02   SIGNATURE PAGE

03   EXECUTIVE SUMMARY

04   INTRODUCTION

05   OPERATIONS ANALYSIS

      06   Baseline Analysis

      08   Needs and Requirements Analysis

      08   Prioritization and Cost Benefit Analysis

11   RESULTS FRAMEWORK

      11   Common Services and Premises

      12   Finance and Harmonized Cash Transfers

      12   Human Resources Management

      13   Information and Communications Technology

      14   Common Procurement

15   RESOURCES AND BUDGETS

16   GOVERNANCE, MONITORING AND EVALUATION

      16   Governance Arrangements

      17   Monitoring and Evaluation Framework

19   SOF RESULTS MATRIX

33   ABBREVIATIONS AND ACRONYMS

                                                       03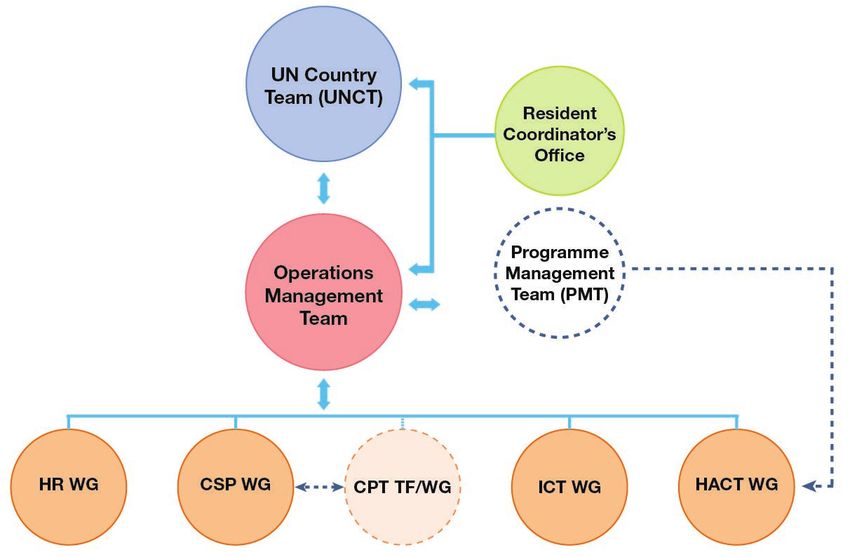
UnitedÊNationsÊ
                                                      Zimbabwe
    UN I T ED N AT I ON S I N Z I M BA BW E

                                                                       FOREWORD
                                                                       I am pleased to present the UN Country Team’s          implementation, savings of over $7.5 million will
                                                                       Strategic Operations Framework for the period          be achieved as net benefits through efficiency
                                                                       2016 – 2020. The Strategic Operations Framework        gains in material & service procurement, labour
                                                                       is a lighter version of the UN Development             costs, as well as from savings in expenses.
                                                                       Group’s Business Operations Strategy approach
                                                                       and covers UN Country Team priorities in the           Furthermore, UN Country Team support to
2016 - 2020 ST R ATEG I C O P ER ATI ON S F R A M EWOR K

                                                                       areas of common operations for 2016 – 2020. By         program delivery will be improved through
                                                                       adopting the Strategic Operations Framework,           Strategic Operations Framework activities such
                                                                       the UN Country Team in Zimbabwe joins a                as inter-agency multi-year planning for premises,
                                                                       growing number of others across the world              staff and assets in Harare and other centres and
                                                                       who have pledged to manage their support to            through the full implementation of harmonized
                                                                       program delivery more effectively.                     cash transfers.

                                                                       The Strategic Operations Framework builds              By adopting the Strategic Operations Framework,
                                                                       on ongoing efforts by the UN Country Team to           the UN Country Team is marking its commitment
                                                                       harmonize and simplify its business operations         to the simplification and harmonization of the
                                                                       and aims to address the gaps identified by the UN      UN’s business operations and the achievement
                                                                       General Assembly in strategic planning, coordi-        of better development results in Zimbabwe. We
                                                                       nation, and monitoring of the UN’s inter-agency        look forward to working with all development
                                                                       operations activities. This Strategic Operations       partners in the coming years towards successful
                                                                       Framework is therefore an important tool for           and timely implementation of this Strategic
                                                                       advancing the ‘Operating as One’ pillar of UN          Operations Framework.
                                                                       ‘Delivering as One’ and supports the implemen-
                                                                       tation of the UN Delivering as One ‘Standard           I am proud that the UN Country Team in
                                                                       Operating Procedures’ in Zimbabwe.                     Zimbabwe is joining a growing number of UN
                                                                                                                              Country Teams across the world in adopting for
                                                                       The aim through this Strategic Operations              implementation a cost effective and innovative
                                                                       Framework is to further improve the quality,           operations framework to maximize UN support
                                                                       timeliness, and cost-effectiveness of our oper-        to the people of Zimbabwe.
                                                                       ations. It is estimated that as a result of its full

                                                                       Bishow Parajuli

                                                                       UN Resident Coordinator

04
SIGNATURE PAGE
In witness thereof, the undersigned, being duly authorized, have signed the Strategic Operations Framework
on 9 December, 2015 in Harare, Zimbabwe.

For and on Behalf of the United Nations in Zimbabwe

Bishow Parajuli
United Nations Resident Coordinator
also on behalf of UNIDO, UNODC, UNOPS, UNIC

Chimimba David Phiri                 Hopolang Phororo                    Chali Tumelo
FAO Sub-regional Coordinator         ILO Director                        ITU Area Representative
and Representative

Michael Bartos                       Verity Nyagah                       Hubert Gijzen
UNAIDS Country Director              UNDP Country Director               UNESCO Regional Director

Cheikh Tidiane Cisse                 Jelvas Musau                        Reza Hossaini
UNFPA Representative                 UNHCR Representative                UNICEF Representative

Delphine Serumaga                    Gladys Mutyavaviri                  Eddie Rowe
UNWOMEN Representative               UPU Regional Coordinator            WFP Representative

                                     David Okello
                                     WHO Representative

                                                                                                             05
UnitedÊNationsÊ
                                                      Zimbabwe
    UN I T ED N AT I ON S I N Z I M BA BW E

                                                                       EXECUTIVE SUMMARY
                                                                       The UN General Assembly (UNGA) has called on         The SOF attempts to address implementation
                                                                       the UN system to work towards harmonizing its        challenges through a variety of inter-agency
                                                                       business operations following the 2012 quadren-      activities. The SOF results framework encom-
                                                                       nial comprehensive policy review (QCPR) of UN        passes five outcome areas: (i) Common Services
                                                                       operational activities for development. Reducing     and Premises, (ii) Finance and Harmonized Cash
                                                                       transaction costs and the duplication of opera-      Transfers, (iii) Human Resources Management,
2016 - 2020 ST R ATEG I C O P ER ATI ON S F R A M EWOR K

                                                                       tional support to program delivery were marked       (iv) Information and Communication Technology,
                                                                       as objectives.                                       and (v) Common Procurement. It provides meas-
                                                                                                                            urable outputs, indicators and targets to assist
                                                                       In response to this, the United Nations Country      in the management, monitoring, evaluation and
                                                                       Team (UNCT) in Zimbabwe endorsed the recom-          reporting on common operations.
                                                                       mendation by the Operations Management Team
                                                                       (OMT) in July 2014 to adopt a Strategic Operations   Inter-agency activities to be implemented in
                                                                       Framework (SOF) aligned to the new Zimbabwe          these areas will strive to improve cost effec-
                                                                       United Nations Development Assistance                tiveness, quality, and timeliness of the UNCT’s
                                                                       Framework (ZUNDAF) 2016 – 2020 whose prepa-          support to program delivery and business oper-
                                                                       ration was in turn informed by national priorities   ations. Implementation of the SOF is expected
                                                                       as contained in the Government’s Zimbabwe            to result in net benefits of over $7.5 million from
                                                                       Agenda      for    Sustainable     Socio-Economic    efficiency gains in material & service procure-
                                                                       Transformation (ZIMASSET). The SOF is a lighter      ment and in labour costs as well as direct savings
                                                                       version of the Business Operations Strategy (BOS)    in expenses of over $400,000 through harmoni-
                                                                       approach which has been adopted by the United        zation and simplification of operations activities.
                                                                       Nations Development Group (UNDG) in response         The UNCT common services unit (CSU) together
                                                                       to the request by the UNGA. The ZUNDAF 2016–         with procurement, human resources and ICT
                                                                       2020 document was signed with the Government         units of the UN agencies are also expected to
                                                                       of Zimbabwe in May 2015 for implementation to        have more time to respond to more complex and
                                                                       commence from January 2016.                          technical requests.

                                                                       The SOF is a medium-term and results-based           SOF activities are expected to cost a total of
                                                                       framework, outlining UNCT priorities for 2016–       $3,857,187 over the 5 year period 2016-2020.
                                                                       2020 in the field of inter-agency operations. It     The costs are to be funded mainly from inter-
                                                                       encompasses strategic outcomes and supporting        agency cost-sharing. The SOF only provides indic-
                                                                       outputs for the period which should lead to          ative funding requirements. Funding will be offi-
                                                                       evidence based cost savings and improved busi-       cially requested from the UNCT at the beginning
                                                                       ness practices.                                      of each year through OMT annual work plans
                                                                                                                            (AWP) and budgets.
                                                                       Prepared through various analyses and discus-
                                                                       sions to determine the demand for support to
                                                                       program delivery and in continuing operations,
                                                                       SOF is therefore partially derived from the
                                                                       ZUNDAF. Detailed baseline analysis and needs
                                                                       analysis were carried out and both of them fed
                                                                       into the OMT strategic prioritization retreat
                                                                       (SPR) which was held from 30 June to 2 July
                                                                       2015. Elementary cost benefit analysis (CBA)
                                                                       was carried out on some commodity groups and
                                                                       business practices during the SPR. The results of
                                                                       the various analyses were then used to identify
                                                                       commodity groups and business practices to be
                                                                       prioritized for strategic action during implemen-
                                                                       tation of the SOF.

06
INTRODUCTION
The UNCT in Zimbabwe is comprised of over 20 • Baseline analysis to establish the current
UN organizations. By opting to adopt the SOF, status of commodity groups and business
the UNCT voiced the need for a results-based, practices including the level and value of
quantifiable and strategic framework to guide its transactions in 2014
business operations as well as the necessity to
strengthen linkages between program and oper- • Needs and Requirements analyses to identify
ations activities for better results and cost effec- continuing demand for operational support
tiveness. to program delivery including detailing
related parameters such as quality, timeli-
The OMT which brings together Operations ness and cost-effectiveness, expressed in the
Managers and/or Senior Administrative Officers form of key performance indicators (KPIs)
of the UN system organizations at the country
level is a management tier established by the • Elementary Cost-benefit analyses to identify
UNCT to meet the demand for efficient, func- and quantify costs and benefits for some of
tional and streamlined operational support in the commodity groups and business prac-
areas such as finance, human resources, infor- tices.
mation and communication technology (ICT),
logistics, administration, and procurement to Results-based outcomes, outputs and inter-
program delivery and to adopt harmonized oper- agency activities were identified through these
ational and administrative processes and prac- analyses, and a strategic results framework was
tices in line with global trends. formulated. This results framework will guide the
management of the UNCT’s interagency oper-
The OMT set about developing the SOF following ations and form the basis of OMT annual work
endorsement of the Roadmap by the UNCT. plans (AWPs) until the end of 2020.
SOF aims to: The OMT as the custodian of the SOF will, during
its implementation work to carry out planned
• Facilitate implementation of ZUNDAF 2016 – activities, monitor and evaluate them, and report
2020 which sets UNCT program priorities to on overall progress.
complement the national development goals
• Support effective and cost-efficient delivery
of program activities
• Increase harmonization and coherence
within the UN system, and reduce transac-
tion costs
• Simplify procedures and save costs by devel-
oping better relationships with key partners,
suppliers, and the government;
• Improve planning, implementation, moni-
toring and evaluation of the UN’s inter-
agency business operations through the use
of measurable targets and indicators.
The process of preparing the SOF including its
results framework involved conducting various
analyses between March and June 2015 to gather,
collate and analyze operational data from UN
organizations working in the country. Analyses
carried out were:
07UnitedÊNationsÊ
Zimbabwe
UN I T ED N AT I ON S I N Z I M BA BW E
OPERATIONS ANALYSIS
Operations analysis and prioritization of How can we improve what we have? What more
commodity groups and business practices took do we need to do? How do we do it?
2016 - 2020 ST R ATEG I C O P ER ATI ON S F R A M EWOR K
into account the following principles on coher-
ence, effectiveness and efficiency: Operations analysis comprising baseline anal-
ysis, needs and requirements analysis and cost
• Business operations as a critical enabler benefit analysis (CBA) was conducted between
for effective delivery of UN development March and June 2014 through both quantita-
programs. The SOF provides the UNCT with tive and qualitative means of data collection. To
an outline for strategic and cost-effective confirm the status of collaboration among agen-
support to the implementation of ZUNDAF cies, a questionnaire survey was administered
2016 – 2020 by capitalizing on existing with assistance of a facilitator/resource person
agency operational capacities and consoli- contracted to assist with the OMT SOF strategic
dating the provision of commodity groups prioritization retreat (SPR). The questionnaire
and business practices. was in two parts to establish the current posi-
tion (As Is) and the preferred future position (To
• Use of the Standard Operating Procedures Be) in terms of inter-agency cooperation and
(SOPs) for countries adopting the Delivering the modalities thereof. The results of the survey
as One (DaO) approach. The SOPs are which are summarized in the table below were
designed to ensure that the UN is firmly then used together with those from operations
focused on results, increased accountability analysis to prioritize commodity groups and
and improved outcomes business practice for focus under SOF. A total of
eleven agencies responded to the questionnaire.
• Harmonized business operations and
common services work to reduce parallel Results of the collaboration survey indicated that
structures and processes to ensure more effi- a significant majority of agencies were already
cient and effective delivery and reduce the collaborating or will prefer future collaboration
infrastructure costs of deploying programs. in 24 of the 26 major commodity groups and
business practices included in the survey. The
• Prioritizing operational outputs and activ- remaining two major commodity groups and
ities based on impact and complexity, and business practices offer very limited scope for
focusing on high impact/low complexity inter-agency collaboration outside of common
interventions. SOF seeks to focus on major premises.
expenditures, high value, high number of
transactions and easily doable and scalable The collaboration survey indicated opportunities
responses. for cooperation in procurement and potential for
higher efficiency gains. This includes inter alia,
• Finding new opportunities beyond opera- maximizing the use of joint long-term agree-
tional procedures and discovering new ways ments (LTAs) negotiated on the basis of joint UN
of working together effectively for achieving volumes for specific procurement categories,
own and shared organizational goals. and ensuring that common procurement at the
country level is led by an agency with the capacity
Both operations analysis and prioritization and technical mandate for the concerned supplies
sought to provide answers to the following basic and services.
questions: What do we have? How is it working?
08The four modes of collaboration provided on the and intend to continue using the shared LTA under
questionnaire were: (i) piggybacking through a lead agency modality for the procurement of 11
an LTA, (ii) a shared LTA under a lead agency, major commodity groups and business practices.
(iii) using the procurement services of another Responses on the other modalities were insignif-
UN agency, and (iv) procuring from another icant.
UN agency. Agencies indicated that they use or
used and intend to continue using the piggy- The collaboration survey also served to high-
backing modality for the procurement of 13 light the major commonly procured commodity
major commodity groups and business practices. groups and business practices.
Agencies further indicated that they use or used
09UnitedÊNationsÊ
Zimbabwe
UN I T ED N AT I ON S I N Z I M BA BW E
Baseline Analysis
This was essentially a stock take and review of consolidated for a total of 47 commodity groups
commodity groups and business practices that and business practices. The data so collected was
are in place, their number of transactions and validated through individual agency templates
level of expenditures for 2014, the status of sent from the UN Resident Coordinator’s Office
procurement collaboration among UN agencies, (UNRCO) where the validated data was collated
a mapping of business processes and related and reconsolidated. The consolidated validated
costs, and an initial opinion of their quality and baseline data was then analyzed to determine
necessity. It also involved some description of inter alia the major commodity groups and
the key performance indicators (KPIs) being used business practices by both number and value of
2016 - 2020 ST R ATEG I C O P ER ATI ON S F R A M EWOR K
to assess each commodity group or business transactions.
practice.
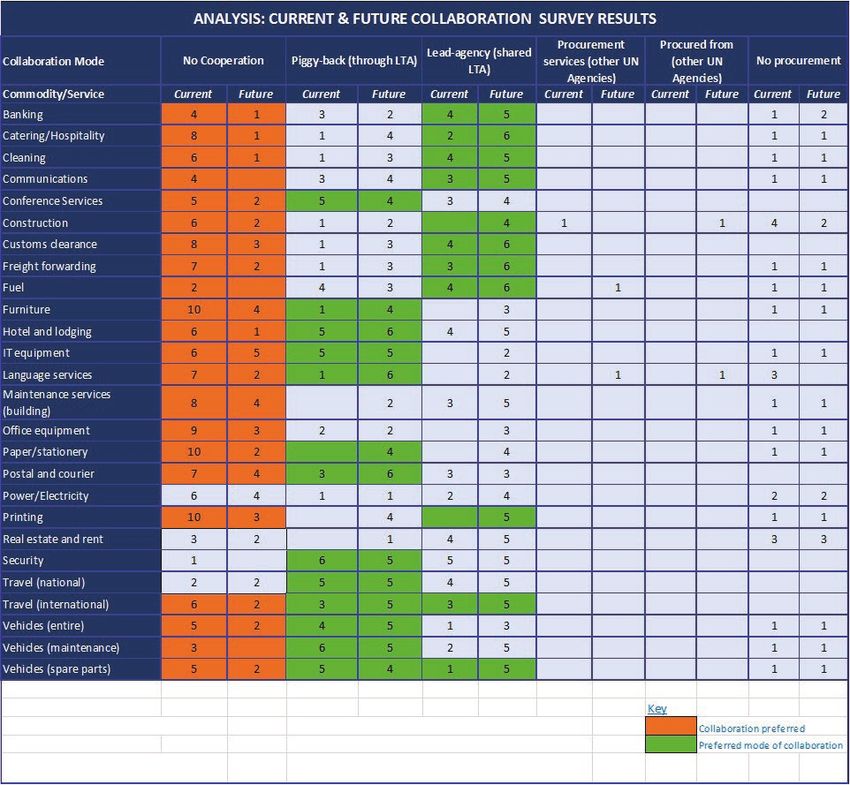
It was observed from analysis of the data that 20
Baseline analysis was considered critical for all out of the total 47 commodity groups and busi-
other steps in the SOF development process. It ness practices accounted for over 90% of both
provides a snapshot of the UNCT’s procurement the value and volume of transactions. This obser-
activities and existing inter-agency services. Data vation together with the results from the collabo-
collected for baseline analysis is particularly ration survey highlighted some of the commodity
useful for the formulation of a results framework groups and business practices for which needs
with quantitative indicators measuring the cost analysis and CBA could be carried for continuing
effectiveness of business operations, as well as operations. They would therefore be among
qualitative indicators for gauging the quality of those on the priority list for the SOF.
support to program delivery.
The chart below highlights the top 20 commodity
Data on all commodity groups and business prac- groups and business practices by total value of
tices was collected from agencies through their transactions in 2014. Figures for the volume of
representatives in the different OMT working transactions are also indicated.
groups (WGs) using the BOS template for base-
line analysis. Data was collected, collated and
10Baseline analysis is vital for the creation of a process and lower workload enabling staff to
results-based framework as its findings also focus their attention on more value-added activ-
serve as “baselines” for quantitative indicators. ities.
By conducting similar analysis before the next
SOF cycle (2021 - 2025), the UNCT would be in a It was established during baseline analysis that 12
position to evaluate progress and come up with LTAs were in place as of December 2014 and that
precise saving figures achieved through SOF 2016 agencies are piggybacking on them. Utilization
- 2020. levels for the LTAs are being quantified. Given
that the creation of inter-agency LTA arrange-
Experience from countries adopting DaO shows ments might be time consuming, it is proposed
that cooperation in procurement increase value that joint LTAs for SOF should be for a minimum
for money through improved planning, coordina- duration of 2 years provided that no supply chain
tion, requirements gathering, bulk discounts and issues affecting participating agencies arise.
better negotiation power. It also reduce parallel
Needs and Requirements Analysis
Needs and requirements analyses were carried continuing need, and defined the key perfor-
out to provide information regarding the demand mance indicators (KPI) for each of the commodity
for operational support to program delivery and groups and business practices. This information
for ongoing operations. The analysis was done fed into the prioritization and CBA stages of SOF
through OMT WGs. In addition to desk reviews, development as well as into the Results Matrix.
discussions were held with representatives of
the Program Management Team (PMT) and in No specific requirements for incremental and/or
few cases with individual agencies. The idea was new operational support to programs was identi-
to bring out those activities with potential to fied. The assumption was therefore that the size
contribute towards improvement in quality, time- of the annual program for the new ZUNDAF 2016
liness and cost effectiveness of operations. – 2020 does not differ significantly from that for
the current ZUNDAF 2012 – 2015. The level of
Needs analysis was carried out on a total of 24 operations support to programs is therefore not
commodity groups and business practices. The expected to change.
analysis provided the background, identified the
Prioritization and Cost Benefit Analysis
Prioritization stage involved coming up with a broader list of
commodity groups and business practices that
Based on the results of the collaboration survey should be focused on in the SOF Results Matrix
and both baseline and needs analysis, the while the second stage involved trimming down
OMT during its SOF SPR prioritized commodity the list to identify commodity groups and busi-
groups and business practices for focusing on ness practices for which CBA could be done. The
in the SOF and for which CBA could be carried resulting lists are given in the table below.
out. The process was done in 2 stages. The first
11UnitedÊNationsÊ
Zimbabwe
UN I T ED N AT I ON S I N Z I M BA BW E
Commodity Group/Business Practice Carry Out CBA (Yes/No)
Stage 1 Stage 2
Banking No No
Security (Guard Services) Yes Yes
Travel Services Yes No
Fuel Supply Yes No
Real Estate and Rent (Management of Lease) Yes Yes
Hotels and Conferencing No No
Medical Services No No
Vehicle Maintenance Yes No
Cleaning (General) Yes Yes
2016 - 2020 ST R ATEG I C O P ER ATI ON S F R A M EWOR K
Customs and Courier Services Yes No
CCTV & Access Control Yes No
Communication (Cellular Voice & Data) Yes Yes
Generator &UPS Maintenance Yes No
Communication (Office &Residential ISP) Yes Yes
Communication (Satellite Phone Services) No No
Printing (Printer rationalization) Yes No
Communication (Fixed Line Telephones) Yes No
Shared Employment/Recruitment Resources Yes Yes
Shared Learning Resources Yes Yes
Staff Wellness Activities No No
Staff Welcome Pack No No
Consultancy Services (Macro-assessment) Yes No
Consultancy Services (Micro-assessments) Yes Yes
Cash Transfers to IPs No No
Training of IPs Yes Yes
Joint Assurance Visits to IPs Yes Yes
Audit Services (NIM/NEX) - Yes
DSA Rates for IPs Yes No
Twenty seven (27) commodity groups and busi- CBA. BPM and ABC which maps and costs core
ness practices were listed for focusing in SOF. CBA processes to determine labor costs and identify
would be carried out on 11 of these. The list was duplications, redundancies, non-value added
subjected to review and refinement following activities and efficiency gaps were undertaken
further analysis. for selected agencies. The intention was to deter-
mine the cost savings or avoided costs should
a common and/or single process be adopted
Cost Benefit Analysis (CBA) by agencies. The analysis showed a basic
comparison of transaction costs for procuring a
It was observed a priori that considerable chal- commodity item or business practice using an
lenges still remain within the UN system for LTA against an agency doing it alone, and the
providing programs with high quality, more effec- corresponding savings and reduction in transac-
tive and cost efficient support services. More tion costs resulting from collaborating with other
often than not, no substantive assessment of the agencies.
costs and benefits of proposed business solutions
are undertaken. The Cost Benefit Analysis (CBA) The final list of commodity groups and business
is a methodology that specifically addresses this practices for focusing in the SOF comprise the 17
deficiency. UNCTs increasingly seek to control for which output statements and other parame-
costs that do not contribute directly to results ters are provided in the SOF Results Matrix.
and improve productivity. CBA should therefore
be carried out to ascertain the soundness and net Generally, CBA was at an elementary level given
value of any proposed effort to harmonize some that SOF is a lighter version of BOS. The results of
business practices. CBA are summarized in the table below.
The BOS methodology, tools and templates
including business process mapping (BPM), and
activity based costing (ABC) were used in the
12COST BENEFIT ANALYSIS TABLE
Monetary Monetary Labour Labour Other Other Prioritization
Costs ($) Benefits Cost ($) Benefits ($) Costs ($) Benefits ($)
A B C D E F G H I
Proposed Busi- Anticipated Anticipated Anticipated Anticipated Anticipated Anticipated Total Cost Total benefit Priority Ra-
ness Solution Monetary Monetary Labor Cost- Labor Ben- Significant Significant (A+C) (B+D) tio: Benefit/
(incl. Common Cost (One Benefit (One Time Invest- efit: Time Other Cost Other Cost Ratio
Services) Time & Time & ment (One reduction Benefits (H/G)
Recurring $ Recurring Time & (One Time
Investment Benefits) Recurring & Recur-
Labour costs) ring Labor
benefits)
Securi-
ty (Guard 3,000 4,639,351 70,334 68,753 73,334 4,708,105 64%
Services)
Real Estate 84%
& Rent 1,500 2,013,284 22,679 21,239 24,179 2,034,523
Cleaning 94,891 3%
(general) 3,000 60,000 34,891 34,891 37,891
Consultan-
cy (Micro 49,000 98,000 1,000 2,000 - - 50,000 100,000 2
assessment)
Training 2
(HACT IPs) 25,000 50,000 1,000 2,000 - - 26,000 52,000
Audit Services 2
(NIM/NEX) 315,000 630,000 1,000 2,000 - 316,000 632,000
Joint Assur-
ance Visits 22,500 45,000 1,500 3,000 14,476 28,952 24,000 48,000 2
(HACT)
Shared
Employment/
Recruitment
Resources 24,000 36,000 202,530 162,930 226,530 198,930 0.01
Shared Learn-
ing Resources 8,000 58,000 3,000 2,750 11,000 60,750 0.06
Communica- 79,200.00 2,247.00 2,247 79,200 0.35
tion (Cellu-
lar Voice and
Data)
Maintenance 84,860 2,247 12,733 2,247 97,593 0.43
(Generator and
UPS)
Communica- 127,500 1,498 13,482 1,498 140,982 0.94
tion (Office and
Residential ISP)
13UnitedÊNationsÊ
Zimbabwe
UN I T ED N AT I ON S I N Z I M BA BW E
RESULTS FRAMEWORK
Based on findings from operations analysis, statements to be achieved through inter-agency
SOF 2016-2020 provides a results-based frame- activities. It also provides indicators and targets
work for the harmonization and simplification for each output to facilitate results-based moni-
of the UNCT’s operations activities. The over- toring. Key activities, lead and participating agen-
arching objective of SOF is that by the end of cies are also proposed for the achievement of
2020, the UNCT has simplified and harmonized outcomes.
2016 - 2020 ST R ATEG I C O P ER ATI ON S F R A M EWOR K
its business operations for enhanced support
to program delivery, and achieved savings in The summary narratives below describe for each
material and labour costs. The detailed Results outcome area the context of the issue for which
Matrix is given from page 18 onwards. To facili- harmonization is to address, the intent of the
tate the achievement of this overarching objec- outcome, and how the outcome results in solu-
tive, the SOF Results Framework is divided into tions to address the issues.
five (5) Outcome Areas, each with a set of output
Common Services and Premises
This outcome area offers the most opportunities Output 1.4: UN Agencies are housed in quality,
for cost savings and efficiency gains. Total cost well managed and cost-effective premises by
savings of about $233,400 can be realized over 2020. Total savings on rental costs should total
the SOF period. 2.5% of baseline levels or $36,233 to be real-
ised mainly in 2016 and 2017. The occupancy
Outcome 1: A Cost Effective Common Services rate at the UN Arundel common premises being
and Premises Management System Providing managed by UNDP is expected to rise from 85%
Quality Services by 2020 in 2016 to 100% by 2020. The percentage of staff
indicating a positive rating of common premises
This outcome will be supported by seven outputs should rise from 80% in 2016 to 100% by 2020.
as follows:
Output 1.5: Staff and premises are adequately
Output 1.1: Staff in all agencies work under protected at all times. The number of reported
clean and environmentally friendly conditions criminal security incidents at UN premises and
at all times. Cleaning costs will be reduced by international staff residences is expected to fall
2.5% or $9,048 from the baseline level while the by 10% between 2016 and 2020 and to be nil
percentage of agencies and staff members indi- thereafter. The cost of security guard services is
cating a positive rating of cleaning services will also expected to fall by a total of 2.5% or $79,046
rise from 70% in 2014 to 100% by 2020. from baseline levels by 2019.
Output 1.2: Staff in all agencies and their depend- Output 1.6: By 2020 agencies use electricity and
ants have ready access to quality, comprehensive water cost effectively. The cost of electricity and
and cost effective health services. By 2020 health water is expected to be reduced by a total of 5%
costs should have reduced by 2% or $18,967 or $9,074 on the 2014 baseline level by 2020.
from the 2014 baseline level. The percentage of Agencies should also take gradual but concrete
staff indicating a positive rating of health services steps to reduce dependence on the Zimbabwe
should rise from 75% in 2016 to 100% in 2020. Electricity Supply Authority (ZESA) for elec-
tricity and on urban councils for water supplies
Output 1.3: Agencies and staff have access to including through the implementation of the UN
quality and cost effective hotel and conferencing office greening initiative.
facilities. It is expected that savings on hotel and
conferencing facilities should total 5% of base- Output 1.7: All agency vehicles serviced regularly
line levels by 2020 which translates to a total of and properly repaired to provide reliable and safe
$61,549. transport. It is expected that savings on vehicle
14maintenance costs will total 5% of baseline levels In addition to the above, the Common
or $19,486 over the SOF period. Services and Premises (CSP) working group
(WG) will lead inter-agency collaboration
Key actions to ensure delivery of outputs include efforts in other commodity groups and busi-
the drafting of Memoranda of Understanding ness practices including auction services,
(MoU) for signature by all agencies participating warehousing, transport and car-pooling,
in common services and the posting of infor- car hire services mainly through the LTA
mation on Long Term Agreements (LTAs) modality. Furthermore, CSP WG will work
on the OMT Teamworks platform for agency with HACT WG to explore possibilities for
staff awareness. changing from the current value added tax
(VAT) system based on re-imbursement to
one based on upfront exemption.
Finance and Harmonized Cash Transfers
The Harmonized Approach to Cash Transfers IPs are trained in HACT; and that transaction and
(HACT) represents one important step in imple- labour costs will fall by 66% of baseline levels
menting the Rome Declaration on harmonization from 2017. Cost savings mainly from cost sharing
and the Paris Declaration on aid effectiveness macro and micro-assessments and the training of
which together call for closer alignment of devel- IPs will total $74,195.
opment aid with national priorities and needs.
The approach allows efforts to focus more on Key actions to achieve the desired outcome
strengthening national capacities for manage- include carrying out HACT macro and micro-as-
ment and accountability. sessments for the 2016 to 2020 programming
cycle; developing and using a database of
Outcome 2: Agencies Implement Cost Effective common IPs; establishing monitoring systems
Interventions to Reduce Delays in Cash Transfers for funds transfer and reporting; training IPs in
and Reporting HACT; and the development and adoption of a
joint assurance plan.
The outcome is supported by one multifaceted
output: Agencies apply harmonized processes Both the macro-assessment costing an esti-
for cash transfers, reporting, auditing and quality mated $8,000 and micro-assessments costing
assurance. It is expected through this output that an estimated $180,000 will be carried out at the
more agencies especially the specialized agen- beginning of the 2016 – 2020 programming cycle.
cies will adopt the HACT approach; that agencies Training of IPs will be done annually at an esti-
will carry out joint assurance visits and audits of mated cost of $7,000 per year.
common implementing partners (IPs) ; that more
Human Resources Management
Focus will be on collaboration in areas of staff Outcome 3: Human Resources Management
recruitment such as common vacancy advertise- processes are harmonized, efficient and respon-
ments, use of harmonized job descriptions, ability sive to program and staff needs
to use shortlisting results and recommended
candidates of other agencies to identify candi- The outcome on human resources management
dates and avoid duplication of human resource is supported by 2 outputs thus:
efforts, common outsourcing for reference
checks, use of common rosters and database for Output 3.1: Agencies have access to web based
the recruitment of consultants and national staff, data for staff recruitment and consultants. It is
including remuneration and entitlements. expected that agencies will adopt and imple-
ment joint recruitment, develop and operation-
alize databases for both common recruitment
and consultants. A total of 4% cost savings from
15UnitedÊNationsÊ
Zimbabwe
UN I T ED N AT I ON S I N Z I M BA BW E
common job advertisements is expected by for both common recruitment and consultants,
2020. Baseline figures for this output are being identifying learning opportunities among agen-
established in order to be able to compute the cies, and developing a harmonized training plan
level of savings. on common areas and an induction package.
Output 3.2: Agencies implementing harmonized In addition to the above key actions, the HRM
induction program and harmonized training on WG working in collaboration with the UN Cares
common areas. This output is to be achieved country team will continue providing support
through a total 3% or $3,710 reduction in training towards annual Harmonized UN Wellness Day
costs on baseline levels over the SOF period; events which are estimated to cost $19,500 per
improving the implementation rate of the harmo- year. HRM WG working in collaboration with the
nized training plan from 70% in 2017 to 100% by UN Office of Human Resources Management at
2016 - 2020 ST R ATEG I C O P ER ATI ON S F R A M EWOR K
2020; achieving a ‘good’ rating on training from UN Headquarters will also provide support in
75% in 2017 to 95% by 2020; and increasing the conducting UN local salary surveys when neces-
number of new staff in agencies who are provided sary. The cost of UN local salary survey activities
with induction training. will not be in monetary terms but in the form
of staff time of participating Local Salary Survey
Key actions for achievement of this outcome Committee members from the HRM WG.
include adopting and implementing joint recruit-
ment, developing and operationalizing databases
Information and Communications Technology
DaO in ICT involves inter-agency cooperation to Output 4.2: Cost effective and reliable internet
optimize and leverage existing ICT investment, connectivity for all agencies. A common back-up
sharing ICT capabilities, and joining where it link is to be implemented while bandwidth is
makes sense and not total consolidation or maintained at a minimum of 48 Mbps throughout
unnecessarily replacing existing ICT infrastruc- the SOF period. Total savings of 2% or $12,212 of
ture and services. baseline levels are expected on connectivity costs
by 2020.
Focus will be on achieving cost savings through
common collective discounts, addressing core Key actions to underpin the achievement of
business needs by developing common collab- this outcome include carrying out a review of
oration tools and knowledge sharing systems common ICT services and support, monitoring
aligned with organization-wide agency strategies, cost savings from common ICT infrastructure and
providing guidance on ICT investments including services, and establishing a common internet
CBAs and mechanisms to address country-level back-up link.
common ICT service needs, opportunities for
synergies, harmonization, and consolidation. As In addition to the above key actions, the ICT
an enabler for programmatic and business solu- WG will pursue other avenues of potential cost
tions, ICT solutions are expected to meet tech- savings such as a shared generator service LTA for
nical and business needs. all UN generators (office and residential), an LTA
for a shared printing and photocopying services,
Outcome 4: Cost Effective ICT Solutions in place and continuing with the Voice over Internet
to Support Operations and Program Delivery Protocol (VoIP) initiative which has already seen
staff at select office locations being able to call
This outcome is supported by two outputs as each other for free. The ICT WG will also lead
follows: in the implementation of the radio migration
project from analogue to digital at an estimated
Output 4.1: Voice & data services are shared total cost of $195,000.
across agencies. Availability of voice and data is
to be maintained at 99.9% while a total of 2%
or $7,044 cost savings from tariff reductions are
expected over the SOF period.
16Common Procurement
This outcome area also offers significant opportu- Output 5.3: Agencies get good, cost effective
nities for cost savings. Total cost savings of about print quality and quantity from vendors. Two
$96,635 can be realized over the SOF period. common LTAs for printing services are expected
to be signed. A 1% total cost savings on baseline
Outcome 5: Overall reduction in Procurement levels or $6,491 is expected to be achieved by
Costs 2020.
Procurement costs are a significant component Output 5.4: Agencies get good, quality promo-
of total operations costs. Achievement of this tional materials for joint programs and other
outcome is therefore critical for the achievement joint activities. Two common LTAs for promo-
of the overall goals of the SOF. The outcome on tional materials are expected to be signed. A 1%
common procurement is to be achieved through or $6,199 total cost savings on baseline levels is
the following five outputs. expected to be achieved by 2020.
Output 5.1: Agencies have access to reliable Output 5.5: Reduced air travel costs by 2020. It is
and cost effective fuel supplies at all times coun- expected that tickets will consistently be issued
trywide. It is envisaged that fuel will be readily within 12 hours throughout the SOF period. It is
available at all times from fuel outlets of the further expected that a cumulative 3% reduction
contracted supplier(s) throughout the country for in air travel costs translating to $70,246 can be
the duration of SOF. It is further expected that a achieved by 2020.
total of 1% or $13,699 cost savings on the base-
line amount will be achieved through to 2020. Key actions for successful achievement of this
outcome include the establishment of a separate
Output 5.2: Cost effective, quality, reliable and OMT Procurement Working Group, developing a
up-to-date technology IT Equipment is procured. common suppliers’ database and ensuring that
Existing practices whereby agency HQs are suppliers are informed and subscribe to the
directly involved in procurement of IT equipment UN Code of Ethical Conduct , and developing
for their country offices and allowing other agen- a t e m p l a t e f o r common LTAs based o n
cies to piggyback on their LTAs are expected to UNDG G u i d e l i n e s f o r common country
be maintained and further enhanced. There are procurement procedures for adoption by the
limited opportunities for additional cost savings UNCT.
from this output.
17UnitedÊNationsÊ
Zimbabwe
UN I T ED N AT I ON S I N Z I M BA BW E
RESOURCES AND BUDGETS
Based on the outputs and key activities defined table below. The figures represent the financial
for each SOF Outcome Area, five-year funding resources that are considered necessary for the
estimates were computed and summarized in the successful implementation of SOF 2016-2020.
Outcome Area Total Cost Committed Funds Funding Gap
2016 - 2020 ST R ATEG I C O P ER ATI ON S F R A M EWOR K
($’000) ($’000) 2015
2016-2020 ($’000)
Common Services and Premises $3,268,028 $0 $3,268,028
Finance and Cash Transfers $223,000 $188,000 $ 35,000
Human Resources Management $ 97,500 $0 $ 97,500
Information and Communications Technology $193,659 $0 $193,659
Common Procurement tbd tbe tbe
Estimated Total $3,782,187 $188,000 $3,594,187
SOF activities are expected to cost a total of Human Resources Management – harmonized
$3,782,187 over the 5 year period 2016-2020 UN Wellness Days ($97,500); and Information
broken down by outcome area as indicated and Communications Technology – radio digital-
in the table above. Key contributors to the ization project ($193,659). The costs are to be
cost for each outcome areas are as follows: funded mainly from inter-agency cost-sharing.
Common Services and Premises – health services The framework only provides indicative funding
($1,821,143), security services ($1,151,885), requirements. Funding will be officially requested
and office greening ($295,000); Finance and from the UNCT at the beginning of each year
Cash transfers – HACT macro and micro-assess- through OMT annual work plans (AWP) and
ments ($188,000), and training of IPs ($35,000); budgets.
18GOVERNANCE, MONITORING
AND EVALUATION
Governance Arrangements
Cooperation, coordination and support of both
the UN Country Team (UNCT) and the Operations
Management Team (OMT) are essential to the
successful implementation of SOF. A collabo-
rative and participatory approach creates an
enabling environment in which all UN agencies
in Zimbabwe are equal partners. Operational
collaboration implemented in the interest of the
UN system should transcend individual agency
considerations. To ensure that operational effi-
ciency and effectiveness gains are made under
SOF, the first key step is to ensure that a knowl-
edgeable, responsible and involved governance
structure is in place.
United Nations Country Team (UNCT)
The UNCT which brings together all representa-
tives of UN organisations working in Zimbabwe towards the simplification and harmonisation
is the ultimate decision making body for all of business practices. It provides operational
issues related to common/inter-agency opera- support and advice to the UNCT on harmoniza-
tions. Under the leadership of the UN Resident tion of business practices and common services
Coordinator, the UNCT works to ensure the adop- with the objective of enhancing the delivery of
tion, implementation, and monitoring & eval- development assistance and reducing transac-
uation of SOF. To this end the UNCT will review tion costs for both the UN and its partners. It is
and endorse the OMT annual work plans (AWPs) responsible for the design and management of
and periodic reviews thereof, mobilise resources all issues related to common services, common
required for SOF implementation, and approve premises and other operational issues, including
budgets as recommended by the OMT. harmonized approach to cash transfer (HACT).
To further strengthen UNCT support to the OMT, OMT Terms of Reference (ToRs) endorsed by the
the UNCT agreed to nominate one agency repre- UNCT are in place and provide inter alia for rota-
sentative to act as OMT Champion on an annual tion of the Chair among member agencies on an
rotation basis as well as formalizing the inclusion annual basis. ToRs are also in place for the five
of participation in OMT and OMT WG activities in OMT WGs. The OMT is composed of the most
staff performance appraisals. senior operation officials from each resident UN
entity. Agencies may nominate non OMT member
technical staff to membership of OMT WGs.
Operations Management Team (OMT)
Operating under delegated authority from the
UNCT, the OMT leads efforts at the country level
19UnitedÊNationsÊ
Zimbabwe
UN I T ED N AT I ON S I N Z I M BA BW E
The OMT governance structure is set out diagrammatically below.
2016 - 2020 ST R ATEG I C O P ER ATI ON S F R A M EWOR K
The OMT will work through five (5) technical implementation. Chairing of WGs will be rotated
working groups (WGs) on Common Services & annually among participating agencies.
Premises (CSP); Common Procurement (CP);
Finance and Harmonized Cash Transfers (HACT);
Human Resources Management (HRM); and Operations and Programs Integration
Information and Communication Technology
(ICT). Given its technical nature and high levels To strengthen operations and programs integra-
of procurement activities, a separate WG tion, co-chairs of the Program Management Team
on common procurement is recommended. (PMT) are invited to OMT monthly meetings and
Operational aspects of security related activities conversely for OMT co-chairs. The UNCT also
which were being handled through a separate endorsed OMT recommendations to strengthen
Joint Security Management (JSM) WG will be PMT technical representation in the OMT HACT
handled through the CSP WG for purposes of SOF WG.
Monitoring and Evaluation Framework
In general, the monitoring and evaluation frame- The OMT is responsible for monitoring, evalua-
work should enable the UNCT to plan, monitor, tion and reporting on the progress of implemen-
report, and evaluate the progress of business tation of the SOF and the work outlined in the
operations harmonization and demonstrate the Results Framework and OMT Annual Work Plans
quantitative and qualitative value of business (AWPs).
operations harmonization for the delivery of
development results. Mechanisms governing Indicators and targets for each outcome area
‘who’ does ‘what’, ‘when’ and ‘how’ in perfor- and its supporting outputs as given in the Results
mance monitoring are as important as the Matrix provides the basis for monitoring progress
expected results and key performance indicators of implementation. The actual value of the indi-
(KPIs). Successful monitoring and measurement cator for a particular period is compared to the
of SOF implementation depends on a clear and target per the Results Matrix.
efficient division of tasks with roles and responsi-
bilities clearly defined and agreed to. The proposed monitoring and evaluation (M & E)
framework for SOF is as follows:
20Working Groups (WG) meet monthly to review SOF will be reviewed annually around November
progress on outcomes and report to the monthly by the OMT with provision for input from the
OMT meeting. The Program Management Team PMT. The review is then presented for UNCT
(PMT) may nominate a representative to any endorsement.
OMT WG of interest.
Results of the SOF annual reviews will be
The OMT meets monthly to receive progress included in the RC-UNCT Annual Reports to the
reports from WGs and to consolidate them for United Nations Development Coordination Office
report to the UNCT. PMT co-chairs are invited (UNDOCO)
to all monthly OMT meetings and conversely for
OMT co-chairs. Annual Work Plans (AWP) with clearly defined
targets and budget allocations will be developed
‘OMT Update’ is a standing UNCT agenda item following the annual SOF review
every quarter. The OMT Chair who is invited
to UNCT monthly meetings and major events An end of cycle evaluation of SOF will be
including annual retreats presents the updates. conducted by an independent party and the
recommendations therefrom will feed into the
The Head of Agency (HoA) from where the development of the next SOF. The evaluation will
OMT Chair comes is automatically the ‘OMT take place around the same time as the ZUNDAF
Champion’ within the UNCT. Evaluation.
2122
2016 - 2020 ST R ATEG I C O P ER ATI ON S F R A M EWOR K UN I T ED N AT I ON S I N Z I M BA BW E
UnitedÊNationsÊ
Zimbabwe
SOF RESULTS MATRIX
SOF Outcome Area 1: Common Services and Premises
Lead Agency UNDP
Participating UN Agencies FAO, ILO, IOM, UNWOMEN, UNAIDS, UNDP, UNFPA, UNHCR, UNICEF, WHO, UNESCO, UNIDO, UNIC, ITU, WFP, UNDSS, ACBF, UNODC
Coordination Mechanisms OMT Common Services and Premises Working Group
Outcome Budget $3,268,028 (sum of the output budgets)
Outcome Budget Gap $3,268,028 (Budget Gap= Required Resources minus Available Resources for this outcome)
Outcome 1 A Cost Effective Common Services and Premises Management System Providing Quality Services by 2020
Baseline Target Target Target Target
Outcome Indicators
2014 2016 2017 Target 2018 2019 2020 Source of Data/Risk and Assumptions
Weighted % change in Com- Risks:
$7,983,451 2.9% 2.9% 2.9% 2.9% 2.9%
mon Services Costs
o Lack of agency commitment and staff cooperation in harmonizing com-
mon services
o Disagreements on specifications, joint solicitations and evaluations.
Percentage of Agencies and Assumption:
staff indicating positive rating of na 80 85 90 95 100
Common Services o Agencies will allocate staff time and resources to support harmonization
of common services.
o Agencies will sign MOUs committing themselves to full participation
in common services harmonization over the 5 year ZUNDAF period.
Key Actions Lead End date
agency
Draft MOUs for signature by all agencies participating in common UNDP December 2015
services (CSU)
Post information on LTAs on the OMT Teamworks platform for CSU From July 2015 and whenever available
agency staff awareness
Output 1.1
Cleaning (general) Staff in all agencies work under clean and environmentally friendly conditions at all times
Baseline Target Target Target Target
Output Indicators
2014 2016 2017 Target 2018 2019 2020 Source of Data/Risk and Assumptions
% cost savings on cleaning Data Sources:
$361,925 2.5% 2.5% 2.5% 2.5% 2.5%
services
o CSU Reports
% of staff indicating positive
70% 75% 80% 85% 95% 100%
rating of cleaning services o Satisfaction Survey ResultsOutput 1.2 Staff in all agencies and their dependants have ready access to quality, comprehensive and cost effective health services
Health Services
Baseline Target Target Target Target
Output Indicators
2014 2016 2017 Target 2018 2019 2020 Source of Data/Risk and Assumptions
Data Sources:
% reduction in health costs $948,368 2% 2% 2% 2% 2%
UN Clinic Reports
Satisfaction survey results
Risks:
% staff indicating positive rating Staff turnover and increase in medical costs.
na 75% 80% 90% 95% 100%
of health services
Assumptions:
The UN Clinic will continue operating at a minimum of current levels and
standards
Output 1.3
Agencies and staff have access to quality and cost effective hotel and conferencing facilities
Hotels and Conferencing
Services
Baseline Target Target Target Target
Output Indicators
2014 2016 2017 Target 2018 2019 2020 Source of Data/Risk and Assumptions
Data Sources:
ICSC hotel rates
% savings in hotel & conferenc- CSU Reports
$1,230,970 5% 5% 5% 5% 5%
ing costs
Risk:
Improvement in general business climate leading to increased demand and
costs of hotel & conferencing services
2324
2016 - 2020 ST R ATEG I C O P ER ATI ON S F R A M EWOR K UN I T ED N AT I ON S I N Z I M BA BW E
UnitedÊNationsÊ
Zimbabwe
Output 1.4
Real Estate and Rent UN Agencies are housed in quality, well managed and cost-effective premises by 2020
Baseline Target Target Target Target
Output Indicators
2014 2016 2017 Target 2018 2019 2020 Source of Data/Risk and Assumptions
Data Sources:
% savings on rental costs $1,449,320 2.5% 2.5% 0 0 0
o CSU Reports
% occupancy rate at Arundel o Results of satisfaction surveys
na 85% 95% 100% 100% 100%
common premises
Risks:
Agencies not willing to be accommodated within common premises
Assumptions:
% of staff that indicating posi-
tive rating of Common Premises Common service budget is adequately funded.
na 80% 90% 100% 100% 100%
Common Service Survey
Risk:
Assumption:
Output 1.5 Staff and premises are adequately protected at all times
Security Guard Services
Baseline Target Target Target Target
Output Indicators
2014 2016 2017 Target 2018 2019 2020 Source of Data/Risk and AssumptionsData Sources:
% change in number of security
na 10% 10% nil nil nil
incidents reported
UNDSS reports
Risks:
o Staff may be subject to road traffic accidents (RTAs) and political inci-
dents which are beyond the control of UNDSS
o The country’s security phase is downgraded
% reduction in cost of security Assumptions:
$3,161,844 0% 2.5% 2.5% 2.5% 0%
guard services
o Security guard services are only provided to residences of international
staff
o RTAs and political incidents as well as incidences at residences of na-
tional staff are not included in the numbers
o The country remains within the current security phase
Output 1.6
Utilities Management By 2020 agencies use electricity and water cost effectively
Baseline Target Target Target Target
Output Indicators
2014 2016 2017 Target 2018 2019 2020 Source of Data/Risk and Assumptions
Data Sources:
% reduction in cost of electricity
$181,487 5% 5% 5% 5% 5% CSU Reports
and water
Risks:
Use of en- Use of en- Use of Use of
Use of en- o Escalating electricity costs
Reduced dependence on ZESA ergy saving ergy saving energy energy
N/A ergy saving
for electricity solutions solutions saving saving
solutions o Constrained budgets for installation of efficient water usage systems
solutions solutions
Boreholes Boreholes Boreholes & Boreholes Boreholes Assumptions:
& water & water water tanks & water & water
Reduced dependence on mu-
N/A tanks at tanks at at agency tanks at tanks at o Increased use of renewable energy and energy saving solutions.
nicipal water
agency agency premises agency agency
premises premises premises premises o Funds are available for installation of efficient water usage systems
2526
2016 - 2020 ST R ATEG I C O P ER ATI ON S F R A M EWOR K UN I T ED N AT I ON S I N Z I M BA BW E
UnitedÊNationsÊ
Zimbabwe
Output 1.7 All agency vehicles serviced regularly and properly repaired to provide reliable and safe transport
Vehicle Maintenance
Baseline Target Target Target Target
Output Indicators
2014 2016 2017 Target 2018 2019 2020 Source of Data/Risk and Assumptions
Data Sources:
CSU Reports
Risks:
o Vehicles are kept in use beyond their useful economic life.
% savings in vehicle mainte-
$649,537 3% 3% 3% 3% 3% o Unavailability of funds to replace fully depreciated vehicles
nance costs
Assumptions:
o Vehicles are sent for regular servicing
o Agencies enter into a joint LTA for vehicle maintenance
o Vehicles are replaced upon full depreciation
SOF Outcome Area 2: Harmonized Approach to Cash Transfers (HACT)
Lead Agency UNDP, UNFPA, UNICEF
Participating UN Agencies UNDP, UNFPA, UNICEF
Coordination Mechanisms OMT HACT Working Group
Outcome Budget $223,000 (sum of the output budgets)
Outcome Budget Gap $35,000 (Budget Gap= Required Resources minus Available Resources for this outcome)
Outcome 2 Agencies Implement Cost Effective Interventions to Reduce Delays in Cash Transfers and Reporting
Baseline Target Target Target Target
Outcome Indicators
2014 2016 2017 Target 2018 2019 2020 Source of Data/Risk and Assumptions
Number of agencies adopting Data Sources:
3 3 4 5 6 7
HACT approach
Agencies financial reports
Risks:
o Capacity and engagement levels of agencies
% change in transactions and o Financial management capacity and accountability levels of IPs
$112,416 5% 66% 66% 66% 66%
labor costs
Assumptions:
o UNCT advocates for full adoption of HACT
o IPs are trained as part of capacity buildingKey Actions Lead agency End date
UNDP, UNF-
Carry out HACT macro and micro-assessments December 2015
PA, UNICEF
Develop database of common IPs UNICEF December 2015
Establish monitoring system for funds transfer and reporting UNDP June 2015
UNDP, UNF-
Train IPs in HACT December 2016
PA, UNICEF
Develop and adopt a Joint assurance Plan UNICEF June 2016
Output 2.1
Cash transfers Agencies apply harmonized processes for cash transfers, reporting, auditing and quality assurance
Output Indicators Baseline Target Target Target Target
2014 2016 2017 Target 2018 2019 2020 Source of Data/Risk and Assumptions
Number of agencies adopting Data Sources:
3 3 4 5 6 7
HACT approach
Agencies financial reports
% change in transactions and Risks:
$112,416 5% 66% 66% 66% 66%
labor costs
o Capacity and engagement levels of agencies
From From From HACT From From
Number of IP personnel trained HACT HACT training HACT HACT
N/A o Financial management capacity and accountability levels of IPs
in HACT training training reports training training
reports reports reports reports Assumptions:
Based Based on Based on Based Based
Number of joint assurance visits on Joint Joint Assur- Joint Assur- on Joint on Joint o UNCT advocates for full adoption of HACT
N/A
and audits Assurance ance Plan ance Plan Assurance Assurance
Plan Plan Plan IPs are trained as part of capacity building
2728
2016 - 2020 ST R ATEG I C O P ER ATI ON S F R A M EWOR K UN I T ED N AT I ON S I N Z I M BA BW E
UnitedÊNationsÊ
Zimbabwe
SOF Outcome Area 3: Human Resources Management
Lead Agency UNDP
Participating UN Agencies FAO, UNICEF, UNFPA, UNHCR, WHO, UNESCO, WFP, ILO,UN WOMEN, UNDP, UNAIDS
Coordination Mechanisms OMT HRM Working Group
Outcome Budget $97,500 (sum of the output budgets)
Outcome Budget Gap $97,500 (Budget Gap= Required Resources minus Available Resources for this outcome)
Outcome 3 Human Resources Management processes are harmonized, efficient and responsive to program and staff needs
Baseline Target
Outcome Indicators
2014 Target 2016 Target 2017 Target 2018 Target 2019 2020 Source of Data/Risk and Assumptions
Joint Data Sources:
Joint Re- Joint re-
Concept Note recruit-
Joint recruitment adopted and Joint recruitment of cruitment of cruitment of
N/A developed and ment of all o HRM WG Reports
implemented drivers common GS common GS
adopted common
staff and NO staff
staff o Agencies procurement data
Recruitment Recruitment Recruit- Risks:
Common recruit- Recruitment data data available data available ment data
An operational common re-
N/A ment database available to all to all agen- to all agencies available Agencies unable to harmonize due to restrictions at
cruitment database
developed agencies cies to all agen- HQ level
cies
Consultants Consultants Consul- Assumptions:
Common consul- Consultants data data available data available tants data
An operational consultants Adequate political support and financial resources
N/A tants database available to all to all agen- to all agencies available
database
developed agencies cies to all agen- availed to the UNCT
cies
% cost savings from common
N/A 4% 4% 4% 4% 4%
job advertisements
% reduction in training costs $123,660 3% 3% 3% 3% 3%
Key Actions Lead agency End date
Develop Concept Note for Joint Recruitment UNDP June 2016
Develop common Recruitment Database UNDP December 2016
Develop Consultants Database UNICEF December 2016
Identify learning opportunities among agencies UNDP May 2016
Develop harmonized training plan on common areas and an induction package UNDP December 2016You can also read