SpaGE: Spatial Gene Enhancement using scRNA-seq - Oxford ...
←
→
Page content transcription
If your browser does not render page correctly, please read the page content below
Published online 21 September 2020 Nucleic Acids Research, 2020, Vol. 48, No. 18 e107
doi: 10.1093/nar/gkaa740
SpaGE: Spatial Gene Enhancement using scRNA-seq
Tamim Abdelaal 1,2 , Soufiane Mourragui1,3 , Ahmed Mahfouz 1,2,4,†
and
Marcel J.T. Reinders1,2,4,*,†
1
Delft Bioinformatics Lab, Delft University of Technology, Delft 2628XE, The Netherlands, 2 Leiden Computational
Biology Center, Leiden University Medical Center, Leiden 2333ZC, The Netherlands, 3 Computational Cancer Biology,
Division of Molecular Carcinogenesis, Oncode Institute, the Netherlands Cancer Institute, Amsterdam 1066 CX, The
Netherlands and 4 Department of Human Genetics, Leiden University Medical Center, Leiden 2333ZC, The
Netherlands
Downloaded from https://academic.oup.com/nar/article/48/18/e107/5909530 by guest on 20 November 2020
Received May 16, 2020; Revised July 30, 2020; Editorial Decision August 24, 2020; Accepted August 25, 2020
ABSTRACT and Slide-seq) (8,9). Imaging-based protocols have a high
gene detection sensitivity; capturing high proportion of the
Single-cell technologies are emerging fast due to mRNA molecules with relatively small dropout rate. While
their ability to unravel the heterogeneity of biologi- seqFISH+ and the latest generation of MERFISH can mea-
cal systems. While scRNA-seq is a powerful tool that sure up to ∼10 000 genes (7,10), many different imaging-
measures whole-transcriptome expression of single based protocols are often limited in the number of genes
cells, it lacks their spatial localization. Novel spatial that can be measured simultaneously. On the other hand,
transcriptomics methods do retain cells spatial in- sequencing-based protocols like STARmap can scale up to
formation but some methods can only measure tens thousands of genes, it has a relatively lower gene detection
to hundreds of transcripts. To resolve this discrep- sensitivity. Slide-seq is not limited in the number of mea-
ancy, we developed SpaGE, a method that integrates sured genes and can be used to measure the whole tran-
spatial and scRNA-seq datasets to predict whole- scriptome. However, similar to STARmap, Slide-seq suf-
fers from a low gene detection sensitivity. In addition, osm-
transcriptome expressions in their spatial configura-
FISH, MERFISH and STARmap can capture genes at the
tion. Using five dataset-pairs, SpaGE outperformed single-molecule resolution, which can be averaged or aggre-
previously published methods and showed scala- gated to the single-cell level. While Slide-seq has a resolu-
bility to large datasets. Moreover, SpaGE predicted tion of 10m, which is comparable to the average cell size,
new spatial gene patterns that are confirmed inde- but does not always represent a single-cell.
pendently using in situ hybridization data from the Given the complementary information provided by both
Allen Mouse Brain Atlas. scRNA-seq and spatial transcriptomics data, integrating
both types would provide a more complete overview of cell
INTRODUCTION identities and interactions within complex tissues. This in-
tegration can be performed in two different ways (11): (i)
Single cell technologies rapidly developed over the last dissociated single-cells measured with scRNA-seq can be
decade and have become valuable tools for enhancing mapped to their physical locations in the tissue (12–14),
our understanding of biological systems. Single-cell RNA- or (ii) missing gene expression measurements in the spa-
sequencing (scRNA-seq) allows unbiased measurement of tial data can be predicted from scRNA-seq. In this study,
the entire gene expression profile of each individual cell we focus on the second challenge in which measured gene
and has become the de facto technology used to character- expressions of spatial cells can be enhanced by predict-
ize the cellular composition of complex tissues (1,2). How- ing the expression of unmeasured genes based on scRNA-
ever, single cells often have to be dissociated before per- seq data of a matching tissue. Several methods have ad-
forming scRNA-seq and results in losing the spatial context dressed this problem using various data integration ap-
and hence limits our understanding of cell identities and re- proaches to account for the differences between the two data
lationships. Recently, spatial transcriptomics technologies types (15–18). All these methods rely on joint dimensional-
have advanced and provide localizations of gene expressions ity reduction methods to embed both spatial and scRNA-
and cellular structure at the cellular level (3,4). Many cur- seq data into a common latent space. For example, Seurat
rent protocols can be divided in two categories: (i) imaging- uses canonical correlation analysis (CCA), Liger uses non-
based methods (e.g. osmFISH, MERFISH and seqFISH+) negative matrix factorization (NMF), and Harmony uses
(5–7), and (ii) sequencing-based methods (e.g. STARmap
* To whom correspondence should be addressed. Tel: +31 15 2786424; Fax: +31 15 2786424; Email: m.j.t.reinders@tudelft.nl
†
The authors wish it to be known that, in their opinion, the last two authors contributed equally.
C The Author(s) 2020. Published by Oxford University Press on behalf of Nucleic Acids Research.
This is an Open Access article distributed under the terms of the Creative Commons Attribution Non-Commercial License
(http://creativecommons.org/licenses/by-nc/4.0/), which permits non-commercial re-use, distribution, and reproduction in any medium, provided the original work
is properly cited. For commercial re-use, please contact journals.permissions@oup.com
e107 Nucleic Acids Research, 2020, Vol. 48, No. 18                                                                                    PAGE 2 OF 16

principal component analysis (PCA). While Seurat, Liger                 pendent PCs by computing the cosine similarity matrix and
and Harmony rely on linear methods to embed the data,                   decomposing it by SVD (21):
gimVI uses a non-linear deep generative model. Despite re-
cent benchmarking efforts (19), a comprehensive evalua-                                        PCr PCq T = UV T                               (3)
tion of these methods for the task of spatial gene predic-              where U and V represent orthogonal (of size d) transforma-
tion from dissociated cells is currently lacking. For example,          tions on the reference and query PCs, respectively, and  is
Seurat, Liger and gimVI, have only been tested using rela-              a diagonal matrix. U and V are then used to align the PCs,
tively small datasets (60,000 cells, used to illustrate the scalability and com-
putational efficiency of SpaGE compared to other methods.                           Raligned   (n × d  )   = R(n ×         T
                                                                                                                      p) PVr ( p × d  )       (6)
                                                                        and
MATERIALS AND METHODS
                                                                                   Qaligned    (m × d  )   = Q(m ×          T
                                                                                                                       p) PVr ( p × d  )      (7)
SpaGE algorithm
                                                                            After aligning the datasets, SpaGE predicts the expres-
The SpaGE algorithm takes as input two gene expression                  sion of the spatially unmeasured genes, l = g − p, from
matrices corresponding to the scRNA-seq data (reference)                the scRNA-seq dataset. For each spatial cell i ∈ m, we de-
and the spatial transcriptomics data (query). Based on the              fine the k-nearest-neighbors (k = 50) from the n dissociated
set of shared genes between the two datasets, SpaGE en-                 scRNA-seq cells, using the cosine distance. Next, we calcu-
riches the spatial transcriptomics data using the scRNA-seq             late an array of weights wi j between spatial cell i and its
data, by predicting the expression of spatially unmeasured              nearest neighbors j ∈ NN(i ). Out of the 50 neighbors, we
genes. The SpaGE algorithm can be divided in two major                  only keep neighbors with positive cosine similarity with cell
steps: (i) alignment of the two datasets using the domain               i (i.e. cosine distance < 1), such that:
adaptation algorithm PRECISE (20), and (ii) gene expres-
sion prediction using k-nearest-neighbor regression.                                 ∀ j ∈ NN (i ) and di st (i, j ) < 1
   First, PRECISE was used to project both datasets into
a common latent space. Let R(n × g) be the gene expression                                            di st (i, j )
matrix of the reference dataset having n cells and g genes,                               wi j = 1 −                                          (8)
                                                                                                       j di st (i, j )
and let Q(m × h) be the gene expression matrix of the query
dataset having m cells and h genes. Using the set of shared                                                  wi j
genes p = g ∩ h, PRECISE applies independent Principal                                     wi j =                                            (9)
Component Analysis (PCA) for each dataset to define two                                                length wi j − 1
independent sets of Principal Components (PCs), such that:                The predicted expression Yil of the set of spatially unmea-
       R(n× p) =
                   R(n                          PCr PCrT   = Id         sured genes l for cell i is calculated as a weighted average of
                       × d) PCr (d× p)   with                     (1)
                                                                        the nearest neighbors dissociated cells:
and
                                                                                       Yil =                    wi j ∗ Rjl         (10)
      Q(m× p) = Q(m × d) PCq(d× p) with PCq PCqT = Id            (2)
                                                                                                 j ∈ NN (i )
where d is the number of desired PCs, PCr and PCq                                             di st (i, j ) < 1
represents the principal components of the reference
and the query datasets, respectively. We choose d = 50
                                                                        Gene contribution to the integration
for the STARmap AllenVISp, MERFISH Moffit and seq-
FISH AllenVISp dataset pairs, and d = 30 for all the osm-               To evaluate the contribution of each gene in forming this
FISH dataset pairs. Next, PRECISE compares these inde-                  common latent space PVr , we calculated the gene contribu-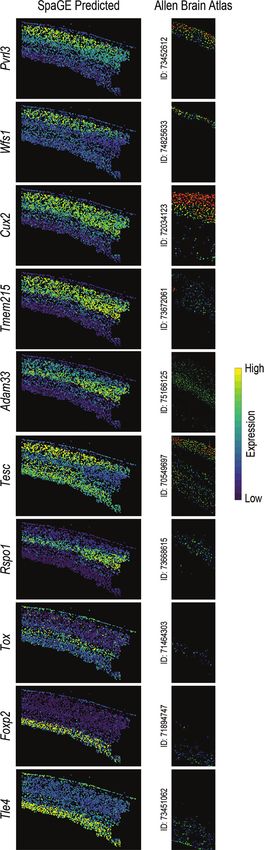
PAGE 3 OF 16                                                              Nucleic Acids Research, 2020, Vol. 48, No. 18 e107

tion Cg of gene g as follows:                                        For spatial transcriptomics datasets all gene were used,
                            d                                   except for the MERFISH dataset for which we removed
                     Cg =              βgi
                                        2
                                                          (11)    the blanks genes and the Fos gene (non-numerical values).
                                i =1                              Additionally, we filtered out cells labeled as ‘Ambiguous’
where βgi is the loading of gene g to the i-th principal vector   from the MERFISH dataset. Similar to the Zeisel dataset,
in PVr , and d is the final number of PVs in PVr . To obtain     we only kept cells from cortical regions for the osmFISH
the top contributing genes, the Cg values are sorted in de-       dataset (‘Layer 2–3 lateral’, ‘Layer 2–3 medial’, ‘Layer 3–
scending order across all genes. We used the same criteria to     4’, ‘Layer 4’, ’Layer 5’, ‘Layer 6’ and ‘Pia Layer 1’). For the
calculate the contribution of each gene for dataset-specific      seqFISH+ dataset, we only used the cells from the ‘Cortex’
PCs or PVs.                                                       region. No cells were filtered from the STARmap dataset.
                                                                  Further, each dataset was normalized by dividing the counts
                                                                  within each cell by the total number of transcripts within
Datasets                                                          that cell, scaling by the median number of transcripts per

                                                                                                                                    Downloaded from https://academic.oup.com/nar/article/48/18/e107/5909530 by guest on 20 November 2020
                                                                  cell, and log1p transformed. Similar to the scRNA-seq data,
We used six dataset pairs (Table 1) composed of four              we scaled the spatial data using the SciPy Python package
scRNA-seq datasets (AllenVISp (22), AllenSSp (23), Zeisel         (25).
(24) and Moffit (4)) and four spatial transcriptomics                It is important to note that in all experiments, the scaled
datasets (STARmap (8), osmFISH (5), MERFISH (4)                   datasets are used as input for the alignment part, while the
and seqFISH+ (7)). The AllenVISp (GSE115746) and the              prediction is applied using the normalized version of the
AllenSSp datasets were downloaded from https://portal.            scRNA-seq dataset (Equation 10).
brain-map.org/atlases-and-data/rnaseq. The AllenVISp is
obtained from the ‘Cell Diversity in the Mouse Cortex –
2018’ release. The AllenSSp is obtained from the ‘Cell Di-        Cross validation
versity in the Mouse Cortex and Hippocampus’ release              We evaluated the prediction performance of all methods
of October 2019. We downloaded the whole dataset and              using a leave-one-gene-out cross validation. For a set of
used the metadata to only select cells from the SSp region.       N shared genes between the spatial and the scRNA-seq
The Zeisel dataset (GSE60361) was downloaded from http:           datasets, one gene is left out and the remaining N-1 genes
//linnarssonlab.org/cortex/, while the Moffit 10X dataset         are used for integration and prediction of the left-out gene.
(GSE113576) was downloaded from GEO.                              The prediction is then evaluated by comparing the mea-
    The STARmap dataset was downloaded from                       sured and predicted spatial profiles of the left-out-gene.
the    STARmap        resources    website    (https://www.          For the STARmap AllenVISp dataset pair, we applied
starmapresources.com/data). We obtained the gene                  a more challenging cross validation setup. Similar to the
count matrix and the cell position information for the            leave-one-gene-out setup, for a set of N shared genes, one
largest 1020-gene replicate. Cell locations and morpholo-         gene is left out to be predicted. From the remaining N − 1
gies were identified using Python code provided by the            genes, we excluded the 100 genes that are most correlated
original study (https://github.com/weallen/STARmap).              (absolute Pearson correlation) with the left-out gene. The
The osmFISH dataset was downloaded as loom                        remaining N − 101 genes are then used for the integration
file from http://linnarssonlab.org/osmFISH/, we ob-               and prediction of the left-out gene.
tained the gene count matrix and the metadata us-
ing the loompy Python package. The MERFISH
dataset was downloaded from Dryad repository (https:              Benchmarked methods
//doi.org/10.5061/dryad.8t8s248), we used the first naı̈ve        We compared the performance of SpaGE versus three state-
female mouse (Animal ID = 1). The seqFISH+ dataset                of-the-art methods for data integration: Seurat, Liger, and
was obtained from the seqFISH-PLUS GitHub repository              gimVI. Seurat and Liger are available as R packages, while
(https://github.com/CaiGroup/seqFISH-PLUS), we used               gimVI is available through the scVI Python package (26).
the gene count matrix of the mouse cortex dataset.                We were not able to include Harmony in the comparison, as
                                                                  the code to predict unmeasured gene expression is not avail-
                                                                  able. During the benchmark, all methods were applied us-
Data preprocessing
                                                                  ing their default settings, or the settings provided in the ac-
For all the scRNA-seq datasets, we filtered out genes ex-         companying examples or vignettes. Data normalization and
pressed in less than 10 cells. No filtration was applied on       scaling were performed using the built-in functions in each
the cells, except for the AllenVISp dataset for which we fil-     package, NormalizeData and ScaleData functions in Seu-
tered low quality cells provided from the metadata (‘Low          rat, normalize and scaleNotCenter functions in Liger, while
Quality’ and ‘No Class’ cells). For the Zeisel dataset, we        gimVI implicitly preprocess the data while computing.
only used the somatosensory cortex cells excluding the hip-
pocampus cells. Next, scRNA-seq datasets were normalized
                                                                  Moran’s I statistic
by dividing the counts within each cell by the total num-
ber of transcripts within that cell, scaling by 106 and log1p     The Moran’s I statistic (27) is a measure of spatial autocor-
transformed. Further, we scaled the data by making each           relation calculated for each spatial gene. The Moran’s I val-
gene centered and scaled (zero mean and unit variance) us-        ues can range from −1 to 1, where a value close to 1 indi-
ing the SciPy Python package (25).                                cates a clear spatial pattern, and a value close to 0 indicates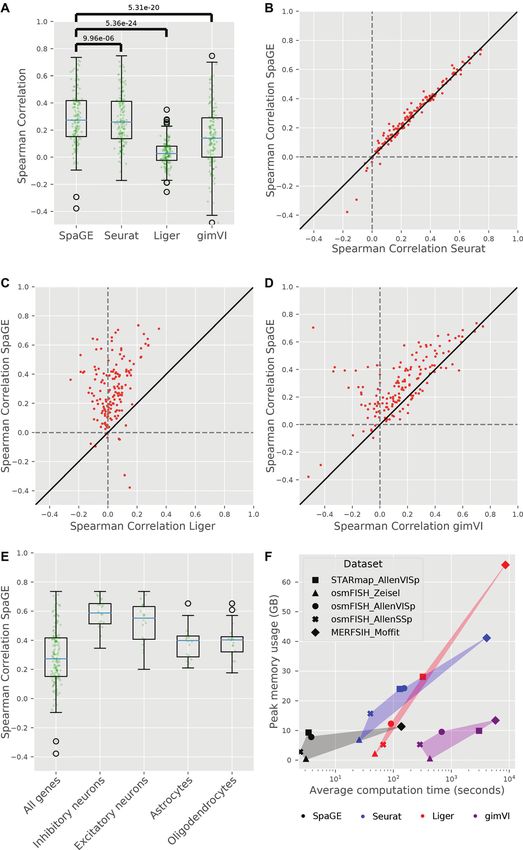
e107 Nucleic Acids Research, 2020, Vol. 48, No. 18                                                                                PAGE 4 OF 16

Table 1. Summary of the dataset pairs used in this study
                                                                    Spatial data                                     scRNA-seq data
Spatial scRNA-seq dataset pair                         # of cells        # of genes     Tissue          # of cells        # of genes    Tissue
STARmap AllenVISp (8,22)                                    1,549            1,020       VISc             14,249             34,617     VISc
osmFISH Zeisel (5,24)                                       3,405               33      SMSc               1,691             15,075     SMSc
osmFISH AllenSSp (5,23)                                     3,405               33      SMSc               5,577             30,527     SMSc
osmFISH AllenVISp (5,22)                                    3,405               33      SMSc              14,249             34,617     VISc
MERFISH Moffit (4)                                         64,373              155       POR              31,299             18,646     POR
seqFISH AllenVISp (7,22)                                      524           10,000      Cortex            14,249             34,617     VISc

VISc: Visual cortex; SMSc: Somatosensory cortex; POR: Pre-optic region

random spatial expression, while a value close to −1 indi-

                                                                                                                                                 Downloaded from https://academic.oup.com/nar/article/48/18/e107/5909530 by guest on 20 November 2020
                                                                              FindMarkers function from the Seurat R package to define
cated a chess board like pattern. We calculated the Moran’s                   the top 20 differentially expressed genes per cell type, com-
I using the following equation:                                               paring one cell type vs the rest using a two-sided Wilcoxon
                                                                          rank sum test and the Bonferroni method for multiple test
                 N i j wi j (xi − x̄) x j − x̄                                correction, with min.pct = 0.25 and logfc.threshold = 0.25.
          I =                            2
                                                       (12)
                              i (xi − x̄)
                 W
where x is the gene expression array, x̄ is the mean expres-                  A model to predict trustworthiness of the SpaGE prediction
sion of gene x, N is the total number of spatial cells, wi j                  To determine whether we can trust a predicted spatial pat-
is a matrix containing spatial weights with zeros on the di-                  tern by SpaGE, we trained a logistic regression model that
agonal, and W is the sum of wi j . We calculated the spatial                  predicts the trustworthiness of the predicted signal from
weights wi j using the XY coordinates of the spatial cells,                   four characteristics of the data: (i) the Moran’s I statistic of
for each cell we calculated the kNN using the spatial coor-                   the predicted spatial gene expression ( pMIi ), (ii) the mean
dinates (k = 4). We assigned wi j = 1 if j is in the nearest                  μi and (iii) variance σ i of the expression of that gene in the
neighbors of i, otherwise wi j = 0.                                           scRNA-seq data and (iv) the percentage of cells express-
                                                                              ing that gene in the scRNA-seq data (ei ). The trustworthi-
Down-sampling                                                                 ness, Yi , used to train the model, is determined from the
                                                                              Spearman correlation between the SpaGE-predicted spatial
For the 994 shared genes in the STARmap AllenVISp                             pattern and the measured spatial pattern, i.e. correlations
dataset pair, we first selected the top 50 spatial genes with                 above the median correlation are considered to be trustwor-
high Moran’s I statistic values to be used as test set. For                   thy. This gives the following logistic regression model:
the remaining 944 genes, we calculated the pairwise Pear-
son correlation using the scRNA-seq dataset. If the abso-                                    Yi ∼ pMIi + μi + σi + ei
lute value of the correlation of two genes is larger than 0.7,
                                                                                Note that the inputs to the model can be determined
we removed the gene with the lower variance. After remov-
                                                                              without the need to have access to the measured spatial ex-
ing highly correlated genes, we sorted the remaining genes
                                                                              pression of the gene, and consequently the model can be
according to their expression variance in the scRNA-seq
                                                                              used to evaluate whether the predicted spatial pattern of ex-
dataset. We selected the top 10, 30, 50, 100, 200 and 500
                                                                              pression of an unmeasured spatial gene is to be trusted or
genes with high variance, these genes were used for align-
                                                                              not.
ment of the two datasets and prediction of the expression
of the test genes. The prediction performance of these gene
sets was compared with using all 944 genes.                                   RESULTS
   We applied the same down-sampling criteria on the 9,751
                                                                              SpaGE overview
shared genes in the seqFISH AllenVISp dataset pair, except
for two differences: (i) the 50 spatial genes used as test set                We developed SpaGE, a platform that enhances the spatial
were selected as the top predicted genes in the leave-one-                    transcriptomics data by predicting the expression of unmea-
gene-out cross validation experiment, (ii) after removing                     sured genes from a dissociated scRNA-seq data from the
correlated genes, we selected sets of the top 10, 30, 50, 100,                same tissue (Figure 1). Based on the set of shared genes,
200, 500, 1000, 2000, 5000 and 7000 most variable genes, as                   we align both datasets using the domain adaptation method
well as all 9,701 genes.                                                      PRECISE (20), to account for technical differences as well
                                                                              as gene detection sensitivity differences. PRECISE geomet-
                                                                              rically aligns linear latent factors computed on each dataset
Cell-type marker genes
                                                                              and finds gene combinations expressed in both datasets.
To evaluate the performance of SpaGE per cell type, we                        These gene combinations thus define a common latent space
defined sets of marker genes for four major brain cell                        and can be used to jointly project both datasets. Next, in this
types: Inhibitory neurons, Excitatory neurons, Astrocytes                     common latent space, we use the kNN algorithm to define
and Oligodendrocytes. The marker genes of the osmFISH                         the neighborhood of each cell in the spatial data from the
dataset were directly obtained from the original paper (5).                   scRNA-seq cells. These neighboring scRNA-seq cells are
For the STARmap and MERFISH datasets, we used the                             then used to predict the expression of spatially unmeasured
PAGE 5 OF 16                                                                             Nucleic Acids Research, 2020, Vol. 48, No. 18 e107

                                                                                                                                                            Downloaded from https://academic.oup.com/nar/article/48/18/e107/5909530 by guest on 20 November 2020
Figure 1. SpaGE pipeline. SpaGE takes as input two datasets, a scRNA-seq dataset and a spatial transcriptomics dataset measured from the same tissue.
SpaGE uses gene combinations of equal significance in both datasets to predict spatial locations of unmeasured genes. Using PRECISE, SpaGE finds
directions that are important for both datasets, by making use of a geometrical alignment of the independent PCs to produce the PVs. SpaGE aligns
both datasets by projecting on the PVs of the reference dataset. Using the aligned datasets, SpaGE applies kNN prediction to define new gene expression
patterns for spatially unmeasured genes, predicted from the dissociated scRNA-seq data. Each spatial cell can be enhanced by having the expression of the
whole transcriptome.

genes. Finally, we end up with the full gene expression pro-                   both datasets on PVr to obtain the new aligned versions
file of each cell in the spatial data.                                         used for the kNN prediction.
   The alignment step is the most crucial step in the pipeline                    We performed SpaGE on six dataset pairs from different
of SpaGE. For this purpose, we use PRECISE, a domain                           regions in the mouse brain, varying in the number of cells
adaptation method previously proposed to predict the drug                      and the number of spatially measured genes, summarized
response of human tumors based on pre-clinical models                          in Table 1. To show the alignment performance, we calcu-
such as cell lines and mouse models. We adapted PRECISE                        lated the cosine similarity between the PCs and the PVs,
to the task of integrating the spatial data with the scRNA-                    i.e. before and after the alignment. Across all six dataset
seq data by defining the common aligned subspace between                       pairs, we observed that indeed the relation between the PCs
both datasets (Figure 1). PRECISE takes as input the ex-                       is not one-to-one, as these PCs are obtained from two dif-
pression matrix of both datasets, having the same set of                       ferent datasets (Supplementary Figure S1 and S2). How-
(overlapping) genes but measured differently and within dif-                   ever, after alignment using PRECISE, the diagonal cosine
ferent cells. As we are aiming to fit each spatial cell to the                 similarity between the PVs is maximized showing a one-
most similar scRNA-seq cells, we may refer to the spatial                      to-one relationship between the PVs of both datasets. Sup-
dataset as the ‘query’ and the scRNA-seq dataset as the                        plementary Figure S1A shows the diagonal cosine similar-
‘reference’. First, PRECISE obtains a lower dimensional                        ity before and after PRECISE (i.e. between PCs and PVs)
space for each dataset separately using a linear dimensional-                  across all dataset pairs, showing a relatively large increase in
ity reduction method, such as Principal Component Analy-                       similarity after the alignment using PRECISE. As we used
sis (PCA). Next, the two independent sets of principal com-                    only the informative PVs, the final number of PVs varied
ponents (PCs) are aligned by applying a singular value de-                     across datasets (Supplementary Table S1) and, as a result,
composition. We align the two sets of principal components                     the amount of explained variance for each dataset varied,
using the singular vectors to obtain the aligned components,                   from ∼6% for the seqFISH+ dataset to ∼94% for the osm-
named principal vectors (PVs). These PVs are sorted in de-                     FISH dataset.
creasing order based on their similarity between the refer-                       Another interesting feature of SpaGE is the ability to in-
ence and the query datasets. This allows us to filter out dis-                 terpret the most contributing genes defining the latent inte-
similar or noisy signals, by discarding PVs with relatively                    gration space (Methods). In general, these genes are highly
low similarity, thus keeping only the common latent space                      variable and in most cases are related to cell type differences.
(Methods). The principal vectors of the reference dataset                      A good example is the integration of the osmFISH Zeisel
(PVr ) are considered as the aligned latent space. We project                  dataset pair, in which the top six contributing genes are
e107 Nucleic Acids Research, 2020, Vol. 48, No. 18                                                              PAGE 6 OF 16

Tmem2, Mrc1, Kcnip2, Foxj1, Apln and Syt6. These genes            ples where other methods obtained higher correlations than
are related to six different cell categories previously defined   SpaGE, excluding the top 10 predicted genes by SpaGE.
in the osmFISH paper (5): Oligodendrocytes, Immune cells,         Compared to Seurat, SpaGE similarly predicted the expres-
Inhibitory neurons, Ventricle, Vasculature and Excitatory         sion of Arpp19, but predicted relatively higher contrast pat-
neurons, respectively.                                            terns for Pcp4 and Arc (Supplementary Figure S3B). Com-
   We further illustrate the quality of the alignment by ex-      pared to Liger, SpaGE similarly predicted the expression of
amining the overlap in the top contributing genes for the         Mobp, higher contrast pattern for Hpcal4, and better pre-
PCs (before PRECISE) and the PVs (after PRECISE). Us-             dicted the spatial pattern of Tsnax (Supplementary Figure
ing the STARmap AllenVISp dataset pair, we obtained the           S3C). Compared to gimVI, SpaGE predicted a lower con-
top 50 contributing genes for the PCs of the STARmap              trast pattern for Arx, a higher contrast pattern for Snurf,
data and the PCs of the AllenVISp data. These two sets            but failed to reproduce the measured spatial pattern for Bcl6
shared only 2 genes out of 50. After alignment, the shared        (Supplementary Figure S3D). Remarkably, the predicted
genes, between the top 50 contributing genes for the PVs          spatial patterns of SpaGE, for all three genes, are more in

                                                                                                                                  Downloaded from https://academic.oup.com/nar/article/48/18/e107/5909530 by guest on 20 November 2020
of the STARmap data and the PVs of the AllenVISp data,            agreement with the data from the Allen Brain Atlas, sug-
increased to 12 genes. Also, we applied GO enrichment on          gesting that these genes were not accurately measured in the
these top contributing gene sets in each case using PAN-          STARmap dataset.
THER (http://pantherdb.org/, Fisher exact test with Bon-             Although the correlation values are in general low,
ferroni multiple test correction). The STARmap PCs and            SpaGE is capable of accurately reconstructing genes with
the AllenVISp PCs had 9 enriched biological processes             clear spatial pattern in the brain. Figure 2E shows a set of
each, sharing 3 processes in common (Supplementary Table          genes known to have spatial patterns (previously reported
S2). While the STARmap PVs and the AllenVISp PVs had              by Seurat, Liger and gimVI). In this set of genes, Seu-
27 and 41 enriched biological processes, respectively, shar-      rat and Liger are performing well, except that Liger pro-
ing 12 processes in common. Interestingly many of them            duced a lower contrast expression pattern in some cases
related are to regulation processes, such as regulation of        (e.g. Lamp5 and Bsg). gimVI produced good prediction for
biological process, cell population proliferation, metabolic      Lamp5, however, gimVI was not able to predict the correct
processes, cell motility, locomotion and cellular component       gene patterns for the other genes.
movement.                                                            To obtain a better understanding and interpretation of
                                                                  these correlation values, we evaluated the effect of the kNN
                                                                  algorithm on the prediction performance. To do so, we di-
SpaGE outperforms state-of-the-art methods on the
                                                                  vided the AllenVISp dataset into two stratified folds en-
STARmap dataset
                                                                  suring an equal composition of cell types. We used one-
Using the first dataset pair STARmap AllenVISp, we ap-            fold to predict genes in the other fold using the shared
plied SpaGE to integrate both datasets and predict unmea-         genes. Note that this does not require an alignment (PRE-
sured spatial gene expression patterns. In order to evalu-        CISE), so we can test the influence of the kNN regression.
ate the prediction, we performed a leave-one-gene-out cross       We applied a leave-one-gene-out cross validation using the
validation (Methods). The STARmap AllenVISp dataset               same set of 994 shared genes of the STARmap AllenVISp
pair shares 994 genes. In each cross-validation fold, one         dataset pair, which resulted in a median Spearman correla-
gene is left out and the remaining 993 genes are used as          tion of 0.551 (Supplementary Figure S4A). While the per-
input for SpaGE to predict the spatial expression pattern         formance is clearly better compared to that of SpaGE using
of the left-out gene. We evaluated the prediction perfor-         the STARmap AllenVISp dataset pair (median Spearman
mance by calculating the Spearman correlation between the         correlation = 0.125), it shows that the kNN regression is
original measured spatially distributed values and the pre-       partially responsible for reduced correlation values.
dicted values of the left-out gene. We performed the same            To investigate the influence of the correlation metric,
leave-one-gene-out cross validation using Seurat, Liger and       we tested also the Pearson and Kendall correlation mea-
gimVI, to benchmark the performance of SpaGE. Results             sures, which showed that the highest correlation values are
show a significant improvement in performance for SpaGE           obtained when using the Spearman correlation (Supple-
compared to all three methods (P-value < 0.05, two-sided          mentary Figure S4B). Next, we were interested how well
paired Wilcoxon rank sum test), with a median Spearman            SpaGE could predict when there was no difference be-
correlation of 0.125 compared to 0.083, 0.067 and 0.035 for       tween measurement modalities (here, spatial and scRNA-
Seurat, Liger and gimVI, respectively (Figure 2A).                seq). Therefore, we used SpaGE to integrate the Zeisel and
   Further, we compared the Spearman correlation of               AllenSSp datasets, representing two scRNA-seq measured
SpaGE versus the state-of-the-art methods per gene, to ob-        datasets from the same brain region. Using the leave-one-
tain a detailed evaluation. Results show better performance       gene-out cross validation and the same shared genes of the
of SpaGE across the majority of genes, but not all (Figure        STARmap AllenVISp dataset pair, we obtained a median
2B−D). Next, we visually compared a few genes that had            Spearman correlation of 0.303 (query: Zeisel, reference: Al-
high correlations for each method. For the top three pre-         lenSSp) and 0.331 (query: AllenSSp, reference: Zeisel) (Sup-
dicted genes of SpaGE (Pcsk2, Pgm2l1 and Egr1), Seurat            plementary Figure S4B). These correlation values suggest
obtained a good prediction as well, as these three genes are      that the observed correlation values obtained when apply-
in the top 10 predicted genes of Seurat. Liger failed to pre-     ing SpaGE on spatial and scRNA-seq datasets are not as
dict Egr1, while gimVI failed to predict Pgm2l1 and Egr1          low as they appear.
(Supplementary Figure S3A). We further looked for exam-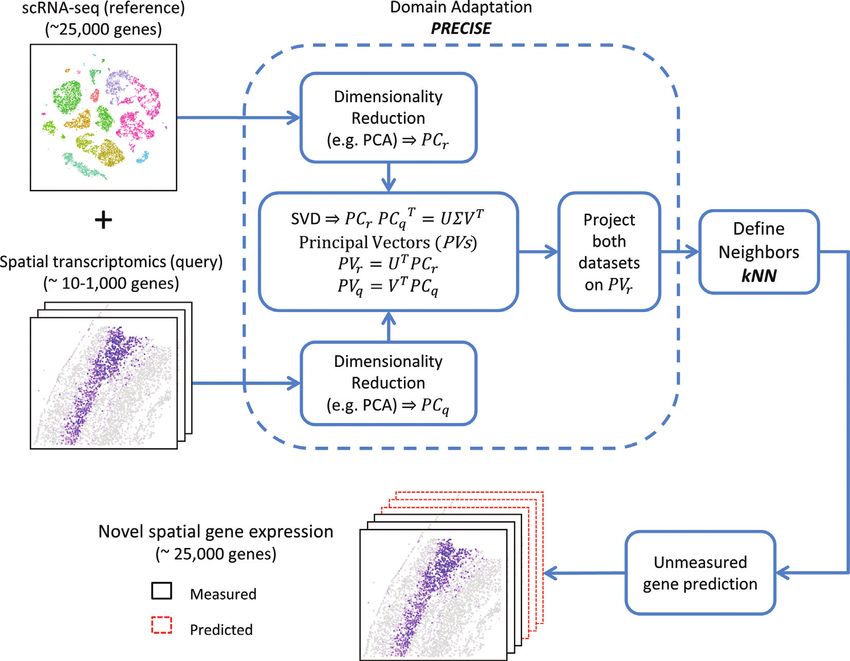
PAGE 7 OF 16                                                                              Nucleic Acids Research, 2020, Vol. 48, No. 18 e107

                                                                                                                                                               Downloaded from https://academic.oup.com/nar/article/48/18/e107/5909530 by guest on 20 November 2020

Figure 2. Prediction performance comparison for the STARmap AllenVISp dataset pair. (A) Boxplots showing the Spearman correlations for the leave-one-
gene-out cross validation experiment for each method. The blue lines show the median correlation across all genes with a better performance for SpaGE.
The green dots show the correlation values for individual genes. The P-values show the significant difference between all correlation values of SpaGE
and each other method, using a paired Wilcoxon rank-sum test. (B−D) Detailed performance comparison between SpaGE and (B) Seurat, (C) Liger,
(D) gimVI. These scatter plots show the correlation value of each gene across two methods. The solid black line is the y = x line, the dashed lines show
the zero correlation. Points are colored according to the Moran’s I statistic of each gene. All scatter plots show that the majority of the genes are skewed
above the y = x line, showing an overall better performance of SpaGE over other methods. (E) Predicted expression of known spatially patterned genes in
the STARmap dataset. Each row corresponds to a single gene having a clear spatial pattern. First column from the left shows the measured spatial gene
expression in the STARmap dataset, while other columns show the corresponding predicted expression pattern by SpaGE, Seurat, Liger and gimVI, using
the leave-one-gene-out cross validation experiment. Prediction is performed using the AllenVISp dataset.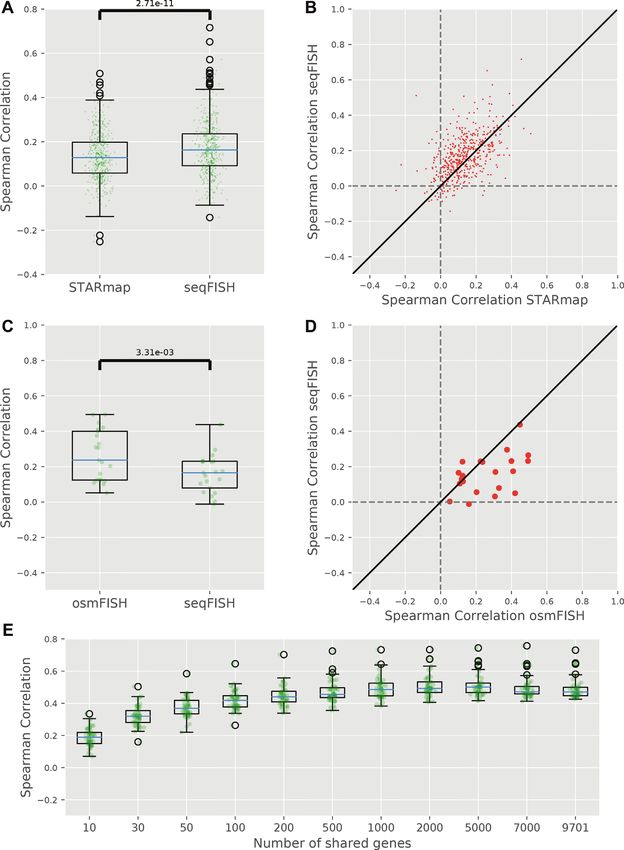
e107 Nucleic Acids Research, 2020, Vol. 48, No. 18                                                                        PAGE 8 OF 16

   Additionally, although it is important to accurately pre-
dict the expression of all genes, genes with distinct spa-
tial patterns are more important to accurately predict com-
pared to non- or randomly expressed genes. To quantify
the existence of spatial patterns, we calculate the Moran’s
I statistic of each gene using the original STARmap spatial
data (Methods). We compared the prediction performance
of each gene with the corresponding Moran’s I value. For
SpaGE, Seurat and Liger, we observed a positive relation-
ship between the prediction performance and the Moran’s
I values, i.e. genes with spatial patterns are better pre-
dicted (Supplementary Figure S5A−C). On the other hand,
gimVI performed worse on genes with high Moran’s I statis-

                                                                                                                                               Downloaded from https://academic.oup.com/nar/article/48/18/e107/5909530 by guest on 20 November 2020
tic (Supplementary Figure S5D).
   Further, we evaluated the prediction performance of all
methods using a more challenging cross validation setup.
Compared to the (traditional) leave-one-gene-out setup, the
left-out gene is predicted using less shared genes in this set
up, i.e. we removed the (100) most correlated genes with the
left-out gene from the training set (Methods). This more
challenging evaluation did result in comparable prediction
performance to the leave-one-gene-out setup, with roughly
the same differences and ranking across all methods (Sup-         Figure 3. SpaGE accurately predicted the expression of Rorb, Syt6 and Tbr1
plementary Figure S6A). In addition, we evaluated how well        in agreement with the osmFISH data. These three genes (shown in rows)
a gene can be predicted when using less shared genes in gen-      were wrongly measured in the original STARmap data (shown in the left
eral. First, we selected a fixed test set of 50 genes, next we    column). Using the STARmap AllenVISp dataset pair, SpaGE was able to
down-sampled the remaining set of 944 shared genes in a           reconstruct the correct spatial gene expression patterns (middle column).
                                                                  These predicted patterns are in agreement with the measured gene expres-
guided manner (Methods). For down-sampled shared genes            sion patterns measure by the osmFISH dataset (right column), a highly
sets of 10, 30, 50, 100, 200, 500 and all 944 genes, SpaGE        sensitive single-molecule technology.
performance always increases with the number of shared
genes as expected (Supplementary Figure S6B).
                                                                  training this model, we used the Spearman correlation be-
                                                                  tween the SpaGE-predicted spatial pattern and the mea-
SpaGE predicts unmeasured spatial gene patterns that are in-      sured spatial pattern to determine whether a gene can be
dependently validated                                             trusted or not, i.e. we assumed that correlations above the
After validating SpaGE to accurately predict the spatially        median correlation are trustworthy. Using the 994 shared
measured genes, we applied SpaGE to predict new unmea-            genes of the STARmap AllenVISp dataset pair, we obtained
sured genes for the spatial data, with the aim to define          an average accuracy of 0.71 for a stratified 2-fold cross val-
novel spatial gene patterns. We illustrate SpaGE’s capa-          idation. Next, we trained the model using all genes and ap-
bility of such task using the STARmap AllenVISp dataset           plied it to the estimated gene patterns in Figures 3 and 4.
pair. First, during the leave-one-gene-out cross validation,      This model judged the predicted patterns of Rorb, Tbr1,
SpaGE was able to produce the correct spatial pattern for         Tesc, Pvlr3 and Rora, trustworthy, and the patterns for Syt6,
Rorb, Syt6 and Tbr1 (Figure 3). These three genes were orig-      Chst8 and Cdh24 were not. Interestingly, when inspecting
inally under-expressed, possibly due technical noise or low       the model’s coefficients we found that the Moran’s I statistic
gene detection sensitivity in the STARmap dataset. Our pre-       of the predicted spatial pattern had the largest contribution.
dictions using SpaGE are in agreement with the highly sen-
sitive cyclic smFISH dataset (osmFISH (5)) measured from
                                                                  SpaGE predictions improve with deeply sequenced reference
the mouse somatosensory cortex, a similar brain region in
                                                                  dataset
terms of layering structure to the visual cortex measured by
the STARmap dataset. Further, using SpaGE, we were able           We wanted to test the effect of changing the reference
to obtain novel spatial gene patterns for five genes not origi-   scRNA-seq data on the spatial gene expression prediction.
nally measured by the STARmap dataset, showing clear pat-         Here, we used the osmFISH dataset which represents a dif-
terns through the cortical layers (Figure 4). These predicted     ferent challenge compared to the STARmap dataset. On
patterns are supported by the Allen Brain Atlas in-situ hy-       one hand, the osmFISH dataset has a relatively higher gene
bridization (ISH).                                                detection sensitivity, but on the other hand, the osmFISH
   To quantitatively evaluate the predicted spatial patterns      dataset includes only 33 genes. First, we evaluated the osm-
for non-measured genes, we trained a logistic regression          FISH Zeisel dataset pair, in which we integrated the osm-
model to estimate whether a predicted spatial gene expres-        FISH dataset with a reference scRNA-seq dataset from the
sion can be trusted or not (Methods). We used three sta-          same lab (24). We performed leave-one-gene-out cross vali-
tistical features from the scRNA-seq data, in addition to         dation similar to the STARmap dataset. Compared to other
the Moran’s I statistic of the predicted spatial pattern. When    methods, SpaGE has significantly better performance (P-
PAGE 9 OF 16 Nucleic Acids Research, 2020, Vol. 48, No. 18 e107
while compared to Seurat, SpaGE has better performance
across all genes (Supplementary Figure S7B−D). We fur-
ther investigated the relation between the prediction perfor-
mance and the Moran’s I statistic of the originally measured
genes. Similar to the STARmap data, for SpaGE and Seu-
rat, we found a positive relationship, i.e. the performance
is higher for genes with distinct spatial patterns. However,
Liger and gimVI have a negative relationship (Supplemen-
tary Figure S8).
Next, we tested the performance of all methods us-
ing the AllenVISp dataset as reference for the osmFISH
dataset, similar to the STARmap dataset. For the osm-
FISH AllenVISp dataset pair, we observed similar conclu-
Downloaded from https://academic.oup.com/nar/article/48/18/e107/5909530 by guest on 20 November 2020
sions where SpaGE has significantly better performance
compared to other methods, with a median Spearman cor-
relation of 0.203 compared to 0.014, 0.082 and 0.162 for
Seurat, Liger and gimVI, respectively (Figure 5A, Sup-
plementary Figure S9A). SpaGE has better performance
across all genes compared to Seurat and Liger, while gimVI
is performing better on a few genes (Supplementary Fig-
ure S9B−D). All four methods have a positive relation-
ship between their prediction performance and the Moran’s
I statistic of the measured genes (Supplementary Figure
S10). These results show how the reference dataset can af-
fect the prediction. Compared to the Zeisel dataset, the Al-
lenVISp is more deeply sequenced data, with the average
number of detected transcripts per cell being ∼140× more
than the Zeisel dataset (Supplementary Figure S11A, B).
However, not all methods benefit from this, as for Seurat
and Liger, the prediction performance using the AllenVISp
or the Zeisel datasets is quite similar (Figure 5A). On the
other hand, SpaGE and gimVI get an increase in perfor-
mance across all genes, although the median correlation for
SpaGE remains the same. Similar to the STARmap dataset,
we tested the performance of the kNN regression within
the AllenVISp dataset only (excluding the alignment proce-
dure), when using only the 33 genes of the osmFISH dataset.
In this case, we obtained a median correlation of 0.289 (Sup-
plementary Figure S4A), when predicting the expression of
genes in the scRNA-seq data from one-fold to the other,
which is slightly higher than SpaGE (0.203) predicting osm-
FISH patterns. This result shows that the alignment of the
spatial and scRNA-seq data using SpaGE is performing
well, as the overall performance is comparable with predic-
tions within the same dataset.
Figure 4. Novel gene expression patterns for five genes not originally mea- While the AllenVISp is a deeply sequenced reference
sured by the STARmap dataset, validated using the Allen Brain Atlas in-situ dataset, it has been measured from a different brain re-
hybridization ISH. The left column shows the predicted spatial patterns us-
ing SpaGE for these five genes (shown in rows). The middle column shows gion than the osmFISH dataset (Table 1). Therefore, we de-
the Allen Brain Atlas ISH data for each gene, stating the image ID on cided to use a third reference dataset, AllenSSp, which has
top of each tissue section. The red rectangle highlights the corresponding roughly the same sequencing depth as the AllenVISp (Sup-
brain region measured by the STARmap dataset. The right column shows a plementary Figure S11B, C) but is measured from the so-
zoomed-in view of the region highlighted using this red rectangle, showing
an agreement with the expression patterns predicted by SpaGE.
matosensory cortex, similar to the osmFISH dataset. We
evaluated the prediction performance of all four tools for
the new dataset pair osmFISH AllenSSp. SpaGE obtained
a better performance with a median Spearman correla-
valuee107 Nucleic Acids Research, 2020, Vol. 48, No. 18 PAGE 10 OF 16
Downloaded from https://academic.oup.com/nar/article/48/18/e107/5909530 by guest on 20 November 2020
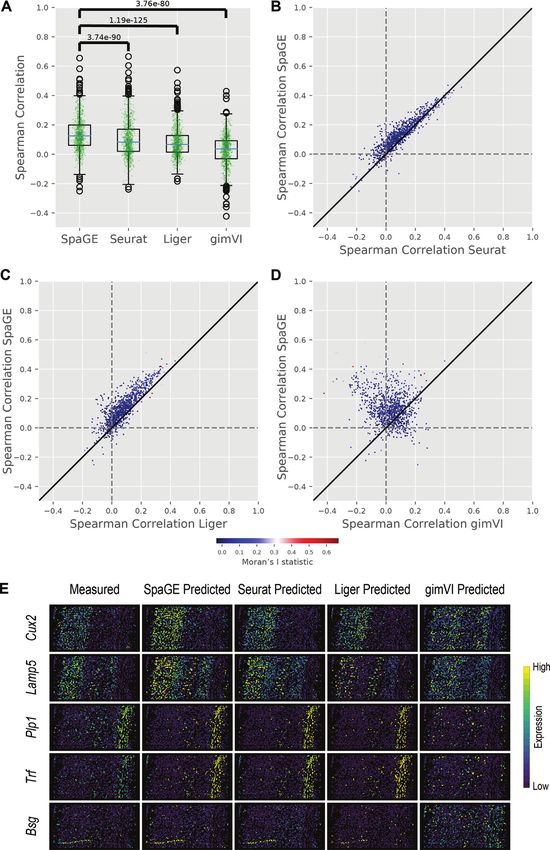
Figure 5. Prediction performance comparison for the osmFISH dataset using different reference scRNA-seq datasets. (A) Boxplots showing the Spearman
correlations for the leave-one-gene-out cross validation experiment for each method using four different scRNA-seq datasets, Zeisel, AllenVISp, AllenSSp
and AllenSSp Downsampled. The median correlations shows a better performance for SpaGE in all dataset pairs. The black dots show the correlation
values for individual genes. The P-values are obtained using a paired Wilcoxon rank-sum test. SpaGE showed a performance improvement when using the
AllenVISp over the Zeisel data. Although the median correlation is the same, the overall correlation range did improve. Also, gimVI clearly benefits from
using the AllenVISp and the AllenSSp datasets over the Zeisel dataset. All methods have decreased performance when using the AllenSSp Downsampled
data compared to the original AllenSSp data. (B) Predicted expression of known spatially patterned genes in the osmFISH dataset using different reference
scRNA-seq datasets. Each row corresponds to a single gene having a clear spatial pattern. First column from the left shows the measured spatial gene
expression in the osmFISH dataset, while the second, third and fourth columns show the corresponding predicted expression pattern by SpaGE using
Zeisel, AllenVISp and AllenSSp datasets, respectively. Changing from Zeisel to AllenVISp (deeply sequenced data) improved the prediction, while matching
the brain region using the AllenSSp improved the prediction further.PAGE 11 OF 16 Nucleic Acids Research, 2020, Vol. 48, No. 18 e107
for nearly half the genes (Supplementary Figure S12B–D).
SpaGE, Liger and gimVI have positive relationship between
the prediction performance and Moran’s I statistic. How-
ever, Seurat has a negative relationship (Supplementary Fig-
ure S13).
Several sources of variation do exist between the Allen
datasets and the Zeisel dataset; besides the sequencing
depth, these datasets are, for example, generated in differ-
ent labs and using different sequencing protocols. To sepa-
rately test the effect of the sequencing depth of the reference
scRNA-seq data on the prediction performance, we down-
sampled the AllenSSp dataset to a comparable number of
transcripts per cell as the Zeisel dataset, using the scuttle
Downloaded from https://academic.oup.com/nar/article/48/18/e107/5909530 by guest on 20 November 2020
R package. Compared to the original AllenSSp dataset, we
obtained lower prediction performance across all methods
when using the downsampled dataset (Figure 5A), clearly
showing that a deeply sequenced reference dataset produces
a better prediction. Interestingly, compared to the Zeisel
dataset, the median performance using the downsampled
AllenSSp dataset was lower for SpaGE, Seurat and Liger,
but higher for gimVI.
Changing the brain region did not affect the overall per-
formance of SpaGE (Figure 5A), however, the prediction of
genes with known patterns did improve (Figure 5B). When
we visually inspect these genes, we can clearly observe that
the predicted spatial pattern improved when the reference
dataset had a higher sequencing depth, or was obtained
from a similar tissue. Rorb and Tbr1 are clear examples,
where the prediction using Zeisel was almost missing the
correct pattern, this became clearer using the AllenVISp
having a greater sequencing depth. Changing to a matching
tissue adds further improves the predicted patterns of these
genes (AllenSSp). Eventually, all five genes (Lamp5, Kcnip2,
Rorb, Tbr1 and Syt6) are more accurately predicted using
the AllenSSp dataset. Moreover, we used the AllenSSp ref-
erence dataset to predict the spatial expression of 10 genes
not originally measured by the osmFISH dataset, with clear
patterns through the cortical layers (Figure 6). These pre-
dicted patterns are in agreement with the Allen Brain Atlas
in-situ hybridization (ISH).
SpaGE is scalable to large spatial datasets
So far, SpaGE showed good prediction performance in the
leave-one-gene-out predictions, and was also able to pre-
dict correct spatial patterns of unmeasured genes within
the spatial transcriptomic datasets. All these results were,
however, obtained using a relatively small spatial datasets
including only a few thousand cells (STARmap and osm-
FISH). This opens the question of how does SpaGE scale
to large spatial datasets, comparable to the datasets mea-
sured nowadays. To assess the scalability of SpaGE, we
used a large MERFISH dataset with >60,000 cells mea-
Figure 6. Novel gene expression patterns for 10 genes not originally mea-
sured from the mouse brain pre-optic region, and integrated sured by the osmFISH dataset, validated using the Allen Brain Atlas in-situ
it with the corresponding scRNA-seq dataset published in hybridization ISH. The left column shows the predicted spatial patterns
the same study by Moffit et al. (4). The MERFISH Moffit using SpaGE for these 10 genes (shown in rows). The right column shows
dataset pair shares 153 genes on which we applied the same the Allen Brain Atlas ISH expression for each gene, stating the image ID
next to the tissue section, showing an agreement with the expression pat-
leave-one-gene-out cross validation using all four methods. terns predicted by SpaGE. These genes show clear expression to specific
Similar to the previous results, SpaGE significantly outper- cortical layers (Pvrl3 and Wfs1: layer 2/3; Cux2, Tmem215 and Adam33:
formed all other methods (P-value < 0.05, two-sided paired layer 2/3 and layer 4; Rspo1: layer 4; Tesc: layer 2/3 and layer 6; Tox: layer
Wilcoxon rank sum test) with a median Spearman correla- 5; Foxp2 and Tle4: layer 6).e107 Nucleic Acids Research, 2020, Vol. 48, No. 18 PAGE 12 OF 16
tion of 0.275 compared to 0.258, 0.027 and 0.140 for Seurat, lation of -0.170 and a maximum correlation of 0.716. This
Liger and gimVI, respectively (Figure 7A). Per gene com- result is comparable to the other tested dataset pairs, show-
parisons shows a clear advantage of SpaGE versus Liger ing robust performance of SpaGE.
and gimVI, but more comparable performance with Seurat However, with ∼10,000 spatial genes, we expected a bet-
(Figure 7B–D). The reported P-values are quite significant, ter performance as there are many more shared genes
however, it is important to note that the P-values are in- with which matching cells can be found in the scRNA-seq
flated due to the large sample size, which is also the case for data. To further substantiate this, we compared the pre-
the STARmap dataset. diction performance of 494 overlapping genes between the
Next to the overall performance across all genes, we eval- seqFISH AllenVISp and the STARmap AllenVISp dataset
uated the performance of SpaGE to predict marker genes pairs, both having the same scRNA-seq reference data. The
of four major brain cell types: inhibitory neurons, excita- performance when using the seqFISH+ data, having ∼10x
tory neurons, astrocytes and oligodendrocytes (Methods). more shared genes, was significantly higher than when us-
We observed that SpaGE had higher prediction perfor- ing the STARmap data (P-value < 0.05, two-sided paired
Downloaded from https://academic.oup.com/nar/article/48/18/e107/5909530 by guest on 20 November 2020
mance for cell type marker genes compared to the over- Wilcoxon rank sum test) (Figure 8A). A detailed compari-
all performance across all genes (Figure 7E). Similar con- son per gene shows that the majority of the genes are indeed
clusion can be observed for the STARmap dataset (Sup- better predicted in the seqFISH+ dataset (Figure 8B). How-
plementary Figure S14A), however, this is not the case for ever, when comparing the 21 overlapping genes between the
the osmFISH dataset because almost all 33 genes were cell seqFISH AllenVISp and the osmFISH AllenVISp dataset
type marker genes (Supplementary Figure S14B). Addition- pairs, we obtained a contradicting result. The performance
ally, the ranking of the prediction performance across cell when using the osmFISH data (only 33 shared genes) was
types is related to the cell type proportions observed in higher than when we used the seqFISH+ data, for almost
the data. For instance, the MERFISH dataset has approx- all 21 genes for which we could make this comparison (Fig-
imately 38% inhibitory neurons, 18% excitatory neurons, ure 8C, D).
15% oligodendrocytes and 13% astrocytes, for which the This opens the question whether having more measured
median correlation per cell type is 0.587, 0.551, 0.402 and spatial genes (and thus shared genes) is always beneficial to
0.398, respectively (Figure 7E). Compared to the pre-optic predict the spatial patterns of non-measured genes. To an-
region, the cortex contains more excitatory neurons than swer that, we performed a downsampling experiment simi-
inhibitory. This is directly reflected in the prediction per- lar to what we did with the STARmap data (Methods). We
formance of inhibitory and excitatory marker genes, where fixed 50 genes as test set and downsampled the remaining
the latter have higher performance for the cortical datasets genes to sets of the top 10, 30, 50, 100, 200, 500, 1000,
STARmap and osmFISH (Supplementary Figure S14). 2000, 5000, 7000 and 9,701 (all) highly varying genes as
Further, we compared the computation times of all four shared genes. The best prediction performance of SpaGE
methods across all five dataset pairs. All experiments were was obtained using 5000 genes, after which the performance
run on a Linux HPC server but limited to a single CPU core, decreased (Figure 8E). Apparently, having more genes in-
with 256GB of memory, to be able to compare runtimes. cludes more and more lowly varying, and thus noisy, genes
For all methods, the calculated computation time includes into the matching process, which turns out to confuse the
the integration and the prediction time. Overall SpaGE has matching process and consequently lower the prediction
the lowest average computation time per gene, across all five performance.
dataset pairs (Figure 7F). For the large MERFISH dataset,
SpaGE has a clear advantage compared to the other meth-
DISCUSSION
ods as the average computation time of SpaGE is ∼30×,
63× and 45× faster than Seurat, Liger and gimVI, respec- We demonstrated the ability of SpaGE to enhance spatial
tively. In terms of memory, SpaGE has the lowest memory transcriptomics data by predicting the expression of un-
usage across all five dataset pairs, while Seurat and Liger measured genes based on scRNA-seq data collected from
consumed memory the most (Figure 7F). Combined, these the same tissue. The ability of SpaGE to produce accurate
results show an overall advantage of SpaGE over other gene expression prediction highly depends on the alignment
methods for larger datasets with higher prediction perfor- part performed using PRECISE, which rotates the princi-
mance, lower computation time and less memory require- pal components of each dataset to produce principal vec-
ment. tors with high one-to-one similarity. Projecting the datasets
to the latent space spanned by these principal vectors pro-
duces a proper alignment, making a simple kNN prediction
Increasing the number of shared genes does not always im-
sufficient to achieve accurate gene expression estimation.
prove the prediction
During the alignment, SpaGE ignores principal vectors
To investigate whether the performance improves when hav- with low similarity which excludes uncommon and/or noisy
ing many more spatially measured genes, we tested SpaGE signals. Despite the clear differences in the amount of ex-
when applying it to the seqFISH+ spatial dataset that mea- plained variance for each dataset pair by the final set of
sures up to 10,000 genes simultaneously. Using the seq- principal vectors, SpaGE was able to capture the common
FISH AllenVISp dataset pair, we applied SpaGE using the sources of variation and produce good predictions of the
leave-one-gene-out cross validation setup to predict the spa- spatial gene expressions across all dataset pairs. SpaGE cap-
tial expression of 9,751 shared genes. SpaGE produced a tured ∼6% of the variance for the seqFISH+ dataset that
median Spearman correlation of 0.154, a minimum corre- measures ∼10,000 genes spatially, but the majority of whichPAGE 13 OF 16 Nucleic Acids Research, 2020, Vol. 48, No. 18 e107
Downloaded from https://academic.oup.com/nar/article/48/18/e107/5909530 by guest on 20 November 2020
Figure 7. Prediction performance comparison for the MERFISH Moffit dataset pair. (A) Boxplots showing the Spearman correlations for the leave-one-
gene-out cross validation experiment for each method. The blue lines show the median correlation across all genes with a better performance for SpaGE.
The green dots show the correlation values for individual genes. The P-values show the significant difference between all correlation values of SpaGE
and each other method, using a paired Wilcoxon rank-sum test. (B–D) Detailed performance comparison between SpaGE and (B) Seurat, (C) Liger, (D)
gimVI. These scatter plots show the correlation value of each gene across two methods. The solid black line is the y = x line, the dashed lines show the
zero correlation. All scatter plots show that the majority of the genes are skewed above the y = x line, showing an overall better performance of SpaGE
over other methods. (E) Boxplots showing the prediction performance of SpaGE for cell type marker genes compared to the overall performance across all
genes. (F) scatter plot showing the average computation time (log-scaled) per gene versus the peak memory usage. Methods are represented with different
colors and dataset pairs are represented with different symbols. Points of the same method are highlighted for clarity.e107 Nucleic Acids Research, 2020, Vol. 48, No. 18 PAGE 14 OF 16 Figure 8. Prediction performance of SpaGE for the seqFISH AllenVISp dataset pair. (A,C) Boxplots comparing the prediction performance of SpaGE for Downloaded from https://academic.oup.com/nar/article/48/18/e107/5909530 by guest on 20 November 2020 the shared genes between the seqFISH and the (A) STARmap, (C) osmFISH datasets, using the same AllenVISp dataset as reference during prediction. The blue lines show the median correlation across all genes. The green dots show the correlation values for individual genes. The P-value is obtained using a paired Wilcoxon rank-sum test. (B, D) Detailed performance comparison between seqFISH and (B) STARmap, (D) osmFISH. These scatter plots show the correlation value of each gene across two datasets. The solid black line is the y = x line, the dashed lines show the zero correlation. (E) Boxplots showing the prediction performance of a test set of 50 genes, in terms of Spearman Rank correlations, using downsampled sets of 10, 30, 50, 100, 200, 500, 1000, 2000, 5000 and 7000 shared genes compared to using all 9,701 genes in the seqFISH AllenVISp dataset pair.
You can also read