SRS Spectral Reflectance Sensor - Size
←
→
Page content transcription
If your browser does not render page correctly, please read the page content below
SRS
Spectral Reflectance Sensor
        Operator’s Manual

                        ®

     METER Group, Inc. USA
             14597-04
SRS Sensors
METER Group, Inc. USA
2365 NE Hopkins Court
Pullman WA 99163
Phone: 509-332-5600
Fax: 509-332-5158
Website: www.metergroup.com
Email: support.environment@metergroup.com or
sales.environment@metergroup.com
METER Group, Inc. USA
c 2006-2020
All Rights Reserved
iiSRS Sensors CONTENTS
Contents
1 Introduction 1
1.1 Customer Support . . . . . . . . . . . . . . . . . . . . 1
1.2 About This Manual . . . . . . . . . . . . . . . . . . . 2
1.3 Warranty . . . . . . . . . . . . . . . . . . . . . . . . . 2
1.4 Seller’s Liability . . . . . . . . . . . . . . . . . . . . . . 2
2 About SRS 3
2.1 Overview . . . . . . . . . . . . . . . . . . . . . . . . . 3
2.2 Specifications . . . . . . . . . . . . . . . . . . . . . . . 4
3 Theory 6
3.1 Normalized Difference Vegetation Index (NDVI) . . . 6
3.2 Estimating LAI . . . . . . . . . . . . . . . . . . . . . . 8
3.3 Fractional Interception of Photosynthetically Active
Radiation . . . . . . . . . . . . . . . . . . . . . . . . . 8
3.4 Canopy Phenology . . . . . . . . . . . . . . . . . . . . 10
3.5 Photochemical Reflectance Index (PRI) . . . . . . . . 11
3.6 Sun-Sensor-Surface Geometry Considerations . . . . . 12
3.7 Calculating Percent Reflectance from Paired Up and
Down Looking Sensors . . . . . . . . . . . . . . . . . . 15
4 Field Installation 19
5 Connecting the SRS 21
5.1 Connecting to METER Data Logger . . . . . . . . . . 21
5.2 3.5 mm Stereo Plug Wiring . . . . . . . . . . . . . . . 22
5.3 Connecting to a Non-METER Logger . . . . . . . . . 22
5.4 Pigtail End Wiring . . . . . . . . . . . . . . . . . . . . 23
6 Communication 25
6.1 SDI-12 Communication . . . . . . . . . . . . . . . . . 25
7 Understanding Data Outputs 27
7.1 Using METER’s Data Loggers . . . . . . . . . . . . . 27
7.1.1 Up Looking Sensor Outputs . . . . . . . . . . . 27
7.1.2 Down Looking Sensor Outputs . . . . . . . . . 27
7.2 Using other data loggers . . . . . . . . . . . . . . . . . 28
iiiCONTENTS SRS Sensors
8 Installing the SRS 29
8.1 Attaching and Leveling . . . . . . . . . . . . . . . . . 29
8.2 Cleaning and Maintenance . . . . . . . . . . . . . . . . 29
9 Troubleshooting 31
9.1 Data Logger . . . . . . . . . . . . . . . . . . . . . . . . 31
9.2 Sensors . . . . . . . . . . . . . . . . . . . . . . . . . . 31
9.3 Calibration . . . . . . . . . . . . . . . . . . . . . . . . 31
10 Declaration of Conformity 33
ivSRS Sensors 1 INTRODUCTION
1 Introduction
Thank you for choosing METER’s Spectral Reflectance Sensor (SRS).
We designed the SRS for continuous monitoring of Normalized Differ-
ence Vegetation Index (NDVI) and/or the Photochemical Reflectance
Index (PRI) of plant canopies. We intend for the SRS to be low cost,
easily and quickly deployable, and capable of reliable operation over
years. NDVI and PRI are used by researchers to monitor canopy
biomass, leaf area, phenology (green up and senescence), biomass
production, and light use efficiency, among other variables. This
manual will help you understand the sensor features and how to use
this device successfully.
1.1 Customer Support
If you ever need assistance with your sensor, have any questions or
feedback, there are several ways to contact us. METER has Cus-
tomer Service Representatives available to speak with you Monday
through Friday, between 7 am and 5 pm Pacific time.
Note: If you purchased your sensor through a distributor, please con-
tact them for assistance.
Email:
support.environment@metergroup.com or
sales.environment@metergroup.com
Phone:
509-332-5600
Fax:
509-332-5158
If contacting us by email or fax, please include as part of your mes-
sage your instrument serial number, your name, address, phone, fax
number, and a description of your problem or question.
11 INTRODUCTION SRS Sensors
1.2 About This Manual
Please read these instructions before operating your sensor to ensure
that it performs to its full potential.
1.3 Warranty
The sensor has a 30-day satisfaction guarantee and a one-year war-
ranty on parts and labor. Your warranty is automatically validated
upon receipt of the instrument.
1.4 Seller’s Liability
Seller warrants new equipment of its own manufacture against de-
fective workmanship and materials for a period of one year from the
date of receipt of equipment.
Note: We do not consider the results of ordinary wear and tear,
neglect, misuse, or accident as defects.
The Seller’s liability for defective parts shall in no event exceed the
furnishing of replacement parts “freight on board” the factory where
originally manufactured. Material and equipment covered hereby
which is not manufactured by Seller shall be covered only by the
warranty of its manufacturer. Seller shall not be liable to Buyer for
loss, damage or injuries to persons (including death), or to property
or things of whatsoever kind (including, but not without limitation,
loss of anticipated profits), occasioned by or arising out of the instal-
lation, operation, use, misuse, nonuse, repair, or replacement of said
material and equipment, or out of the use of any method or process
for which the same may be employed. The use of this equipment
constitutes Buyer’s acceptance of the terms set forth in this war-
ranty. There are no understandings, representations, or warranties
of anykind, express, implied, statutory or otherwise (including, but
without limitation, the implied warranties of merchantability and
fitness for a particular purpose), not expressly set forth herein.
2SRS Sensors 2 ABOUT SRS
2 About SRS
2.1 Overview
The SRS are two-band radiometers we designed to measure either in-
cident or reflected radiation in wavelengths appropriate for calculat-
ing the Normalized Difference Vegetation Index (NDVI) or the Pho-
tochemical Reflectance Index (PRI). They are designed to be an al-
ternative to more complex and costly spectrometers. The SRS sensor
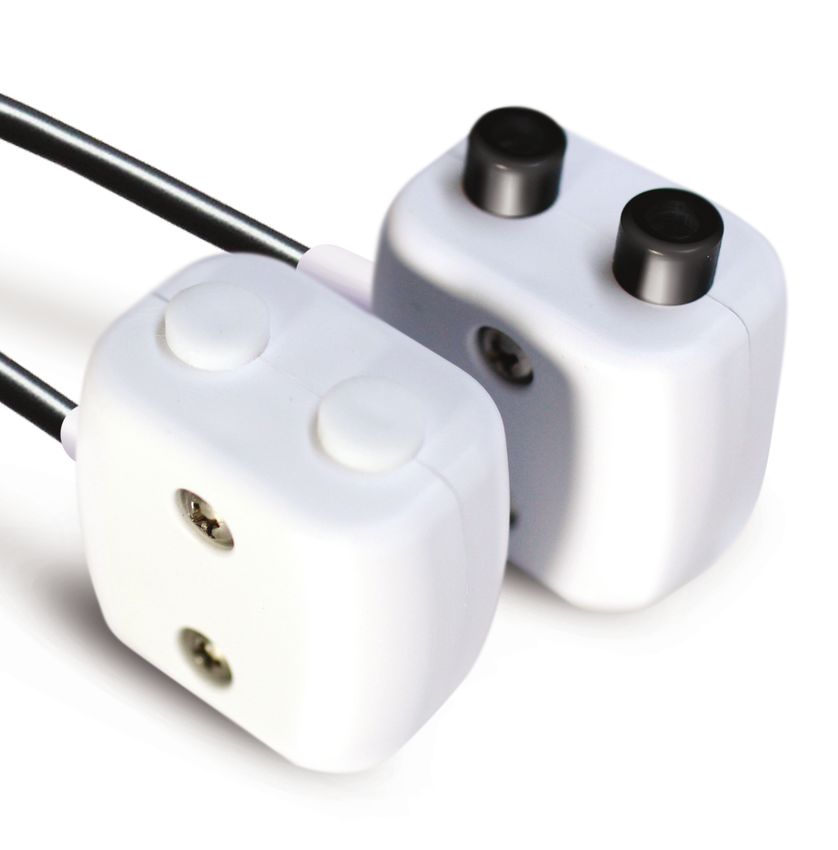
comes in four different versions: NDVI-hemispherical (Ni), NDVI-
field stop (Nr), PRI-hemispherical (Pi) and PRI-field stop (Pr). The
hemispherical versions (Figure 1) are built with Teflon diffusers for
making cosine-corrected measurements, with a hemispherical 180◦
FOV, and are primarily designed for up looking measurements of in-
cident radiation. The field stop versions (Figure 2) have a field of
view restricted to 36◦ (18◦ half angle) and are designed for pointing
downward to measure canopy reflected radiation.
Calculating NDVI or PRI requires knowing both incoming and re-
flected radiation. Unlike the reflected radiation, the incoming radia-
tion is spatially uniform above the canopy. So, you only need one up
facing radiometer to compute the vegetation indices for many down
facing radiometers that are within the same general area. The up
looking radiometer must be leveled and have a hemispherical field of
view.
The SRS is a digital sensor. Its outputs follow the SDI-12 standard.
The SRS is best suited for use with METER’s data loggers. How-
ever, customers can use the SRS with other loggers, such as those
from Campbell Scientific.
32 ABOUT SRS SRS Sensors
Figure 1: Hemispherical Version Figure 2: Field Stop Version
2.2 Specifications
Accuracy: 10% or better for spectral irradiance and radiance values
Measurement Time: < 600 ms
NDVI Wavebands: 650 and 810 nm central wavelengths, with 10
nm full width half maximum band widths
PRI Wavebands: 532 and 570 nm central wavelengths, with 10 nm
full width half maximum band widths
Field of View: Hemispherical version: 180◦ full angle, Field stop
version: 36◦ full angle (18◦ half angle)
Dimensions: 43 x 40 x 27 mm
Weight: 47 g (sensor), 170 g (sensor with 5 m cable)
Power Requirements: 3.6 to 15 V DC, 4 mA (reading, 600 ms) 30
µA (quiescent)
Operating Temperature: −40 to 50 ◦ C
Connector Types: 3.5 mm (stereo) plug or stripped & tinned lead
wires (Pigtail)
Cable Length: 5 m standard
Other Features:
4SRS Sensors 2 ABOUT SRS
• SDI-12 digital sensor, compatible with METER data log-
gers and CSI loggers
• In-sensor storage of calibration values
• Four versions
Ni - NDVI hemispherical
Nr - NDVI field stop
Pi - PRI hemispherical
Pr - PRI field stop
• NIST traceable calibration to known spectral radiance or
irradiance values
• Sensors can be mounted facing up or down, singly or in
tandem, leveled or aimed
• Sensor body and electronics are fully sealed from the ele-
ments and UV resistant to minimize drift over time
53 THEORY SRS Sensors
3 Theory
METER designed the SRS to measure NDVI and PRI vegetation in-
dices from plant canopies. We caution users that NDVI and PRI are
derived from measurements of radiation reflected from canopy sur-
faces, and therefore provide only indirect or correlative associations
with several canopy variables of interest and should not be treated
as direct measurements of these variables.
NDVI has a well-established and long history of use in remote sens-
ing research and ecological applications related to canopy structure.
PRI, while showing great promise for quantifying canopy physiolog-
ical function, is far more experimental with new uses and caveats
continually being discovered. While NDVI and PRI can be power-
ful tools for inferring structure and function of plant canopies, you
must take into account their limitations when interpreting the data.
Section 3 provides an overview of the theory and discusses some of
the uses and limitations of each vegetation index.
3.1 Normalized Difference Vegetation Index (NDVI)
A number of nondestructive methods exist for remotely monitoring
and quantifying certain canopy characteristics. Some of those char-
acteristics are: foliar biochemistry and pigment content, leaf area
index (LAI, Nguy-Robinson et al., 2012), phenology, and canopy
photosynthesis (Ryu et al., 2010). One nondestructive method in-
volves measuring NDVI. The underlying principle of NDVI derives
from a well known concept that vegetation reflects light differently in
the visible spectrum (400 to 700 nm) compared to the near infrared
(> 700 nm).
Green leaves absorb light most strongly in the visible spectrum, es-
pecially at red wavelengths, but are highly reflective in the near in-
frared region (Figure 3). Because bare soil, detritus, stems, trunks,
branches, and other non-photosynthetic elements show relatively lit-
tle difference in reflectance between the visible and near infrared,
measuring the difference between reflectance in these two bands can
be related to the amount green vegetation in the field of view of a ra-
6SRS Sensors 3 THEORY
diometer. See Royo and Dolors (2011) for an extensive introduction
to using spectral indices for plant canopy measurements.
Figure 3: Reflectance spectra for bare soil (Soil) and a healthy
wheat crop at various stages of development: heading (H), anthesis
(A), milk-grain stage (M), and post maturity (PM). Consider two
things about this figure: First, the considerable difference between
reflectance spectra from the soil and all stages of plant
development. Second, the changes in the visible spectra as the
canopy matures and senesces. Figure reproduced with permission
from Royo and Dolors (2011).
Calculate NDVI as:
ρN IR − ρred
N DV I = (1)
ρN IR + ρred
where, ρred and ρN IR are percent reflectances in the red and near
infrared (NIR). We assume percent reflectance to be the ratio of
reflected to incident radiation in the specified waveband. A detailed
description of how to calculate reflectances from measured radiation
values is provided in equation number 4.
73 THEORY SRS Sensors
3.2 Estimating LAI
NDVI has been shown to correlate well with green LAI, although
the relationship is crop- or canopy-specific. For example, Aparicio et
al. (2002) studied NDVI versus LAI in more than twenty different
durum wheat genotypes in seven experiments over two years and
found the relationship shown in Figure 4. Nguy-Robinson (2012)
also studied the behavior of NDVI versus LAI in maize and soybean.
Their data suggest a similar relationship between the two crops, but
not identical. These relationships have been developed for a wide
range of crop and natural canopies and we encourage our customers
to seek out the best relationship for their application.
Figure 4: Relationship between leaf area index and NDVI for 20-25
durum wheat genotypes studied over two years in seven different
experiments by Aparicio et al. (2002). Values shown were taken at
anthesis and milk-grain stage. Used with permission from author.
3.3 Fractional Interception of Photosynthetically Ac-
tive Radiation
The use of NDVI for determination of leaf area index has limitations.
Like many nondestructive techniques (e.g., hemispherical photogra-
8SRS Sensors 3 THEORY
phy and ceptometer techniques), the measurement of NDVI becomes
less and less sensitive as LAI increases above a certain point (Figure
4). Nguy-Robinson et al. (2012) suggest changes in LAI are difficult
to detect when LAI is much greater than 3 m2 m−2 . This should
not be surprising considering the spectral measurement being made.
NDVI measurements rely on reflected light from leaf surfaces. As
the canopy fills and upper leaves begin to cover lower leaves, the leaf
area will continue to increase without making a further contribution
to reflected radiation. Furthermore, foliar chlorophyll is a very effi-
cient absorber of radiation in red wavelengths so that reflectance from
leaves is typically very low in the red region ( Figure 3). Therefore,
increasing LAI, and thus canopy chlorophyll content, does not sub-
stantially change red reflectance beyond a certain point. For these
reasons NDVI has limited predictive ability in canopies with high
LAI. For some applications, however, NDVI saturation at high LAI
may not be as important as it would appear.
Although NDVI may have limited sensitivity when LAI is high,
shaded leaves tend to have much less impact on light capture com-
pared to sunlit leaves, and therefore contribute proportionally less to
canopy productivity. As a general modeling parameter, an estimate
of sunlit leaves may be adequate for estimating photosynthesis and
biomass accumulation (i.e., carbon uptake) for some applications.
Monteith (1977) proposed the now well-known relationship between
biomass accumulation and radiation capture seen in equation 2.
An , canopy = fs St (2)
In equation 2, An,canopy is the biomass accumulation or carbon assim-
ilation and is a conversion efficiency often referred to as light use ef-
ficiency (LUE). The LUE depends on a variety of factors such as pho-
tosynthetic acclimation, physiological stress level, and plant species.
fs is the fractional interception of radiation by the canopy, and St
is the total incident radiation. The relationship between NDVI and
LAI in Nguy-Robinson et al. (2012) and the relation between frac-
tional interception and LAI (Campbell and Norman, 1998) show that
NDVI and fractional interception are approximately linearly related
(Figure 5). Even when LAI is high, NDVI can provide a good es-
timate of the fractional interception by green leaves in a canopy; a
value that is critical for carbon assimilation models.
93 THEORY SRS Sensors
Figure 5: Relationship between fractional canopy interception and
NDVI, where NDVI is converted to LAI using Nguy-Robinson et al.
(2012). Campbell and Norman (1998) give the relationship between
LAI and fractional interception.
3.4 Canopy Phenology
Like all spectral measurements, NDVI is an indirect measurement.
Over the years, researchers have correlated NDVI to several param-
eters of interest, like LAI and f s, biomass, and canopy productiv-
ity, among others. Two of these variables are the focus of Ryu et
al. (2010), who used an NDVI sensor, similar to the SRS-NDVI, to
measure canopy phenology and associated changes in photosynthesis
in an annual grassland over a four year period. Ryu et al (2010).
show an exponential relationship between NDVI and canopy photo-
synthesis, but found that the LAI of grassland never increases above
2.5 m2 m−2 . Ecosystem phenology can also be tracked in the time
series data from their NDVI sensor with errors on the order of a
few days. It should be noted that they filtered their data by lim-
iting NDVI measurements to a particular sun elevation angle (e.g.,
sampling under identical sun zenith and azimuth angles from day to
day).
10SRS Sensors 3 THEORY
3.5 Photochemical Reflectance Index (PRI)
As described above, researchers use NDVI primarily as a proxy for
canopy structural variables. Although structural properties are crit-
ical, sometimes it is useful to have information about canopy func-
tional properties. For example, estimating gross primary productiv-
ity (GPP) of ecosystems is critical for modeling the global carbon
balance. The simple model presented in Equation 2 can be used to
predict GPP from three variables: incident light (St ), intercepted
light (fs ), and light use efficiency (). St can generally be estimated
depending on geographic location and time of day or measured with
a PAR sensor or pyranometer. Considering the near linear relation-
ship between NDVI and fractional interception noted above, a simple
two-band spectral reflectance sensor like the SRS-NDVI can provide
an estimate of fs . The light use efficiency term () remains to be
quantified in order to make accurate predictions of GPP.
Gamon et al. (1990, 1992) proposed a dual band vegetation index
(similar to the NDVI) that could be used to estimate . The founda-
tion of the measurement is based on the absorbance of xanthophyll
pigments in a fairly narrow spectral region around 532 nm. The xan-
thophyll cycle signal seen in reflectance at 532 nm has been shown
to be well correlated with LUE in many plant species (Gamon et al.,
1997).
The Photochemical Reflectance Index (PRI) uses reflectance at 532
nm and is calculated using Equation 3.
ρ532 − ρ570
P RI = (3)
ρ532 + ρ570
where, ρ532 and ρ570 are percent reflectances at 532 and 570 nm, re-
spectively.
In addition to LUE, PRI has also been shown to correlate with nu-
merous other physiological variables associated with plant photosyn-
thetic performance from the leaf to the ecosystem levels (Gamon et
al., 1992, 1997, 2001). Numerous studies correlate PRI to various
ecophysiological variables including the epoxidation state of xantho-
phyll, maximum photochemical efficiency of photosystem II, effective
113 THEORY SRS Sensors
quantum yield, maximum photosynthesis rate, electron transport un-
der saturating light, non-photochemical quenching, and chlorophyll
to carotenoid content ratio (Sims & Gamon, 2002; Garrity et al.,
2011; Garbulsky et al., 2011; Porcar-Castell et al., 2012). Garbul-
sky et al. (2011) and Porcar-Castell et al. (2012) provide excellent
overviews of what has been done with PRI including analyses of PRI
correlations with several of these variables at the leaf, canopy, and
ecosystem levels. We encourage our customers to use these references
as a starting resource.
3.6 Sun-Sensor-Surface Geometry Considerations
It is not uncommon for a time series of NDVI or PRI to contain high
amounts of variability due to changing environmental and observa-
tion conditions. Spectral reflectance measurements are inherently
variable due to radiation source, reflecting surface, and sun-sensor-
surface geometry. Sometimes NDVI and/or PRI values exhibit er-
ratic behavior due to changing environmental conditions. Some level
of data filtering (e.g., visual inspection for short time series or au-
tomated despiking and smoothing algorithms for longer time series)
may be required to remove spurious data points, including cleaning
up points that result in indeterminate or undefined results from the
NDVI or PRI calculation. Consider the NDVI time series shown in
Figure 6a. These data were collected from a corn canopy planted
in June. The data sampling interval was five minutes. There are
several things to notice:
12SRS Sensors 3 THEORY
Figure 6: NDVI data collected at five minute intervals from a corn
canopy. B) Daily mean NDVI (blue circles) and smoothed daily
NDVI (red line), substantially reduce the high frequency variability
in the original NDVI time series.
1. Toward the beginning of the time series, NDVI data increase
until plateauing in early July, when canopy closure occurred.
2. There is a significant amount of high frequency variability, mak-
ing it difficult to see this pattern clearly.
3. One source of data variability is due to sun-sensor-surface ge-
ometry. A concave diurnal pattern of NDVI is normal, and is
caused by the sun moving across the sky each day (Figure 7).
133 THEORY SRS Sensors
Figure 7: A subset of the data displayed in Figure 6, showing a
single day of NDVI data. Notice the concave pattern that is typical
in diurnal NDVI measurements. The concave pattern is due to
changing sun-sensor-surface illumination geometry throughout the
day.
4. Calculating daily averages, using values acquired only during
the noon hour, significantly reduces the amount of data vari-
ability (Figure 6b). A smoothing algorithm applied to the daily
averages reduces variability even further. In this example, data
were filtered and averaged by time, but you can also use solar
zenith and azimuth angles to filter you data. For example, Ryu
et al. (2012) sampled across a consistent solar elevation angle
(60) each day, ignoring all other values. Using solar zenith an-
gle as a filter ensures that data from each day are collected
under similar sun-sensor-surface illumination conditions.
5. If you are comparing measurements acquired under different
sun-sensor-surface configurations (e.g., comparing PRI mea-
surements made during the morning and afternoon), it may
be necessary to first calculate a bidirectional reflectance distri-
bution function (BRDF). An empirical BRDF model, derived
from NDVI or PRI measurements and canopy-specific param-
14SRS Sensors 3 THEORY
eters, can be used to reduce variations that arise from changes
in sun-sensor-surface geometry across diurnal time scales. For
additional details on BRDF normalization of vegetation index
time series, see Hilker et al. (2008).
3.7 Calculating Percent Reflectance from Paired Up
and Down Looking Sensors
Equation 1 shows that NDVI is the ratio of the difference to the sum
of NIR and red reflectances. Each reflectance value is the ratio of up-
welling (down looking sensor) to incident (up looking sensor) radiant
flux in each of the wave bands. Calculating this ratio is only possi-
ble when measurements of downwelling and upwelling radiation are
collected simultaneously under the same ambient conditions. Com-
bining measurements made with sensors located long distances apart
is typically not recommended because atmospheric conditions (e.g.,
cloud cover, aerosols) can be highly variable in space. Reasonable
distances between up looking and down looking sensors will depend
on the typical radiation environment of a given location.
It is important to arrange paired up looking and down looking sen-
sors to collect data at the same time to account for temporal vari-
ability in radiation conditions. In cases where multiple down looking
sensors have been deployed within close proximity to each other, it
is only necessary to have one up looking sensor. The measurements
from the single up looking sensor can be combined with the measure-
ments from each of the down looking sensors to calculate reflectances.
In the event that up looking measurements are not available, re-
arrangement of the vegetation index equations allows for a rough
approximation of the measurements. The following derivation is for
NDVI, but similar equations apply to the PRI. If Rn is the reflected
NIR radiation from the canopy, Rr is the reflected red radiation, In
is the incident NIR, and Ir is the incident red, then
Rn /In − Rr /Ir (Ir /In )Rn − Rr αRn − Rr
N DV I = = = (4)
Rn /In + Rr /Ir (Ir /In )Rn + Rr αRn + Rr
153 THEORY SRS Sensors
Where α = Ir /In , equation 4 allows the computation of NDVI from
just the down facing measurements if you know the ratio of red to
NIR spectral irradiance, α. Although not extensively tested, we have
found that this ratio (α = 1.4 for NDVI bands) can be used as a rough
approximation during midday under clear sky conditions. However,
we advise that direct measurements of downwelling radi-ation is more
accurate by accounting for any fluctuations in α that occur with
changes in atmospheric conditions or across large varia-tions in sun
elevation angle.
In the event that you do not want to use the default α value or
if measurements from an up facing sensor are not available, it is pos-
sible to use a Spectralon panel or similar reflectance standard with a
field stop SRS to measure incident irradiance. To measure incident
irradiance with a down facing sensor, place a reflectance standard
within the field of view of the field stop sensor, making sure that the
reflectance panel is uniformly illuminated and that the field of view
of the sensor is fully within the area of the reflectance panel. Mea-
surements obtained from field stop sensors pointed at the reflectance
panel must be multiplied by π to convert radiance values to irradi-
ance values. Irradiance values can then be used in Equation 4 or to
calculate α directly.
References
Aparicio, N., Villegas, D., Casadesus, J., Araus, J.L., and Royo,
C., (2000). Spectral vegetation indices as nondestructive tools for
determining durum wheat yield. Agronomy Journal, 92: 83-91.
Aparicio, N.; Villegas, D.; Araus, J.L.; Casadess, J.; Royo, C.,
(2002). Relationship between growth traits and spectral reflectance
indices in durum wheat. Crop Science, 42: 1547-1555.
Campbell, G.S. and Norman, J.M., (1998). An Introduction to En-
vironmental Biophysics. Springer-Verlag. New York.
Gamon, J.A., Field, C.B., Bilger, W., Bjorkman, O., Fredeen, A.L.,
Penuelas, J., (1990). Remote sensing of the xanthophylls cycle and
16SRS Sensors 3 THEORY
chlorophyll fluorescence in sunflower leaves and canopies. Oecologia,
85: 1-7.
Gamon, J.A., Peuelas, J., Field, C.B., (1992). A narrow-waveband
spectral index that tracks diurnal changes in photosynthetic effi-
ciency. Remote Sensing of Environment, 41: 35-44.
Gamon, J. A., Serrano, L., Surfus, J. S., (1997). The photochemical
reflectance index: an optical indicator of photosynthetic radiation
use efficiency across species, functional types, and nutrient levels.
Oecologia, 112: 492-501.
Gamon, J. A., Field, C. B., Fredeen, A. L., Thayer, S., (2001). As-
sessing photosynthetic downregulation in sunflower stands with an
optically based model. Photosynthesis Research, 67: 113-125.
Garbulsky, M.F., Peuelas, J., Gamon, J., Inoue, Y., Filella, Y. (2011).
The photochemical reflectance index (PRI) and the remote sensing
of leaf, canopy and ecosystem radiation use efficiencies: A review and
meta-analysis. Remote Sensing of the Environment, 115: 281-297.
Garrity, S.R., Vierling, L.A., Bickford, K., (2010). A simple filtered
photodiode instrument for continuous measurement of narrowband
NDVI and PRI over vegetated canopies. Agricultural & Forest Me-
teorology, 150: 489-496.
Garrity, S. R., Eitel, J. U. H., Vierling, L. A., (2011). Disentan-
gling the relationships between plant pigments and the photochemi-
cal reflectance index reveals a new approach for remote estimation of
carotenoid content. Remote Sensing of Environment, 115: 628-635.
Hilker, T., Coops, N. C., Hall, F. G., Black, T. A., Wulder, M.
A., Nesic, Z., Krishnan, P., (2008). Separating physiologically and
directionally induced changes in PRI using BRDF models. Remote
Sensing of Environment, 112: 2777-2788.
Monteith, J.L., (1977). Climate and the efficiency of crop production
in Britain. Philosophical Transactions Royal Society of London B,
173 THEORY SRS Sensors
281: 277-294.
Nguy-Robertson, A. Gitelson, A., Peng, Y., Via, A., Arkebauer, T.,
and Rundquist, D., (2012). Green leaf area index estimation in maize
and soybean: Combining vegetation indices to achieve maximal sen-
sitivity. Agronomy Journal, 104: 1336-1347.
Porcar-Castell, A., Garcia-Plazaola, J. I., Nichol, C. J., Kolari, P.,
Olascoaga, B., Kuusinen, N., Fernndez-Marn, B., Pulkkinen, M., Ju-
urola, E., Nikinmaa, E., (2012). Physiology of the seasonal relation-
ship between the photochemical reflectance index and photosynthetic
light use efficiency. Oecologia, 170: 313-323.
Royo, C. and Villegas, D., (2011). Field Measurements of Canopy
Spectra for Biomass Assessment of Small-Grain Cereals, Biomass -
Detection, Production and Usage, Darko Matovic (Ed.), ISBN: 978-
953-307-492-4, InTech, Available from: http://www.intechopen.com/bo
oks/biomass-detection-production-and-usage/field-measurements-of-
canopy-spectra-for-biomass-assessment-of-small-grain-cereals.
Ryu, Y., Baldocchi, D.D., Verfaillie, J., Ma, S., Falk, M., Ruiz-
Mercado, I., Hehn, T., Sonnentag, O., (2012). Testing the perfor-
mance of a novel spectral reflectance sensor, built with light emit-
ting diodes (LEDs), to monitor ecosystem metabolism, structure and
function. Agricultural & Forest Meteorology, 150: 1597-1606.
Sims, D. A., Gamon, J. A., (2002). Relationships between leaf pig-
ment content and spectral reflectance across a wide range of species,
leaf structures and developmental stages. Remote Sensing of Envi-
ronment, 81: 337-354.
18SRS Sensors 4 FIELD INSTALLATION
4 Field Installation
The SRS is designed to be light weight, weatherproof, consume low
power, and have a small size so that it can be deployed virtually
anywhere with relative ease. Because the SRS measures incident
and reflected radiation it must be mounted above the plant canopy.
For example, the SRS can be mounted to a post, pole, tripod, tower,
or other similar infrastructure that extends above the canopy. When
measuring incident radiation with a hemispherical view SRS, be sure
that the sensor’s view of the sky is unobstructed. This is easiest
done by placing the sensor above the canopy, however, it may also be
achieved by placing the hemispherical sensor in a large canopy gap or
forest clearing. Field stop sensors should also generally be mounted
above a canopy, but there may be instances where an oblique or
side-view of a canopy is more practical than trying to get the sensor
above the top of the canopy.
The field stop and hemispherical versions can both be used to quan-
tify canopy reflected radiation. The correct choice of sensor will
depend on the objectives of the study. The hemispherical sensor
has a ground instantaneous field of view (GIFOV) of 180◦ (full an-
gle), and will do a better job of averaging reflected radiation over a
broad area. When using hemispherical view sensors in a down-facing
orientation, extreme care should be taken to mount the sensor per-
fectly horizontal so that the sensor does not ”see” any sky above the
horizon. The field stop sensor can be aimed at a particular spot or
have a particular orientation, giving the user more control over what
portion of the canopy is being measured. When using the field stop
sensor in an off-nadir orientation, the user should be careful that the
sensor is not pointed above the horizon.
For most applications the field stop SRS is the most appropriate
sensor for acquiring down-facing measurements because it allows for
more control of the measurement area. For example, in an open
canopy woodland, the field stop sensor can be directed at a tree
194 FIELD INSTALLATION SRS Sensors
rather than the vegetation in the inter-spaces. The GIFOV of a field
stop SRS that is mounted in the nadir position (i.e., looking straight
down) is determined by two factors: the angular field of view (which
is fixed at 18◦ (half angle)) and the height of the sensor above the
canopy.
GIF OV = 2 ∗ (tan(18) ∗ h) (5)
where h is the height of the sensor above the canopy. Consider a sen-
sor mounted 2 m above a canopy. The GIFOV would be 2*(tan(18)*2 ),
which equals a 1.3 m diameter circle.
If the field stop sensor is pointed off-nadir (no longer facing straight
down) then the GIFOV becomes elliptical. When using the SRS in
an off-nadir view angle, be sure that the field of view does not go
above the horizon. For help in calculating the FOV, you can use the
simple calculator from Apogee found at:
https://www.apogeeinstruments.com/irr-calculators/
Note: You should use the 18 degree half angle in the calculation
20SRS Sensors 5 CONNECTING THE SRS
5 Connecting the SRS
5.1 Connecting to METER Data Logger
The SRS is most easily used with METER’s data loggers. SRS sen-
sors can also be used with other SDI-12 enabled data loggers, such as
those from Campbell Scientific, Inc. The SRS requires an excitation
voltage in the range of 3.6 to 15 volts.
To download data to your computer from a METER logger, you
will need to install one of our Utility programs or other METER
software on your computer. Make sure you have the latest logger or
data reader firmware to support your SRS sensor.
Note: Please check your software version to ensure it will support
the SRS. To update your software to the latest versions, please visit
METER’s website at http://www.metergroup.com.
To use the SRS with your METER data logger, simply connect the
stereo plug to one of the ports on the data logger and use either our
Utility application or other METER software software to configure
that port for the SRS and set the measurement interval. See data
logger manual and quick start guide for more instructions.
METER data loggers have a threshold logging frequency. When
you set the logging interval to greater than this threshold on any
METER logger, reported readings are automatically averaged using
data sampled from the sensor at the threshold intervals. Users need
to be cautious when choosing a sampling interval with SRS sensors
connected to a METER logger, so that the averaging feature does not
result in erroneous measurement. For example, if you desire only one
reading per day and you select 24 hours as the measurement interval,
then each 24 hour reading will be an average of values recorded over
the previous 1,440 minutes, including periods during the night. To
avoid such errors, we recommend you log data from the SRS sensors
more frequently (e.g. 5-15 minutes), even if you are not using all
logged data.
215 CONNECTING THE SRS SRS Sensors
If customers require logging intervals shorter than our logging thresh-
old, then they must use a Campbell Scientific or similar logger capa-
ble of recording data at the desired frequency.
5.2 3.5 mm Stereo Plug Wiring
The SRS for METER loggers ships with a 3.5 mm stereo plug con-
nector. The stereo plug allows for rapid connection directly to ME-
TER’s data loggers. Figure 8 shows the wiring configuration for this
connector.
Figure 8: 3.5 mm Stereo Plug Wiring
5.3 Connecting to a Non-METER Logger
Customers may purchase the SRS for use with non-METER data
loggers. These sensors typically come configured with stripped and
tinned (pigtail) wires for use with SDI BUS terminals. Refer to your
particular logger manual for details on wiring. Our integrator’s guide
gives detailed instructions on connecting the SRS to non-METER
loggers. Please visit http://www.metergroup.com for the complete
Integrator’s guide.
22SRS Sensors 5 CONNECTING THE SRS
5.4 Pigtail End Wiring
Figure 9: Pigtail End Wiring
Note: Some SRS sensors may have the older Decagon wiring scheme
where the power supply is white, the digital out is red, and the bare
wire is ground.
Connect the wires to the data logger as Figure 10 shows. Connect the
supply wire (brown) to the excitation, the digital out wire (orange)
to a digital input, and the bare ground wire to ground.
Figure 10: Pigtail End Wiring to Data Logger
Note: The acceptable range of excitation voltages is from 3.6 to 15
VDC. If you wish to read the SRS with the Campbell Scientific Data
Loggers, you will need to power the sensors off of a 12 V or switched
12 V port.
If your SRS is equipped with the standard 3.5 mm plug, and you
235 CONNECTING THE SRS SRS Sensors
wish to connect it to a non-METER data logger, use one of the fol-
lowing two options.
Option 1
1. Clip off the stereo plug connector on the sensor cable
2. Strip and tin the wires.
3. Wire it directly into the data logger.
This option has the advantage of creating a direct connection and
minimizes the chance of the sensor becoming unplugged. However,
it then cannot be easily used in the future with a METER readout
unit or data logger.
Option 2
Obtain an adapter cable from METER.
The adapter cable has a connector for the stereo plug connector on
one end and three wires (or pigtail adapter) for connection to a data
logger. The stripped and tinned adapter cable wires have the same
termination as in Figure 10; the brown wire is excitation, the orange
is output, and the bare wire is ground.
Note: Be extra careful to secure your stereo to pigtail adapter con-
nections to ensure that sensors do not become disconnected during
use.
24SRS Sensors 6 COMMUNICATION
6 Communication
The SRS communicates using SDI-12 and DDI Serial protocols. This
chapter discusses the specifics of SDI-1 Communication. For more
information, please visit http://www.metergroup.com for an Integra-
tor’s guide that gives more detailed explanations and instructions.
6.1 SDI-12 Communication
The SRS communicates using the SDI-12 and DDI Serial protocols,
a three-wire interface where all sensors are powered (brown wire),
grounded (bare wire) and communicate (orange wire) on shared wires
(for more info, go to our Knowledge Base article on SDI-12).
The SDI-12 protocol requires that each sensor have a unique ad-
dress when connected to the same digital port. The SRS comes from
the factory with an SDI-12 address of 0. To add more than one
SDI-12 sensor to a system, the sensor address must change. Address
options include 0-9, A-Z, a-z. There are two ways to set the SDI-12
sensor address. The best and easiest is to use METER’s ProCheck
(if the option is not available on your ProCheck, please upgrade to
the latest version of firmware).
Campbell Scientific data loggers, like the CR10X, CR1000, CR3000,
among others, also support SDI-12 Communication. Direct SDI-12
communication is supported in the “Terminal Emulator” mode un-
der the “Tools” menu on the “Connect” screen. Detailed information
on setting the address using CSI data loggers can be found on our
website at http://www.metergroup.com.
The sensor can be powered using any voltage from 3.6 to 15 VDC.
The SDI-12 protocol allows the sensors to be continuously powered,
so the power (brown wire) can be connected to a continuous 12 VDC
source. However, the sensor can also be used with a switched 12 V
source. This can help reduce power use (although the SRS uses very
little power, 0.03 mA quiescent) and will allow the sensor array to
be reset if a problem arises.
256 COMMUNICATION SRS Sensors
Reading the SRS in SDI-12 mode using a CSI datalogger requires
a function call. An example program from CRBasic can be found on
our website at http://www.metergroup.com.
26SRS Sensors 7 UNDERSTANDING DATA OUTPUTS
7 Understanding Data Outputs
7.1 Using METER’s Data Loggers
Each SRS sensor generates multiple outputs when connected to a
METER data logger. The exact outputs will in part depend on
how many and what type of SRS sensors are attached to the data
logger. All SRS sensors are equipped with an internal tilt sensor. The
orientation of the SRS, and therefore the tilt sensor, will determine
the output from each sensor.
7.1.1 Up Looking Sensor Outputs
For any hemispherical s ensor oriented i n t he uplooking position, out-
−
puts will i nclude t he calibrated s pectral i rradiance ( W m−2 nm 1) and
α, where α i s t he r atio of 650 nm t o 810 nm f or NDVI s ensors and
570 nm t o 532 nm f or PRI s ensors. See Equation 4 f or f urther details
on α.
7.1.2 Down Looking Sensor Outputs
When hemispherical or field s top s ensors are mounted i n a down-
looking orientation, outputs i nclude t he calibrated s pectral r adiance
− −
(W m−2 nm 1 s r 1) of each band and either NDVI or PRI. I f both up
looking and down l ooking s ensors of t he s ame variety ( e.g., up
looking hemispherical NDVI and down l ooking field s top NDVI) are
connected t o t he s ame data l ogger t hen α f rom t he up l ooking s ensor
is combined with t he s pectral r adiance values f rom t he down l ooking
sensor t o calculate t he vegetation i ndex, using Equation 4. I n t he
event t hat only down l ooking s ensors are connected t o a data l ogger,
then either t he default or t he user-specified s tatic α value, i s used t o
calculate t he vegetation i ndex. Based on observations collected near
Pullman, WA ( 46◦45’0”N, 117◦09’6”W), default α values have been s et
to 0.98 and 1.86 f or PRI and NDVI, r espectively. Note t hat actual
values of α will change depending on atmospheric conditions and s un
angle, s o users are encouraged t o measure α with an up l ook-ing
hemispherical s ensor. I n t he event t hat nearby up l ooking and
277 UNDERSTANDING DATA OUTPUTS SRS Sensors
down looking sensors are connected to different data loggers, you can
export tabular data as Excel files and manually combine α from the
up looking sensor with the spectral radiance values from the down
looking sensor to calculate NDVI or PRI.
When manually calculating NDVI or PRI, the manually calculated
values may not perfectly match the NDVI or PRI values calculated
by Em50 series data loggers. At high radiation intensities (mid-
day), when spectral reflectance indices are most useful, the calculated
values will be very close. But, at lower radiation intensities, rounding
differences caused by the data logger data storage scheme become
significant, and will lead to noticeable differences between manually
calculated and data logger calculated NDVI and PRI. In many cases,
spectral reflectance data during low intensity periods (low sun angles)
are not as meaningful as those at higher intensities, but if data from
low radiation intensity periods are desirable, manual calculation of
the spectral reflectance index will result in best possible precision.
Note that these differences should not be present in EM60, ZL6, and
future data logger offerings from METER. Contact METER Support
for more details support.environment@metergroup.com.
7.2 Using other data loggers
When connected to non-METER data loggers (e.g., Campbell Sci-
entific) sensors will output the calibrated spectral irradiance or ra-
diance from each band and an orientation value from the tilt sensor.
Spectral irradiance and radiance are output as radiant fluxes (in W
m−2 nm−1 or W m−2 nm−1 sr−1 ) for the shorter and then the longer
wavelength sensor. Tilt sensor readings are output as a single value
between 0 and 2, with 0 indicating an indeterminate orientation, 1
indicating a down facing orientation, and 2 indicating an up facing
orientation. Additional information about using the SRS with non-
METER data loggers can be accessed at www.metergroup.com. For
additional information about connecting your SRS to non-METER
data loggers, see Section 5.3.
28SRS Sensors 8 INSTALLING THE SRS
8 Installing the SRS
8.1 Attaching and Leveling
The SRS comes with a variety of mounting hardware, allowing it to
be mounted on poles, tripods, towers, etc. The mounting hardware
allows for vertical adjustment and orientation on the pole and allows
for sensor tilt. Up-facing sensors have Teflon diffusers and measure
radiation from the entire upper hemisphere. The sensor therefore
needs to be leveled and mounted in a location where it will not be
shaded and has an unobstructed view of the sky.
For down-facing sensors, the SRS can be mounted any distance from
the canopy, but it is important to keep in mind that the influence of
individual plants on the reading increases as the sensor gets closer
to the canopy. Distance from the canopy also determines the size of
the SRS sample area (Equation 5)
You may use hemispherical sensors in a down facing orientation,
but make sure to mount them facing directly down so they are not
”seeing” sky. The influence of the mounting infrastructure and sky
can be avoided by using field stop radiometers. Field stop sensors
average over just the area within the field of view where you aimed
them. Assure that the area they see is representative and carefully
choose the view angle and azimuth. When the view angle is directly
away from the sun the sensor sees mostly sunlit leaves. If it points
perpendicular to the sun rays the sensor will see an increased fraction
of shadow.
Note: Field stop sensors are intended for measuring canopy-reflected
radiation and should not be mounted in an up facing orientation.
8.2 Cleaning and Maintenance
Optical surfaces need to be kept clean and free from contaminants.
We recommend that you occasionally inspect the Teflon diffusers and
field stop cavities to make sure that they are free from dust, insect
nests, bird droppings or other debris. The Teflon diffusers can be
298 INSTALLING THE SRS SRS Sensors
cleaned with a soft, damp cloth. Field stops can be cleaned with
compressed air or cotton swabs. Do not use any type of volatile
solution when cleaning the field stops since they can damage the op-
tical interference filters. Outer surfaces of your SRS can be cleaned
a soft damp cloth as necessary. In the event that your SRS optics
become extremely soiled it may be necessary to return to the factory
for cleaning and re-calibration. See section 9.3 for more details on
SRS calibration.
30SRS Sensors 9 TROUBLESHOOTING
9 Troubleshooting
Any problem with the SRS will most likely manifest as failed com-
munication or erroneous readings. Before contacting METER about
the sensor, please check these troubleshooting steps.
9.1 Data Logger
1. Check to make sure the connections to the data logger are both
correct and secure.
2. Ensure that your data logger batteries are not dead or loose.
3. Check the configuration of your data logger to make sure you
have selected the correct SRS version (NDVI or PRI, “i” or
“r”).
4. If using METER loggers make sure that you are using the cor-
rect versions of logger firmware and software.
9.2 Sensors
1. Ensure that you install the sensors according to the “Installa-
tion” section of this manual.
2. Check sensor cables for nicks or cuts that could cause a mal-
function.
3. Check the sensor wavelength intensity results outside or under
a bright light. NDVI or PRI calculations may give no data or
erroneous data at low intensities.
9.3 Calibration
METER Group calibrates the Spectral Reflectance Sensor against a
NIST traceable transfer standard. Details about your sensor calibra-
tion are available upon request. We have a recalibration service avail-
able and recommend that you send in your SRS sensors for recalibra-
tion annually. Contact METER to obtain a Return Material Autho-
319 TROUBLESHOOTING SRS Sensors
rization (RMA) form to send your sensor in for recalibration. Call or
email METER at (509)332-5600 or support.environment@metergroup.com
to arrange for a RMA, or to obtain your sensor calibration informa-
tion.
32SRS Sensors 10 DECLARATION OF CONFORMITY
10 Declaration of Conformity
Application of Council Directive: 2004/108/EC and 2011/65/EU
Standards to which conformity is EN61326-1:2013 and
declared: EN550581:2012
Manufacturer’s Name: METER Group, Inc. USA 2365
NE Hopkins Ct. Pullman, WA
99163 USA
Type of Equipment: Spectral Reflectance Sensor
Model Number: SRS
Year of First Manufacture: 2013
This is to certify that the SRS Spectral Reflectance Sensor, manufac-
tured by METER Group, Inc. USA, a corporation based in Pullman,
Washington, USA meets or exceeds the standards for CE compliance
as per the Council Directives noted above. All instruments are built
at the factory at METER and pertinent testing documentation is
freely available for verification.
33Index
Calibration, 31
CE Compliance, 33
Cleaning, 29
Connecting Sensors
Non-METER Logger, 22
Connecting the Sensors, 21
Contact Information, 1
Customer Support, 1
Declaration of Conformity, 33
Email, 1
Field Installation, 19
Fractional Interception, 8
Installation, 29
Leaf Area Index(LAI), 6
NDVI, 6
Phenology, 10
Photochemical Reflectance Index,
1
Photosynthesis, 10
Pigtail End Wiring, 23
SDI-12 Communication, 25
Seller’s Liability, 2
Specifications, 4
Stereo Wiring 3.5 mm, 22
Troubleshooting, 31
Warranty, 2
34You can also read