MEASUREMENTS OF THE SUNYAEV-ZEL'DOVICH EFFECT IN MACS J0647.7+7015 AND MACS J1206.2-0847 AT HIGH ANGULAR RESOLUTION WITH MUSTANG
←
→
Page content transcription
If your browser does not render page correctly, please read the page content below
The Astrophysical Journal, 809:185 (14pp), 2015 August 20                                                                 doi:10.1088/0004-637X/809/2/185
© 2015. The American Astronomical Society. All rights reserved.

               MEASUREMENTS OF THE SUNYAEV–ZEL’DOVICH EFFECT IN MACS J0647.7+7015 AND
                    MACS J1206.2–0847 AT HIGH ANGULAR RESOLUTION WITH MUSTANG
Alexander H. Young1,2,16, Tony Mroczkowski3,17, Charles Romero4,5, Jack Sayers6, Italo Balestra7, Tracy E. Clarke8,
     Nicole Czakon9, Mark Devlin1, Simon R. Dicker1, Chiara Ferrari10, Marisa Girardi7,11, Sunil Golwala6,
    Huib Intema12, Phillip M. Korngut6, Brian S. Mason4, Amata Mercurio13, Mario Nonino7, Erik D. Reese14,
                               Piero Rosati15, Craig Sarazin5, and Keiichi Umetsu9
        1
            Department of Physics and Astronomy, University of Pennsylvania, 209 South 33rd Street, Philadelphia, PA 19104, USA; alyoung@sas.upenn.edu
                                           2
                                             NASA Goddard Space Flight Center, 8800 Greenbelt Rd, Greenbelt, MD 20771, USA
                                         3
                                           U.S. Naval Research Laboratory, 4555 Overlook Ave SW, Washington, DC 20375, USA
                                      4
                                        National Radio Astronomy Observatory, 520 Edgemont Rd. Charlottesville, VA 22903, USA
                                 5
                                   Department of Astronomy, University of Virginia, P.O. Box 400325, Charlottesville, VA 22901, USA
              6
                Department of Physics, Math, and Astronomy, California Institute of Technology, 1200 East California Blvd, Pasadena, CA 91125, USA
                                        7
                                           INAF—Osservatorio Astronomico di Trieste, Via G. B. Tiepolo 11, I-34143 Trieste, Italy
                                         8
                                           U.S. Naval Research Laboratory, 4555 Overlook Ave SW, Washington, DC 20375, USA
                                  9
                                    Institute of Astronomy and Astrophysics, Academia Sinica, P.O. Box 23-141, Taipei 10617, Taiwan
               10
                  Laboratoire Lagrange, UMR 7293, Université de Nice Sophia-Antipolis, CNRS, Observatoire de la Côte d’Azur, F-06300 Nice, France
                    11
                       Dipartimento di Fisica Dell’Universitá degli Studi di Trieste—Sezione di Astronomia, Via Tiepolo 11, I-34143 Trieste, Italy
                            12
                               National Radio Astronomy Observatory, P.O. Box O, 1003 Lopezville Road, Socorro, NM 87801-0387, USA
                                      13
                                          INAF—Osservatorio Astronomico di Capodimonte, Via Moiariello 16, I-80131 Napoli, Italy
                      14
                         Department of Physics, Astronomy, and Engineering, Moorpark College, 7075 Campus Rd., Moorpark, CA 93021, USA
                               15
                                  Dipartimento di Fisica e Scienze della Terra, Universitá di Ferrara, Via Saragat, 1, I-44122, Ferrara, Italy
                                               Received 2014 November 1; accepted 2015 July 20; published 2015 August 21

                                                                        ABSTRACT
              We present high resolution (9″) imaging of the Sunyaev–Zel’dovich Effect (SZE) toward two massive galaxy
              clusters, MACS J0647.7+7015 (z = 0.591) and MACS J1206.2–0847 (z = 0.439). We compare these 90 GHz
              measurements, taken with the Multiplexed Squid/TES Array at Ninety Gigahertz (MUSTANG ) receiver on the
              Green Bank Telescope, with generalized Navarro–Frenk–White (gNFW) models derived from Bolocam 140 GHz
              SZE data as well as maps of the thermal gas derived from Chandra X-ray observations. We adopt a serial-fitting
              approach, in which gNFW models are first fit to the Bolocam data and then compared to the MUSTANG data to
              determine an overall best-fit model. For MACS J0647.7+7015, we find a gNFW profile with core slope parameter
              γ = 0.9 fits the MUSTANG image with c 2red = 1.005 and probability to exceed (PTE) = 0.34. For
              MACS J1206.2–0847, we find g = 0.7, c 2red = 0.993, and PTE = 0.70. In addition, we find a significant
              (>3σ) residual SZE feature in MACS J1206.2–0847 coincident with a group of galaxies identified in Very Large
              Telescope data and filamentary structure found in a weak-lensing mass reconstruction. We suggest the detected
              sub-structure may be the SZE decrement from a low mass foreground group or an infalling group. Giant
              Metrewave Radio Telescope measurements at 610 MHz reveal diffuse extended radio emission to the west, which
              we posit is either an active galactic nucleus-driven radio lobe, a bubble expanding away from disturbed gas
              associated with the SZE signal, or a bubble detached and perhaps re-accelerated by sloshing within the cluster.
              Using the spectroscopic redshifts available, we find evidence for a foreground (z = 0.423) or infalling group,
              coincident with the residual SZE feature.
              Key words: cosmic background radiation – cosmology: observations –
              galaxies: clusters: individual (MACS J0647.7+7015, MACS J1206.2–0847) –
              galaxies: clusters: intracluster medium – X-rays: galaxies: clusters

                                1. INTRODUCTION                                    formation history and evolution of the cluster as well as its
                                                                                   current dynamical state. Radio observations have discovered
   Clusters of galaxies are the largest gravitationally bound
systems in the universe and encompass volumes great enough                         diffuse synchrotron emission in many galaxy clusters, typically
to be considered representative samples of the universe at large.                  associated with merger-induced shock fronts, turbulence, or
By mass, clusters comprise dark matter (∼85%), hot plasma                          active galactic nucleus (AGN) activity (e.g., van Weeren
known as the intracluster medium (ICM; ∼12%), and a few                            et al. 2011; Cassano et al. 2012). Optical observations reveal
percent stars and galaxies.                                                        the individual galaxy population and, through dynamical and
   The diverse matter content of clusters provides a wide range                    lensing studies, allow us to infer the cluster mass distribution.
of observables across the electromagnetic spectrum. X-ray and                         The SZE is a distortion of the cosmic microwave back-
millimeter-wave Sunyaev–Zel’dovich Effect (SZE) observa-                           ground (CMB) caused by inverse Compton scattering of
tions measure the thermodynamic properties of the ICM, such                        photons off the electrons of the hot ICM trapped in the
as density and temperature, which provides insight into the                        gravitational potential well of clusters. The SZE is directly
                                                                                   proportional to the electron pressure of the ICM integrated
16
     NASA Postdoctoral Fellow.                                                     along the line of sight (Sunyaev and Zel’dovich 1972).
17
     National Research Council Fellow.                                             Measurements of the SZE on small spatial scales in galaxy

                                                                               1
The Astrophysical Journal, 809:185 (14pp), 2015 August 20 Young et al.
Table 1
Cluster Properties
Cluster z R500 P500 M500 kB TX Y500a
(Mpc) (10-3 keV cm-3) (1014 M ) (keV) (10−10 sr)
MACS J0647.7 0.591 1.26 ± 0.06 9.23 ± 2.57 10.9 ± 1.6 11.5 ± 1.1 1.7 ± 0.5
MACS J1206.2 0.439 1.61 ± 0.08 10.59 ± 3.07 19.2 ± 3.0 10.7 ± 1.3 5.5 ± 1.6
Notes. X-ray-derived cluster properties, reproduced from Mantz et al. (2010).
a
Values of Y500 are derived from the values reported in Mantz et al. (2010) using Equation (6).
clusters provide a powerful probe of astrophysical phenomena Table 2
(e.g., Kitayama et al. 2004; Korngut et al. 2011). For reviews of MUSTANG Observation Overview
the SZE and its scientific applications, see Birkinshaw (1999) Cluster Centroid (J2000) Obs. Time Peak ∣ S N∣
and Carlstrom et al. (2002).
R.A. Decl. (hr)
In this work, we present high-resolution SZE measure-
ments of two galaxy clusters, MACS J0647.7+7015 and MACS J0647.7 06:47:50.5 +70:14:53 16.4 8.1
MACS J1206.2–0847, taken with the Multiplexed Squid/ MACS J1206.2 12:06:12.5 −08:48:07 12.1 4.1
TES Array at Ninety Gigahertz (MUSTANG). We carry out a
multi-wavelength investigation using the comprehensive data Note. MUSTANG observations were carried out between 2011 February and
sets provided by the Cluster Lensing and Supernova survey 2013 January.
with Hubble (CLASH) program (Postman et al. 2012).
The X-ray measured properties of MACS J0647.7+7015
(MACS J0647.7) and MACS J1206.2–0847(MACS J1206.8) CL J1226.9+3332, MACS J0717.5+3745, MACS J0744.9
from Mantz et al. (2010) are summarized in Table 1. +3927, and Abell 1835. MUSTANG observations confirmed
The organization of this paper is as follows. In Section 2 we (>13σ) the presence of merger activity in RX J1347.5–1145
discuss the MUSTANG, X-ray, and Bolocam observations and (Mason et al. 2010; Ferrari et al. 2011; Korngut et al. 2011) that
data reduction. In Sections 3 and 4, we discuss the ICM was hinted at by observations with the Nobeyama 45 m
modeling and least-squares fitting procedure used in the telescope (Komatsu et al. 2001) and the 30 m IRAM telescope
analysis of the MUSTANG and Bolocam data. The results (Pointecouteau et al. 1999). Korngut et al. (2011) used
are discussed and summarized in Section 5. Throughout this MUSTANG data to discover a shock in MACS J0744.9
paper, we adopt a flat, Λ-dominated cosmology with WM = 0.3, +3927 that was previously undetected. In MACS J0717.5
WL = 0.7, and H0 = 70 km s−1 Mpc−1 consistent with Planck +3745, Mroczkowski et al. (2012) used MUSTANG data to
results (Planck Collaboration et al. 2014). At the redshifts of report a pressure enhancement due to shock-heated gas
MACS J0647.7+7015 (z = 0.591) and MACS J1206.2–0847 immediately adjacent to extended radio emission.
(z = 0.439), 1″ corresponds to 6.64 and 5.68 kpc, respectively. The MUSTANG observations and data reduction in this
work largely follow the procedure described in Mason et al.
2. OBSERVATIONS AND DATA REDUCTION (2010) and Korngut et al. (2011). We direct the telescope in a
Lissajous daisy scan pattern with seven pointing centers
2.1. The CLASH Sample surrounding the cluster core. This mosaic provides deep,
In this paper, we present MUSTANG observations of uniform coverage in the cluster core and falls off steeply
MACS J0647.7+7015 and MACS J1206.2–0847. Basic char- beyond a radius of ∼30″.
acteristics of these clusters are summarized in Tables 1 and 2, During observations, nearby bright compact radio sources
as part of an ongoing program to provide high-resolution SZE were mapped once every 30 minutes to track changes in the
images of the CLASH clusters accessible from MUSTANGʼs beam profile including drifts in telescope gain and pointing
location on the Green Bank Telescope (GBT; Jewell & offsets. Typically, if there was a substantial (∼20%) drop in the
Prestage 2004). The 25 clusters in CLASH have comprehen- peak of the beam profile, or if the beam width exceeded 10″,
sive multi-wavelength coverage, including deep 16-band HST we re-derived the GBT active surface corrections using an out-
optical imaging, relatively low resolution SZE measurements, of-focus holography technique (Nikolic et al. 2007). We used
and X-ray observations with Chandra and XMM-Newton. the blazar JVAS 0721+7120 for MACS J0647.7+7015 and the
These clusters are generally dynamically relaxed, span redshifts quasar JVAS 1229+0203 for MACS J1206.2–0847 to deter-
from 0.2 z 0.9, and masses from 3 ´ 1014 M500 M mine these gains and focusing corrections. Planets or stable
quasars including Mars, Saturn, and 3C286 (Agudo et al. 2012)
2 ´ 1015. For a comprehensive description of the CLASH
were mapped at least once per observation session to provide
sample and selection criteria see Postman et al. (2012).
absolute flux calibration. Fluxes for planets were calculated
based on brightness temperatures from WMAP observations
2.2. MUSTANG
(Weiland et al. 2011). The absolute flux of the data is calibrated
MUSTANG is a 64-pixel array of Transition Edge Sensor to an accuracy of 10%. Throughout this work, we ignore the
(TES) bolometers spaced at 0.6 fl operating at 90 GHz on the systematic uncertainty from the absolute flux calibration and
100 m GBT. MUSTANG has an instantaneous field of view quote only the statistical uncertainties.
(FOV) of 42″ and angular resolution of 9″. For more The MUSTANG data are reduced using a custom IDL
information about MUSTANG, refer to Dicker et al. (2008). pipeline. The bolometric timestreams are high-pass filtered by
MUSTANG has measured the SZE at high resolution in subtracting a high order Legendre polynomial determined by
several galaxy clusters to date, including RX J1347.5–1145, the scan speed of the telescope. For a typical 300 s scan, and
2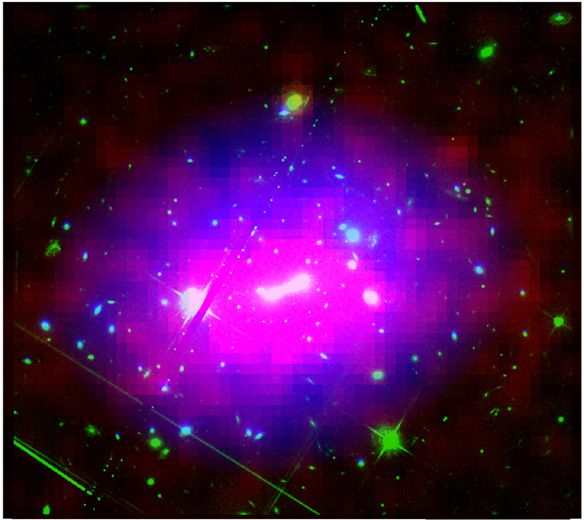
The Astrophysical Journal, 809:185 (14pp), 2015 August 20                                                                                 Young et al.
       −1
40″ s    scan speed, we choose a ∼100th-order Legendre                   where ν is the observed frequency, Te is the electron
polynomial, corresponding to a cutoff frequency of ∼0.3 Hz. In           temperature, y is the Compton-y parameter (described below),
order to remove atmospheric noise on large angular scales, we            and      the     primary     CMB         surface       brightness    is
subtract the mean measurement from all detectors for each                                       -                                 −1
                                                                         I0 = 2 (kB TCMB ) (hc ) = 2.7033 ´ 10
                                                                                           3     2                        8 Jy sr    . The func-
sample in time. This also removes astronomical signals on                tion g (n , Te ) describes the frequency dependence of the
angular scales larger than the FOV of the instrument (≈42″).
                                                                         thermal SZE (Carlstrom et al. 2002) and includes the
   The standard deviation, σ, of each individual detector
                                                                         relativistic corrections of Itoh et al. (1998) and Itoh & Nozawa
timestream is computed, and a corresponding weight, w, is
determined according to w = 1 s 2 . To produce a “signal                 (2004). At 90 GHz, the SZE manifests as a decrement in the
map,” the timestreams are binned into 1″ × 1″ spatial pixels             CMB intensity.
and smoothed with the MUSTANG point-spread function                         The frequency-independent Compton-y parameter is defined
(PSF), or beam. We compute the weight for each pixel of the              as
smoothed data map to produce a “weight map.” We multiply                                            sT
the signal map by the square root of the weight map to generate                              yº
                                                                                                  m e c2    ò
                                                                                                           n e k B Te dℓ,                    (2 )
a map in units of signal-to-noise ratio (S/N)—the “SNR map.”
   We generate an independent “noise map” by flipping the                 where sT is the Thomson cross-section, m e c 2 is the electron rest
sign of measurements from every other scan and binning the               energy, and the integration is along the line of sight ℓ.
data into a grid with the same pixel size as the signal map. As          Therefore, by the ideal gas law, the SZE intensity is
we do for the signal map, we use the pixel weights to convert            proportional to the ICM electron pressure Pe = n e kB Te
the noise map to units of S/N, referred to as a “noise SNR               integrated along the line of sight. The total SZE signal,
map.” We define a scale factor, sN , as the standard deviation of         integrated within an aperture q = R DA, is often expressed in
the noise SNR map. For an ideal noise distribution, sN = 1. We
can therefore use sN as a normalization factor to account for            units of solid angle, where YSZ [sr] = ò y d W or in distance units
“non-ideal” noise features, such as correlations between                 where Y[Mpc2] = YSZ DA2 .
detectors. Typically, we find sN » 1.5, which means that the                The X-ray surface brightness (in units of ergs cm−2 s−1) is
timestream-based weight maps are under-estimating the noise.                                           1
                               2.3. Bolocam
                                                                                         SX =
                                                                                                 4 p (1 + z )4   ò ne2 Lee ( Te, Z ) dℓ
   Bolocam is a 144-pixel bolometer array at the Caltech                 where L ee (Te, Z ) is the X-ray cooling function (in units of
Submillimeter Observatory capable of operating at 140 and                ergs cm3 s−1), and Z is the abundance of heavy elements
268 GHz, with resolutions of 31″ and 58″, respectively, and an           relative to that in the Sun. Assuming the temperature is
instantaneous FOV 8′ in diameter. For more details on the                constant along the line of sight,
Bolocam instrument see Haig et al. (2004).
   As part of a larger cluster program (Sayers et al. 2013;                                             4 p (1 + z )3 S X
                                                                                               ne »                       .                        (3 )
Czakon et al. 2015), Bolocam was used to obtain high                                                     L ee ( Te, Z ) ℓ
significance SZE images of MACS J0647.7+7015
(S/N = 14.4) and MACS J1206.2–0847 (S/N = 21.7). In this                   We approximate Equation (2) as y » sT (m e c 2 ) n e kB Te ℓ and
work, we make use of these Bolocam data to constrain bulk                use Equation (3) to derive from the X-ray data a “pseudo”-y
models of the SZE emission based on generalized Navarro–                 value,19 given by
Frenk–White (gNFW) pressure profiles (Nagai et al. 2007),
including the specific case of the “universal pressure profile”                                   sT k B Te   4 p (1 + z )3 S X ℓ
                                                                                          y=                                    .                  (4 )
(Arnaud et al. 2010, hereafter A10). The model fitting                                            m e c2        L ee ( Te, Z )
procedure is described in Section 4.2, and the details of the
Bolocam data, along with its reduction are given in Sayers et al.           We assume a single value for ℓ across the map. This “slab
(2013, hereafter S13) and Czakon et al. (2015).                          approximation” is not completely valid, but has been used in
                                                                         other works for qualitative comparisons to Compton-y maps
                               2.4. Chandra                              (see Mroczkowski et al. 2012; Planck Collaboration et al.
                                                                         2013b). It assumes that the cluster temperature is constant
   Archival Chandra X-ray data were reduced using CIAO18                 along the line of sight and that the average ratio of Compton-y
version 4.5 with calibration database version 4.5.5. MACS                to SX is approximately constant azimuthally.
J0647.7+7015 was observed for a total exposure time of 39 ks                We use a measurement of the integrated Compton-y (YSZ DA2 )
(ObsIDs 3196 and 3584). MACS J1206.2–0847 was observed                   within R < 1′ from Bolocam to infer ℓ and normalize the X-ray
for 24 ks (ObsID 3277). For details on the X-ray data                    pseudo-y map accordingly.
processing see Reese et al. (2010).                                         The X-ray data for MACS J0647.7+7015 and MACS
                                                                         J1206.2–0847 were not deep enough for detailed temperature
                           3. ICM ANALYSIS                               mapping. We fit the X-ray spectra in large spatial bins and
     The thermal SZE intensity is described by                           found best-fit temperatures consistent with Mantz et al. (2010).
                                                                         For simplicity, we assume an isothermal distribution with the
                         DISZE                                           the kB Te values determined by Mantz et al. (2010). We note that
                               = g ( n , Te ) y ,             (1 )
                          I0                                             for each of these clusters, the assumption of an isothermal
                                                                         19
18
                                                                            The “pseudo” distinction is used because ℓ is not constrained by the X-ray
     http://cxc.harvard.edu/ciao/                                        data alone.

                                                                     3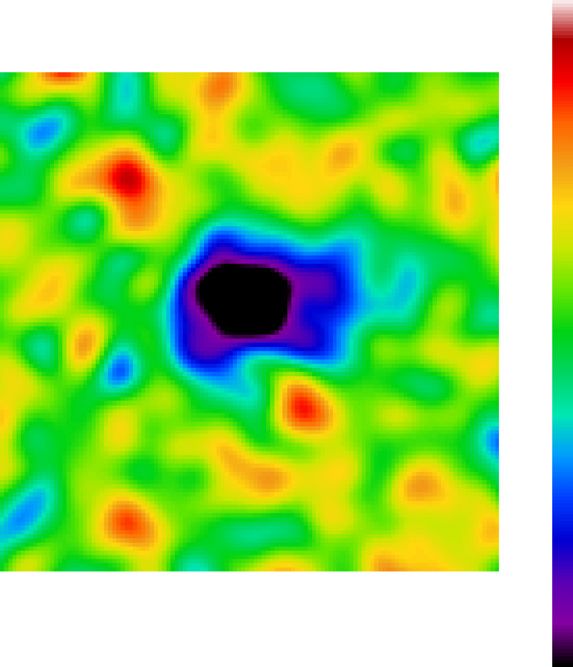
The Astrophysical Journal, 809:185 (14pp), 2015 August 20 Young et al.
Table 3 As in A10, we express Ysph in units of Y500, where
gNFW Model Parameters
sT 4p 3
Model P0 C500 γ α β
Y500 = R500 P500, (6 )
m e c2 3
S13 ensemble 4.29 1.18 0.67 0.86 3.67
S13 cool-core 0.65 1.18 1.37 2.79 3.51 and
S13 disturbed 17.3 1.18 0.02 0.90 5.22
⎛ M ⎞2 3
A10 ensemble 8.40 1.18 0.31 1.05 5.49 P500 = ( 3.68 ´ 10-3 keV cm-3) ⎜ 15500 ⎟ E (z)8 3 , (7 )
A10 cool-core 3.25 1.13 0.77 1.22 5.49 ⎝ 10 M ⎠
A10 disturbed 3.20 1.08 0.38 1.41 5.49
MACS J0647.7 0.54 0.29 0.90 1.05 5.49 where E 2 (z ) = WM (1 + z )3 + WL (see Nagai
MACS J1206.2 1.13 0.41 0.70 1.05 5.49 et al. 2007; A10; S13). The values of Y500 and P500 from
Equations (6) and (7), respectively, are derived from the cluster
Notes. Best-fit gNFW models from S13, A10, and the best-fit Bolo properties reported in Mantz et al. (2010) and summarized in
+MUSTANG models presented in Section 5. The C500 (C500 = R500 Rs )
values for the Bolo+MUSTANG models are derived from the best-fit scale
Table 1.
radius Rs from this work and R500 from Mantz et al. (2010).
4. MODEL FITTING
distribution within r 120″ is reasonable based on the While MUSTANG provides high-resolution imaging, the
relatively flat radial temperature profiles given in the Archive angular transfer function falls off steeply beyond the instrument
FOV (≈42″ = 255 kpc at z = 0.5). Bolocam has a lower
of Chandra Cluster Entropy Profile Tables (ACCEPT) database
resolution, but a larger FOV and therefore is sensitive to the
(Cavagnolo et al. 2009).
bulk SZE signal on larger angular scales (beyond ∼10′). A
Several measurements have shown that the pressure of the
combined Bolocam+MUSTANG model-fitting approach
ICM is well described by a gNFW pressure profile (e.g., Nagai allows us to place better constraints on the ICM characteristics
et al. 2007; Mroczkowski et al. 2009; A10; Plagge et al. 2010; over the full range of angular scales probed by both
Planck Collaboration et al. 2013a; S13). In this model, the instruments. In this work, we present the first steps toward a
pressure (in units of P500) is robust joint-fitting procedure. We note that this fitting
procedure does not perform a true simultaneous fit to both
P0
P˜(R) = , (5 ) the MUSTANG and the Bolocam data, which is presented in
a (b - g ) a
Rs-1R ⎡⎣ 1 + Rs-1R ⎤⎦
g Romero et al. (2015).
( ) ( )
4.1. Fitting Algorithm
where Rs is the scale radius of the cluster, often given in terms
of the concentration parameter C500 (Rs = R500 C500 ),20 P0 is We begin by constructing a model map, such as a projected
the normalization factor, γ is the inner slope (R Rs), α is the gNFW model plus a point source, in units of Jy beam−1
smoothed to MUSTANG resolution. We simulate an observa-
intermediate slope (R ~ Rs), and β is the outer slope (R Rs).
tion of the model by injecting noise from real observations (i.e.,
P500 is defined in Equation (7). the noise maps described in Section 2.2) and then processing
In this work, we focus on the gNFW fit results from A10 the mock observation through the MUSTANG mapmaking
and S13. The gNFW model parameters for the respective pipeline. By subtracting the injected noise from the output map
ensemble samples, in addition to subsets defined according to we obtain a filtered model map without residual noise.
cluster morphology, are given in Table 3. We also include the Examples of these post-processed model maps are presented
best-fit parameters for MACS J0647.7+7015 and MACS in Section 5.
J1206.2–0847 determined in Section 5. Pressure profiles for To fit the filtered model maps to the data in the map domain
each of these models, scaled based on the values of P500, R500, we use the general linear least squares fitting approach from
and z given in Table 1 for each cluster, are shown in Figure 1. Numerical Recipes (Press et al. 1992), outlined briefly below.
We also include plots of the spherically integrated Compton-y, We construct an N × M design matrix A, where each
Ysph(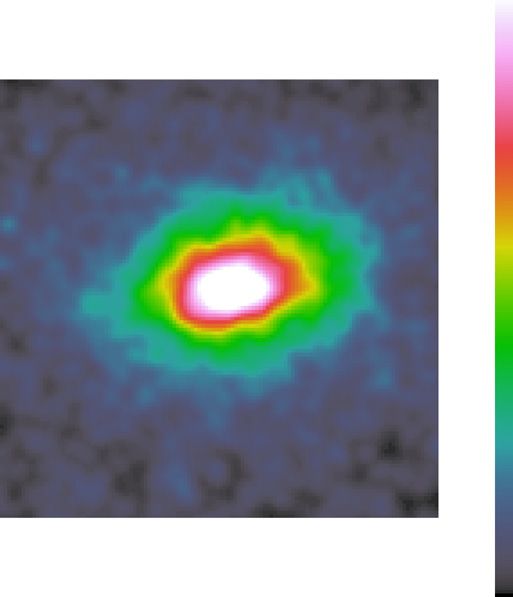
The Astrophysical Journal, 809:185 (14pp), 2015 August 20                                                                                              Young et al.

Figure 1. Pressure (upper) and spherically integrated Compton-y (lower) profiles for MACS J0647.7+7015 (left) and MACS J1206.2–0847 (right). Dashed lines refer
to the A10 sample of X-ray selected clusters, while solid lines correspond to the S13 sample including all of the CLASH clusters. For A10 and S13, respectively,
“ensemble” (green) refers to the entire cluster sample, and profiles for cool-core (blue) and disturbed (red) morphologies are also separately shown. The X-ray derived
pressure measurements from the ACCEPT database are plotted as diamonds. The best-fit Bolo+MUSTANG model presented in Section 5 is given by the solid black
line in each plot. The vertical dotted lines surround the radial dynamic range (resolution to FOV) covered by MUSTANG (red) and Bolocam (blue). Note the Bolocam
FOV extends beyond the radial range shown for MACS J0647.7+7015. The integrated Compton-y profiles were computed according to Equations (3) and (6).

over statistically identical noise realizations. Given that our                                       4.2. Bolo+MUSTANG gNFW Profiles
detector noise is dominated by phonon noise, pixel noise is                              The Bolocam gNFW profiles are derived following the
largely uncorrelated, so we therefore take the noise covariance                       fitting procedure in Sayers et al. (2011) and Czakon et al.
matrix N to be diagonal. Residual atmospheric noise coupled                           (2015), which we summarize briefly below.
with slight correlations between detectors will contribute off-                          First, the gNFW profile is used to obtain a three-dimensional
diagonal elements to N . These terms are on average 3% of the                         model of the SZE. Next, this model is projected to two-
magnitude of the diagonal terms and ignored in this procedure                         dimensions, scaled in angular size according to the cluster
for computational simplicity. The best-fit amplitudes, corre-                          redshift, and convolved with both the Bolocam PSF and the
sponding to the minimum c 2 , are then                                                transfer function of the Bolocam data processing. The result is
                                                                                      then compared to the Bolocam image in order to obtain the
                                          -1                                          best-fit parameters of the gNFW profile. For these fits, we use
                       a = ( AT N-1A) AT N-1d.
                                                                                      Equation (1) to convert the Bolocam brightness images to units
                                                                                      of Compton-y. We include the relativistic corrections of Itoh
The parameter uncertainties s 2 (ak ) are given by the diagonal                       et al. (1998) and Itoh & Nozawa (2004), assuming the
elements of the parameter covariance matrix (AT N-1A)-1.                              isothermal temperature given in Table 1.
   We perform the fits over a region within 1′ of the cluster                             Following the above procedure, we fit the Bolocam data with
centers. This scale is chosen to match the MUSTANG angular                            gNFW profiles spanning a range of fixed γ values from 0 to
transfer function and we find that the results do not change                           1.5. For generality, we fit elliptical models to the Bolocam data,
significantly for fits using larger regions. Given the 1″ × 1″                          although we note that these models produce axial ratios that are
map pixels, this yields roughly p (60)2 = 11,310 degrees of                           close to 1 (i.e., the elliptical models are nearly circular). For
freedom (dof), minus the number of model components we                                each profile, we assume the A10 “universal profile” values
include in each fit. The probability to exceed c 2 (PTE) reflects                       a = 1.05 and b = 5.49. The normalization P0, centroid, and
the probability that deviations between the given model and the                       scale radius Rs are allowed to float. These best-fit pressure
data, at least as large as those observed, would be seen by                           profiles to Bolocam are shown in Figure 2. The integrated
chance, assuming the model is correct.                                                Compton-y profiles are also shown.

                                                                                  5
The Astrophysical Journal, 809:185 (14pp), 2015 August 20 Young et al.
Figure 2. Pressure (upper) and spherically integrated Compton-y (lower) profiles generated from fits of generalized NFW profiles to Bolocam measurements of MACS
J0647.7+7015 and MACS J1206.2–0847, in the left and right columns, respectively. Each profile represents the gNFW that best fits the Bolocam data given a fixed
value of γ, represented by the color bars, with α and β held at the A10 values. In general, Bolocam has the largest constraining power between 1′ and 3′ in radius, and
all of the models overlap to a high degree in this radial region. This highlights the inherent parameter degeneracies between P0, Rs, and γ in the gNFW model, which
can be broken using the high-resolution MUSTANG data. The dashed lines correspond to the best fit Bolo+MUSTANG models, which have g = 0.9 for MACS
J0647.7+7015, and g = 0.7 for MACS J1206.2–0847 (see Table 3). From left to right, the vertical dotted lines mark the resolution and FOV, respectively, of
MUSTANG (red) and Bolocam (blue), as in Figure 1.
We compare each of these models to the MUSTANG data as The mass distribution from the strong-lensing analysis (Zitrin
described in Section 4.1. We choose a grid over γ values et al. 2011) is doubly peaked and elongated in the E–W
because γ defines the inner slope of the ICM profile where we direction. The X-ray emission measured by Chandra shows
expect MUSTANG to be most sensitive. From the grid of best- similar elongation as does the SZE flux measured by
fit models to the Bolocam data, the model with the best fit to MUSTANG.
the MUSTANG data is selected as the overall best fit, referred The MUSTANG map of MACS J0647.7+7015 is shown in
to as the Bolo+MUSTANG model. We emphasize that this is a Figure 4. The peak SZE flux is -121 16 m Jy beam−1. The
serial-fitting procedure, in which we first fit a set of gNFW measured decrement (>3σ) encompasses an elongated region
models to the Bolocam data, independently of the MUSTANG approximately 25″ × 38″. The total SZE flux measured by
observations, and then select a single model from this set that MUSTANG, within the region with >3σ significance of the
best fits the MUSTANG data. Effectively, the Bolocam data decrement, is -535 38 m Jy .
first constrain the values of P0 and Rs (for fixed γ, α, and β), Figure 5 shows the pseudo-y template derived from X-ray
and then the MUSTANG data constrain the value of γ. measurements according to Equation (4). We normalize the
integrated pseudo Compton-y based on the Bolocam flux as
described in Section 3.
5. RESULTS Following the procedure outlined in Section 3, we determine
5.1. MACS J0647.7+7015 the thermal SZE model that best simultaneously describes the
MUSTANG and Bolocam data to be a gNFW profile with
MACS J0647.7+7015, discovered during the Massive
Cluster Survey (MACS; Ebeling et al. 2001, 2007), is a
seemingly relaxed massive system at z = 0.591, but contains
[ P0, Rs (Mpc) , g , a, b ] = [0.54, 4.34, 0.90, 1.05, 5.49],
multiple cD galaxies (see Hung & Ebeling 2012), which may (8 )
indicate ongoing merger activity (Mann & Ebeling 2012).
Figure 3 shows a composite image of MACS J0647.7 with a ratio between major and minor axes of 1.27 and position
+7015 including optical, strong-lensing, and X-ray images. angle −174° E of N, hereafter referred to as the g = 0.9, or
6The Astrophysical Journal, 809:185 (14pp), 2015 August 20 Young et al.
Figure 5. MACS J0647.7+7015 X-ray derived Compton-y map assuming an
Figure 3. Composite image of MACS J0647.7+7015. Green is HST, blue is
isothermal temperature of 11.5 keV and effective depth ℓ = 1.4 Mpc. The
the total mass distribution derived from strong gravitational lensing (Zitrin
contours are shown for X-ray pseudo-y (black) and Bolocam data (red) in
et al. 2011), and red is X-ray surface brightness measured by Chandra.
increments of 0.14 ´ 10-4 beginning at 1.3 ´ 10-4 for both. The Bolocam
MUSTANG S/N contours from Figure 4 are overlaid in white and Bolocam
PSF smooths the signal significantly on the scale of this image, which explains
contours (S/N » [12, 13, 14]) are overlaid in yellow. Although the Bolocam
the broader contours relative to the X-ray.
peak is located slightly north of the cluster center, there is good agreement in
general between the X-ray, SZE, and lensing mass distributions. Crosses
denote the centroid for the X-ray surface brightness (dark red), BCGs (blue),
and Bolocam SZE (yellow). MACS J0647.7+7015 exhibits an elliptical
morphology with two distinct cD galaxies, which may indicate merger activity,
but otherwise appears to be relaxed. The blue cross above is centered between
the two cD galaxies.
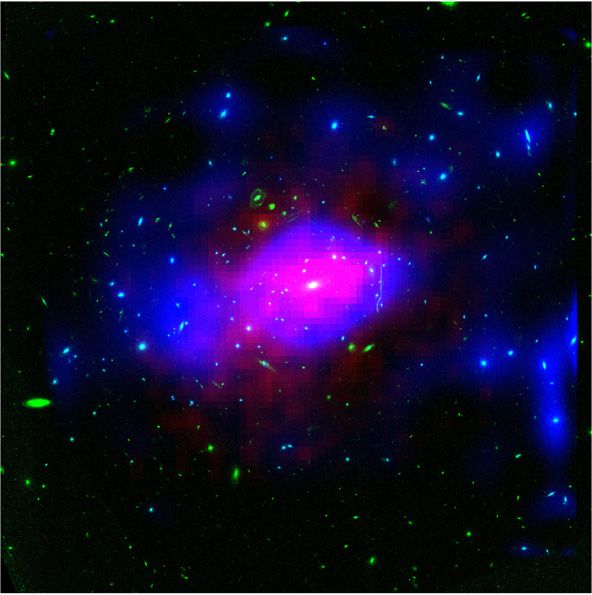
Figure 6. Goodness of fit parameters c 2red (crosses) and PTE (diamonds) from
the comparison between MUSTANG data and the Bolocam-derived models for
MACS J0647.7+7015. We determine the best-fit model to be a gNFW with
γ = 0.90, yielding c 2 dof =11374 11314 and PTE = 0.34.
gNFW g= 0.9 , model. Rs is computed from the geometric mean
of the major and minor axes. Figure 6 shows the calculated
reduced c 2 (c 2red = c 2 dof) and PTE as a function of the fixed
γ value. The gNFW g= 0.9 model gives c 2 /dof = 11378/11314
with PTE = 0.34 (see Table 4).
The X-ray pseudo-SZE and gNFW g= 0.9 model for MACS
J0647.7+7015, after being filtered through the MUSTANG
pipeline, are shown in Figure 7. Also shown are the
azimuthally averaged radial profiles. The X-ray flux is
concentrated on smaller scales and passes through the
MUSTANG pipeline with less attenuation compared to the
gNFW models, which have shallower profiles extending to
Figure 4. MUSTANG SZE S/N map of MACS J0647.7+7015 smoothed with larger radii. The filtered gNFW g= 0.9 flux peak is offset slightly
the 9″ beam represented by the black circle in the upper right. Contours are
shown in increments of 1-σ beginning at 3σ for SZE decrement (white) and north of the X-ray peak. The radially averaged profiles from the
positive flux (black). filtered maps are fairly consistent between all three data sets.
7The Astrophysical Journal, 809:185 (14pp), 2015 August 20 Young et al.
Table 4
Summary of Fit Results
Cluster Model c 2 /dof PTE
MACS J0647.7+7015
A10 11425/11314 0.23
gNFW g= 0.9 11378/11314 0.34
Pseudo-SZE 11497/11314 0.11
MACS J1206.2–0847
A10 11237/11307 0.68
gNFW g= 0.7 11227/11307 0.70
Pseudo-SZE 11408/11307 0.25
Note. Fit results for the A10, gNFW, and pseudo-SZE models. The fits for
MACS J1206.2–0847 included a model for the point source with a floating
amplitude.
5.1.1. Discussion
In MACS J0647.7+7015, we find good agreement between
the MUSTANG high-resolution SZE image and the X-ray and
Bolocam measurements. We summarize the results from the
fitting procedure in Table 4. The g = 0.9 gNFW model best fits
the MUSTANG data with a PTE of 0.34, whereas the A10 and
pseudo-SZE are less favored (PTE 0.23).
The compact positive sources in Figure 4 are significant
(>3σ) even after accounting for the lower observing coverage
outside the cluster core, however, we find no counterparts for
these sources in any other data set. In computing the
significances we have assumed that the MUSTANG map-
domain noise follows a Gaussian distribution within a 2′ radius,
which we verified by inspecting the histogram of the noise map
for MACS J0647.7+7015. High resolution radio observations
were not obtained for MACS J0647.7+7015 so spectral
coverage close to 90 GHz is limited. We take jackknives of
Figure 7. MACS J0647.7+7015 pseudo SZE map derived from Chandra
the data, split into four equal integration times, and the sources X-ray data (top, red contours) with green contours representing the Bolo
appear with similar flux in each segment, which is unlikely for +MUSTANG gNFW g= 0.9 model from this work. The MUSTANG transfer
an artifact. Therefore, it is possible that these are yet function has been applied to both and the MUSTANG PSF is shown as a black
unidentified objects such as lensed high-z dusty galaxies or circle. The white contours are MUSTANG S/N from Figure 4. The red and
green contours are overlaid in units of −50 μJy beam−1 starting at
shallow spectrum AGNs, which may be confirmed by future −50 μJy beam−1. Azimuthally averaged radial profiles are shown in the lower
observations with high resolution coverage near 90 GHz. panel. Aside from the central ∼0.1 Mpc where the X-ray and SZE flux are
sharply peaked, the radially averaged flux from MUSTANG closely follows
both the gNFW g= 0.9 model and the X-ray pseudo SZE flux.
5.2. MACS J1206.2–0847
The BCG (aJ2000 = 12h06 m12.s 1, dJ2000 = -0848′3″) in
MACS J1206.2–0847 is a mostly relaxed system at MACS J1206.2–0847 harbors a radio-loud AGN that is
z = 0.439 that has been studied extensively through X-ray, detected by MUSTANG at high significance (S/N > 4). Using
SZE, and optical observations (e.g., Ebeling et al. 2001, 2009; a spatial template derived from the MUSTANG map, we
Gilmour et al. 2009; Umetsu et al. 2012; Zitrin et al. 2012;
construct a compact source model and allow the amplitude to
Biviano et al. 2013; S13). A composite image with the multi-
float in the joint fits with bulk SZE models, in order to account
wavelength data is shown in Figure 8. We include high
for the degeneracy between the co-spatial positive emission and
resolution 610 MHz data from the Giant Metrewave Radio
SZE decrement. AGN brightness is generally represented as a
Telescope (GMRT; project code 21_017). These data reveal
extended radio emission to the west of the ∼0.5 Jy power law with frequency, given by
central AGN.
log (S (n ) [mJy] = a log (n [MHz]) ) + b (9 )
The MUSTANG SZE map of MACS J1206.2–0847 is
shown in Figure 9. The majority of the SZE decrement extends
to the northeast and is contaminated by emission from the where α is the spectral index and β is the abscissa.
central AGN. Extrapolating from low frequency (n < 1.4 GHz) measure-
The X-ray pseudo-y and SZE decrement measured by ments, SPECFIND V2.0 (Vollmer et al. 2010) predicts
Bolocam are shown in Figure 10. a = -1.26 0.1 and b = 6.2 0.2, or a 90 GHz flux of
8The Astrophysical Journal, 809:185 (14pp), 2015 August 20 Young et al.
decrement and we allow the amplitude to float, a model with a
steeper core slope will compensate with a stronger point
source. Relative to MACS J0647.7+7015, in which MUS-
TANG does not detect AGN emission, this effect reduces the
constraining power on γ, which can be seen by comparing
Figures 6 and 11. Measurements of the point source flux closer
in frequency to 90 GHz are required to model and remove the
source prior to fitting and thereby improve the constraining
power on γ.
Previous analyses of MACS J1206.2–0847 suggest that the
system is close to being in dynamical equilibrium. Gilmour
et al. (2009) classify the cluster as visually relaxed based on its
X-ray morphology. The mass profiles derived from galaxy
kinematics (Biviano et al. 2013), X-ray surface brightness, and
combined strong and weak-lensing (Umetsu et al. 2012) are all
consistent, which indicates that the system is likely relaxed.
As described in Section 5.2, MUSTANG detects an excess
residual of SZE flux (>3σ) to the NE of the bulk ICM in
MACS J1206.2–0847, after removing the point source and
gNFW g= 0.7 SZE models. This signal does not appear to have a
counterpart in the X-ray surface brightness image, nor is there a
diffuse radio feature in GMRT observations that would point to
a shock associated with an energetic merger event (e.g., Ferrari
et al. 2011). When comparing the MUSTANG map to the
Figure 8. Composite image of MACS J1206.2–0847. Green is HST, blue is the optical image and a weak lensing mass reconstruction using
total mass distribution derived from strong gravitational lensing (Zitrin data and methods presented in Umetsu et al. (2012), we do
et al. 2012), and red is X-ray surface brightness measured by Chandra.
MUSTANG S/N contours from Figure 9 are overlaid in white (negative) and
however see some evidence that this source is aligned with a
black (positive). Bolocam contours (S/N » [15, 17, 19, 21]) are overlaid in filamentary structure to the N-NE (Figure 13).
yellow. Radio contours from GMRT 610 MHz observations are overlaid in Figure 13 shows an optical image of MACS
cyan, and span 8σ to 17σ in steps of 3σ. The crosses denote the centroids from J1206.2–0847 with weak lensing mass contours overlaid. The
the Bolocam data (yellow), the diffuse X-ray distribution (green), and the BCG SE elongation in the mass distribution follows a filamentary
(blue). The offsets between these centroids, as well as the extended radio
emission, could be indicative of a disturbed cluster morphology. structure that has been noted in previous analyses (see Umetsu
et al. 2012; Annunziatella et al. 2014). Additionally, there
appears to be an elongation in the mass distribution to the NE,
S90 = 879 253 μJy. By way of comparison, our joint fit in the direction of the feature detected by MUSTANG. The
results give S90 = 584 - 765 μJy, summarized in Table 5. centroid of the SZE signal measured by Bolocam is also shifted
Figure 11 shows the goodness of fit statistics for the gNFW to the NE (see Figure 8).
+point source model fitting. With c 2red = 0.993 and
PTE = 0.70, the best fit model is a gNFW with
5.2.2. Galaxy Group Scenario
[ P0, Rs (Mpc) , g , a, b ] = [1.13, 3.93, 0.70, 1.05, 5.49], We consider the case of a galaxy group leading to the SZE
feature detected by MUSTANG. Using the residual flux
(10)
measured in the filtered, model-subtracted MUSTANG SZE
with a ratio between major and minor axes of 1.02 and position maps, we can place constraints on the group mass. By
angle −13° E of N, hereafter gNFW g= 0.7 (see Table 4). The simulating a suite of idealized A10 cluster Compton-y maps,
filtered gNFW g= 0.7 and pseudo-SZE models are shown in we find the MUSTANG residual can only provide a lower limit
Figure 12. The Bolocam model is much more extended than the to the mass, since the filtering effects remove an unknown and
X-ray and is subsequently filtered the most by the MUSTANG possibly large SZE flux component from angular scales
inaccessible to MUSTANG, while for a small enough group
transfer function. The pseudo-SZE model shows a much higher
or cluster little flux is filtered. We use this mass to infer what
peak after filtering, but diminishes rapidly with radius. the X-ray surface brightness of the group would be, and
After subtracting the point source and gNFW g= 0.7 model, we determine if such a lower limit is consistent the upper limit
find a 3σ residual feature in MACS J1206.2–0847 (see placed by X-ray. The residual integrated SZE flux of -61 μJy
Figure 9). The 3σ contour encompasses a 73 arcsec2 (2 kpc2) corresponds to a mass lower limit of M500 > 1.3 ´ 1013 M
region with an integrated flux of −61 ± 21 μJy. Using and soft (0.1–2.4 keV) X-ray luminosity of LX > 7.99 ´ 10 43
Equation (1) we calculate the integrated Compton-y, erg s−1 (see Table 6). In this calculation we have assumed the
YSZ DA2 = 7.3 ´ 10-7 Mpc2 (see Table 6). Y –M and Y –LX scaling relations given in A10. We note that YSZ
DA2 = 9.53 ´ 10-8 Mpc2 is below the mass limit of the sample
5.2.1. Discussion
used in A10, so this is an extrapolation.
The Bolo+MUSTANG gNFW g= 0.7 model for MACS Using the spectroscopic redshifts of Biviano et al. (2013),
J1206.2–0847 provides a good fit to the MUSTANG data which are part of the “CLASH-Very Large Telescope (VLT)”
when a point source model for the central AGN is included. VIsible MultiObject Spectrograph (VIMOS) Large Programme
However, since the point source is co-spatial with the SZE and have been recently made publicly available, we analyze
9The Astrophysical Journal, 809:185 (14pp), 2015 August 20 Young et al.
Figure 9. MUSTANG S/N map of MACS J1206.2–0847 (left). Also shown are MUSTANG S/N maps with a point source model subtracted (middle), and
additionally the gNFW g= 0.7 model subtracted (right). Black (white) contours are positive (negative) S/N = [3, 4]. There is a residual flux of S90 = −61 ± 21 μJy to
the NE with >3σ significance and not accounted for by the gNFW g= 0.7 model. We include contours in red from GMRT observations at 610 MHz, spanning 8-σ to
17σ in steps of 3σ. In each panel, the 9″ MUSTANG beam is drawn as a black circle in the upper right.
Table 5
Point Source Flux and Extrapolated Spectral Indices
Model S90 α β
(μJy)
SPECFIND 879 ± 253 −1.26 ± 0.09 6.19 ± 0.24
A10 674 ± 61 −1.32 ± 0.05 6.34 ± 0.25
gNFW g= 0.7 765 ± 61 −1.28 ± 0.05 6.25 ± 0.24
Null 584 ± 61 −1.35 ± 0.05 6.45 ± 0.25
Notes. Point source fluxes derived from joint fits with bulk SZE models. The
first row provides the flux at 90 GHz (S90) extrapolated from measurements at
lower frequencies (74–1400 MHz) given in the SPECFIND V2.0 catalog
(Vollmer et al. 2010). The A10 model refers to the ensemble parameters given
in Table 3. The gNFW g= 0.7 model is the best-fit Bolo+MUSTANG model
from this work. The “null” model assumes there is no SZE decrement
coincident with the point source. This represents a lower limit on the flux at
90 GHz and and therefore the steepest (most negative) likely spectral index.
Figure 10. MACS J1206.2–0847 X-ray derived Compton-y map assuming an
isothermal temperature of 10.7 keV and effective depth ℓ = 2.0 Mpc. The
contours are shown for X-ray pseudo-y (black) and Bolocam data (red) in
increments of 0.25 ´ 10-4 beginning at 1.7 ´ 10-4 for both. As in Figure 5,
the Bolocam contours are broader than the X-ray, due to the smoothing of the
core flux by the Bolocam PSF.
galaxy structures outside the main cluster peak in the redshift
distribution, selecting galaxies corresponding to foreground
and background peaks. One of these redshift bins, at z ~ 0.42, Figure 11. Goodness of fit parameters c 2red (crosses) and PTE (diamonds) from
contains 13 galaxies that are located near the SZE peak. We the comparison between MUSTANG data and the Bolocam-derived models for
take these galaxies to be members of a potential group MACS J1206.2–0847. We determine the best-fit model to be a gNFW
(γ = 0.70), for which we calculate c 2 dof = 11227/11307 and PTE = 0.70.
associated with the SZE feature and compute the line of sight
velocity dispersion, sV . For this group we find ázñ = 0.423 and
sV = 650 km s−1. Therefore, this is potentially either a Following the sV –M200 relation of Munari et al. (2013), we
compute a group mass of M200 = (2.4 1.5) ´ 1014 M
foreground group ≈100 Mpc in front of the cluster or a group
within R200 ~ 1.1 Mpc, corresponding to M500 = 1.4
falling into the cluster with a rest frame velocity of +0.1
0.9 ´ 1014 M and R500 = 0.7- 0.2 Mpc for a typical scaling of
Vrf » 3500 km s−1 toward the observer.
M500 = 0.6 ´ M200 of an NFW mass profile.
10The Astrophysical Journal, 809:185 (14pp), 2015 August 20 Young et al.
Figure 13. Optical image from HST (grayscale) overlaid with the weak-lensing
mass distribution (red) from Umetsu et al. (2012), the MUSTANG S/N
contours (magenta), and the best fit eNFW+NFW two-halo model (blue). In
addition to the E–W elongation noted in previous observations, there is an
elongation to the NE. This suggests that the MUSTANG SZE detection may
correlate with real structure such as an infalling galaxy group.
Figure 12. X-ray-derived (top, red contours) and Bolo+MUSTANG gNFW
g= 0.7 model (top, green contours) for MACS J1206.2–0847, each with the
MUSTANG transfer function applied. Both have been smoothed with the
MUSTANG PSF given by the black circle. The red and green contours start at
-75 μJy beam−1 and increase in steps of -25 μJy beam−1. The MUSTANG
S/N contours from Figure 9 are overlaid in white. Azimuthally averaged radial
profiles are shown in the lower panel. The filtered X-ray derived flux shows a
sharper peak relative to the Bolocam and MUSTANG data, which could be a
result of the way in which the pseudo-y map is normalized (see Figure 10).
Table 6
MACS J1206.2–0847 SZE Residual Flux and Lower Mass Limits after Cluster
Model and Point Source Subtraction
Model(s) S90 YSZ DA 2 M500a LX b
Removed (μJy) (10−8 Mpc2) (1013 M ) (10 erg s−1)
43
Point Srcc −193 ± 36 32 ± 6 2.6 ± 1.0 3.0 ± 1.7 Figure 14. Rest-frame line of sight velocity vs. projected distance from the
gNFW g= 0.7 −61 ± 21 9.5 ± 3.3 1.3 ± 0.7 1.7 ± 1.3 center of MACS J1206.2–0847, based on the CLASH-VLT VIMOS survey.
+Pt Src The cluster center coincides with the position of its BCG (blue circle at 0, 0).
Solid black circles indicate cluster members (see also Figure 2—lower panel of
Biviano et al. 2013). Small red crosses indicate galaxies corresponding to the
Notes. Integrated flux estimates from the MUSTANG map. The first row z ~ 0.42 peak in the redshift distribution and red circles highlight the 13
corresponds to the total SZE flux with the point source emission taken into galaxies within 1.1 Mpc of the SZE peak, that are the likely members of the
account. The bottom row is the residual flux after removing the best-fit gNFW putative group within R200. The black and red curves show the limits due to the
g= 0.7 ICM model in addition to the point source flux. The integrated fluxes escape velocity in the cluster and the group, respectively. For the group we
were computed within the regions enclosed by the 3σ contours shown in the show both sets of curves corresponding to M200 1s error limits out to 2R200.
right panel of Figure 9. The blue circle coincides with the cluster BCG, the red circle marks the
a,b brightest galaxy in the group which is located at the SZE peak, and the green
M500 and LX are derived from the A10 YSZ –M500 and M500–LX scaling
relations. square is a spiral galaxy that lies on the boundary between the cluster and the
c potential group.
We use the -765 m Jy point source model from Table 5.
11The Astrophysical Journal, 809:185 (14pp), 2015 August 20 Young et al.
Figure 14 shows the projected phase space diagram for the Table 7
galaxies in this study including escape velocity curves for both Group Mass Estimates
the primary cluster and the potential group. We compute the Method M500
escape velocities using an NFW mass density profile and the (1014 M )
procedure of den Hartog & Katgert (1996). The escape velocity
MUSTANG SZE >0.13
curves for the cluster and the group are centered on the BCG X-ray 0 , and the The strong-lensing data in Zitrin et al. (2012) (reproduced in
concentration, 3 c200 6, which is the range expected for Figure 8) reveal a massive component ∼40″ to the east of the
CLASH X-ray selected clusters (see Meneghetti et al. 2014). cluster core. If this subcluster has passed in front of or behind
For the group, we assume a spherical NFW model with the the main cluster’s core, it may have induced E–W sloshing that
12The Astrophysical Journal, 809:185 (14pp), 2015 August 20 Young et al.
has redirected one or both jets away from the line of sight. In proposed jet could be explained by sloshing of the ICM or an
this case, the radio emission observed could be a superposition infalling group to the NE.
of both lobes, or one lobe could be masked by the bright AGN
emission. Sloshing also allows for the possibility that a We thank the anonymous referee for the useful comments
detached, aged lobe or bubble was compressed adiabatically, that helped improve this manuscript. The National Radio
re-accelerating its relativistic electrons to emit in the radio (e.g., Astronomy Observatory is a facility of the National Science
Clarke et al. 2013). Deeper multi-band radio data are required Foundation operated under cooperative agreement by Asso-
to measure the spectral index of the diffuse emission to ciated Universities, Inc. The GBT+MUSTANG observations
distinguish the possibilities. In addition, higher resolution radio presented here were obtained with telescope time allocated
data are necessary to understand the nature of the western radio under NRAO proposal IDs AGBT11A009, and AGBT11B001.
feature and its interaction with the surrounding ICM and Additional funding was provided by NSF/AST-1309032. The
connection to, or detachment from, the AGN. Bolocam observations presented here were obtained operating
In the sloshing scenario outlined above, the MUSTANG from the Caltech Submillimeter Observatory, which, when the
SZE residual substructure (right panel of Figure 9) is most data used in this analysis were taken, was operated by the
plausibly an interloping foreground structure associated with California Institute of Technology under cooperative agreement
the group discussed in Section 5.2.2. with the National Science Foundation. Bolocam was con-
structed and commissioned using funds from NSF/AST-
9618798, NSF/AST-0098737, NSF/AST-9980846, NSF/
6. CONCLUSION AST-0229008, and NSF/AST-0206158. Bolocam observations
were partially supported by the Gordon and Betty Moore
We have presented high-resolution images of the SZE from Foundation, the Jet Propulsion Laboratory Research and
MUSTANG observations of MACS J0647.7+7015 and MACS Technology Development Program, as well as the National
J1206.2–0847. We compare the MUSTANG measurements to Science Council of Taiwan grant NSC100-2112-M-001-008-
cluster profiles derived from fits to lower resolution Bolocam MY3. The MACS J1206.2–0847 spectroscopic data were based
SZE data and find that in general a steeper core profile is called on the ESO VLT Large Programme (prog. ID 186.A-0798, PI:
for compared to the universal pressure profile from A10. We P. Rosati). Basic research in radio astronomy at the Naval
caution that the serial-fitting approach in this work inherently Research Laboratory is supported by 6.1 Base funding. The late
treats the fit to the Bolocam data as an additional prior on the night assistance of the GBT operators Greg Monk, Donna
final fit to the MUSTANG data, and thus does not provide the Stricklin, Barry Sharp and Dave Rose was much appreciated
statistically accurate error bars one can obtain from a joint during the observations. Much of the work presented here was
fitting procedure. We thus refer the reader to Romero et al. supported by NSF grant AST-0607654. Support for TM was
(2015) for a more comprehensive joint analysis of MUSTANG provided by NASA through the Einstein Fellowship Program,
+Bolocam data. grant PF0-110077, and through a National Research Council
We use archival Chandra data to generate pseudo-SZE Research Associateship Award at the U.S. Naval Research
models for both MACS J0647.7+7015 and MACS Laboratory. Support for P.K. and A.Y. was provided by the
J1206.2–0847, which we normalize based on the integrated NRAO Student Observing Support (SOS) and NASA Post-
flux within a 1′ radius from the Bolocam observations. We find doctoral Fellowship programs. J.S. was partially supported by a
that the Bolocam SZE profile in the core is shallower than the Norris Foundation CCAT Postdoctoral Program Fellowship
pseudo-SZE, which we attribute to smoothing by the Bolocam and by NSF/AST-1313447.
PSF on the scales shown in these maps.
In MACS J0647.7+7015 the MUSTANG SZE decrement
closely follows the shape and flux expected from the X-ray REFERENCES
pseudo-SZE map. The MUSTANG and Bolocam data are well
Agudo, I., Thum, C., Wiesemeyer, H., et al. 2012, A&A, 541, A111
described by a gNFW model with g = 0.9. Annunziatella, M., Biviano, A., Mercurio, A., et al. 2014, A&A, 571, A80
MUSTANG detects the central AGN in MACS Arnaud, M., Pratt, G. W., Piffaretti, R., et al. 2010, A&A, 517, A92 (A10)
J1206.2–0847 in addition to an excess of SZE emission to Bhattacharya, S., Habib, S., Heitmann, K., & Vikhlinin, A. 2013, ApJ, 766, 32
the NE. We compare the MUSTANG data to models derived Birkinshaw, M. 1999, PhR, 310, 97
Biviano, A., Rosati, P., Balestra, I., et al. 2013, A&A, 558, A1
from Bolocam and find that a gNFW with g = 0.7 best Carlstrom, J. E., Holder, G. P., & Reese, E. D. 2002, ARA&A, 40, 643
describes the data. After accounting for the point source and Cassano, R., Brunetti, G., Norris, R. P., et al. 2012, A&A, 548, A100
primary ICM distribution, MUSTANG measures a ∼3σ Cavagnolo, K. W., Donahue, M., Voit, G. M., & Sun, M. 2009, ApJS, 182, 12
residual decrement to the NE. Using spectroscopic redshift Clarke, T. E., Randall, S. W., Sarazin, C. L., Blanton, E. L., & Giacintucci, S.
2013, ApJ, 772, 84
measurements, we carry out a kinematic analysis of the Czakon, N. G., Sayers, J., Mantz, A., et al. 2015, ApJ, 806, 18
galaxies surrounding the main cluster and find evidence for a den Hartog, R., & Katgert, P. 1996, MNRAS, 279, 349
13 member group at z ~ 0.42. From the X-ray and SZE data Dicker, S. R., Korngut, P. M., Mason, B. S., et al. 2008, Proc. SPIE, 7020, 5
we derive upper and lower bounds, respectively, for the mass Ebeling, H., Barrett, E., Donovan, D., et al. 2007, ApJL, 661, L33
of this group. We carry out a multi-halo fit to constrain a weak- Ebeling, H., Edge, A. C., & Henry, J. P. 2001, ApJ, 553, 668
Ebeling, H., Ma, C. J., Kneib, J.-P., et al. 2009, MNRAS, 395, 1213
lensing mass estimate for the group and find good agreement Fadda, D., Girardi, M., Giuricin, G., Mardirossian, F., & Mezzetti, M. 1996,
with the mass derived from the VLT data. ApJ, 473, 670
Observations with the GMRT at 610 MHz reveal extended Ferrari, C., Intema, H. T., Orrù, E., et al. 2011, A&A, 534, L12
radio emission west of the central AGN. We suggest that this Gilmour, R., Best, P., & Almaini, O. 2009, MNRAS, 392, 1509
Haig, D. J., Ade, P. A. R., Aguirre, J. E., et al. 2004, Proc. SPIE, 5498, 78
emission is an AGN-driven plasma bubble or jet. While deeper Hung, C.-L., & Ebeling, H. 2012, MNRAS, 421, 3229
multi-wavelength and higher resolution data are required to Itoh, N., Kohyama, Y., & Nozawa, S. 1998, ApJ, 502, 7
characterize this feature, the asymmetric morphology of the Itoh, N., & Nozawa, S. 2004, A&A, 417, 827
13The Astrophysical Journal, 809:185 (14pp), 2015 August 20 Young et al.
Jewell, P. R., & Prestage, R. M. 2004, Proc. SPIE, 5489, 312 Pointecouteau, E., Giard, M., Benoit, A., et al. 1999, ApJL, 519, L115
Kitayama, T., Komatsu, E., Ota, N., et al. 2004, PASJ, 56, 17 Postman, M., Coe, D., Benítez, N., et al. 2012, ApJS, 199, 25
Komatsu, E., Matsuo, H., Kitayama, T., et al. 2001, PASJ, 53, 57 Pratt, G. W., Croston, J. H., Arnaud, M., & Böhringer, H. 2009, A&A,
Korngut, P. M., Dicker, S. R., Reese, E. D., et al. 2011, ApJ, 734, 10 498, 361
Mann, A. W., & Ebeling, H. 2012, MNRAS, 420, 2120 Press, W. H., Teukolsky, S. A., Vetterling, W. T., & Flannery, B. P. 1992,
Mantz, A., Allen, S. W., Ebeling, H., Rapetti, D., & Drlica-Wagner, A. 2010, Numerical Recipes in C. The Art of Scientific Computing (2nd ed.;
MNRAS, 406, 1773 Cambridge: Cambridge Univ. Press)
Mason, B. S., Dicker, S. R., Korngut, P. M., et al. 2010, ApJ, 716, 739 Reese, E. D., Kawahara, H., Kitayama, T., et al. 2010, ApJ, 721, 653
Medezinski, E., Umetsu, K., Nonino, M., et al. 2013, ApJ, 777, 43 Romero, C., Mason, B. S., Sayers, J., et al. 2015, ApJ, 807, 121
Meneghetti, M., Rasia, E., Vega, J., et al. 2014, ApJ, 797, 34 Sayers, J., Czakon, N. G., Mantz, A., et al. 2013, ApJ, 768, 177 (S13)
Mroczkowski, T., Bonamente, M., Carlstrom, J. E., et al. 2009, ApJ, 694, 1034 Sayers, J., Golwala, S. R., Ameglio, S., & Pierpaoli, E. 2011, ApJ, 728, 39
Mroczkowski, T., Dicker, S., Sayers, J., et al. 2012, ApJ, 761, 47 Sunyaev, R. A., & Zel’dovich, Y. B. 1972, CoASP, 4, 173
Munari, E., Biviano, A., Borgani, S., Murante, G., & Fabjan, D. 2013, Umetsu, K., Medezinski, E., Nonino, M., et al. 2012, ApJ, 755, 56
MNRAS, 430, 2638 Umetsu, K., Medezinski, E., Nonino, M., et al. 2014, ApJ, 795, 163
Nagai, D., Kravtsov, A. V., & Vikhlinin, A. 2007, ApJ, 668, 1 van Weeren, R. J., Intema, H. T., Röttgering, H. J. A., Brüggen, M., &
Nikolic, B., Prestage, R. M., Balser, D. S., Chandler, C. J., & Hills, R. E. 2007, Hoeft, M. 2011, MmSAI, 82, 569
A&A, 465, 685 Vollmer, B., Gassmann, B., Derrière, S., et al. 2010, A&A, 511, A53
Plagge, T., Benson, B. A., Ade, P. A. R., et al. 2010, ApJ, 716, 1118 Weiland, J. L., Odegard, N., Hill, R. S., et al. 2011, ApJS, 192, 19
Planck Collaboration, Ade, P. A. R., Aghanim, N., et al. 2013a, A&A, Zitrin, A., Broadhurst, T., Barkana, R., Rephaeli, Y., & Benítez, N. 2011,
550, A131 MNRAS, 410, 1939
Planck Collaboration, Ade, P. A. R., Aghanim, N., et al. 2013b, A&A, Zitrin, A., Rosati, P., Nonino, M., et al. 2012, ApJ, 749, 97
550, A132 ZuHone, J. A., Markevitch, M., Ruszkowski, M., & Lee, D. 2013, ApJ,
Planck Collaboration, Ade, P. A. R., Aghanim, N., et al. 2014, A&A, 571, A16 762, 69
14You can also read