Expected Distribution of Surfing Days in the Iberian Peninsula - MDPI
←
→
Page content transcription
If your browser does not render page correctly, please read the page content below
Journal of
           Marine Science
           and Engineering

Article
Expected Distribution of Surfing Days in the
Iberian Peninsula
Anna Boqué Ciurana *             and Enric Aguilar
 Centre for Climate Change, Geography Department, Universitat Rovira i Virgili, 43480 Vila-seca, Spain;
 enric.aguilar@urv.cat
 * Correspondence: anna.boque@urv.cat

 Received: 7 July 2020; Accepted: 8 August 2020; Published: 11 August 2020

 Abstract: This study presents, for the first time, a comprehensive characterization of the surf spots
 around the Iberian Peninsula and provides surfers and stakeholders an evaluation of the expected
 surfing days per year on each region and spot. The provision of this climate information can help
 to decision-making and limit the economic and social damages caused by climate-related disasters.
 This product aligns with the concept of climate services, increasingly requested to help economic
 activities to achieve optimal performances. We employ use in our study of two sources of data:
 meteorological buoys (Redcos, Redex and Costeira) and citizen science data, specifically information
 mined from surfers reanalyzed, namely the information contained in the Glassy app for smartphones
 (GAC & GAS). The surf spots are characterized using bottom type, surf break type and optimal wind
 (Owd ) and optimal swell direction (Osd ). Then, we define a surfing day as the ones in which optimal
 swell direction and waves bigger than 0.9 m occur; using three parameters mean swell direction (Dmd ),
 significant wave height (Hm0 ) and optimal swell direction for each surf spot (Osd ) and compute the
 expected frequency of surfing days per year. Once this is done, we attempt to validate the approach
 taken to characterize a surfing day using buoys parameters (Hm0 , Hmax , Tp and Dmd) and information
 about actual surf sessions for a small subset of our spots (i.e., Costa Tarragona). Our findings confirm
 that the area of western shore is the best suited for surfing, with over 300 days/year, followed by
 northern shore (300, 200 days/year) and southern and southeastern shores (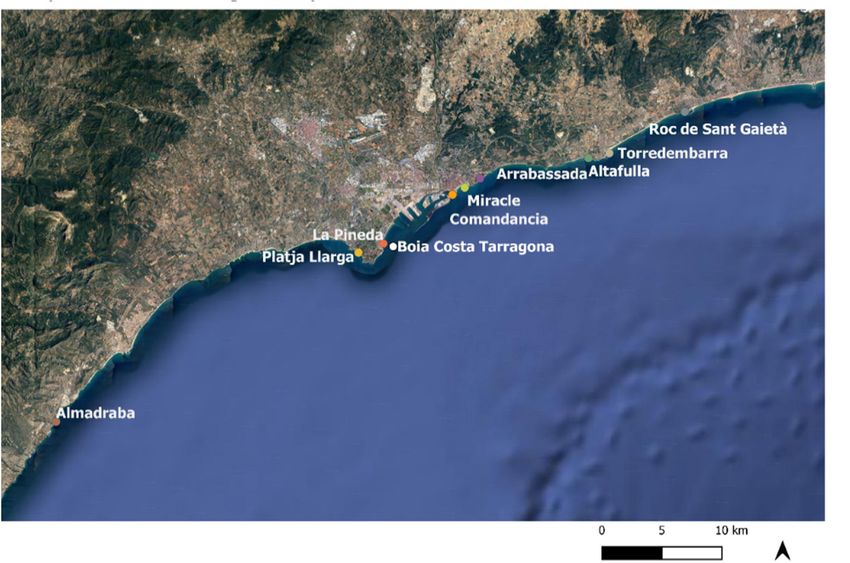
J. Mar. Sci. Eng. 2020, 8, 599                                                                      2 of 23

Hutt et al. [5] defined a ranking of the skill level for surfers, grouped in ten categories which are
differenced by the peel angle limit (deg) and the minimum and the maximum wave height (m). Hence,
different surfing waves attract different surfers to either match or challenge their abilities [5,6].
     Waves knowledge is central to any attempt to describe surfing spots, more specifically the
organization of the waves (swell) and the way they break and peel. When the wind blows over the
ocean’s surface, it creates wave energy. Wave characteristics depend on the wind speed and directional
constancy, the time the wind is blowing and the extent of the oceanic area affected by the flow. As wave
energy travels through the open ocean, it becomes an organized train of waves or swell. Swells present
typical wave periods (T), depending on their origin. Ocean swell, also known as ground swell, is the
best type for surfing, as it produces non mixed waves with large values of T. Groundswell is generated
by storms and the stronger the swell, the larger tend to be the wave periods.. Wind swell is created by
wind local winds acting near shore. As a result, it is not as powerful as groundswell and relates to
short wave periods. Surfers’ seek well organized wave trains with large wave periods, so ocean swells
are preferred over wind and coastal swells. Nevertheless, the perception of swell period for surfing
depends on the oceanic basin. For example, in the Mediterranean, local surfers call low periods those
smaller than four seconds, medium between four seconds and eight seconds and high periods are those
larger than eight seconds. This contrasts with the typical values for the Atlantic, where low periods are
those smaller than eight seconds, medium range between 8 s and 13 s and high, larger than 13 s [7].
     When waves approach the shore, they eventually break. Breaking characteristics depend on
the shore morphology, wind strength and direction. Offshore winds increase breaking intensity and
onshore or cross-shore winds reduce it [8]. The perfect conditions for surfing are light offshore winds
or no wind [9]. These wind conditions delay wave breaking, causing the wave to break in shallower
water and increasing the breaking intensity. Strong offshore winds make waves hard to catch [10].
When there is no wind, it is called glassy conditions and is regarded as the best condition for surfing in
terms of coastal winds.
     Furthermore, surfing requires a steep unbroken wave face to create board speed for performing
maneuvers, referred as peel [11]. The peel angle, related to the break angle and the wave obliquity at
the breaking depth, determines the speed that the board must adopt to stay ahead of the breaking
section of the wave [12]. A minimum peel angle of 30◦ is generally required for surfing, large peel
angles are generally associated with nonuniform bottom contours [13].
     In the previous paragraphs we described the importance of the characteristics of the wave breaks
and the factors influencing them. These factors can be monitored using four parameters: breaking
wave height, wave peel angle, wave breaking intensity and wave section length. Wave height–defined
as the vertical distance between the trough of a wave and the following crest is perhaps the most
important; wave peel angle is defined as the angle between the trail of the broken whitewater and the
crest of the unbroken wave as it propagates shoreward. The wave breaking intensity is defined by
the orthogonal seabed gradient and it is the dominant variable controlling the wave breaker intensity.
The wave section length–defined as the distance between two breaking crests in a wave set–occurs
when the wave breaks and, depending on the characteristics of the sections originated, surfers can
perform different maneuvers [14]. According to the values of these parameters, the waves will be
useless for surf, adequate for beginners, for intermediate level or for advanced surfers [5].
     The seabed morphology plays an important role in creating wave breakers. Planar beaches
with parallel contours do not produce good surfing breaks [14]. The peel angle is too low for
surfing, Waves simply closeout as the crest breaks all at once rather than peeling. Other bathymetric
configurations—i.e., sandbar and reef break, see Section 3 for further description—are needed to cause
waves to break along the wave crest rather than all at once. Most surfing spots are near prominent
morphologic features which create rough seafloors, such as river mouths, with ebb deltas, coral/rock
reefs, points, rock ledges, piers, jetties or beaches where large scale bar/rip features [15,16].
     Depending on the characteristics of the seafloor, three different types of surf breaks are defined:
beach break, point break and reef break. In beach breaks, the wave breaks on a sand bottom. Wave shape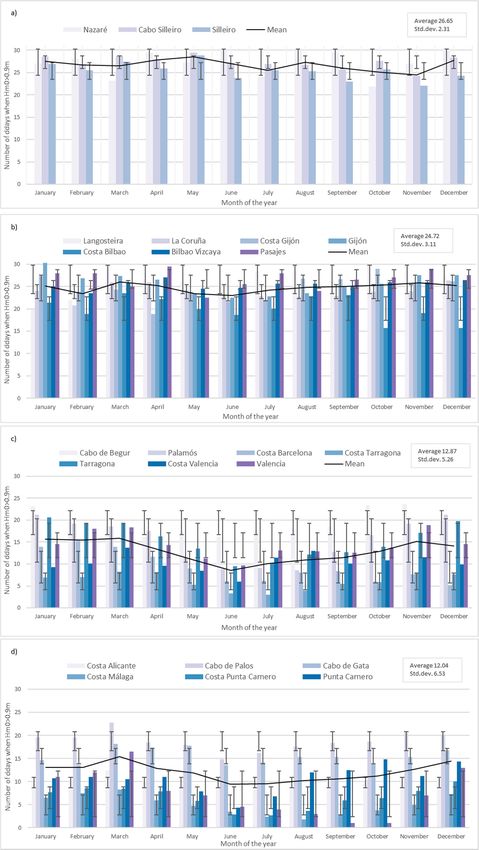
J. Mar. Sci. Eng. 2020, 8, 599                                                                       3 of 23

and size will vary depending upon the interaction of the incoming wave field with the underlying
sandbar morphology. In a point break, the wave breaks at a rocky point which can be natural or
artificial, for example, a dike. In a reef break, the wave breaks on shelves of rocks or coral and are the
most consistent in terms of wave shape and peak location.
      In this context of fragility of the surf spots—if their environment is modified by the building of a
harbor or a jetty—the surfing conditions will also be modified somehow. In order to preserve the surfing
resource, it is believed that consideration must be given to the coastal management of these spots
because, historically, many surfing breaks have been altered or destroyed by coastal development [17].
Moreover, as said by Caldwel, M.R. et al. [18] and Corne, N.P. et al. [19], coasts—and specifically surf
spots—are highly dynamic and often fragile environments, particularly susceptible to local and global
environmental threats. Nevertheless, on a global level, some engineers are inspired by natural reefs to
not only protect the shore, but also to provide good surfing spots.
      Thus, not all surfing breaks are entirely natural. They can be created, modified or destroyed
by human activities, such as building seawalls (e.g., Saint Clair, Dunedin, New Zealand), jetties
(e.g., Mission Bay jetties, San Diego, California), boating infrastructure (e.g., Manu Bay, Raglan,
New Zealand), piers (e.g., Oil Piers, Ventura, California) and beach nourishment (e.g., “The Cove”
Sandy Hook, New Jersey). It is not surprising that many existing surfing breaks are unnatural because
there are few environments that have not been impacted to some degree by human activity [20,21].
      As our previous discussion suggests, the determination of the characteristics of existing or
potential surfing spots is complex and requires surf quality studies at different scales [22]. While several
global studies are available in the literature [23–25] this is not the case for regional and local studies
which consider higher resolution and more localized variability, with the exception of [26,27]. In this
regard, we are not aware of any study which describes the distribution of the number of surfing
days per month for each spot in the Iberian Peninsula. In fact, what is known is that it is difficult
to have a spot where favorable surfing conditions occur every day of the year–which means that
wave, wind, tide and bathymetry conditions would be conducive to surfing. In this study, we pursue
the following objectives: (1) to investigate the wave parameters needed to classify surfing days thus
obtain wave climate (2) thus, this specific wave climate allows us to assess the dependence on these
parameters to know the expected surfing days per year in different surf spots around the Iberian
Peninsula. Surf-crafts considered for the study are shortboards and longboards.
      The remainder of this paper is organized as follows: study site, data and methods are presented
in Section 2; we present our results at Section 3, to finish with discussion and conclusions (Section 4).

2. Study Area, Data and Methods

2.1. Study Area and Data
      The study area covers the coast of the Iberian Peninsula, located in the southwest corner of the
European continent. The countries which form the peninsula are Spain, Portugal, a small area of
France, Andorra and the United Kingdom (Gibraltar). For this study, the Iberian Peninsula coast is
divided into 14 regions regarding NUTS2 classification—nomenclature of territorial units for statistics
from the European Union, which contains a total of 872 surfing spots, from which we will concentrate
on the 46 that can be directly related to available buoy data (see Section 2.2). Both NUTS2 regions and
selected spots are shown in Figure 1.
      The Iberian Peninsula is studied in four main categories: western shore, northern shore, southern
shore and southeastern shore-taking as reference the cardinal points. Each main group is formed by
territorial subcategories divided in NUTS2. Each NUTS2 region has several specific spots.
      This study uses different data sources to study the characteristics of waves. Historical wave data
are extracted from 25 buoys managed by Puertos del Estado (http://www.puertos.es/es-es/oceanografia/
Paginas/portus.aspx.) (Spain) and integrated in the REDCOS network (coastal buoys) and REDEXT
network (open ocean buoys) and the Nazaré buoy from the Instituto Hidrográfico Marinha Portugal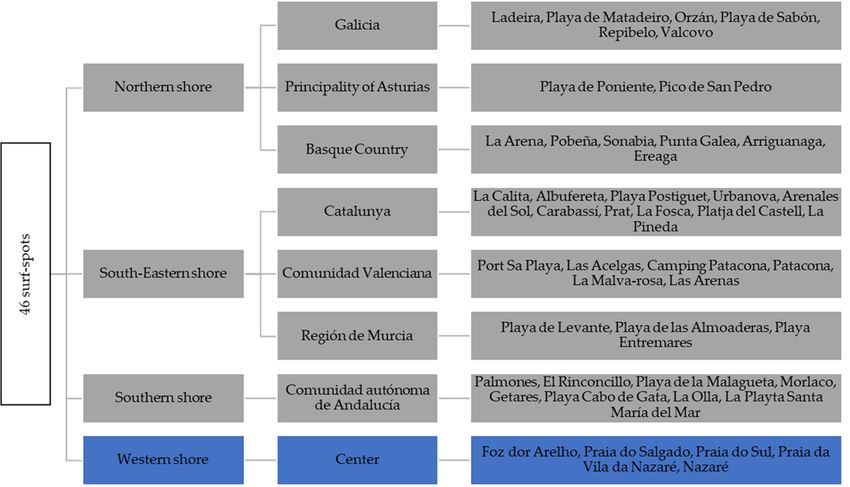
J. Mar. Sci. Eng. 2020, 8, 599                                                                              4 of 23

(https://www.hidrografico.pt/boias.) (Portugal) (see Figure 2 and Table 1). The buoys from the REDEXT
network are characterized by being located offshore in areas with depths over 200 m, to ensure that
the measurements are not perturbed by local effects and are representative of large littoral areas.
The REDCOS buoys, installed in depths of 100 m more less, complement REDEXT measurements
highlighting local conditions in specific areas of interest for harbor activities or for the validation of
wave models. Their measurements are conditioned by the shore’s profile and by the effects of the
bottom     onEng.
  J. Mar. Sci. the 2020,
                   surge.8, x The buoyREVIEW
                              FOR PEER data are quality controlled in origin.                        4 of 23

       Figure 1. Selected 46 surf spots structure, organized by section and political region (Autonomous
         Figure 1. Selected 46 surf spots structure, organized by section and political region (Autonomous
       Communities for Spain; statistical regions (NUTS2), managed by the regional coordination and
         Communities
J. Mar.development
        Sci. Eng. 2020, 8, xfor
                             FORSpain;
                                 PEER statistical
                                       REVIEW for regions (NUTS2), managed by the regional coordination and5 of 23
                        commissions    (CCDRs)       Portugal).
         development commissions (CCDRs) for Portugal).

        This study uses different data sources to study the characteristics of waves. Historical wave data
  are extracted from 25 buoys managed by Puertos del Estado1 (Spain) and integrated in the REDCOS
  network (coastal buoys) and REDEXT network (open ocean buoys) and the Nazaré buoy from the
  Instituto Hidrográfico Marinha Portugal2 (Portugal) (see Figure 2 and Table 1). The buoys from the
  REDEXT network are characterized by being located offshore in areas with depths over 200 m, to
  ensure that the measurements are not perturbed by local effects and are representative of large littoral
  areas. The REDCOS buoys, installed in depths of 100 m more less, complement REDEXT
  measurements highlighting local conditions in specific areas of interest for harbor activities or for the
  validation of wave models. Their measurements are conditioned by the shore’s profile and by the
  effects of the bottom on the surge. The buoy data are quality controlled in origin.
        This study analyzed historic wave data recorded between 1982 and 2019 (see again Table 1 for
  details). The data were collected hourly in most of the network, except for La Coruña, where data
  were collected every four hours and Costa Alicante, Costa Málaga and Bilbao–Vizcaya where data
  were collected every three hours. The variables analyzed in this study were significant wave height
  Hm0, maximum wave height Hmax, peak wave period Tp and average swell direction Dmd.

                          Figure 2. Nearshore BDS distribution around the Iberian Peninsula.
                          Figure 2. Nearshore BDS distribution around the Iberian Peninsula.

     To identify the specific characteristics needed for surfing in the specific surf spots, we make
complementary use of information obtained from the Glassy app3. This app is made for surfers use
and it contains more than 18,000 surf spots around the world. It allows one to store the surfing
session. The application was developed thanks to a startup in Valencia (Spain). In this regard the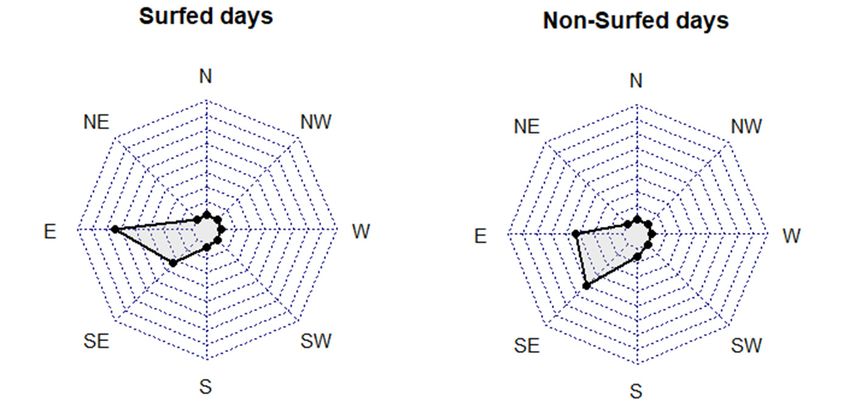
J. Mar. Sci. Eng. 2020, 8, 599                                                                                          5 of 23

                                                  Table 1. Studied buoys.

      Name of the Buoy            Period of the Dataset     Network Buoy    Variables Provided and Measure Units
       Costa Algeciras           2004-03-17 to 2005-07-29     REDCOS            Hm0 (m) , Hmax (m) , Tp (s) , Dmd (º)
       Costa Alicante            1985-09-26 to 2014-01-15     REDCOS            Hm0 (m) , Hmax (m) , Tp (s) , Dmd (º)
       Costa Barcelona           2004-03-08 to 2019-09-12     REDCOS            Hm0 (m) , Hmax (m) , Tp (s) , Dmd (º)
         Costa Bilbao            2004-02-26 to 2019-09-12     REDCOS            Hm0 (m) , Hmax (m) , Tp (s) , Dmd (º)
         Costa Gijon             2001-02-02 to 2019-09-12     REDCOS            Hm0 (m) , Hmax (m) , Tp (s) , Dmd (º)
        Costa Malaga             1985-11-19 to 2019-09-12     REDCOS            Hm0 (m) , Hmax (m) , Tp (s) , Dmd (º)
     Costa Punta Carnero         2010-11-12 to 2019-09-12     REDCOS            Hm0 (m) , Hmax (m) , Tp (s) , Dmd (º)
       Costa Valencia            2005-06-08 to 2013-10-30     REDCOS            Hm0 (m) , Hmax (m) , Tp (s) , Dmd (º)
           Palamos               1988-04-26 to 2012-04-12     REDCOS            Hm0 (m) , Hmax (m) , Tp (s) , Dmd (º)
           Pasajes               2010-03-15 to 2012-05-23     REDCOS            Hm0 (m) , Hmax (m) , Tp (s) , Dmd (º)
          Tarragona              1992-11-12 to 2019-09-12     REDCOS            Hm0 (m) , Hmax (m) , Tp (s) , Dmd (º)
         Langosteira             2013-09-06 to 2019-09-12     REDCOS            Hm0 (m) , Hmax (m) , Tp (s) , Dmd (º)
       Punta Carnero             2013-08-19 to 2019-09-12     REDCOS            Hm0 (m) , Hmax (m) , Tp (s) , Dmd (º)
       Bilbao Vizcaya            1990-11-07 to 2019-09-12     REDEXT            Hm0 (m) , Hmax (m) , Tp (s) , Dmd (º)
         Cabo Begur              2001-03-27 to 2019-09-12     REDEXT            Hm0 (m) , Hmax (m) , Tp (s) , Dmd (º)
        Cabo de Gata             1998-03-27 to 2019-09-12     REDEXT            Hm0 (m) , Hmax (m) , Tp (s) , Dmd (º)
        Cabo de Palos            2006-07-18 to 2019-09-12     REDEXT            Hm0 (m) , Hmax (m) , Tp (s) , Dmd (º)
         Cabo Silleiro           1998-07-06 to 2019-09-12     REDEXT            Hm0 (m) , Hmax (m) , Tp (s) , Dmd (º)
       Golfo de Cadiz            1996-08-27 to 2019-09-12     REDEXT            Hm0 (m) , Hmax (m) , Tp (s) , Dmd (º)
          Tarragona              2004-08-20 to 2019-09-12     REDEXT            Hm0 (m) , Hmax (m) , Tp (s) , Dmd (º)
        Valencia Copa            2005-09-15 to 2019-09-12     REDEXT            Hm0 (m) , Hmax (m) , Tp (s) , Dmd (º)
             Gijon               1994-03-22 to 2010-08-13     REDCOS            Hm0 (m) , Hmax (m) , Tp (s) , Dmd (º)
         La Corunha              1982-07-14 to 2012-12-03     REDCOS            Hm0 (m) , Hmax (m) , Tp (s) , Dmd (º)
            Silleiro             1991-02-22 to 2006-10-09     REDCOS            Hm0 (m) , Hmax (m) , Tp (s) , Dmd (º)
       Nazaré Costeira           2010-03-23 to 2018-12-31    COSTEIRA           Hm0 (m) , Hmax (m) , Tp (s) , Dmd (º)

      This study analyzed historic wave data recorded between 1982 and 2019 (see again Table 1 for
details). The data were collected hourly in most of the network, except for La Coruña, where data were
collected every four hours and Costa Alicante, Costa Málaga and Bilbao–Vizcaya where data were
collected every three hours. The variables analyzed in this study were significant wave height Hm0 ,
maximum wave height Hmax , peak wave period Tp and average swell direction Dmd .
      To identify the specific characteristics needed for surfing in the specific surf spots, we make
complementary use of information obtained from the Glassy app (The app is no longer in service,
but it is possible to download the apk if needed https://glassy-pro.es.aptoide.com/app.). This app is
made for surfers use and it contains more than 18,000 surf spots around the world. It allows one to
store the surfing session. The application was developed thanks to a startup in Valencia (Spain). In this
regard the project it was first launched as an app for the mobile phone open to all users. However,
nowadays it allows an individual user to log a surfing session experience.
      The application provides knowledge on the best conditions for each surf spot (897 across the
Iberian Peninsula, including 46 on our database) and we extract from there optimal swell direction
(Osd ), optimal wind direction (Owd ), surf break type and bottom type. The app provides access to the
forecasted conditions and allows the users to track their sessions, information that we will use for
validation purposes (see Section 2.2 for further explanations).

2.2. Methods
     To achieve the objectives described in Section 1, we combine the two data sources previously
introduced (buoy data and Glassy App data) as described in Figure 3. Our analysis is split in three steps: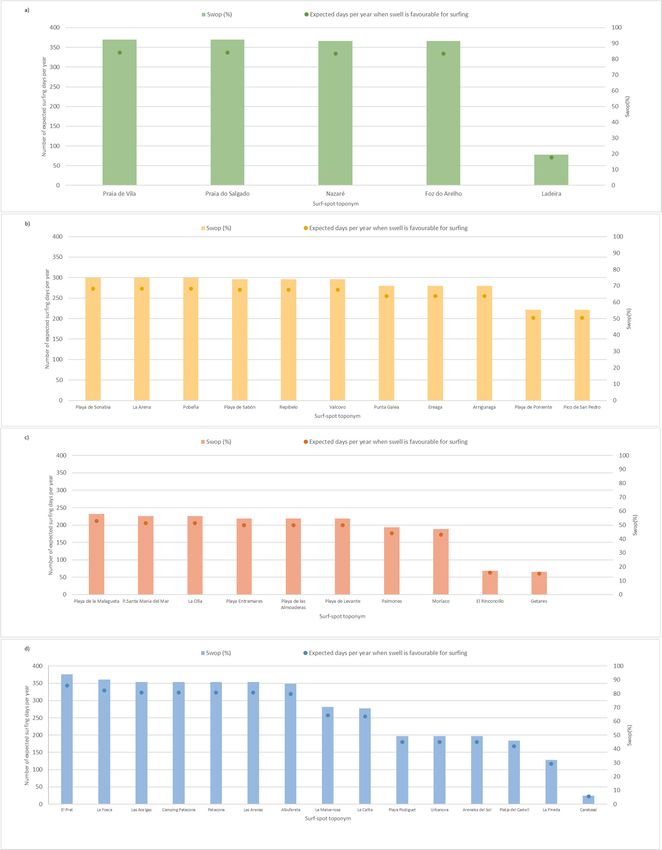
validation purposes (see Section 2.2 for further explanations).

2.2. Methods
     To achieve the objectives described in Section 1, we combine the two data sources previously
J.introduced
   Mar. Sci. Eng.(buoy
                  2020, 8,data
                       and Glassy App data) as described in Figure 3. Our analysis is split in three
                           599                                                                   6 of 23
steps:

      Figure 3. Methodology flow: from citizen science data and buoy network data to the expected surfing
      Figure
      days   3.year
           per  Methodology   flow:Peninsula.
                    in the Iberian  from citizen science data and buoy network data to the expected surfing
      days per year in the Iberian Peninsula.
       Description of the physical characteristics and optimal conditions for each surf spot, using Glassy
       Description
App Site    data (GAS,of the
                          fromphysical       characteristics
                                 now onwards):         bottomand type,optimal  conditions
                                                                       surf break           for each
                                                                                    type, optimal   windsurf  spot, using
                                                                                                           direction   (Owd ),
 Glassy App
optimal        Site
           swell     data (GAS,
                  direction   (Osdfrom
                                    ).      now onwards): bottom type, surf break type, optimal wind direction
 (Owd),Determination
         optimal swell direction        (Osd).
                          of the probability      of occurrence of optimal surf days using buoys dataset (BDS,
from Determination
        now onwards).ofFirst,the probability
                                    we identify   of at
                                                     occurrence
                                                        the buoy of    optimal
                                                                    scale        surf days using
                                                                            (macroanalysis)        buoys dataset
                                                                                               the number     of days(BDS,
                                                                                                                        with
 from   now   onwards).    First, we    identify  at the buoy    scale (macroanalysis)    the number
Hm0 > 0.9 m.; second, we combine the previous information with swell direction data and compare         of days  with   H m0

 > 0.9 m.;  second,  we  combine       the  previous   information     with  swell direction  data  and
it with the optimal swell values (see step 1) to make inference at the surf spot level. This analysis is compare    it with
 the optimal
limited   to theswell  values
                  46 surf  spots(see   stepcan
                                   which     1) to
                                                 bemake   inference
                                                     directly  linked at
                                                                       to the
                                                                           onesurf spot
                                                                               of the 25 level. Thisbuoys
                                                                                         available    analysis
                                                                                                            (seeisTable
                                                                                                                   limited
                                                                                                                         A1).
 to the  46 surf  spots  which    can    be directly  linked  to  one  of the 25 available  buoys   (see
       Results from steps 1 and 2 are validated using a citizen science as benchmark data, extracting    Table  A1).
       Results from
information      (moresteps
                         than1 1000.000
                                 and 2 arehourly
                                               validated   using a citizen
                                                        observations      fromscience  as benchmark
                                                                                the BDS)    on real surf data, extracting
                                                                                                            sessions    from
 information    (more   than  1000.000      hourly  observations    from   the BDS)  on real  surf
Glassy App Citizen data (GAC, from now onwards). Contrasting how surfers perceived and qualified   sessions  from   Glassy
 App experience.
their  Citizen data (GAC, from now onwards). Contrasting how surfers perceived and qualified their
 experience.
       The benchmark is constructed using information from the buoy, attributing Hm0 and Dmd registered
       The benchmark is constructed using information from the buoy, attributing Hm0 and Dmd
to the close by surf spots (see Figure A1). Then days are grouped in surfed days and non-surfed days.
 registered to the close by surf spots (see Figure A1). Then days are grouped in surfed days and non-
       This three steps approach allows us to rank the studied surf spots in the Iberian Peninsula
 surfed days.
according to the probability of occurrence of good surfing days.
       This three steps approach allows us to rank the studied surf spots in the Iberian Peninsula
       Step 2 is split into buoy level analysis (macro) and surf spot level (micro). The buoy macroanalysis
 according to the probability of occurrence of good surfing days.
is based on the standard significant wave height (Hm0 ) [28]. As measured and provided by buoy,
       Step 2 is split into buoy level analysis (macro) and surf spot level (micro). The buoy
Hm0 refers to the height (from the trough to the crest) of the waves following in the third quartile of
 macroanalysis is based on the standard significant wave height (Hm0) [28]. As measured and provided
the empirical wave height distribution. We adopt this variable, originated in the field of navigation,
because it is a good proxy of the state of the sea, reflecting the height of the surge that an observer would
perceive. However, for the assessment of the actual surfability of the sea, we introduce second parameter,
the mean height, MeanH, informs on the expected height of the surfable waves. It is not directly
provided by the BSD, but it is duly approximated using Equation (1), from Breatschneider et al. [29].

                                                  MeanH = 0.64 Hm0                                                        (1)

where MeanH is the mean height, Hm0 is signficant wave height.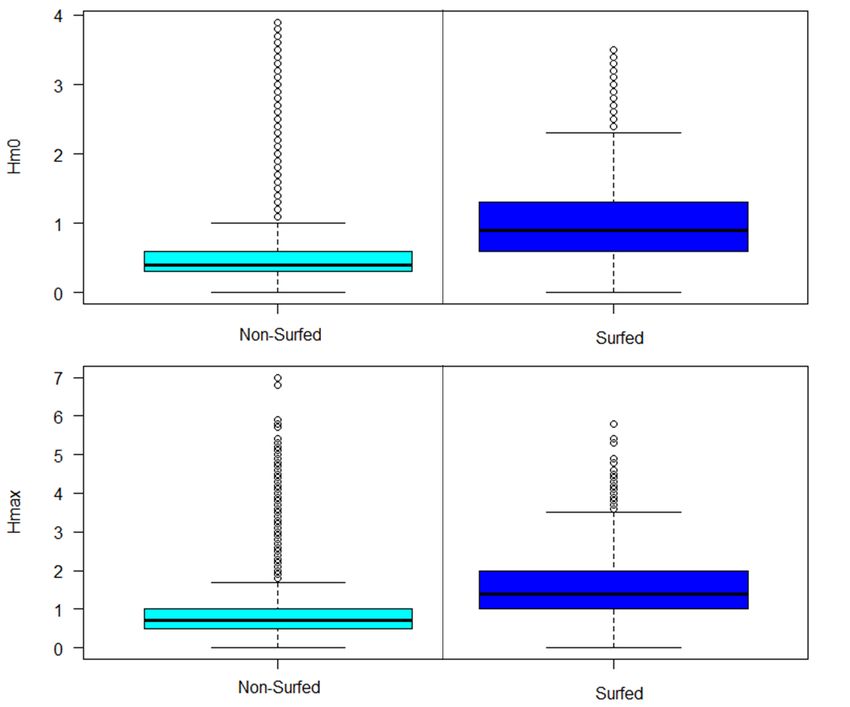
introduce second parameter, the mean height, MeanH, informs on the expected height of the surfable
waves. It is not directly provided by the BSD, but it is duly approximated using Equation (1), from
Breatschneider et al. [29].
= 0.64 0 (1)
J. Mar. Sci. Eng. 2020, 8, 599 7 of 23
where is the mean height, 0 is signficant wave height.
The number of days with MeanH > 0.5 (~Hm0 = 0.9) will be considered as surfing days [30] and
Thecompute
we will number of thedays withof
number MeanH > 0.5 (~H
exceedances = 0.9)
form0each buoywilland
be considered
provide theas surfingnormal.
monthly days [30] Inand
this
we will compute the number of exceedances for each buoy and provide
sense, we only use this simple wave height criterion to approach surfed days. That values are taken the monthly normal. In this
sense,
from BDS.we only use this simple wave height criterion to approach surfed days. That values are taken
from At BDS. the surf spot level or microanalysis, we introduce the surfing waves occurrence probability
indicator ( surf spot
At the , Equation
level or(2) microanalysis,
) defined as we theintroduce the surfingswell
ratio of favorable waves occurrence to
observations probability
the total
indicator
number of (SWOP, Equation (2)) defined as the ratio of favorable swell observations to the total number
swell observations.
of swell observations.
∑
=P (2)
∑cosd
SWOP = P (2)
where cosd is counted optimal swell mean direction, nosd is counted observations of swell direction
and cosdisisthe
where number
counted of counted
optimal observations
swell mean direction, of osd
swell direction.observations of swell direction and
is counted
nosd isThethe indicator
number of is counted
calculated for the surf of
observations spots
swell attributable
direction. to a nearby buoy (Table A1). The reason
information from the
The indicator buoys canfor
is calculated bethe
attributed
surf spotsto specific spotstoisa the
attributable propagation
nearby buoy (Table of the
A1). free-traveling
The reason
swell. The storm center is where swell propagation starts to travel from
information from the buoys can be attributed to specific spots is the propagation of the free-traveling the ocean/sea to the shore.
The swell
swell. The moves away from
storm center the generating
is where area (storm
swell propagation startscenter) withfrom
to travel circumferential
the ocean/sea dispersion
to the shore. and
radial
The dispersion.
swell moves away In this
fromrespect, waves arearea
the generating just(storm
messengers
center)ofwith
energy. The further dispersion
circumferential from the storm and
centerdispersion.
radial the swell travels,
In thisthe more it
respect, expands
waves are in
justboth radial and
messengers ofcircumferential
energy. The further directions.
from the storm
centerInthe this case,
swell only the
travels, swell itdirection
the more expandsisinconsidered
both radial for andcalculating the SWTOP
circumferential indicator. It is
directions.
important
In thistocase,
remember
only the that having
swell the necessary
direction swell direction
is considered in the surf
for calculating the spot
SWTOP will indicator.
not necessarily It is
mean having
important surfable waves,
to remember as there
that having are more variables
the necessary that also
swell direction play
in the anspot
surf important
will notrole, such as
necessarily
wind having
mean direction, peak waves,
surfable period as or there
significant wave
are more height.that also play an important role, such as wind
variables
In Step
direction, 3 (Figure
peak period or 4),significant
we attempt to validate
wave height. our results using citizen science data for the 2006–
2019In period
Step 3as(Figure
a benchmark. All the to
4), we attempt data registered
validate by citizen
our results using sensors
citizencorrespond
science datatofor daysthewhen there
2006–2019
is at least
period as aone observation
benchmark. Allofthe
a surf
datasession. These
registered bydays
citizenaresensors
considered surfed days
correspond andwhen
to days are pooled
there is to
compared them with data from the nearest buoy. Buoys measure the
at least one observation of a surf session. These days are considered surfed days and are pooled to sea state by observing a series
of instantaneous
compared them with elevations
data from of the nearest
sea levelbuoy.
during a minimum
Buoys measure timethe seainterval
state by (depending
observing on type of
a series of
the buoys). This
instantaneous sampleofisthe
elevations considered representative
sea level during a minimum of thetimewaves
intervalat (depending
that time. Next,on type Series
of theof
elevations
buoys). Thisthe standard
sample zero crossing
is considered and spectralofanalyses
representative the waves areatused
thattotime.
obtain the most
Next, Seriesrepresentative
of elevations
parameters
the standardof thecrossing
zero waves. and spectral analyses are used to obtain the most representative parameters
of theWe derive means and standard deviations for Hm0, maximum wave height (Hmax), peak period
waves.
(Tp) Weandderive
mode means
for mean andswell
standarddirection (Dmd), for
deviations whichHm0 represent
, maximum the typical
wave values
height (Hmaxfor surfedperiod
), peak days.
These
(T p ) and values
mode are
for also
meancomputed
swell using
direction data
(D for
md ), the
which whole 2006–2019
represent the period
typical for
valuescomparison.
for surfed Wedays.do
not use wind direction as REDCOST buoys do not collect that variable.
These values are also computed using data for the whole 2006–2019 period for comparison. We do not
use wind direction as REDCOST buoys do not collect that variable.
Figure 4. Conceptual explanation of the benchmarking/validation approach by using citizen science
Figure
data (Step4. Conceptual
3). Once theexplanation of the benchmarking/validation
validation process proves the methodology ofapproach by using
attributing citizen
surfing days science
to surf
data (Step
spots, 3). Once to
it is possible thecreate
validation process
a ranking forproves thesurfing
expected methodology of attributing
days per year in the surfing
studieddays
surf to surf
spots.
spots,
To it is possible
identify this, daystowhere
createH a m0 > 0.9 m
ranking forand
expected
Osd aresurfing days per year in the studied surf spots. To
selected.
identify this, days where Hm0 > 0.9 m and Osd are selected.
3. Results
In this section, we present an overview of the 872 surf spots characteristics of the Iberian Peninsula,
namely: bottom type, surf break type, optimal swell (Osd ) and wind direction (Owd ). Then the natural
frequency of waves is presented for 46 selected surf spots, directly attributable to BDS. Afterwards,
validation process is made by using GAC, GAS and BDS for Tarragona’s coast. Finally, we show the3. Results
In this section, we present an overview of the 872 surf spots characteristics of the Iberian
Peninsula, namely: bottom type, surf break type, optimal swell (Osd) and wind direction (Owd). Then
J.
theMar. Sci. Eng.frequency
natural 2020, 8, 599 of waves is presented for 46 selected surf spots, directly attributable to 8BDS.
of 23
Afterwards, validation process is made by using GAC, GAS and BDS for Tarragona’s coast. Finally,
we show the frequency of good surfing conditions for the previously 46 selected surf spots. In this
frequency of good surfing conditions for the previously 46 selected surf spots. In this section, we see
section, we see new a contribution to wave climate science thanks to citizen science data and BDS.
new a contribution to wave climate science thanks to citizen science data and BDS.
3.1. Optimal
3.1. Optimal Wind
Wind and
and D
Dmd Conditions for Surfing
md Conditions for Surfing
We extract
We extract optimal
optimal swell
swell direction
direction (Osd)
(Osd) and
and optimal
optimal wind
wind direction
direction (Owd)
(Owd) for
for each
each surf
surf spot
spot
from GAS
from GAS (Figures
(Figures 55 and
and 6).6). The
The results
results confirm,
confirm, as as expected,
expected, that
that the
the location
location plays
plays an
an important
important
role in the direction of the necessary Dmd for surfing. The optimal Dmd rotates
role in the direction of the necessary Dmd for surfing. The optimal Dmd rotates from W–NW on from W–NW on the
the
western and northern shores to NE–S on the southeastern shore. The two regions in
western and northern shores to NE–S on the southeastern shore. The two regions in the southern shore, the southern
shore, present
present a largeraspread,
larger spread,
although although
dominant dominant
directionsdirections range
range from SWfrom
to E. SW to E. Favorable
Favorable wind
wind direction
direction corresponds to the opposite direction of optimal swell direction. The optimal
corresponds to the opposite direction of optimal swell direction. The optimal wind rotates from NE/SW wind rotates
from
on theNE/SW
westernon the western
shores to NE–SW shores to NE–SW
in northern shore.inFor
northern shore. and
southeastern For southern
southeastern and
shores, thesouthern
optimal
shores, the optimal wind direction
wind direction rotates to SW–NE. rotates to SW–NE.
Figure 5. Osd in the Iberian Peninsula’s surf spots. (a) Western shore; (b) northern shore; (c) southern
Figure 5. Osd in the Iberian Peninsula’s surf spots. (a) Western shore; (b) northern shore; (c) southern
shore; (d) south-eastern shore.
shore; (d) south-eastern shore.J. Mar. Sci. Eng. 2020, 8, 599 9 of 23
J. Mar. Sci. Eng. 2020, 8, x FOR PEER REVIEW 9 of 23
6. Owd
Figure 6. wd in
in the
the Iberian
Iberian Peninsula’s
Peninsula’s surf
surf spots
spots (%).
(%). (a)
(a) Western
Western shore;
shore; (b)
(b) northern
northern shore; (c)
shore.
southern shore; (d) south-eastern shore.
3.2. Historical Oceanographic
3.2. Historical Oceanographic Conditions.
Conditions.
In this section,
In this section, we
we present
present the
the distribution
distribution of the significant
of the significant wave
wave height
height using data from
using data from 25
25 from
from
buoys (macroanalysis) attributed to 46 surf spots (microanalysis).
buoys (macroanalysis) attributed to 46 surf spots (microanalysis).
3.2.1. Hm0 Distribution
3.2.1. Hm0 Distribution
Figure 7 presents the analysis of Hm0 > 0.9 m. The Atlantic Coast (northern and western shores)
Figure 7 presents the analysis of Hm0 > 0.9 m. The Atlantic Coast (northern and western shores)
is characterized by a larger number of days with significant wave height, Hm0 > 0.9 m. The mean
is characterized by a larger number of days with significant wave height, Hm0 > 0.9 m. The mean
values, calculated as the arithmetic average of all the spots within a region, of 26.65 days/year (western),
values, calculated as the arithmetic average of all the spots within a region, of 26.65 days/year
24.72 days/year (northern) nearly double those obtained around the Mediterranean (12.87 days/year,
(western), 24.72 days/year (northern) nearly double those obtained around the Mediterranean (12.87
South Eastern; 12.04 days/year southern). In addition, Atlantic spots present smaller seasonality
days/year, South Eastern; 12.04 days/year southern). In addition, Atlantic spots present smaller
compared to the Mediterranean shore, which presents minimum values in spring and summer and
seasonality compared to the Mediterranean shore, which presents minimum values in spring and
smaller variations across the studied spots (see standard deviations in Figure 7. Even though these
summer and smaller variations across the studied spots (see standard deviations in Figure 7. Even
considerations may be biased by the different number of spots on each category, it is worth to
though these considerations may be biased by the different number of spots on each category, it is
mentioning that the smallest monthly value in the Atlantic regions is larger than 15 days, compared to
worth to mentioning that the smallest monthly value in the Atlantic regions is larger than 15 days,
many spots in the Mediterranean that present fewer than 5 days with Hm0 > 0.9 m during spring and
compared to many spots in the Mediterranean that present fewer than 5 days with Hm0 > 0.9 m during
summer months.
spring and summer months.
Seasonality in wave results is obvious in Figure 7c and little in Figure 7d, but interestingly there
Seasonality in wave results is obvious in Figure 7c and little in Figure 7d, but interestingly there
is no strong seasonality in Figure 7a,b. These wave results patters can be associated with the swell
is no strong seasonality in Figure 7a,b. These wave results patters can be associated with the swell
producing systems. The main generators of surfing wave are low pressures, so atmospheric travel
producing systems. The main generators of surfing wave are low pressures, so atmospheric travel
patterns will contribute to wave surfed days patterns. Then, the requirements of having surfing days
patterns will contribute to wave surfed days patterns. Then, the requirements of having surfing days
on Iberian Peninsula’s shore will depend on surf spots location and orientation. Situations of low
on Iberian Peninsula’s shore will depend on surf spots location and orientation. Situations of low
pressures coming from N, NE, NW, S and SW represent the maximum occurrence of surfed days in
pressures coming from N, NE, NW, S and SW represent the maximum occurrence of surfed days in
the occidental Mediterranean. The swell production systems required for surfing on the northern
the occidental Mediterranean. The swell production systems required for surfing on the northern
shore of the peninsula are low pressures coming from N, NE, NW—located commonly in Great Britain.
shore of the peninsula are low pressures coming from N, NE, NW—located commonly in Great
Western shore surfing days require low pressures from W.
Britain. Western shore surfing days require low pressures from W.J. Mar. Sci. Eng. 2020, 8, 599 10 of 23
J. Mar. Sci. Eng. 2020, 8, x FOR PEER REVIEW 10 of 23
Figure 7.
Figure 7. Observed
Observed days
days where
where H
Hm0 >> 0.9
0.9 m.
m. (a)
(a) Western
Western shore;
shore; (b) northern shore;
(b) northern shore; (c)
(c) south-eastern
south-eastern
m0
shore; (d) southern shore.
shore; (d) southern shore.J. Mar. Sci. Eng. 2020, 8, 599 11 of 23
3.2.2. SWOP Analysis
Figure 8 presents the SWOP analysis. Figure 8a shows the SWOP values the western Shore.
As described in Section 2.2, SWOP values are computed using buoy data and optimal swell directions
for each surf spot. Consequently, surf spots attributed to the same buoys and with the same optimal
swell direction, i.e., Nazaré, Praia do Salgado, Praia do Sul and Praia da Vila de Nazaré, present the
same SWOP value, 92.38% (337 days) corresponding to SW, W or NW swells. For Foz do Arelho and
Nazaré, the value is 91.53% (334 days), associated with a W or NW swells. These high values contrast
with Ladeira,
J. Mar. Sci. Eng. where
2020, 8, xSWOP is 19.42%
FOR PEER REVIEW (71 days) of optimal swell. 12 of 23
Figure8.8.SWOP
Figure SWOPvalues
valuesand
and expected
expected days per
per year
year with
withOOsdsd. .(a)
(a)Western
Westernshore;
shore;
(b)(b) northern
northern shore;
shore;
(c)(c)southern
southernshore;
shore;(d)
(d)south-eastern
south-eastern shore.
shore.
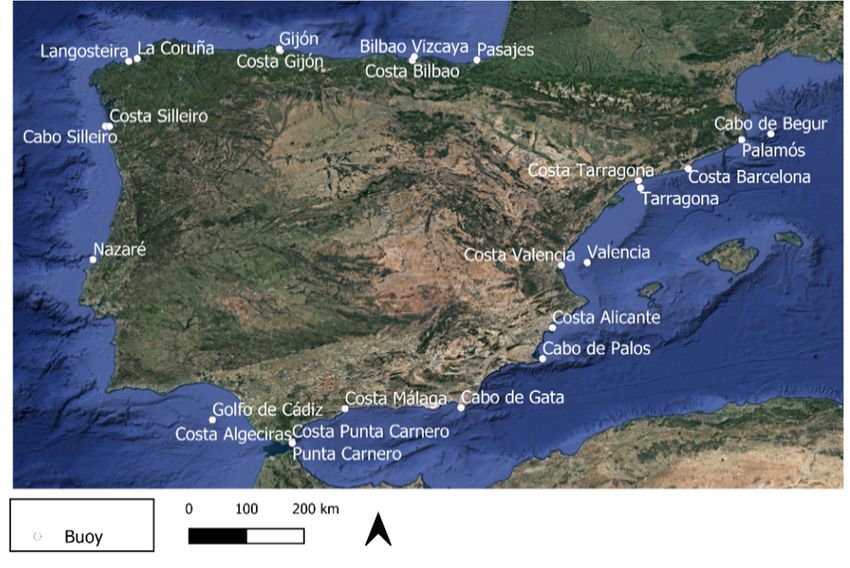
3.3. Validation Trough citizen science data and BDS
In this section, we present the distribution of Hm0, Hmax, Tp and Dmd for the data from Costa
Tarragona’s buoy. This buoy’s data were compared using a Citizens’ Science approach with surfers’
observations which identified and tagged surfing days in the past (2006–2019).J. Mar. Sci. Eng. 2020, 8, 599 12 of 23
Figure 8b presents the surf spots on the northern shore with available swell data. The SWOP
values oscillate between nearly 75% (273 days) in Playa de Sabón (W and NW swell), Repibleo and
Valcovo (SW, W or NW swells) and La Arena and Pobeña (NW swell); 70% (255 favorable days) in
Punta Galea Arriguanaga and Eraga (NW swell); and 55% (201 favorable days) in Gijón, Playa Poniente
and Pico de San Pedro (NW swell).
Figure 8c presents the SWOP values for southeastern shore. These values are smaller than the ones
representing the areas previously presented. The SWOP values oscillate between 57.92% (212 days) in
Playa de la Malagueta (E, SE swell), 56.33% (206 days) in Playa Santa Maria del Mar and la Olla (S,
SWE swell), 54.67% (200 days) in Playa Entremares, Playa de las Almoaderas and Playa Levante (N,
NE, E swell), 48.27% (176 days) in Palmones (SE, S swell), 47.09% (172 days) in Morclaco (SE swell),
17.15% (63 days) in El Rinconcillo (NE, E, SE, S, SW swell) and 16.38% (60 days) in Getares (SE swell).
Figure 8d presents the SWOP values for southern shore. SWOP biggest value for this region
is 93.9% (343 days) in El Prat (NE, E, SE, S swell), followed by La Fosca (NE, E, SE, S swell) 90.07%
(329 days); 88.4% (323 days) in las Acelgas, la Patacona, Camping la Patacona, Las Arenas (E, SE swell);
87.23% (319 days) in la Albufereta (E, SE, S swell); 70.48% (257 days) in La Malva-rosa; 69.48% (254 days)
in La Calita (E, SE swell); 49.34% (180 days) in Playa Postiguet, Urbanova and Arenales del Sol; 46.06%
(168 days) in Platja del Castell (SE, S, SW swell) and 32.14% (117 days) in La Pineda (NE, E swell).
The SWOP values in the Iberian Peninsula range from 22 days to 329 days. The lowest value
corresponds to Carabassí and the highest one to la Fosca in Palamós. It is important to mention that the
SWOP indicator is not the only condition needed for surfing, so maybe the necessary swell direction
may be reaching a beach, but the wave height is not enough for surfing. Thanks to SWOP indicator
is shown that the expected days when the swell is favorable for surfing varies between the different
surf spots.
3.3. Validation Trough Citizen Science Data and BDS
In this section, we present the distribution of Hm0 , Hmax , Tp and Dmd for the data from Costa
Tarragona’s buoy. This buoy’s data were compared using a Citizens’ Science approach with surfers’
observations which identified and tagged surfing days in the past (2006–2019).
Table 2 provides mean values and their standard deviations of surfed days vs. non-surfed days.
They confirm the importance of the parameters shown and how they help in the characterization
of a good surfing day. As expected, the values of Hm0 and Hmax are larger on surfed days (0.96 m;
1.50 m) than on non-surfed days (0.49 m; 0.77 m). Similarly, the standard deviations are larger for the
surfed days, although this is for sure influenced by a smaller sample size. In addition, values of Tp
are larger for the surfed days (6.99 s) in respect with non-surfed days (5.12 s). It is shown that bigger
waves, bigger the periods. In addition, we encounter more constant values of swell, Dmd in surfed
days (E observations represent the 67.29% of total observations) in respect with non-surfed days (SE,
50.13%). Results show how swell direction determine surfability of a day.
Table 2. Hm0 , Hmax , Tp and Dmd values for Costa Tarragona’s buoy: 2006–2019.
Period: 2006–2019
Hm0 (m) Hmax (m) Tp (s) Dmd (Cardinal Points)
SD 1 NSD 2 SD NSD SD NSD SD NSD
Average 0.96 0.49 1.50 0.77 6.99 5.12 Mode E SE
Std. dev 0.50 0.30 0.79 0.44 1.78 1.65 % mode n 67.29% 50.13%
Q1 0.60 0.30 1.00 0.5 6.01 4.10 – – –
Q2 0.90 0.40 1.40 0.7 6.90 5.09 – – –
Q3 1.30 0.60 2.00 1 8.11 6.20 – – –
Min 0 0 0 0 0 0 – – –
Max 3.50 3.90 5.80 7 12.60 23.40 – – –
1 surfed day. 2 non-surfed day.surfed days for both parameters. Hmax and Hm0 distribution are quite similar. These patterns respond
to the definition of each parameter [29]. Boxplots show that the distribution of Hm0 and Hmax variables
are different for surfed and non-surfed days.
Table 2 shows, significant wave height distribution presents for surfed days values of percentile
25 (0.6 m) higher than for non-surfed days (0.3 m). Median for surfed days (0.9m) is higher than for
J. Mar. Sci. Eng. 2020, 8, 599 13 of 23
non-surfed days (0.4 m). The same for percentile 75, surfed days present higher values (1.3 m) than
non-surfed days (0.6 m).
Maximum
Figure wave height
9 illustrates distribution
the frequency of Hshows that on surfed days values are higher than in non-
m0 and Hmax split on surfed-days and non-surfed days.
Assurfed days.general
expected, Specifically,
trendsfor
of surfed days percentile
figure show 25 corresponds
that for surfed to 1 m,isthe
days the median median
always is 1.4
larger thanm,for
and
percentile 75 is 2 m. For non-surfed days values of the boxplot are smaller: lower
non-surfed days for both parameters. Hmax and Hm0 distribution are quite similar. These patterns quartile (0.5 m),
mean (0.7
respond m),definition
to the and the upper
of eachquartile are[29].
parameter smaller (1 m).show
Boxplots Contrary, maximum
that the values
distribution of Hoccur on non-
m0 and Hmax
surfed days.
variables are different for surfed and non-surfed days.
Figure 9.9.H
Figure Hm0 and Hmax distribution for non-surfed and surfed days in Costa Tarragona’s buoy
m0 and Hmax distribution for non-surfed and surfed days in Costa Tarragona’s buoy (2006–
(2006–2019).
2019).
Table 2 shows, significant wave height distribution presents for surfed days values of percentile
Contrary, for Hm0 and Hmax maximum values occur on non-surfed days instead of on surfed days.
25 (0.6 m) higher than for non-surfed days (0.3 m). Median for surfed days (0.9m) is higher than for
For surfed days most of Hm0 values correspond to the ones greater than 0.9 m. Nevertheless,
non-surfed days (0.4 m). The same for percentile 75, surfed days present higher values (1.3 m) than
there are some days identified as surfed days in which Hm0 values are smaller than 0.9 m. The reason
non-surfed days (0.6 m).
values of 0 m to 0.4 m exist on surfed days, is explained by the days when, for example, there are no
Maximum wave height distribution shows that on surfed days values are higher than in non-surfed
waves in the morning [0 m, 0.9 m] and then in the afternoon the wave height starts to increase [>0.9].
days. Specifically, for surfed days percentile 25 corresponds to 1 m, the median is 1.4 m, and percentile
This fact occurs because the Mediterranean shore is characterized to present small values of surfing
75 is 2 m. For non-surfed days values of the boxplot are smaller: lower quartile (0.5 m), mean (0.7 m),
days per year. In most cases, swells come from generation areas close to the coast so that coming
and the upper quartile are smaller (1 m). Contrary, maximum values occur on non-surfed days.
swell do not stay on the surf spots for so long.
Contrary, for Hm0 and Hmax maximum values occur on non-surfed days instead of on surfed days.
We count days as surfed days when citizen science data verify it. The validation process is made
For surfed days most of Hm0 values correspond to the ones greater than 0.9 m. Nevertheless, there
in Tarragona’s buoys, so it is normal that in a surfed day appear some hour in which significant wave
are some days identified as surfed days in which Hm0 values are smaller than 0.9 m. The reason values
of 0 m to 0.4 m exist on surfed days, is explained by the days when, for example, there are no waves in
the morning [0 m, 0.9 m] and then in the afternoon the wave height starts to increase [>0.9]. This fact
occurs because the Mediterranean shore is characterized to present small values of surfing days per
year. In most cases, swells come from generation areas close to the coast so that coming swell do not
stay on the surf spots for so long.
We count days as surfed days when citizen science data verify it. The validation process is made
in Tarragona’s buoys, so it is normal that in a surfed day appear some hour in which significant wave
height is smaller of 0.9. This can be explained by two reasons: (1) the swell did not arrive yet or (2)
the swell is not coming anymore. Peak period determines when surfing swell is coming or leaving.
this means that the swell is coming when periods tend to be bigger and bigger and thus bigger waves.
It happens the other way around when it goes from big periods to smaller periods, this means that
surfing waves are probably not coming anymore at that moment. Smaller the period, smaller the wave.Period: 2006–2019
Hm0 (m) Hmax (m) Tp (s) Dmd (Cardinal Points)
SD 1 NSD 2 SD NSD SD NSD SD NSD
Average 0.96
J. Mar. Sci. Eng. 2020, 8, 599 0.49 1.50 0.77 6.99 5.12 Mode E SE
14 of 23
Std. dev 0.50 0.30 0.79 0.44 1.78 1.65 % mode n 67.29% 50.13%
Q1 0.60 0.30 1.00 0.5 6.01 4.10 – – –
Figure
Q2 10 shows
0.90 the percentage
0.40 1.40 of T 0.7
p distribution
6.90 on surfed
5.09 and– non-surfed – days. General
–
distribution
Q3 patterns 1.30 of peak
0.60 period
2.00always 1 show8.11 higher 6.20periods in surfed
– days –compared –with
non-surfedMin days, in 0 exception
0 of maximum
0 0 values 0of the peak 0 period–in non-surfed– days (23.4 – s)
insteadMax of lower 3.50
values on3.90non-surfed
5.80 days 7(12.6 s). surfed
12.60 23.40 days peak period
– values– are higher– for
percentile 25, median and percentile 751 surfed (6 s, 6.9 s, 8.1 s) than for
day. 2 non-surfed day. non-surfed (4.1 s, 5.1 s, 6.2 s).
Figure TpTdistribution
10.10.
Figure for non-surfed and surfed days in Costa Tarragona’s buoy (2006–2019).
p distribution for non-surfed and surfed days in Costa Tarragona’s buoy (2006–2019).
Periods > 13 s are identified in non-surfed days, but not in surfing days. This result can probably
Figure 11 plots Dmd, distribution by cardinal points for surfed and non-surfed days. The most
imply that periods > 13 s relate to bigger waves that citizen data collectors do not try to ride. For periods
frequent direction on surfed days is east and southeast. Moreover, surfing is less frequent with south,
≤ 4 it is clear that surfed days present lower values than non-surfed days. These patterns can be
but still possible. Surfing is also viable with a southwest swell direction, but it is less frequent
explained that probably the day was categorized as surfed day, but big swell did not arrive the entire
compared with the other directions mentioned before. Furthermore, in surfed days the Dmd most
day. Finally, we see that for surfed days the Tp which fit better are the ones defined as medium (4, 8]
relevant is [E]. This range of direction matches with the orientation of the surf spots in Tarragona’s
and high (8, 13] periods for the Mediterranean. This can be explained because surfing needs high
periods, as that way surfers have more time between waves, waves are tidier and do not overlap
each other.
Figure 11 plots Dmd , distribution by cardinal points for surfed and non-surfed days. The most
frequent direction on surfed days is east and southeast. Moreover, surfing is less frequent with south,
but still possible. Surfing is also viable with a southwest swell direction, but it is less frequent compared
with the other directions mentioned before. Furthermore, in surfed days the Dmd most relevant is [E].
This range of direction matches with the orientation of the surf spots in Tarragona’s area. The next
most common Dmd is the interval of [SE] which cover the surf spots that are more oriented to the S.
From this information it is possible to say that the most common origin of swells in this area will be the
swells coming from (1) the east. Then, it is possible to have surfing days when the swell is coming
from (2) SE or S. The surfed days on which is identified another Dmd of these two mentioned would
probably be attributed to being those on which the swell is too big (m) and the diffraction does not lose
much energy and can arrive to surf spots. Nevertheless, the Dmd is not directly focused to the surf
spot orientation. The graph of non-surfed days allows us to determine that for surfing purposes in the
Costa Tarragona area values of E Dmd fit better than SE Dmd values. Note that this is studied grouping
surf spots and it is possible once they were desegregated, that maybe there is one surf spot which does
not fit correctly with E Dmd values.
The above study shows that with Hm0 values from the buoys, it is possible to consider the monthly
distribution of surfing days around the Iberian Peninsula coast with a macroanalysis (buoy-by-buoy).
In addition, with swell direction it is possible to convert that macroanalysis into a microanalysis,
downscaling buoy data to the surf spots. In this way, it is possible to attribute the surfing waves
occurrence probability to the surf spots which are closer to the analyzed buoys.microanalysis, downscaling buoy data to the surf spots. In this way, it is possible to attribute the
surfing waves occurrence probability to the surf spots which are closer to the analyzed buoys.
Afterwards, thanks to the validation process it is possible to know whether surfing days will
correspond to periods of observation when: Hm0 is higher than 0.9 m (1) and Dmd corresponds to the
O sd onSci.
J. Mar. Glassy app 8,
Eng. 2020, (2).
599The validation process is possible thanks to BDS on the Tarragona coast,15GAC
of 23
and GAS.
Figure
Figure 11.
11. Percentage
Percentage of
of D
Dmd distribution grouped by surfed and non-surfed days hourly observations
md distribution grouped by surfed and non-surfed days hourly observations
in Costa Tarragona’s
in Costa Tarragona’s buoy
buoy (2006–2019).
(2006–2019).
Table 3 presents
Afterwards, Wilcoxon-Mann–Whitney,
thanks to the validation processnonparametric
it is possible tostatistical hypothesis
know whether test,days
surfing usedwill
to
compare
correspond twotorelated
periodssamples–surfed
of observation days
when:and Hm0non-surfed days-results
is higher than 0.9 m (1) show
and significance for Hm0,
Dmd corresponds to
H and
maxO
the TpGlassy
sd on with surfed and
app (2). non-surfed
The validationdays within
process is 0.95 confidence
possible thanks interval.
to BDS on the Tarragona coast,
GAC and GAS.
Table
Table 3. Wilcoxon-Mann–Whitney
3 presents test for Hm0, Hnonparametric
Wilcoxon-Mann–Whitney, max and Tp parameters with surfed
statistical and non-surfed
hypothesis test, used to
days.two related samples–surfed days and non-surfed days-results show significance for Hm0 ,
compare
Hmax and Tp with surfed and non-surfed days
Hm0 (m) vs. within 0.95
Surf confidence
Hmax interval. Tp (s) vs. Surf
(m) vs. Surf
P-value p < 0.01 p < 0.01 p < 0.01
Table 3. Wilcoxon-Mann–Whitney test for Hm0 , Hmax and Tp parameters with surfed and
Alternative hypothesis True location shift is not equal to 0
non-surfed days.
95% confidence interval −0.499961 −0.400012 −0.699991 −0.600042 −1.899981 −1.700082
Hm0 (m)1 surfed Hmax (m)
vs. Surfday, 2 non-surfed vs. Surf
day. Tp (s) vs. Surf
P-value p < 0.01 p < 0.01 p < 0.01
Alternative hypothesis True location shift is not equal to 0
95% confidence interval −0.49996 1 −0.40001 2 −0.69999 1 −0.60004 2 −1.89998 1 −1.70008 2
1 2
surfed day, non-surfed day.
3.4. Ranking of Expected Surfing Days Per Year in the Iberian Peninsula
Our previous analyses allow us to rank the surf spots in the Iberian Peninsula according to the
expected frequency of surfing days (see Figure 12 and Table 4). Figure 12 shows the distribution of
expected surfing days per year for 46 surf spots sorted by regions. Regions with more frequency of
expected surfing days are the western shore and northern shore. Shores which present smaller values
correspond to southern and southeastern shores. As expected, it is clear that the areas of the Atlantic
Ocean present more frequency of surfing days than the shore of the Mediterranean Sea in the Iberian
Peninsula. The main results validate the idea that location of surf spots plays an important role in
the sense of surfing days frequency. Specifically, following the findings in Table 4, the top-5 surfing
spots are on the western shore (>300 days). Values of [300, 200) correspond to surf spots located on
the northern shore, specifically into Langosteira and Costa Bilbao Vizacaya placements. Values of
[200, 100) are recognized on the northern shore except for Palamós (123, southeastern shore) and La
Olla (105, southern shore). Values ofJ. Mar. Sci. Eng. 2020, 8, 599 16 of 23
Table 4. Ranking of best spots for surfing in the Iberian Peninsula.
% of Expected Surfing Expected Surfing
Surf-spot Nearest Buoy
Days Per Year 1 Days Per Year
Praia do Salgado (43) Costeira Nazaré 83.28% 304
Praia do Sul (44) Costeira Nazaré 83.28% 304
Praia da Vila da Nazaré (45) Costeira Nazaré 83.28% 304
Foz do Arelho (42) Costeira Nazaré 82.52% 301
Nazaré (46) Costeira Nazaré 82.51% 301
Repibelo (26) Lagosteira 65.23% 238
Playa de Sabón (26) Lagosteira 65.23% 238
Sonabia (29) Bilbao Vizcaya 59.30% 217
Punta Galea (30) Bilbao Vizcaya 59.30% 217
La Arena (31) Bilbao Vizcaya 59.30% 217
Arriguanaga (32) Bilbao Vizcaya 59.30% 217
Ereaga (33) Bilbao Vizcaya 59.30% 217
Pobeña (11) Costa Bilbao 53.25% 194
Playa de Poniente (12) Costa Gijón 44.79% 164
Pico de San Pedro (13) Costa Gijón 44.79% 164
La Fosca (23) Palamós 33.74% 123
La Olla (39) Golfo de Cádiz 28.80% 105
La Playita Santa María del Mar (40) Golfo de Cádiz 23.93% 87
Playa de Levante (35) Cabo de Palos 23.93% 87
Playa de las Almoaderas (36) Cabo de Palos 23.93% 87
Playa Entremares (37) Cabo de Palos 23.93% 75
Prat (9) Costa Barcelona 20.63% 67
Ladeira (38) Cabo Silleiro 18.22% 55
Port Sa Playa (17) Costa Valencia 15.09% 55
Las Acelgas (18) Costa Valencia 15.09% 55
Camping Patacona (19)
Costa Valencia 15.09% 55
Patacona (20)
Las Arenas (22) Costa Valencia 15.09% 55
La Pineda (25) Tarragona 13.90% 51
Playa de Cabo de Gata (34) Cabo de Gata 11.77% 43
Platja del Castell (24) Palamos 9.32% 34
La Malva-rosa (21) Costa Valencia 8.72% 32
Playa de la Malagueta (14) Costa Málaga 6.53% 24
Morlaco (15) Costa Málaga 4.65% 17
Albufereta (4) Costa Alicante 4.56% 17
La Calita (3) Costa Alicante 4.23% 15
Playa Postiguet (5) Costa Alicante 4.01% 15
Urbanova (6) Costa Alicante 4.01% 15
Arenales del Sol (7) Costa Alicante 4.01% 15
Palmones (1) Costa Algeciras 1.70% 6
Carbassí (8) Costa Alicante 0.88% 3
Costa Punta
Getares (16) 0.68% 2
Carnero
El Rinconcillo (2) Costa Algeciras 0.14% 1
Valcovo (28) Lagosteiraa No data No data
Playa de Matadeiro (41) La Corunha No data No data
Orzán (42) La Corunha No data No data
1 considering Hm0 > 0.9 m & favourable Dmd .
The four extreme cases of low values, of expected surfing days per year are El Rinconcillo (1),
Getares (2), Carbassí (3) and Palmones (6). El Rinconcillo, Getares and Palmones are in the same gulf;
its geomorphological structure influence waves arrival obstructing waves propagation.You can also read