The growth and changing complexion of Luton's population A structural analysis and decomposition - Dr L. Mayhew Sam Waples Mayhew Harper ...
←
→
Page content transcription
If your browser does not render page correctly, please read the page content below
The growth and changing
  complexion of Luton’s population

        A structural analysis and
             decomposition

Dr L. Mayhew
Sam Waples
Mayhew Harper Associates Ltd.
January 2011
Lesmayhew@googlemail.com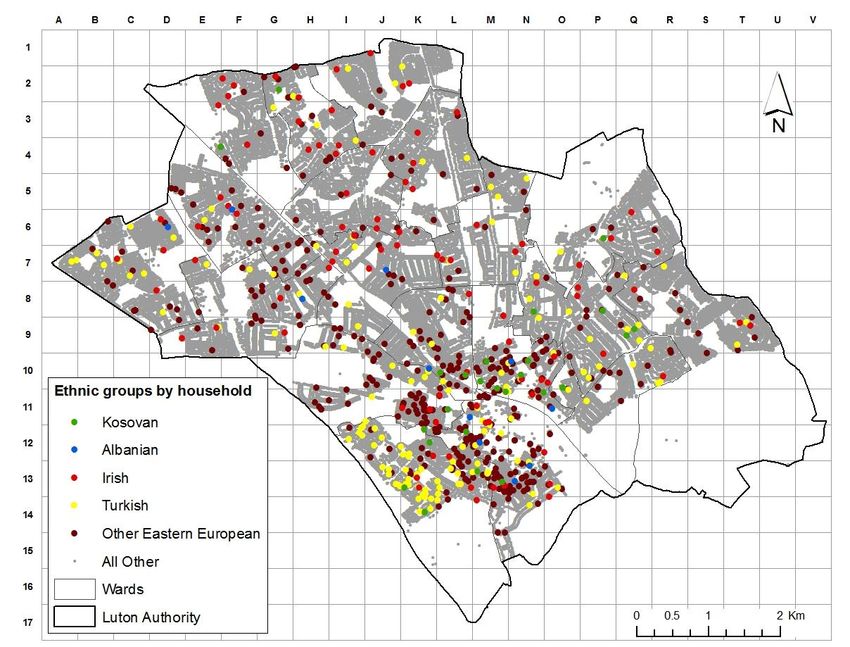
Luton population growth and change

Executive summary
In recent years, Luton has experienced significant in-migration from Eastern Europe
(both EU and non-EU countries), West Africa and elsewhere. This has significantly
changed the demographic composition and ethnic complexion of the town. This in
turn has impacted upon public service delivery and processes of engagement between
the Council (and other public bodies) and local communities. The Council recognises
the importance of understanding the demographics of the town when planning and
delivering services and in engaging with its diverse communities.

The Council is aware of the limitations of official statistics in providing this evidence.
In particular, the limitations of the 2001 Census, where Luton experienced one of the
lowest response rates in the country. The Council does not accept that the ONS Mid-
Year Population Estimates are an accurate measure of the population of the town. In
turn, this means that the Council does not accept the ONS experimental ethnicity
estimates as being accurate.

The Migration Impact Fund provided an opportunity to plug this gap in knowledge.
The Luton Local Strategic Partnership accepted the business case for research into the
changing population of Luton and released MIF monies for this purpose. The Council
commissioned Mayhew Harper Associates Ltd. to undertake this work with the
following terms of reference:

These were to:

   o identify the ‘new communities’ within Luton
   o understand the demographic profiles of these new communities
   o understand the drivers of migration and how it will change the Luton
     population in the future
   o understand the drivers of migration and how it will impact upon these new
     communities in Luton
   o develop a proactive approach to monitoring and assessing the Luton
     population.

Mayhew Harper Associates Ltd. used administrative data provided by the Borough
Council and NHS Luton to measure and profile Luton’s population. These data were
supplemented by analysis of a ‘names’ database to help with the identification of
different ethnicities. The analysis is a snapshot of Luton in 2010.

The key findings of the research are:

   o Luton’s population is a confirmed minimum of 202,748. This is comparable
     with the Council’s own estimate of 204, 700 and significantly above the ONS
     Mid-Year Estimate of 194,400.

   o Luton’s population live in approximately 77,000 households.

   o Average household size in Luton is 2.6 – which is above national averages and
     has not decreased since the 2001 Census.

                                                                                        2
Luton population growth and change
o There is wide variation in household size amongst different ethnic groups –
with Asian households being larger than average.
o There have been significant shifts in the ethnic composition of Luton since the
last Census including:
generally increasing ethnic diversity among the population
growth in the Asian population from 33,600 to 50,200;
the Black population increasing from 11,700 to 19,800;
a decline in the White and ‘other’ population from 139,000 to 132,000.
concentrations of different groups across the town, for example
Turkish people in Farley
high turnover of population with estimates that between 50% and 75%
of the population would not have lived in Luton or not have been born
at the time of the 2001 Census.
The key recommendations of the research are to:
o undertake periodic snapshots to understand and monitor demographic changes
over time
o use the evidence in the study to ensure that different ethnic groups are familiar
with the 2011 Census – its importance, the legal obligations, and the form
itself
o take a snapshot that is synchronised with the 2011 Census to provide evidence
to challenge the ONS in event that the Census has a low level of enumeration
and the resultant population figures are significantly lower than anticipated
o develop a single database of all residents (linked to LLPG) that contains key
demographic information and is at the hub of all Council systems
o link all administrative data with the LLPG with appropriate data management
arrangements to provide the basis for demographic intelligence and local level
population profiling
o work with NHS Luton to ensure continued access to key datasets ‘owned’ by
the NHS such as GP Registration Data
o link partnership data to the LLPG to provide high quality intelligence to
support demographic profiling, service planning and monitoring and reduce
reliance on external datasets
Acknowledgements
The authors are most grateful to Paul Barton and Eddie Holmes from the Council’s
Research and Intelligence Team, Caroline Thickens from NHS Luton and to all who
supplied administrative data without which this analysis would not be possible.
3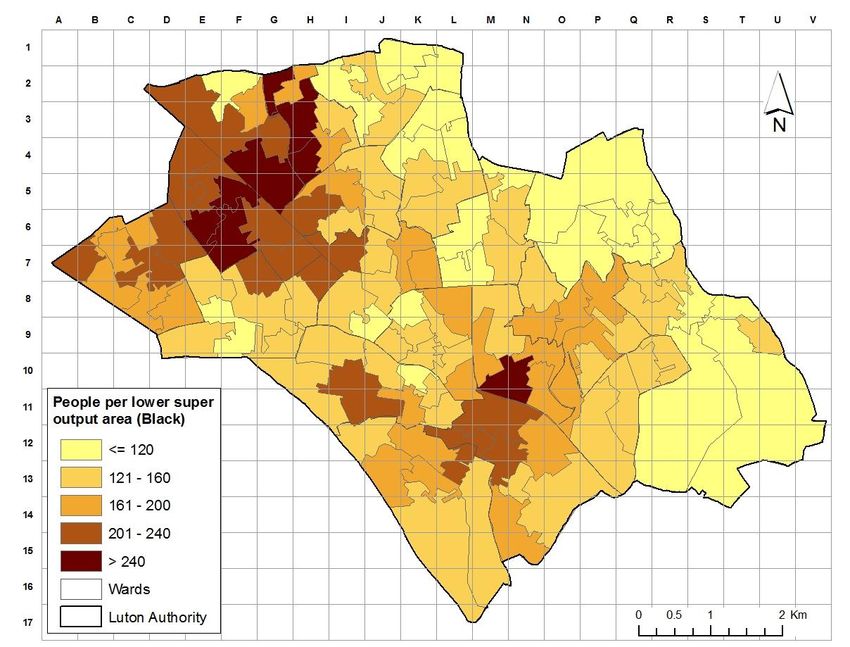
Luton population growth and change

Contents
   1.   Introduction
   2.   Data on migration
   3.   Counting Luton’s population using administrative data
   4.   Households by type, benefit and tenure status and occupancy
   5.   Ethnicity by broad groupings
   6.   Population by household and ethnic grouping
   7.   Income deprivation by ethnicity and age
   8.   Conclusions

Annex A: Analysis of administrative data using Polish surnames
Annex B: Map of households with 6 or more people
Annex C: Ward level tables by age and ethnicity

Dr Les Mayhew
Mayhew Harper Associates Ltd.
lesmayhew@googlemail.com
February 2011

                                                                      4
Luton population growth and change
The growth and changing complexion of Luton’s population
~ A structural analysis
1. Introduction
In recent years, Luton has experienced significant in-migration from EU and non-EU
countries and from West Africa, as well as major growth in the number of people
from Pakistan, Bangladesh and India. This has changed the demographic composition
of the town with a resultant impact on the delivery of public services and levels of
engagement with different communities.
A number of key demographic data sources such as the 2001 Census are now
outdated. Population data on ethnicity is now largely invalidated by subsequent
inflows and the underlying demographic composition of the town has undergone a
radical shift, as the population has grown.
Previously Luton had a traditional demographic profile with a dominantly white
population complemented by two or three large ethnic groups (Pakistani, Afro-
Caribbean) and a larger number of relatively small groups.
This has now changed with the addition of new communities from eastern and
southern Europe and also people from various African countries. When added to the
more established populations, this reinforces the perception that Luton is now
becoming more diverse both culturally and ethnically.
Luton Council’s Research & Intelligence Team is investigating this aspect of Luton’s
population and commissioned Mayhew Harper Associates to examine the current
position in more detail by quantifying as far as possible the major ethnic groups and
analysing them demographically.
This is an important undertaking. The Council is committed to ensuring that its
service delivery meets the needs of its community and is also aware that it does not
necessarily fully understand the needs of its new communities. Some of these new
communities comprise young adults and do not necessarily engage with public sector
bodies.
Without a full understanding of the demographics of the new communities the
Council cannot be certain that its attempts to engage with these communities will be
effective. It is of further significance since Luton experienced one of the lowest
response rates to the 2001 Census of all local authorities. With the next Census due in
March 2011, the Council is committed to working with ONS to try and increase the
response rate.
Luton Council recognises that its systems for monitoring demographic changes
arising from international migration are limited and is therefore looking for ways of
improving this capability within existing resources. The aims of this study include the
following: they are to:
o identify and quantify the demographic profiles of these communities
5Luton population growth and change
o understand the drivers of migration and how they will change the Luton
population in the future
o make recommendations on how the Council can implement a proactive
approach to monitoring and assessing the Luton population on an ongoing
basis.
The Mayhew Harper approach differs from similar studies in that it is based entirely
on administrative data rather than official sources. The argument for this radically
new approach is that, as official sources essentially derive from the 2001 Census, they
no longer reflect accurately the current position. Although there is a new Census in
March 2011, the results will not be available for some time and there are concerns that
because of the ethnic complexion of Luton’s population response rates will be low, in
doing so jeopardising accuracy.
Our approach uses various sources of administrative data including the GP register,
annual school pupil census, electoral roll, and official data on births and deaths and
other sources including tax and benefit records. It combines these data with the Local
Land and Property Gazetteer (LLPG) to derive a demographic profile of households
in Luton, by cross referencing the data according to a set of rules to produce what is
termed a ‘confirmed minimum’ population.
On this basis, it finds that Luton has 202,748 residents living in around 77,000
households as of the 31st March 2010. Our population figure compares with the
ONS’s latest estimate of 194,400, which is 8,348 lower than ours. Our figure is higher
by around 18,000 on the population at the last Census in 2001, which in turn was
about a 12,000 increase on 1991.
Other published data show that births are consistently higher than deaths in Luton
adding weight to the evidence that Luton is continuing to grow through natural
increase as well as by migration over the long term. This growth is in turn putting
pressure on housing and other services; for example we find that average household
size is particularly high among the Asian community in which there are also
significant problems of income deprivation.
Of the total confirmed population, we found that as many as 73% may not have been
living in Luton at the time of the last Census, although this is an upper estimate.
During this time, we find that Asian and Black groups now make up a much larger
percentage of the population than they did in 2001.
Other groups originating from Europe are harder to identify and may not be as great
as was thought based on the evidence of administrative sources such as new National
Insurance (NI) registrations. For example, we could only partly corroborate high
figures quoted for the Polish community that are evident from this and other related
sources (this is discussed further and at Annex A).
It must be noted that NI registration does not necessarily mean that the individuals are
actually working (or living) in a given authority area. For example Luton Airport is a
major point of entry into the UK and may simply act as a staging post for some.
6Luton population growth and change
However, it is also possible that many migrants stay for short periods only and do not
necessarily appear on any administrative data bases such as the GP register or
Electoral Roll, which are used in this study, especially if they do not bother to
register. This argument applies particularly to some European migrants. Hence, these
populations are more difficult to verify with exactitude.
The report is divided into sections as follows:
o Section 2 briefly reviews administrative data on international migration and
concludes that such data are unable to shed much light on the changes
occurring
o Section 3 describes the methodology and results for counting the population of
Luton and compares it with ONS population estimates
o Section 4 considers household types by ethnicity, tenure and occupancy
o Section 5 breaks down the population by ethnicity and analyses different
groupings insofar as the data allow
o Section 6 considers household structures by ethnicity and occupancy and finds
significant differences in household size and type
o Section 7 considers income deprivation in different communities and age
groups and finds wide variations in deprivation by age and ethnicity
o Section 8 concludes and makes some further recommendations
2. Data on migration
Often the starting point for analyses of changing demography is levels of international
migration, especially if it is perceived that this is the primary reason for population
change. There are two main sources of information on migration at local authority
level: one based on the International Passenger Survey (IPS), and the other on
administrative sources.
2.1 The International Passenger Survey (IPS)
The International Passenger Survey (IPS) is a survey of a random sample of over
250,000 passengers entering and leaving the UK by air, sea or the Channel Tunnel.
The interviewer asks for a passenger’s country of residence (for overseas residents) or
country of visit (for UK residents), and the reason for their visit. It collects
information on intended destinations or areas of departure to and from the UK.
For Luton, the IPS suggests that there have been net inflows averaging 3,000 from
2004 onwards. Prior to 2004 net inflows were more modest (see Table 1). However,
IPS figures may be criticised on several grounds. We have concerns, for example, that
7Luton population growth and change
they are based on a small sample of people that state Luton as their destination (who
might later move to somewhere else in the UK) or point of departure. This means that
IPS data on the origins and destinations of migrants is likely to be spuriously accurate.
year In Out Net
2001-2 2136 1513 623
2002-3 1995 1169 826
2003-4 2169 1572 597
2004-5 3132 756 2376
2005-6 3268 1386 1882
2006-7 4853 1186 3667
2007-8 4972 1266 3706
2008-9 5140 1870 3270
total 27665 10718 16947
Table 1: Inflows and outflow to and from Luton based on the International Passenger
Survey
2.2 Administrative sources
There is currently no fully functional administrative source set up expressly for the
purpose of international migration measurement. As a result, what administrative
sources collect and who they cover may not match the definitions needed for and used
in the ONS mid-year population statistics, for example.
Typically administrative sources will include some visitors and short term migrants
who stay for less than twelve months as well as those who move for more than 12
months (long-term migrants). The ONS has usefully described the strengths and
weakness of the various different administrative sources available1.
There are three main sources at a local authority level that have been used to inform
estimates of international immigration at this level. These are (a) the Worker
Registration Scheme (WRS), (b) National Insurance Number (NINo) allocations, and
(c) the Patient Register Data System (PRDS), recording new registrations with
General Practitioners (GPs). Two of these, NINos and the PRDS, are covered in more
depth below2.
1
http://www.lga.gov.uk/lga/aio/1098388
2
The Luton Research and Intelligence team has already produced a thorough examination of these
sources in a report entitled: ‘Statistical Issues Relating to the ONS Population Estimates of Luton’,
which may be found at
http://www.luton.gov.uk/media%20library/pdf/chief%20executives/communications/ons/populationstat
isticsreportfinal.pdf
8Luton population growth and change
NINo data
Each source has its strengths and weaknesses. If we take the example of NI
registrations to illustrate the issues involved, the population coverage includes
o All non-UK born nationals aged 16 or over working, planning to work or
claiming benefits legally in the UK
o All registrations are included, regardless of how long individuals intend to stay
However, it excludes:
o Dependants of NINo applicants, unless they work or claim benefits
o Individuals from overseas not working, planning to work, or claiming benefits
– for example, this will include many students
o Those with an existing national insurance number, for example returning UK
nationals
o Migrants who are not of working age if they are not claiming benefits.
By excluding key groups and not counting returners, NINo data can only ever provide
a partial account of migration activity, but picture it creates may also be misleading.
With these caveats in mind, Figure 1 shows new NINo registrants for Luton by
selected countries of origin from 2002, during which time there were over 34k new
registrants. Table 2 shows the underlying data. The data shows that Polish registrants
have been a particularly active group alongside various Asian groups; however, if the
new registrants make only short stays their numerical impact on Luton’s population
will be smaller than those that make Luton their long term home.
9Luton population growth and change
3000
Poland
Pakistan
2500
number of new registrations
India
Bangladesh
2000 Africa
other
1500
1000
500
0
2002 2003 2004 2005 2006 2007 2008 2009 2010
(1st qtr)
year
Figure 1: National Insurance registrations by country of origin in Luton from 2002 to
first quarter of 2010
Country of total 2002 to
origin 1st qtr 2010
Poland 11570
Pakistan 4370
India 3270
Bangladesh 1970
Africa 2550
Other 10820
Total 34550
Table 2: NINo data underlying the chart in Figure 1
GP registration data
GP registration data has the advantage of covering all age groups as long as they are
registered with a GP, which in practice is almost the whole population. It covers all
people requiring access to NHS services through a GP, regardless of age or reason for
visit. So, for example, many children and students will be covered. In addition,
individuals staying in the UK for longer than 3 months can register with a GP, so it
includes people that intend to stay for longer periods and possibly make Luton their
home.
GP registration data gives the date at which a person registers with their current GP.
Normally first registration takes place at birth but a person may decide to change GP
on change of address or for other reasons (e.g. if a practice closes). Registrant activity
10Luton population growth and change
therefore reflects a composite of new births, movements within an area as people
switch GPs, or new arrivals into the area including people from overseas.
Normally one would wish to base registrant analysis on data from at least two
snapshots in time in order to analyse both leavers and joiners by practice geographical
neighbourhood; however, important insights are possible though an examination of
registrant activity at a single snapshot in time, the hypotheses being that high
registrant activity by ethnic group is likely to be correlated with population influxes.
In section 5 we analyse registrant activity and compare our findings with population
breakdowns by ethnic group.
3. Counting Luton’s population using administrative data
In order to understand the relative significance of different communities within Luton,
we need to be able to count them as well as measure their shifts through time. In this
section, we describe how we use administrative data sources to count the population
of Luton. The techniques used are collectively known as ‘neighbourhood knowledge
management’ or nkm and involve data matching techniques, in which administrative
data sources are linked to the Local Land and Property Gazetteer (LLPG). The
resultant geo-referenced data are checked and cleaned to eliminate duplicates and
many other tests are applied to ensure results are robust. The population figure
obtained from this process is called the ‘confirmed minimum’ population which
means that it conforms to the nkm counting rules.
In our approach we adopt several tests before a person is deemed to be confirmed:
o a person is ‘confirmed’ if they are on the GP register3 and on another database
o if they are on the GP register, but not on any other database, they should be
related to someone else at that address by name e.g. a young child
o if they are not on more than one database the person should be the latest
person at that address according to the GP register
o a person may also be included if an address would otherwise be vacant; this is
ascertained after checking for people on other datasets with that address and
removing any records with the same names/dates of birth so as to avoid the
possibility of double counting
o all persons included in the database should have a UPRN and therefore an
address
3
Everyone living in the UK has a right to register with a GP. This right is based on residency and not
nationality or payment of taxes. However, patients must only be registered with one practice at any one
time and generally need to reside in the UK for more than 3 months. If a person moves away and
changes GP the new practice contacts the previous GP for their medical records to be forwarded. Since
well over 95% of the population is typically registered with a GP this is the most reliable source of
information about people living in an area.
11Luton population growth and change
The word ‘minimum’ is used to signify that there will be people living in Luton that
do not appear on any datasets and people that do not have valid or therefore linkable
addresses. These could include short term economic migrants who work or just visit
for short periods only. Anecdotally these are likely to come from countries in Europe,
especially eastern Europe but also southern Europe and Turkey.
The main finding is that Luton had a confirmed minimum population of 202,748
persons as of the 31st March 2010 living in over 77,500 households. This figure is in
accordance with the nkm methodology which only includes people that have an
address, are confirmed on more than one database, are the latest person at an address,
or are related to someone at that address or can be allocated to an address if the
address would otherwise be unoccupied.
Table 3 provides a breakdown of the population into standard 5-year age groups. In
the nkm methodology there are some gaps where age is unrecorded in the
administrative data and these appear in the table as ‘age n/a’; of which there are 9,109
in our count. In the second column, we include an adjusted version in which the age
unknowns are distributed pro-rata across the age groups4. Figure 2 shows these data in
the form of a population pyramid and shows strong distributional similarities in age
structure between nkm and ONS figures.
age unadjusted nkm ONS
groups nkm adjusted MYE
0 3695 3695 3,500
1-4 14404 14404 12,900
5-9 14448 14448 12,700
10-14 13428 13428 11,900
15-19 13057 13107 13,100
20-24 13898 18101 17,500
25-29 15343 17510 17,200
30-34 14403 14403 13,600
35-39 13648 13648 13,300
40-44 13714 14164 14,100
45-49 12929 12929 12,400
50-54 10891 10891 10,700
55-59 8933 9128 9,100
60-64 8236 8894 8,800
65-69 6531 6728 6,700
70-74 6150 6325 6,300
75-79 4685 4936 4,900
80-84 2997 3351 3,300
85-89 1620 1830 1,800
90+ 629 829 800
age n/a 9109 - -
Total 202748 202748 194600
Table 3: Comparison of the population of Luton by age based on nkm (basic), and
nkm (adjusted), and the ONS 2009 mid-year estimates.
4
Prorating is based on differences with the ONS age distribution. As is seen young adults aged
between 20 and 34 tend to be smaller in size than those in the same ONS age bands. Note that the ONS
figures themselves are estimates.
12Luton population growth and change
90+
85-89
80-84 ONS MYE
75-79 nkm adjusted
70-74
65-69
60-64
55-59
50-54
45-49
age
40-44
35-39
30-34
25-29
20-24
15-19
10-14
5-9
1-4
0
20,000 15,000 10,000 5,000 0 5,000 10,000 15,000 20,000
nkm population ONS MYE
Figure 2: Population pyramid based on information in Table 3 above showing the
number of people living in Luton by age (based on nkm adjusted column).
4. Households by type, benefit and tenure status and occupancy
Using the nkm population database each person is classified according to the
demographic characteristics of the households in which they live. There are 8
categories defined altogether. These are distilled from 81 different sub-types, the
definitions which are shown in Table 4 below. These categories are mutually
exclusive meaning that a household can only fall into one category at a time.
They range from single person dwellings (type G), family households with dependent
children (type A), single parent households (type B), cohabiting adult households with
no children (type F), and then older and three generational households (types C, D,
and E). There is also a small category (type H) called ‘other’ households that do not
fall into any of A to G.
In more detail, households with at least one adult aged 65 or over would be classified
as C, an older cohabiting household, if there was another adult at the address; or they
would be classified as D if that person lived alone. In some cases it would be
categorised as E, a three generational household, if there are young people at the
address aged 19 or under and also at least one adult aged 65+.
Type H households are a residual category for households that do not fit into another
group. They could comprise for example cases where there was an older person(s) 65
or over living with a young person(s) age 19 or under. It could also comprise
examples of households with teenagers who are also young parents.
13Luton population growth and change
category Description
A family households with dependent children
B single adult households with dependent children
C older cohabiting5 households
D older person living alone
E three generational households
F cohabiting adult households no children
G single adult households
H other households
Table 4: Household classification by type
Table 5 shows the household structure of Luton based on this classification scheme.
There are 77,477 identifiable households comprising 202,748 people of 2.62 per
household on average. The most numerous households are type A family households
with dependent children totalling nearly 19k; they have the second highest average
size at 4.63 members per household.
These are followed by type F households comprising cohabiting adults with no
children totalling 14k. Types B, C and G households are similar in number at around
20k of each and there are about 6.6k households with an older person living alone.
The most densely occupied households are type E, 3-generational households of
which there are about 1.7k cases. This is a relatively larger number than we tend to
find in other studies and is probably reflective of the ethnic composition of Luton.
Average household size in this category is 66.
The table also gives breakdowns by tenancy and benefits status. For example nearly
10k households are designated as social housing or 12.8% of the total. Of all
households about 25% receive means tested benefits; the households types with the
largest percentages receiving benefits are types B (single parent households), type D
older persons living alone, and type E 3-generational households. These types of
households therefore represent the most income deprived households in Luton.
no. %
no. of % households households
household persons/ households households social social
type frequency population household on benefits benefits housing housing
A 18921 87537 4.63 4365 23.1 2197 11.6
B 7545 21385 2.83 3112 41.2 1522 20.2
C 8500 19780 2.33 2063 24.3 785 9.2
D 6622 6622 1.00 2789 42.1 1585 23.9
E 1669 10011 6.00 711 42.6 164 9.8
F 14083 35830 2.54 2186 15.5 1252 8.9
G 19114 19114 1.00 4366 22.8 2339 12.2
H 1023 2469 2.41 326 31.9 107 10.5
total 77477 202748 2.62 19918 25.7 9951 12.8
Table 5: Breakdown of Luton population by household type, tenancy, benefit status
and average household size.
5
Cohabiting simply means two or more adults: it does not imply anything about the relationships or its
legal status
6
Similar but slightly more extreme figures were obtain for example in the London Borough of Tower
Hamlets
14Luton population growth and change
5. Ethnicity by broad groupings
Definitions of ethnicity are operationally difficult to apply and vary according data
source and purpose. Ethnic status is not the same as nationality or skin colour.
Available data tend to mix all three definitional concepts; in addition, it is extremely
unhelpful that the most comprehensive source of ethnicity data is based on the 2001
Census.
Although partial in their coverage and incomplete in the picture they generate,
administrative data point to different influxes of people of varying nationality and by
extension ethnic status. The aim is therefore to bring together the various sources of
information on ethnicity in to something more comprehensive, up to date and
therefore useful.
A methodology to quantify the ethnic composition of the local population is thus
essential for assessing recent migration and for identifying populations that are likely
to have special needs or requirements (e.g. in terms of employment, local health and
council services). In this section we describe such a methodology to identify and
quantify different ethnic groups in the current population.
There is no routine or complete record of a person’s ethnic origin on any
administrative dataset. One of the few consistent albeit partial sources of information
is the School Census (formerly know as PLASC), the register of pupils attending state
schools which contains both names and ethnicity. It identifies up to 100 different sub-
groups but many of these are small or non-existent in Luton.
It also identifies the first language of each pupil but we have not used these data
because language and ethnicity are not necessarily aligned. The basis for ethnicity
recording is self assessment and some groups overlap, so for example, a person of
African heritage may choose to identify themselves as ‘Other Black African’ or as
Nigerian.
In addition, the list of country codes for ethnicity is not exhaustive. For example,
there is a separate category for White Eastern European but not necessarily for
individual Eastern European countries. These classifications are nevertheless valuable
and can usually be mapped accurately onto broader classifications (e.g. as sometimes
used by the NHS), for example, White, Black, Asian, other and mixed.
Within the classification system used, some countries are easier to identify than
others; for example, it is possible to identify several culturally different Pakistani sub-
groups quite accurately. However, not every parent specifies the ethnicity of a child
and in a small number of cases some children are not assigned to any group e.g. where
a child’s parents have refused to provide information, so some uncertainties remain.
It is known that personal and family names are frequently associated with particular
ethnic groups but also that some are associated with more than one ethnic group.
There are also many surnames in the adult population, examples of which are not
represented in the school population (e.g. in households that do not have children or
are not attending a state school).
15Luton population growth and change
In our approach, we supplement reported ethnicities in the School Pupil Census with a
large database of unique surnames based on an accumulation of studies. Therefore
each person in the nkm database we can assign a probability of belonging to one of a
small core of high level ethnic groups and a specific selection of groups that are
relevant to Luton.
The justification is as follows. In a majority of cases only one ethnic group is
indicated by any given surname and so it is easy to assign to a group but in other cases
the same name appears in two or more ethnic groups. In these cases a probable ethnic
origin is assigned to the name, based on the frequency of occurrences of the name
within the data base. Extreme cases of representation across multiple ethnic groups
include names like Ahmed, Khan and Brown which appear in all of the basic ethnic
groups (including refused/unknown).
The range and diversity of surnames is very large and in most local authorities there
will be names that appear on local databases which have no comparator on the wider
database nor have any ethnicity assigned. In the methodology, it is thus necessary to
allocate these to a group which comprises mixed, other and not known.
Testing indicates that the method adopted using available data is able to assign an
ethnicity in between 80% to 90% of all cases with an accuracy of over 90%
depending on how many ethnic groups are defined at the outset. The method works
according to the following procedure:
1. Children on the Luton School Census are assigned to their stated ethnic group
based on their self reported classification
2. Adults living at the address of children on the School Census are assigned the
same ethnicity as the child
3. Adults at addresses with no children are assigned the most probable ethnic
group based on their surname using the wider database
For the higher level analysis reported in this section, we used three groupings that
made most sense for Luton: White and other, Black and Asian. The results are shown
in Table 6 in which it is seen that White and other account for 132,770 of the 202,748
previously reported as the confirmed minimum population of Luton (i.e. 65%). Of the
remainder Black people account for 10% of the population and Asian for 25%.
Our definition of Asian for these purposes is restricted to Pakistan, Bangladesh, India
and Sri Lanka and other ‘sub-continent’. Other groups from the Asian continent e.g.
from the Far East are relatively few in number and are included under ‘White and
other’.
The table breaks down the population by age groups and shows for example that
whereas the white population is relatively ‘old’, the Asian population is somewhat
younger, with 40% in the 0-19 age group as compared with 34% in the Black
population and 24% in the White and other population.
16Luton population growth and change
Our measure of income deprivation used in this report is whether a person lives in a
household receiving means tested benefits. This is a useful proxy for a range of
applications; it denotes for example to what extent a person is likely to use or access
other public services or benefits (e.g. such as free school meals, social care, advice
services).
The results show that around 36% of all those classified as Asian rely on benefits as
compared with 27% for the community as a whole. This is a clear sign of higher
levels of income deprivation in this particular community.
% living in
% of households
category 0-19 20-64 65+ age NA total total on benefits
White and other 32243 75208 18550 6769 132770 65 23.2
Black 6737 10394 1698 954 19783 10 27.2
Asian 20053 26393 2363 1386 50196 25 36.3
total 59032 111995 22612 9109 202748 100 27
Table 6: Population breakdown by age and broad ethnic grouping including
percentages living in households on means tested benefits.
In comparison with the 2001 Census, we estimate that the Asian population has grown
from 33.6k to 50.2k today, the Black population from 11.7k to 19.8k; meanwhile, the
White and other population has fallen from 139k to 132k.
However, we also find that within the White and other mix there is a larger European
component than previously seen, although it may not be as large as has been
suspected on the basis of Administrative sources such as NI registrations (see below).
Overall therefore, the data suggest that Luton’s population has grown from 184k in
2001 to 202k today or by around 10%.
5.1 Analysis by broad sub-group
(a) Asian
We broke down each of these high level groups into smaller, more meaningful groups
as allowed by the data. Tables 7 show our population breakdown for the Asian sub-
groups. In the Asian community Pakistanis are the largest group with nearly 25,000
members; this is followed closely by the Bangladeshi community with over 13,000
members. The Indian and rest of sub-continent categories are smallest among the
Asian groups, although still more sizeable than many other non-Asian groups.
Table 7 shows the far greater proportionate dependency on means tested benefits in
the Bangladeshi and Pakistani communities than in the other two Asian categories.
The higher proportion in the Bangladeshi group is substantiated for example by
evidence from another area which indicate strong cultural factors in terms of
marriage, child rearing and the fact that households tend to be larger and have more
young children (e.g. see later sections).
17Luton population growth and change
% living in
% of households
Asian 0-19 20-64 65+ age NA total total on benefits
Bangladeshi 5699 7080 648 317 13744 27.4 49.8
Indian 2308 5754 782 368 9212 18.4 18.0
Pakistan 10904 11904 779 592 24179 48.2 36.7
other Asian 1142 1655 155 109 3061 6.1 27.2
total 20053 26393 2363 1386 50196 100 36.3
Table 7: Population breakdown by age and sub-group in the Asian community,
including percentages living in households on means tested benefits. (Note to table:
other Asian = sub-continent)
Figure 3 is a map of the Asian population based on the number in each Super Output
Area (Lower level). Overlaid on the map is a 0.5 x 0.5 km grid for ease of reference
which works like a spreadsheet with letters in the columns and numbers in the rows.
The map shows an overwhelming concentration of Asian people in one part of the
town covered by rows 6 and 11 on the map and columns F and L.
Figure 3: Asian population density map of Luton based on Super Output Areas
(SOAs) (units: persons per SOA)
(b) Black
The corresponding table for Black sub-groups (Table 8) shows that a majority are
split between Black African and Black Caribbean groups with an estimated 47%
consisting of Black Caribbean. Care is needed with quantifying the Black Caribbean
category as many share surnames with White British groups and so the total may not
be as accurate as for other Black sub-groups. There is also a large but more difficult to
quantify group of mixed Black and White heritage which we have not counted
separately.
18Luton population growth and change
The population structure of the Black community tends to be intermediate between
the White and other communities and the Asian community in terms of age.
Unfortunately the Black African community, whilst easier to identify than people of
Caribbean origin, is not as specific as we would like it to be in terms of country of
origin, although Somalis are a relatively easily identifiable group with over 1,300
members followed by the Nigerian community.
It is noteworthy that the percentage of Black Africans that live in households on
benefits is relatively small compared with the Asian community and comparable with
the White and other group. An exception is the Somali group in which an estimated
42.6% live in households on means tested benefits.
% % living in
age of households
Black 0-19 20-64 65+ NA total total on benefits
Congolese 14 30 1 2 46 0.2 31.1
Ghanaian 143 272 24 26 464 2.3 20.1
Nigerian 322 538 41 54 955 4.8 17.4
Sierra Leone 21 41 6 4 73 0.4 22.8
Somali 579 691 48 42 1360 6.9 42.6
Black African (general) 2524 2750 174 255 5703 28.8 28.8
Black Caribbean 2484 4964 1203 459 9110 46.0 25.7
Any other Black 650 1109 202 112 2072 10.5 25.4
total 6737 10394 1698 954 19783 100 27.2
Table 8: Population breakdown by age and sub-group in the Black community,
including percentages living in households on means tested benefits.
Figure 4: Black population density map of Luton based on Super Output Areas
(SOAs) (units: persons per SOA)
19Luton population growth and change
Figure 4 is a population map of the Black community based on the number of Black
people living in each Super Output Area. The map shows concentrations of the Black
population in the northwest of the town in rows 2 to 8 and columns A to H and in
south central Luton e.g. see cells M and N 10 and cells below.
(c) Other European
Ignoring for these purposes those of White British origin, the hardest group to
breakdown into sub-groups by country of origin are those of European descent. Table
9 shows sub-groups in four categories; one of these, Eastern European, is not as
precise as we would have liked and some will have been included in the next category
which is designated ‘Other European’.
The numbers in the European category are much smaller than the previous Asian and
Black categories and probably reflect the fact that these groups are based on less
established or permanent influxes. The stock figures that they indicate are less than
the cumulative flows based on NI registration data which may indicate that people of
these backgrounds do not stay for as long in Luton.
However, another explanatory factor is that some registering for work may not go on
to register with a GP and so that the true population is potentially higher than
indicated; it is simply that they do not appear on any of the data sets available. It is
also seen that the percentage of the Eastern European population living in households
on means tested benefits is smallest among the three major groups, suggesting that a
majority are likely to be economic migrants. More refined methods including surveys
may be needed to split and quantify these sub-groups better than has been possible
here.
% living in
age % of households
European origin 0-19 20-64 65+ NA total total on benefits
Irish 601 1366 351 105 2422 39.4 24.8
Former Yugoslavia and Albania 69 110 4 4 187 3.0 40.8
Eastern European 346 840 42 124 1353 22.0 23.4
Other European (not specified) 601 1258 198 134 2191 35.6 24.7
total 1618 3575 595 367 6154 100.0 24.9
Table 9: Population breakdown by age and sub-group in the Other European
community, including percentages living in households on means tested benefits.
20Luton population growth and change
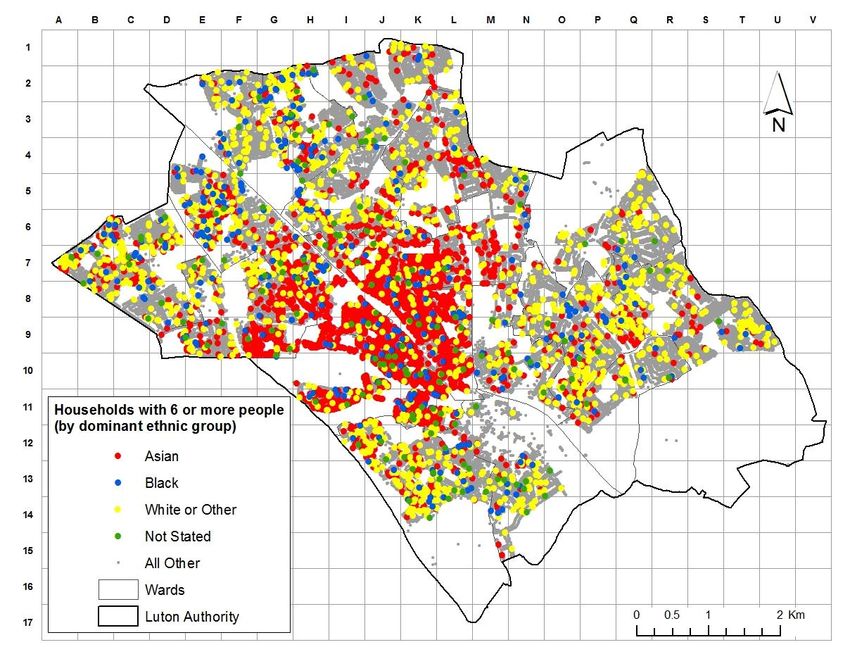
Figure 5: Map showing some common European nationalities by place of residence
Beyond the groupings analysed above, it is possible to break down some of the
figures into much smaller groups, usually by country of origin. We found that
individually they were very small in number and some in cases were it was necessary
to aggregate them into broader groups. Some of the small but significant sub-groups,
because of their distinctive cultures, included Irish travellers, Gypsy Roma, Greek and
Turkish communities7.
Figure 5 is a population dot map of selected European groups by country of origin and
household. The map clearly shows a large Turkish community in columns I to J and
rows 11 to 13. ‘Other’ East Europeans tend to be more concentrated in south central
Luton.
On the evidence of the new National Insurance registrations, a large number in the
Eastern European categories are from Poland; however, the ethnicity data base does
not distinguish Polish surnames as separate group. Using a different data set of over
20k common Polish surnames, we matched these against the names on the confirmed
minimum population data base. Our results are set out in detail in Annex A.
In undertaking this analysis, it is important to realise that Polish surnames have been a
feature of the UK for at least three generations and it is a matter of sorting the more
recent arrivals from those with established roots or who were born here. On this basis,
7
We estimated for example that there were around 220 Irish Travellers and 200 Gypsy Roma and 750
in the mainly Turkish and Greek communities.
21Luton population growth and change
we estimated around 2,700 likely recent arrivals, although this is clearly only an
estimate.
5.2 Population by ethnicity and date of registration with GP
Section 2 described some of the difficulties involved in estimating population influxes
into Luton. Yet the differences in ethnic structure and population size since 2001
identified in the previous section are indicative that significant changes are occurring,
especially in the Asian community but also among certain smaller groups.
Populations can only grow by people living longer, or by more being born, or through
net immigration into an area. One of the main issues is to try to unpick why the Asian
population has grown to its current size since 2001.
The GP register is still the best and most comprehensive source of information about
population movement, but ideally one would require two full snap shots to be able to
separate these three components of change8. The GP register is not designed to
measure immigration. For example, there will be a delay between arrival into an area
and the registration process.
However, it is possible to analyse general movement activity based on the date of
registration with a person’s current GP using just a single snapshot. It can be safely
assumed for example that a person registered at birth would be likely to have been
born in Luton; those registered at older ages could be the result of internal GP
switches, inward flows from outside Luton or flows into Luton from abroad.
Figure 6 shows the pattern based on registrants aged below 1in which we track five
groups from different countries or areas: Pakistan, Bangladesh, India, other Asian
sub-continent and Europe over a 15 year period. This shows significantly higher
levels of registration activity in the last four years with the most activity occurring in
the Pakistani, Bangladeshi and Indian groups, in that order.
It is noteworthy that the patterns peak and trough together perhaps suggesting a
common underlying factor or factors. These could include housing, the state of the
local labour market or other factors such as changes to primary care practices.
Figure 7 shows a similar pattern of registrants at birth for these groups over the same
period. It shows a steady increase in registrants of children still living in Luton in
2010 that were in their first year of life when registered. Analysis shows that the ratio
of these registrants in the selected ethnic groups to all registrants has remained steady
at about 40% regardless of year of registration.
8
Two snaps shots would allow one to add new arrivals and births, to subtract people who leave Luton
or die and in addition quantify the amount of movement within Luton itself.
22Luton population growth and change
5000
4500 pakistani
bangladeshi
4000 indian
other sub-continent
3500
number of registrants
all europe
3000
2500
2000
1500
1000
500
0Luton population growth and change
registered with their current GP after 2000; but among the Pakistani and Bangladeshi
communities this percentage rises to 85% and 83% respectively.
Figure 8 shows the ratio of registrants in the selected groups to the number of
registrants in the whole population aged greater than one at the time of registration.
This shows an approximate doubling in the proportion of registrants that are from the
selected ethnic groups over a 15 year period, thus indicating far greater churn
In conclusion, although it is impossible to be precise, the implication of GP
registration data is that as many as 73% of the current population were not living in
Luton at the time of the 2001 Census. Clearly, this is an upper bound because some
registrations will have been internal to Luton and thus were not first time registrants
in the area.
However, put a different way, of the 202,748 currently confirmed population, we
estimate that around 32,000 were not alive in 2001, 54,000 were registered with their
current GP, but that 116,000 were registered with their present GP after 2001.
Even if 50% of these were internal GP switchers that would still leave 58,000 arrivals
from outside Luton over the period (including both national and international
migrants) - although clearly this suggestion must necessarily be speculative.
To summarise, it is impossible to escape the conclusion that the population has
changed radically over the last 10 years in terms of people and ethnic mix. All of
these changes have contributed to the growth in population observed today.
40
Specified ethnic groups as percentage of all
35
30
25
registrants
20
15
10
5
0Luton population growth and change
6. Population by household and ethnic grouping
6.1 Household size by age and sex
In this section, we consider the level of occupation by UPRN9 and tenure based on the
confirmed minimum population as of March 31st 2010. We are interested in the
number and frequency of persons by household in each UPRN in different ethnic
groups and tenancy type. The resultant distributions offer an approach to quantifying
issues such as relative levels of overcrowding in different ethnic communities.
The differences in occupancy that arise could represent variations in family size and
formation between ethnic groups but also other factors. For example, the white
population tends to be older and it is well known that age and occupancy are strongly
linked. As populations age average household size tends to decline.
For Luton this effect is shown clearly in Figure 9 which is a population pyramid with
males on the left and females on the right and age on the vertical axis. Each bar is
scaled to the size of the population in each age group and then colour coded according
to size of household. As age increases, the number of households with two or more
people shrinks and far greater proportions tend to live alone or as couples.
This effect varies slightly between genders with more female single households at the
oldest ages. This is because females tend to be older than their male partners and have
longer life expectancy. Cohabitation is strongest at younger ages with family
formation and child rearing. Given that the Asian community tends to be younger we
would expect larger average household sizes in this age range.
living alone
90+ 2 person household
85-89 3 person household
80-84 4 person household
5 person household
75-79
6+ person household
70-74
65-69
60-64
55-59
50-54
age
45-49
40-44
35-39
30 - 34
25 - 29
20-24
15-19
10-14
5-9
1-4
Under 1
10,000 8,000 6,000 4,000 2,000 0 2,000 4,000 6,000 8,000 10,000
males population females
Figure 9: Population by household size, age and gender
9
In the Luton property gazetteer, each address is assigned a Unique Property Reference number of
UPRN which we use as our fundamental counting unit and definition of a ‘household’.
25Luton population growth and change
6.2 Occupancy by tenure and ethnicity
Figure 10 (a) to (c) is a frequency distribution of households based on the number of
people per UPRN by broad ethnic grouping. Figure 10 (a) shows clear differences
between the frequency distributions for Asian ethnicities compared to the Black and
White (and other) ethnicities shown in (b) and (c). Whereas 9.5% of Asians live in
social housing this figure rises to 13.6% in the Black population and 14.6% in the
White and other population.
In Asian households, most people live in households with between 3 to 5 people and
30% live in households with 6 or more people. This compares with only 11% in the
population as a whole living in households with 6 or more people. The Black
population is intermediate between the Asian population and the White and other
grouping.
10 (b) illustrates that the pattern of occupancy in the Black population differs
substantially from Asian occupancy with proportionally more people living in one
person households. Figure 10 (c) for the White and other group shows proportionately
fewer households with more than two people, establishing three distinctive patterns
among the three broad groupings.
As indications of potential overcrowding, we found around 500 UPRNs with more
than 10 people representing 0.6% of all UPRNs. Some of these will be registered
nursing or residential care homes, but others will be normal residential housing stock.
We found that 4.1% of the Asian population lived in households with 10 or more
people, 1.2% of the Black community and 0.3% of the White and other community.
However, these figures are likely to be an underestimate since it is likely that there
will be some people living in such addresses that are not registered with a GP and do
not appear on any of the other administrative data bases. These will arguably consist
of short stay workers (workers that have been here for less than 3- months) or visitors.
However, it has not been possible to analyse these.
2500
private tenure
social housing
2000
number of occupied UPRNs
1500
1000
500
0
1 2 3 4 5 6 7 8 9 10 11 12 >12
persons per UPRN
(a)
26Luton population growth and change
1600
social housing
1400
private tenure
1200
number of UPRNs
1000
800
600
400
200
0
1 2 3 4 5 6 7 8 9 10 11 12 >12
persons per UPRN
(b)
25000
social housing
private tenure
20000
number of UPRNs
15000
10000
5000
0
1 2 3 4 5 6 7 8 9 10 11 12 >12
number of persons per UPRN
(c)
Figure 10 (a)-(c): Frequency of UPRN by household size, tenancy and ethnicity:
Asian households; (b) Black households; (c) White and other households
7. Income deprivation by ethnicity and age
Income deprivation is an important indicator of dependency on, and use of a wide
range of council services, especially among young people (e.g. Childrens Centres,
schools, free school means, special educational needs, social services), and for the
population in general (housing, access to benefits, Council Tax, planning applications,
environmental services and so on).
In this section, we identify and profile the population that is at risk of income
deprivation based on whether they live in households receiving means tested benefits,
which is a common proxy for low income families. Figure 11 splits the population in
three broad ethnic groupings, Asian, Black and White and other. On the horizontal
axis is age and on the vertical axis the percentage of the population that is living in a
household on means tested benefits.
27Luton population growth and change
80
Other
70 Black
Asian
60
50
% of age group
40
30
20
10
0
0 10 20 30 40 50 60 70 80 90
age
Figure 11: The percentage of the population living in households on means tested
benefits by age and broad ethnic grouping
The chart shows clear patterns: in the White and Other and Black populations the
chances of living a household on benefits is around 30% at birth, gradually falling to a
low at around age 55 when it is between 17% and 20%. It then rises again in older
age to around 40% of all those living. The range of variation at older ages is greater as
there are fewer people in the oldest age groups but also incomes vary more.
In the Asian, population income deprivation is higher throughout the age range even
among older working ages when it might be expected to be lower. At birth it is around
30% but rises to 40% at the age of five and stays at that level until aged 20. After that
it falls back to 30% by around age 50, before rising again to 50% or more.
We conclude from the evidence that Asian households are therefore not only likely to
be newer to Luton, but also relatively income deprived and more likely to live in
overcrowded accommodation and private tenure. As indicated by the map in Figure 3
they are also highly geographically concentrated.
7.1 Deprivation Risk Ladders
In this sub-section, we analyse and segment income deprivation by broad age group.
The aim is to disaggregate income poverty by key risk factors to measure the depth
and range of income deprivation in different sub-groups. We concentrate on three age
groups: 0-19, 20-64, and 65+ and use risk factors that have been shown in over 20
studies10 to be highly significant predictors of income deprivation.
The methodology uses a technique called ‘risk ladders’ which have been developed to
identify and quantify particular groups and their associated levels of exposure to risk.
In this case the risk outcome is income deprivation. Since there are no data at a local
level on income by household we use take up of means tested benefits (Council Tax
benefit) as a proxy. Households are eligible for means tested benefits if they have an
10
See: http://www.nkm.org.uk/case_studies.html for examples of links to studies using risk ladders
28Luton population growth and change
income that would put them below the Government poverty line based on their
circumstances.
(i) Children 0-19
Table 10, an example of a risk ladder, covers the whole of the age group 0-19 years.
The risk factors used to estimate the risk of income deprivation are influenced by
what we have found to be the case elsewhere, namely housing tenure (whether private
or social housing), whether the child lives in a single adult household (i.e. there is
only one adult aged 20 or over at an address), and if there are 3 or more children
living at the address.
Each row shows the numbers of children and young people in each of 8 mutually
exclusive categories ranked from most to least income deprived. The totals at the foot
of the columns show the number of people to whom a particular risk factor applies.
For example 28,082 out of 59,032 children and young people children live in social
housing (see foot of col. 5).
The table shows 23.5% of children and young people in this age group live at
addresses receiving means tested benefits. The categories least at risk of income
deprivation are located in row 8 of the table, to whom none of the risk factors apply.
There are 20,283 children and young people based on these criteria of which only
17.1% live at addresses that receive benefits as compared with 80.0% in the highest
risk group (row 1).
(a) 0-19
3+
single children % in
social adult at households lower upper
category frequency housing household address on benefits CI% CI%
1 1567 Y Y Y 80.0 78.0 82.0
2 1628 Y Y 70.7 68.4 72.9
3 3426 Y Y 68.3 66.7 69.9
4 2240 Y 56.3 54.2 58.4
5 3948 Y Y 47.0 45.4 48.6
6 6799 Y 31.3 30.2 32.4
7 19141 Y 30.0 29.4 30.7
8 20283 17.1 16.5 17.6
total 59032 8861 13942 28082 32.5 32.1 32.9
Table 10: Risk ladder showing the number and percentage of children and young
people living in households receiving means tested benefits by risk group (CI = 95%
confidence interval)
The risk factors can be translated into odds of an event happening. In this case, in
Luton, a child or young person aged 0-19 is:
o 5.3 times more likely to be on benefits if living in social housing
o 2.1 times more likely if it is a single adult household
o 2.0 times more likely if there are 3+ children at the same address
29You can also read