Thunder Bay District Northern Projections Human Capital Series - northernpolicy.ca - North Superior Workforce Planning Board
←
→
Page content transcription
If your browser does not render page correctly, please read the page content below
Northern Projections

Thunder Bay District
Human Capital Series

Dr. Bahktiar Moazzami   northernpolicy.ca
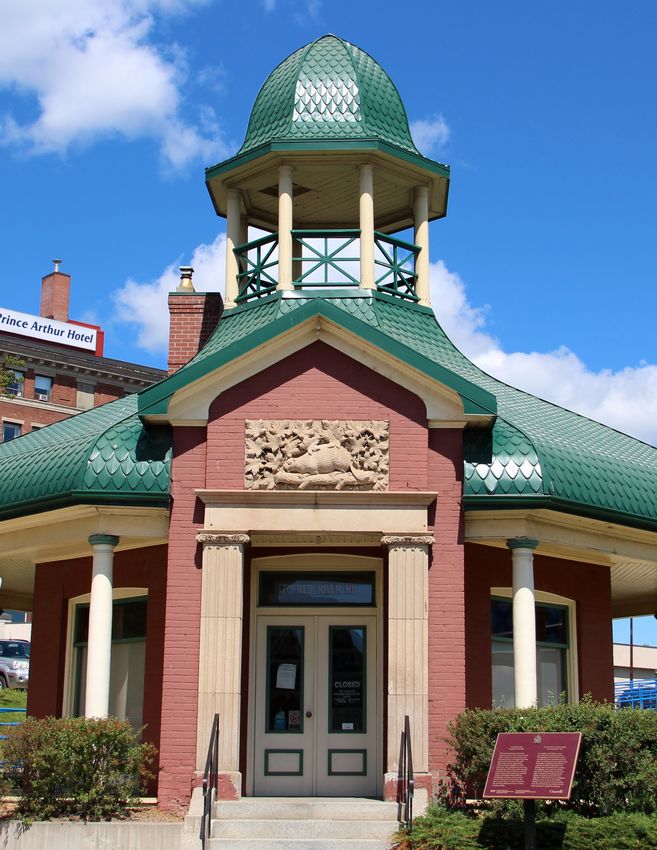
Tourist Pagoda, Thunder Bay
Northern Policy Institute / Institut des politiques de Nord
                                                                                            Thunder Bay District | January 2019        3

Who We Are
Northern Policy Institute
Northern Policy Institute is Northern Ontario’s independent think tank. We perform research, collect
and disseminate evidence, and identify policy opportunities to support the growth of sustainable
Northern Communities. Our operations are located in Thunder Bay and Sudbury. We seek to
enhance Northern Ontario’s capacity to take the lead position on socio-economic policy that
impacts Northern Ontario, Ontario, and Canada as a whole.

Local Employment Planning Council
The Local Employment Planning Council (LEPC) is one of the eight pilot project sites funded in part
by the Government of Canada and the Government of Ontario.
The LEPC will be working with 35 local communities to develop labour market information that is
relevant to Northern stakeholders such as businesses, employers, employees and employment and
training service providers.
We will be working to develop and strengthen partnerships, foster integrated planning and
coordinate services.

Madge Richardson -Executive Director
www.nswpb.ca
Thunder Bay District

About the Series
This Human Capital Series is an update of an earlier series published in partnership with
Northern Ontario Workforce Planning.
Workforce Planning Ontario is a network of 26 Workforce Planning Boards covering four regions
across the province. Workforce Planning Boards gather intelligence on local labour market supply
and demand, and work in partnership with employers, employment services, educators, researchers,
economic development, government and other stakeholders to identify, understand and address
labour market issues. This includes supporting and coordinating local responses to meet current and
emerging workforce needs.
Given the unique geography and labour market issues that impact Northern Ontario, all 6 planning
boards in the north have collaborated to form Northern Ontario Workforce Planning. They include:
Algoma Workforce Investment Corporation (AWIC); Far Northeast Training Board (FNETB); The Labour
Market Group (LMG); Northwest Training and Adjustment Board (NTAB); North Superior Workforce
Planning Board (NSWPB); and Workforce Planning for Sudbury & Manitoulin (WPSM). FNETB and
NSWPB are currently pilot sites for Local Employment Planning Councils (LEPC).
The objective of this series is to examine past and present trends in each Northern Ontario Census
District and to forecast future challenges and opportunities. The author examines demographic
trends as well as the labour market, including human capital composition, employment trends, the
future occupational demand of the employed workforce, trends in industrial workforce composition
of goods-producing and services-producing sectors, as well as labour income trends and gross
domestic product (GDP).
4 Northern Policy Institute / Institut des politiques de Nord
Thunder Bay District | January 2019
Who We Are
Board: The Board of Directors sets strategic direction President & CEO
for Northern Policy Institute. Directors serve on committees Charles Cirtwill
dealing with finance, fundraising and governance, and
collectively the Board holds the CEO accountable for Board of Directors
achieving our Strategic Plan goals. The Board’s principal Pierre Bélanger (Chair) Emilio Rigato
responsibility is to protect and promote the interests,
Suzanne Bélanger-Fontaine Alan Spacek
reputation, and stature of Northern Policy Institute.
Dave Canfield Dr. Brian Tucker (Secretary)
President & CEO: Recommends strategic direction,
Dr. Harley d’Entremont Asima Vezina
develops plans and processes, and secures and allocates
resources to achieve it. Florence MacLean Charles Cirtwill
Dwayne Nashkawa (President & CEO)
Advisory Council: A group of committed individuals
interested in supporting, but not directing, the work of Advisory Council
Northern Policy Institute. Leaders in their fields, they provide
Michael Atkins Peter Goring
advice on potential researchers or points of contact in the
wider community. Kim Jo Bliss Dr. George C. Macey
Jean-Pierre Chabot Allyson Pele
Research Advisory Board: A group of academic
researchers who provide guidance and input on potential Dr. Michael DeGagné Ogimaa Duke Peltier
research directions, potential authors, and draft studies and Don Drummond Tina Sartoretto
commentaries. They are Northern Policy Institute’s formal Ronald Garbutt Bill Spinney
link to the academic community. Jean Paul Gladu David Thompson
Peer Reviewers: Ensure specific papers are factual, relevant Audrey Gilbeau
and publishable.
Authors and Research Fellows: Provide independent
Research Advisory Board
expertise on specific policy areas as and when needed. Dr. Randy Battochio J.D. Snyder
(Chair) Dr. Lindsay Tedds
Standing engagement tools (general public, government
Dr. John Allison
stakeholders, community stakeholders): Ensure Northern
Policy Institute remains responsive to the community and Dr. Hugo Asselin
reflects THEIR priorities and concerns in project selection. Dr. Gayle Broad
George Burton
Dr. Robert Campbell
Dr. Iain Davidson-Hunt
Dr. Livio Di Matteo
Dr. Morley Gunderson
Leata Ann Rigg
S. Brenda Small
This report was made possible through the support of our partner, Northern Ontario © 2019 Northern Policy Institute Published by
Heritage Fund Corporation. Northern Policy Institute expresses great appreciation for their Northern Policy Institute
generous support but emphasizes the following: The views expressed in this commentary
874 Tungsten St.
are those of the author and do not necessarily reflect the opinions of the Institute, its
Thunder Bay, Ontario P7B 6T6
Board of Directors or its supporters. Quotation with appropriate credit is permissible.
ISBN: 978-1-989343-37-1
Author’s calculations are based on data available at the time of publication and are
therefore subject to change.Northern Policy Institute / Institut des politiques de Nord
Thunder Bay District | January 2019 5
Contents
Partners ........................................................................................................................................................................................................................................................................ 3
Who We Are ............................................................................................................................................................................................................................................................. 4
About the Authors ................................................................................................................................................................................................................................................ 5
Executive Summary.............................................................................................................................................................................................................................................. 5
Key Findings .............................................................................................................................................................................................................................................................. 6
Introduction .............................................................................................................................................................................................................................................................. 7
Demographic Change in Northwestern Ontario: The Past Three Decades .................................................................................................................... 8
Demographic Change in Thunder Bay: The Next Three Decades .....................................................................................................................................16
Indigenous Population Projection ............................................................................................................................................................................................................18
Thunder Bay District’s Labour Force: Past, Present, and Future Trends ..............................................................................................................................20
Productivity and Human Capital Composition of the Workforce in Thunder Bay District and Northwestern Ontario .......................23
The Consequences of Shifting the Composition of the Employed Labour Force .....................................................................................................28
Looking Ahead .....................................................................................................................................................................................................................................................30
References ..............................................................................................................................................................................................................................................................37
Glossary Terms........................................................................................................................................................................................................................................................38
About the Author
Dr. Bahktiar Moazzami
Dr. Moazzami has taught Economics and Econometrics at Lakehead University since 1988.
He is well known for his research activities particularly related to Northern Ontario.
He has written many reports on Northern Ontario’s economic development challenges
and opportunities. He was commissioned by the Ministry of Northern Development and
Mines to undertake a comprehensive study of Northern Ontario’s economy as a part of the
research conducted for the Growth Plan for Northern Ontario. Included in the study were the
identification of growing, declining and emerging industrial clusters in the region.
Professor Moazzami has also written extensively on Northern Ontario’s Indigenous people
and Northern Indigenous economy. Dr. Moazzami’s expertise and influence reaches beyond
Lakehead University and Northern Ontario. He has been a regular guest speaker at the
University of Waterloo’s Economic Development Program.
Executive Summary
Northwestern Ontario covers approximately 526,478 square The purpose of this report is to analyze demographic and
kilometers and recorded a population of 231,691 in 2016. labour market trends in Northwestern Ontario and Thunder
Increasing levels of out-migration of working-age labor Bay District. Both past and current trends are examined,
force, declining fertility rates, and lower levels of immigration as well as future projections. This report is an update to
have resulted in an age distribution of the population in a previous report published in 2017 but with updated
Northwestern Ontario that is different from that of Ontario. information using 2016 census data, as well as additional
These demographic changes have a significant impact sections including sector-specific projections for future
on social and economic conditions in the region. The labour market demand.
population will continue to age in the foreseeable future,
with implications for healthcare costs, supply of labour,
production capacity, and the ability of the Northwestern
Districts to remain economically viable.6 Northern Policy Institute / Institut des politiques de Nord
Thunder Bay District | January 2019
Key Findings
Thunder Bay District has experienced a consecutive Recommendations:
decrease in population over six census periods, from
158,810 in 1991 to 146,048 in 2016. This decline is attributed
to several factors, including a decreasing fertility rate, Reverse the trends
significant interprovincial and intraprovincial out- Thunder Bay’s population and labour force are shrinking
migration due to the collapse of the forestry and related and aging. The district has seen many people move
manufacturing industries, low immigration, and an aging away, and relatively few move in. As a result, Thunder Bay
population. should focus on newcomer attraction in order to restore
sustainable ratios of workers to dependents. In addition, the
The population is estimated to continue to decline from district should develop youth retention strategies that will
148,100 in 2017 to 144,444 in 2041, an approximate 2.5 stem the tide of youth outmigration.
per cent drop. The problem of an aging population is
forecasted to become more severe, with the share of
seniors (65 years old and over) growing from 19.8 per Continue to foster female participation
cent in 2017 to 30.4 per cent in 2041. On the contrary, the in the labour force
indigenous population is projected to increase by about It is evident that men have higher participation and
21.5 per cent. employment rates compared to women in different target
groups (total population, Francophones, immigrants,
This demographic change in population has resulted in
and indigenous population) from 2011 to 2016. As such,
changes to the supply side of the labour market. The labour
encouraging more females to join the labour market will
force in Thunder Bay District has been declining since
be key to increasing the labour market size and variety
2001. The size of the labour force decreased from 76,485
in Thunder Bay District. Fortunately, participation and
to 69,935. The labour force participation rate declined
employment rates of women has increased from 2001 to
among men but rose slightly among women over the
2016.
same period. Focusing on the Francophone population,
both men and women have declined participation and
employment rates, like Indigenous men and women. Make indigenous education the number one
However, the Indigenous labour force is expected to have priority in the region
a 13.7 per cent increase in 2030, while the total labour force Indigenous people in Thunder Bay District have lower
is expected to drop 11.1 per cent. educational levels when comparing to the average
Despite of the change in the size of the labour force, for indigenous people in Ontario. 47.1 per cent of
the percentage of the working-age labour force with indigenous peoples in Thunder Bay District aged 25 to
postsecondary credentials is higher in Thunder Bay District 64 have postsecondary credentials, which is around 15
than in Northwestern and Northeastern Ontario as a whole. percentage points lower than the total population, and
The study also found that the reliance on goods-producing 5.7 per cent lower than the indigenous population in
sectors in Thunder Bay District has decreased significantly Ontario. Additionally, the indigenous share of the labour
between 1986 to 2016, while reliance on service producing force is forecasted to increase from 12.23 per cent in 2019
sectors has slightly increased. Furthermore, the number of to 15.18 per cent in 2030. The projections indicate a need
people employed in natural and applied science, health to promote and improve education among indigenous
and social science, education, and public administration peoples, which will also benefit the local labour market and
has increased since 2001. economy.Northern Policy Institute / Institut des politiques de Nord
Thunder Bay District | January 2019 7
Introduction
The objective of this report is to examine past and present The study concludes by looking ahead and examining
trends and characteristics in the economy of Thunder Bay the future demand for healthcare and education service
District (hereafter also referred to as Thunder Bay and not to providers, and for trades’ workers.
be confused with the City of Thunder Bay) and to forecast
its future challenges and opportunities. We first examine Data Sources:
population trends in Thunder Bay and Northwestern Ontario. The data used in this report is based on detailed information
Then, we study the district’s labour market. This includes regarding individual census subdivisions (CSDs) in Thunder
its human capital composition; employment trends; Bay District and Northwestern Ontario obtained through
the shifting occupational composition of the employed special tabulations from Statistics Canada. We have also
workforce; the shifting of the district’s industrial composition used population forecasts based on data made available
from goods-producing to services-producing sectors; the by the Ontario Ministry of Finance. Some of the data
declining share of the private sector; the district’s rising displayed below may differ slightly from census population
dependency on the public sector; and declining labour data, in instances where a custom tabulation was used
income and gross domestic product (GDP). The aging to demonstrate unique characteristics of the target
population and its impact on future demand for healthcare geography. In these instances, the discrepancies are due
and education service providers are also examined. Finally, to the custom tables being based on 25% sample data, as
the report estimates the impact of an aging population on oppose to 100% population data.
demand for workers in trade occupations in the district.
The report begins by examining demographic change in Population Groups Studied
Thunder Bay over the past three decades. We find that the The report provides information on the following four
district’s population declined by approximately eight per population groups:
cent between 1991 and 2016. We focus on three segments
of the regional population, namely Indigenous peoples, • The total population;
Francophones, and Immigrants. The study then looks • The Francophone population, defined as individuals who
ahead and provides projections for total and Indigenous report their mother tongue to be French;
populations of Thunder Bay District from 2015 to 2030. We
find that the Indigenous population is the only growing • The Indigenous population, defined by Statistics Canada
segment of the regional population. From these population as persons who reported identifying with at least one
projections, the study estimates past, present, and future Indigenous group – that is, North American Indian, Métis,
trends in the size and composition of the regional labour or Inuit – and/or those who reported being a Treaty Indian
force. The impact of migration flows on the regional or a registered Indian, as defined by the Indian Act, and/
population is also discussed. or those who reported they were members of an Indian
band or First Nation;
The report also examines population trends in urban and
rural areas. We find that approximately 83.1 per cent of • The immigrant population, defined as persons who are, or
Thunder Bay’s population live in urban areas and 16.9 per have ever been, landed immigrants in Canada.
cent live in rural areas. The majority (69.3 per cent) of the
Indigenous population live in urban areas. These are mostly The Geographical Specification
the off-reserve population in the district. Approximately 30.7 of Northern Ontario
per cent of the Indigenous population live in rural areas. Northern Ontario is subdivided into the Northwest and
The next part of the study examines labour market trends Northeast Economic Regions. The three most western census
including participation, employment, and unemployment divisions, commonly known as districts – namely Rainy
rates among various population groups between 2001 and River, Kenora, and Thunder Bay – constitute Northwestern
2016. Using demographic changes as well as labour market Ontario, which is also referred to as the Northwest Economic
indicators, the study forecasts the size and composition of Region. The region that lies north and east of lakes Superior
the future labour force in the Thunder Bay district. and Huron constitutes Northeastern Ontario, which is also
referred to as the Northeast Economic Region. It includes
In the section that follows, the study defines and the following census divisions: Cochrane, Timiskaming,
quantitatively measures the human capital composition of Algoma, Sudbury, Nipissing, Manitoulin, Parry Sound, and
Thunder Bay’s workforce in the coming years. This section Greater Sudbury. The federal government and FedNor also
also discusses the implications of the growing application of include Muskoka District in their definition of Northeastern
technology in the production process and, accordingly, the Ontario. However, the provincial government removed the
future skill requirements of the workforce. District of Muskoka from the jurisdictional area of the Ministry
The report subsequently looks at the consequences of of Northern Development and Mines and the Northern
shifting the composition of the employed labour force in Ontario Heritage Fund Corporation in 2004. It has continued
the district from goods-producing, which is dominated to include Parry Sound as a Northern Ontario division.
by private businesses, to services-producing, which is
predominantly financed by the public sector. The study
also examines the shifting occupational composition of the
employed workforce and the implication thereof for total
regional income and GDP in Thunder Bay District.8 Northern Policy Institute / Institut des politiques de Nord
Thunder Bay District | January 2019
Demographic Change in Northwestern Ontario:
The Past Three Decades
Demographic Trends
in Northwestern Ontario
Northwestern Ontario covers more than 526,478 square is the only other municipality in the entire region with a
kilometres, almost 57.9 per cent of the province’s total area, population greater than 10,000 people.
while accounting for only 1.72 per cent of Ontario’s total According to Statistics Canada’s census of population,
population. With a population density of 0.4 persons per Northwestern Ontario’s population grew from 231,378 in
square kilometre, Northwestern Ontario is the province’s 1986 to 244,117 in 1996, but it declined to 234,771 in 2001
most sparsely populated region.1 and 231,691 in 2016 (Figure 1). There appears to have been
Northwestern Ontario consists of the districts of Thunder Bay, some population growth between 2011 and 2016, though
Kenora, and Rainy River. Major communities in the region incomplete data means the trend is difficult to gauge with
include Thunder Bay, Kenora, Dryden, Fort Frances, Sioux precision.2 The major population change has been related
Lookout, Greenstone, Red Lake, Marathon, and Atikokan, to the size of the Indigenous population, which increased
as well as several dozen that are First Nations, Métis, and from 38,225 in 2001 to 41,600 in 2011, and to 58,950 in 2016.
Inuit. Approximately 52.3 per cent of the region’s entire The rise in the Indigenous population relates to a higher
population live in the Thunder Bay Census Metropolitan fertility rate as well as increased participation in the census.
Area (CMA). Aside from the city of Thunder Bay, Kenora
1
On average, the population density equals 3.7 persons per square kilometre
in Canada. It equals 47.6 persons per square kilometre in Thunder Bay CMA,
compared to 249.58 persons per square kilometre in all CMAs in Canada.
2
In 2011, a series of wild fires prevented 13 First Nations in Kenora CD from
being enumerated at census time. A special collection later that year found
there were 8,520 people in these communities, though these totals are not
included in the census figures for 2011. Pikangikum, one of the largest First
Nations in the region, was not enumerated in 2016 due to ‘other’ reasons. Their
2011 population count was 2,280. If they experienced the same growth rate
from 2011 to 2016 as 2006 to 2011, their population would be closer to 2,500.
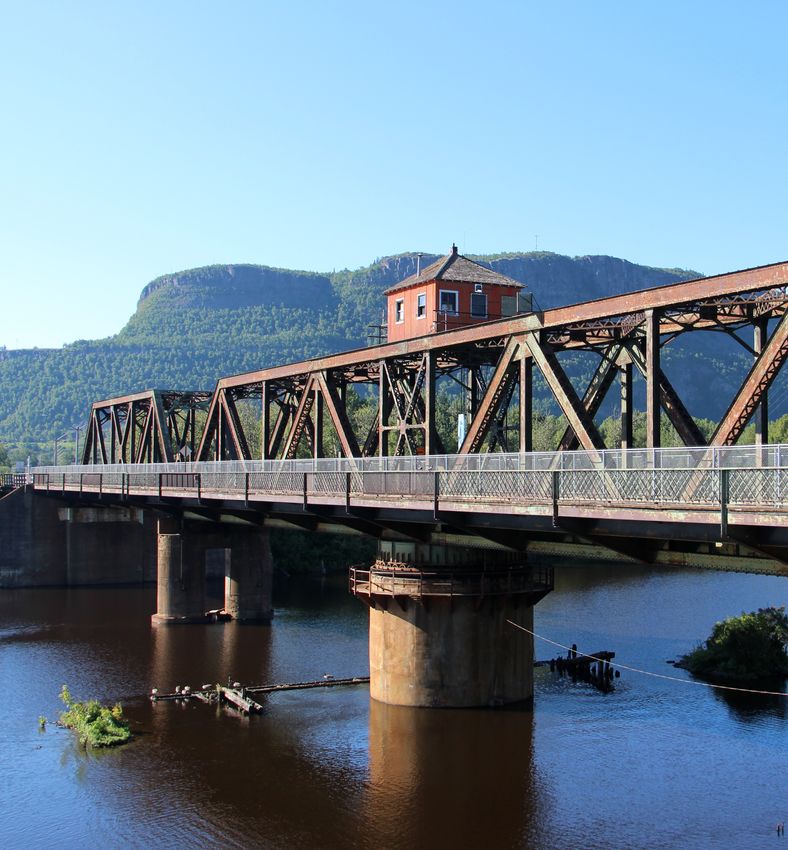
Kaministiquia River Swing Bridge, Fort William First NationNorthern Policy Institute / Institut des politiques de Nord
Thunder Bay District | January 2019 9
Figure 1: Population Trends in Northwestern Ontario
Northwestern Ontario
250,000
244,117
245,000
240,555
240,000
234,771 235,046
235,000 231,691
231,378
230,000
224,034
225,000
220,000
215,000
210,000
1986 1991 1996 2001 2006 2011 2016
Source: Statistics Canada, Census of Population, various issues
Northwestern Ontario’s share of the provincial population Canadian rates. The total fertility rate is defined as the
declined from 2.54 per cent in 1986 to 2.39 per cent in 1991, average number of children that a woman will have over
2.06 per cent in 2001, 1.74 per cent in 2011, and 1.72 per the course of her life. In Canada, the total fertility rate
cent in 2016. The declining population share has happened equaled 1.61 in 2011 compared to 1.55 in Ontario and 1.77
even though the total fertility rate in Northwestern Ontario in Northwestern Ontario (Figure 2).
has been significantly greater than the provincial and
Figure 2: Fertility Rate by Age in Northwestern Ontario, Ontario and Canada in 2011
Number of Children per Woman by Age
0.14
0.12
0.1
0.08
0.06
0.04
0.02
0
< 20 20 21 22 23 24 25 26 27 28 29 30 31 32 33 34 35 36 37 38 39 40 41 42 43
N.W.O. Ontario Canada
Statistics Canada, 2011 National Household Survey, special tabulation
The higher fertility rate in Northwestern Ontario compared is due to a gradual increase in the number of deaths
to that of Ontario suggests that the declining size and share compared to births, which is the result of three factors. First
of the region’s population are not due to natural population is the aging population, which results in a greater share of
change. In fact, the data suggest that the number of births population in higher age categories and fewer women
exceeded the number of deaths in Northwestern Ontario in childbearing age categories. The second factor is the
between 1987 and 2007. However, the level of natural continuation of the low fertility rates, which are significantly
increase has been declining in Northwestern Ontario. In below the generational replacement rate of 2.1. The third
fact, Thunder Bay District experienced more deaths than factor is the outmigration of women in the childbearing age
births after 2005, further adding to the population decline demographics from Northwestern Ontario.
in that region. The declining natural population increase10 Northern Policy Institute / Institut des politiques de Nord
Thunder Bay District | January 2019
Population Trends in Thunder Bay District & Northwestern Ontario
Covering 103,720 square kilometres, Thunder Bay District Statistics Canada’s census of population, Thunder Bay’s
recorded a population of 146,048 in the 2016 census. It has population declined from 158,810 in 1991 to 146,048 in 2016
a population density of 1.4 persons per square kilometre, – an eight per cent decline (Figure 3).
which is well below that of Ontario (14.8). According to
Figure 3: Population Trends in Thunder Bay District
Thunder Bay District
160,000 158,810
157,615
155,000
150,860
150,000 149,063
146,055 146,048
145,000
140,000
135,000
1991 1996 2001 2006 2011 2016
Source: Statistics Canada, various censuses, custom tabulation
Declining population trends can also be observed in almost (Table 1). As we will see later in this report, the declining
major townships, towns, and cities in Northwestern Ontario population closely mirrors employment changes in the region.Northern Policy Institute / Institut des politiques de Nord
Thunder Bay District | January 2019 11
Table 1: Population Trends in Major Northwestern Ontario Regions
Region 1996 2001 2006 2011 2016
Thunder Bay City 113,662 109,016 109,140 108,359 107,909
Kenora City 10,063 15,838 15,177 15,348 15,096
Fort Frances Town 8,790 8,315 8,103 7,952 7,739
Dryden City 6,711 8,198 8,195 7,617 7,749
Sioux Lookout Town 5,165 5,336 5,183 5,038 5,272
Greenstone MU 6,530 5,662 4,906 4,725 4,636
Red Lake Town 4,778 4,233 4,526 4,670 4,107
Marathon Town 4,791 4,416 3,863 3,350 3,273
Atikokan Town 4,043 3,632 3,230 2,787 2,753
Manitouwadge TP 3,395 2,949 2,300 2,105 1,937
Nipigon TP 2,210 1,964 1,752 1,630 1,642
Terrace Bay TP 2,324 1,950 1,625 1,470 1,611
Schreiber TP 1,788 1,448 901 1,125 1,059
Red Rock TP 1,258 1,233 1,063 940 895
Dorion TP 472 442 379 340 316
Source: Statistics Canada, various censuses, custom tabulation
Various factors explain declining regional population. migration to Ontario is modestly negative.3 Intraprovincial
First, Northwestern Ontario and Thunder Bay have migration refers to the movement of population from one
disproportionately low rates of immigration. Net immigration is census division to another within the province.
defined as the number of Immigrants to a region minus those Figure 4 shows that the majority of those who choose
who left. The region experienced negative net immigration to move appear to move out of the province. Most of
between 2001 and 2016. This is one of the important factors the individuals who out-migrate to other provinces are
influencing the population decline. The second and perhaps between the ages of 20 and 34. On the other hand, the
more important factor relates to out-migration. Thunder Bay District experienced an in-migration from other
Figure 4 shows that Northwestern Ontario and Thunder census divisions within Ontario, more than likely those in
Bay District have experienced significant interprovincial as Northwestern Ontario, between 2006 and 2014. Examination
well as intraprovincial out-migration, especially during the of the data reveals that the intraprovincial in-migrants to
mid-2000s, due to the collapse of the forestry industry and Thunder Bay District are 35 years of age and older and that
related manufacturing industries. Interprovincial migration they are bringing their children with them. Overall, net out-
refers to the movement of population from one province to migration has decreased over time. What are the reasons
another. Over the past 30 years, net interprovincial migration for the declining out-migration from Northwestern Ontario?
into Ontario averaged 2,700 per year. However, this average Can it be related to the age profile of the movers? Can it be
includes the abnormally large inflows from Quebec recorded related to the aging population, resulting in a smaller share of
in the years following the 1980 referendum. When those the population in the prime moving demographic? Figure 5
inflows are excluded, the long-term net interprovincial shows the age distribution of these migrants.
3
Ontario Ministry of Finance, Ontario Population Projections Update based on the
2011 census 2017-2041 Ontario and Its 49 census divisions.12 Northern Policy Institute / Institut des politiques de Nord
Thunder Bay District | January 2019
Figure 4: Net Migration Flows
Northwest Ontario
500
150
0
2
3
4
5
7
8
9
0
1
2
3
4
5
7
6
6
00
00
00
00
00
00
00
00
01
01
01
01
01
01
01
01
/2
/2
/2
/2
/2
/2
/2
/2
/2
/2
/2
/2
/2
/2
/2
/2
01
02
03
04
05
06
07
08
09
10
11
12
13
14
15
16
-500
20
20
20
20
20
20
20
20
20
20
20
20
20
20
20
20
-347
-1000
-1500
-2000
-2500
Immigration Net Interprovincial Migration Net Intraprovi ncial Migration
Thunder Bay District
101
400
2 00
0 -49
2
3
4
5
6
7
8
9
0
1
2
3
4
5
6
7
-200
00
00
00
00
00
00
00
00
01
01
01
01
01
01
01
01
/2
/2
/2
/2
/2
/2
/2
/2
/2
/2
/2
/2
/2
/2
/2
/2
01
02
03
04
05
06
07
08
09
10
11
12
13
14
15
16
20
20
20
20
20
20
20
20
20
20
20
20
20
20
20
20
-400 -147
-600
-800
-1000
-12 00
-1400
Immigration Net Interprovincial Migration Net Intraprovi ncial Migration
Source: Author’s calculations based on Statistics Canada, CANSIM database, tables 051-0063
Figure 5 reveals that most movers are between the ages of of youth ages 19 and under. There has always been some
20 and 34, followed by those between the ages of 35 and out-migration of seniors, but the level and trend has been
64. Figure 5 also shows that adults moving to other regions quite stable.
take their children with them, resulting in net out-migration
Figure 5: Net Migration by Age Group
Thunder Bay District 45
100
0
2
3
4
5
6
7
8
9
0
1
2
3
4
5
6
7
00
00
00
00
00
00
00
00
01
01
01
01
01
01
01
01
-100
/2
/2
/2
/2
/2
/2
/2
/2
/2
/2
/2
/2
/2
/2
/2
/2
01
02
03
04
05
06
07
08
09
10
11
12
13
14
15
16
-49
20
20
20
20
20
20
20
20
20
20
20
20
20
20
20
20
-200
-300
-400 -261
-500
-600 -619
-700
0--19 20--34 35--64 65+
Source: Author’s calculations based on Statistics Canada, CANSIM database, tables 051-0063Northern Policy Institute / Institut des politiques de Nord
Thunder Bay District | January 2019 13
Aging of the Population in Thunder Bay District
In addition to out-migration of youth and low levels of cent in 2016 (Figure 6). During the same period, the share of
immigration in the district, rising life expectancy has resulted individuals between the ages of 20 and 44 declined from
in the aging of Thunder Bay’s population. At the same time, 40.9 per cent to 29.5 per cent, and the share of individuals
the large baby-boom generation, born in the two decades ages 45 to 64 increased from 18.9 per cent to 30.6 per cent.
following the Second World War, is now beginning to retire. These demographic changes have had a significant
The generations that followed were much smaller, primarily impact on social and economic conditions in the district.
due to a declining fertility rate. As a result, the share of The population will continue to age in the foreseeable
individuals in the district below the age of 20 declined future, with implications for healthcare costs, supply of
from 28.3 per cent in 1991 to 20.5 per cent in 2016, and the labour, production capacity, and the ability of Thunder Bay
share of seniors rose from 11.9 per cent in 1991 to 19.4 per to stay economically viable.
Figure 6: Aging of Thunder Bay District’s Population
Thunder Bay District
45.0%
40.9%
40.0%
35.0%
29.5% 30.6%
30.0% 28.3%
25.0%
20.5% 19.4%
18.9%
20.0%
15.0% 11.9%
10.0%
5.0%
0.0%
0--19 20--44 45--64 65+
1991 1996 2001 2011 2016
Source: Author’s calculation based on Statistics Canada, Census of Population, various issues
Linguistic and Cultural Diversity of the
Population in Thunder Bay District & Northwestern Ontario
Another aspect of demographic change in Northwestern from 8,330 in 2001 to 6,750 in 2011 but rose marginally to
Ontario and Thunder Bay District relates to the cultural and 6,975 in 2016. The Francophone population in Northwestern
linguistic diversity of the population (Figure 7). The total Ontario is concentrated in Atikokan, Greenstone, Ignace,
Francophone population in Northwestern Ontario declined Manitouwadge, Marathon, and Thunder Bay.
Figure 7: Linguistic & Cultural Diversity in Northwestern Ontario & Thunder Bay District in 2016
2016 Census
35,000
30,540
30,000 28,410
25,000
20,000 17,860
15,285
15,000 11,710
10,000 6,975
5,335
3,895
5,000
-
Francophone Immigrants On-Reserve Indigenous Off-Reserve Indigenous
N.W.O. Thunder Bay District
Source: Author’s calculations based on Statistics Canada, CANSIM database, tables 051-006314 Northern Policy Institute / Institut des politiques de Nord
Thunder Bay District | January 2019
The total Indigenous population in Northwestern Ontario among Indigenous women has been significantly higher
increased from 38,225 in 2001 to 41,600 in 2011 and to 58,950 than the regional average. A report by the Ontario Ministry
in 2016. Indigenous peoples represent approximately 14.9 of Health and Long-Term Care states that: “Fertility is almost
per cent of the total population in Thunder Bay District. exclusively the source of population growth for Aboriginal
According to Statistics Canada, the traditional demographic peoples in Ontario. Provincially, some in-migration of
components of growth (fertility, mortality, and migration) are Aboriginal people takes place from other provinces
not the only factors that have affected the growth of the but does not substantially impact population dynamics
Indigenous population in Canada. Another phenomenon among Ontario’s Aboriginal peoples although the impact
that has affected the size, growth, and composition of the may be greater in some urban areas. Although minimum
Indigenous population in recent years is referred to as a information is directly available on Aboriginal fertility in
“change in reporting” or “ethnic mobility.” Ethnic mobility Canada, INAC (Indian and Northern Affairs Canada) has
refers to people changing the reporting of their Indigenous reported a total fertility rate (TFR), which is the number of
affiliations from a non-Indigenous identity to an Indigenous children a woman would have under current prevailing
identity from one census to the next.4 The passage of Bill C31 fertility rates, of 2.9 children in 2000 for Registered Indian
in 1986 has been a factor in this ethnic mobility. women. In the same year, the TFR for Canadian women
was approximately half that rate at 1.5 children.”6
Additionally, there has been a higher participation in the
census in recent years. Statistics Canada reports that some In general, the Indigenous population is much younger
Indigenous reserves and settlements did not participate in than the non-Indigenous population. Therefore, Indigenous
the census because enumeration was not permitted, or it peoples will be entering the labour market in large numbers
was interrupted before completion. In 2006, there were 22 as the non-Indigenous population is retiring. They will
incompletely enumerated reserves, down from 30 in 2001 represent a significant share of the region’s workforce in the
and 77 in 1996.5 Other factors explaining higher Indigenous coming years.
population growth include better and more accessible The Immigrant population in Northwestern Ontario declined
health care leading to a lower mortality rate and a decline from 19,870 in 2001 to 15,285 in 2016. The majority (76.6 per
in infant mortality. cent) of this population live in Thunder Bay District.
Finally, one of the main factors explaining the rising share of
the Indigenous population relates to fertility rate. The rate
Population Trends in Urban & Rural
Northwestern Ontario & Thunder Bay District
There are many ways to define rural and urban areas. types of zones based on the degree of influence that
The term rural is intuitively understood as an area with large urban centres have on them. This is measured by the
low population concentration dispersed at a low density. percentage of people who commute to work into an urban
On the other hand, the term urban is often understood centre.
as a place with high population concentration at a high Using the above definition, Figure 8 shows the distribution
density. This intuitive understanding is the basis for Statistics of Thunder Bay District’s population among rural and
Canada’s approach to defining an urban area as having urban areas. Approximately 83.1 per cent of Thunder Bay’s
a population of at least 1,000 and a density of 400 or more population live in urban areas. The rest (16.9 per cent) live
people per square kilometre. An alternative and perhaps in rural areas. The majority (69.3 per cent) of the Indigenous
a more appropriate definition of rural area proposed by population live in urban areas. This is most of the off-reserve
Statistics Canada is “rural and small towns” as opposed population in the district. Approximately 30.7 per cent
to “large urban centres”. This definition is based on the of the Indigenous population live in rural areas. Among
commuting flows between different areas. It defines these rural residents, 78.9 per cent live in relatively remote
urban regions as including all census metropolitan areas areas with a weak or no link to urban centres. These are
(CMAs) and census agglomerations (CAs). Both CMAs and mostly on-reserve Indigenous peoples living in remote
CAs include the total population of neighbouring census Northwestern Ontario regions. Approximately 56.5 per cent
subdivisions (CSDs). Based on the above definition of an of the Francophone and 89.6 per cent of the Immigrant
urban region, rural and small town (RST) areas are defined population live in urban centres.
as non-CMA/CA areas. RSTs are further divided into four
4
A. Signer and Rosalinda Costa, “Aboriginal Conditions in Census Metropolitan Areas, 1981-2001,” Statistics Canada, 2005.
5
Ibid
6
Ontario Ministry of Health and Long-Term Care, Health Analytic Branch, “First Nations Peoples in Ontario: A Demographic Portrait,” January 2009, 15.
7
One problem with this definition is that it can lead to misleading identification of rural and urban areas. Based on this definition, Attawapiskat Indian Reserve in James
Bay area is classified as an urban area.
8
For a definition of various zones see Roland Beshiri and Jiaosheng He, Rural and Small Town Canada Analysis Bulletin 8, No. 2 (June 2009): Catalogue No. 21-006-X.Northern Policy Institute / Institut des politiques de Nord
Thunder Bay District | January 2019 15
Figure 8: Population in Urban and Rural Areas in Thunder Bay District
Thunder Bay District
118,880
140,000
120,272
120,000
100,000
80,000
60,000 24,205
40,000 11,250
26,885 1,800
6,095 4,055
16,130
20,000
6,175 3,815 765
-
Urban Rural Stong MIZ Moderate MIZ Weak MIZ No MIZ
2001 2016
Thunder Bay District in 2016
16,000 15,075
14,000 3,015
12,000
10490
10,000
8,000 6,685
6,000 1,890
2,320 25
4,000 155 2720
1,220 250 2,555
2,000 655 755
455 225 530
10
-
Urban Rural Stong MIZ Moderate MIZ Weak MIZ No MIZ
Indigenous Francophone Immigrants
Source: Author’s calculation based on Statistics Canada, 2001 and 2016 Censuses, special tabulation
We note that Statistics Canada classifies various census have on them. The degree of influence is measured by
subdivisions (CSDs) within provinces that are outside the percentage of a CSD’s employed labour force who
CMAs and CAs into one of four metropolitan influenced commute to work in any CMA or CA (e.g., 30 per cent
zones (MIZ) according to the degree of influence (strong, for strong MIZ; between 5 per cent and 30 per cent for
moderate, weak, or no influence) that the CMAs or CAs moderate MIZ; between 0 and 5 per cent for weak MIZ).16 Northern Policy Institute / Institut des politiques de Nord
Thunder Bay District | January 2019
Demographic Change in Thunder Bay District:
The Next Three Decades
This part of the study provides population projections for compared these estimates to the actual annual number
Thunder Bay District, both for the total and Indigenous of deaths in each census division over this period to create
population. Estimates for the former are based on ratios of actual-to-expected numbers of deaths. These
projections by the Ontario Ministry of Finance and estimates ratios were then multiplied by provincial age-specific death
for the latter are based on Northern Ontario’s Demographic rates to create death rates for each census division. These
Model, developed by the author. The model is based on were then applied to the corresponding census division
the Cohort Component method. The base year data for population to derive the number of deaths for each
the projection are from Statistics Canada’s 2016 census. division.
A few words regarding the Ministry of Finance projections Third, the Ministry uses population estimates based on the
are in order. First, the Ministry’s estimated parameters 2016 census adjusted for net undercoverage. Specifically,
for fertility at the census division level were modelled to the projections use Statistics Canada’s preliminary July 1,
maintain regional differences. The census division-to- 2017 postcensal population estimates as a base.
province ratio for mean age at fertility in the most recent Based on the Ministry’s projections, Thunder Bay District’s
period was assumed to remain constant. population is expected to decline from 148,100 in 2017 to
Second, the Ministry’s mortality estimates at the census 144,444 in 2041 (Table 2). The continuing aging of Thunder
division level were developed using a ratio methodology. Bay’s population is also evident (Figure 9), with the share of
The government applied the Ontario-level mortality individuals ages 20 to 64 expected to decline from 60.4 per
structure to each census division’s age structure over cent in 2017 to 51.2 per cent in 2041. Similarly, the share of
the most recent three years of comparable data and individuals ages 65 and older is expected to rise from 19.8
calculated the expected number of deaths. It then per cent in 2017 to 30.4 per cent in 2041.
9
For a complete discussion of this model, see B. Moazzami “It’s
What You Know (and Where You Can Go): Human Capital
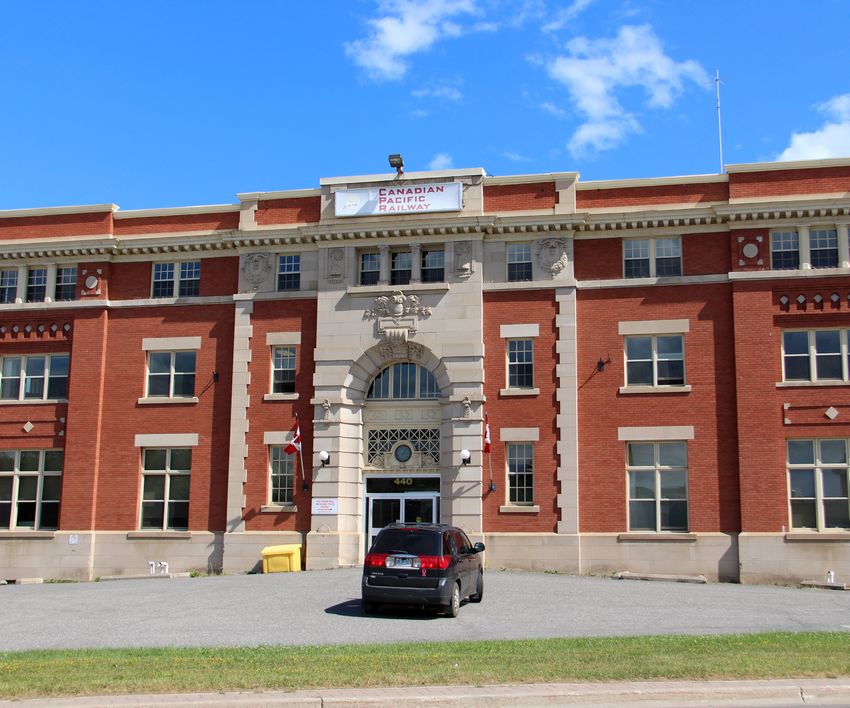
and Agglomeration Effects on Demographic Trends in Northern Canadian Pacific Railway, Thunder Bay, ON
Ontario,” (Thunder Bay: Northern Policy Institute, 2015).Northern Policy Institute / Institut des politiques de Nord
Thunder Bay District | January 2019 17
Table 2: Population Projections by Age Group, Thunder Bay District, 2017-2030
Year 0--19 20--44 45--64 65+ Total
2017 29,281 45,270 44,227 29,322 148,100
2018 29,202 45,184 43,473 30,357 148,216
2019 29,000 45,224 42,656 31,394 148,274
2020 28,899 45,081 41,887 32,442 148,309
2021 28,841 44,892 41,190 33,362 148,285
2022 28,781 44,769 40,192 34,459 148,201
2023 28,767 44,587 39,195 35,566 148,115
2024 28,718 44,408 38,242 36,656 148,024
2025 28,687 44,064 37,422 37,753 147,926
2026 28,616 43,841 36,549 38,811 147,817
2027 28,548 43,611 35,827 39,710 147,696
2028 28,493 43,390 35,042 40,635 147,560
2029 28,361 43,169 34,488 41,390 147,408
2030 28,189 42,922 34,079 42,051 147,241
2031 28,045 42,665 33,784 42,562 147,056
2032 27,919 42,342 33,653 42,941 146,855
2033 27,791 42,045 33,650 43,152 146,638
2034 27,655 41,626 33,739 43,385 146,405
2035 27,489 41,179 33,857 43,631 146,156
2036 27,298 40,835 33,804 43,958 145,895
2037 27,081 40,472 33,999 44,069 145,621
2038 26,941 40,119 34,210 44,068 145,338
2039 26,800 39,801 34,445 44,000 145,046
2040 26,664 39,489 34,622 43,972 144,747
2041 26,535 39,247 34,774 43,888 144,444
Source: Author’s calculations based on the Ministry of Finance population projections18 Northern Policy Institute / Institut des politiques de Nord
Thunder Bay District | January 2019
Figure 9: Population Projections by Age Group, Thunder Bay District, 2017-2041
Population Projections by Age Group,
Thunder Bay District, 2017-2041
100,000 89,497
80,000 74,021
60,000
43,888
40,000 29,281 29,322
26,535
2 0,000
0
0--19 2 0--64 65+
2 017 2 02 5 2 030 2 041
Source: Author’s calculations based on the Ministry of Finance population projections.
Indigenous Population Projection
In making projections for the Indigenous population in rate of approximately 21.5 per cent. The number of
Thunder Bay District to 2030, we assume zero net migration individuals under the age of 20 is expected to increase
of Indigenous peoples over the forecast period, since the slightly during this period, while working-age Indigenous
existing evidence suggests there is relatively low mobility peoples are expected to rise from 12,370 in 2015 to 14,201
among the Indigenous population in the district. The fertility in 2030 – an increase of approximately 14.8 per cent. The
rate for the Indigenous population is assumed to equal number of individuals ages 65 and older is expected to rise
that in rural Northwestern Ontario, and the mortality rate from 1,370 in 2015 to 3,198 in 2030.
is assumed to equal the rate for the general population of The Indigenous population’s share of the total district’s
Canada based on the 2011 census. population is expected to increase from 15.2 per cent in
Based on these assumptions, Table 3 and Figure 10 show 2015 to 18.0 per cent in 2030. The share of working-age
that the Indigenous population in Thunder Bay is expected Indigenous peoples (those ages 20 to 64) is expected to
to increase from 21,785 in 2015 to 26,462 in 2030, a growth increase from 14.2 per cent in 2015 to 18.5 per cent in 2030.
10
According to the 2016 census, Aboriginal Population Profile, interprovincial
migration among the Indigenous population during a one-year period (2015 to
2016) was only 1.1 per cent. Also, intraprovincial migration during the same one-
year period was 5 per cent. When they moved, they mostly moved within their
census division.Northern Policy Institute / Institut des politiques de Nord
Thunder Bay District | January 2019 19
Table 3: Projected Indigenous Population, Thunder Bay District, 2015-2030
Age Group 2015 2020 2025 2030
0 - 4 years 1,965 2,183 2,360 2,508
5 - 9 years 2,115 2,053 2,171 2,348
10 - 14 years 2,055 2,147 2,049 2,167
15 - 19 years 1,910 1,993 2,138 2,040
20 - 24 years 2,010 1,895 1,974 2,119
25 - 29 years 1,610 1,934 1,874 1,952
30 - 34 years 1,370 1,499 1,916 1,856
35 - 39 years 1,300 1,354 1,483 1,896
40 - 44 years 1,255 1,288 1,339 1,467
45 - 49 years 1,295 1,251 1,266 1,315
50 - 54 years 1,290 1,290 1,220 1,235
55 - 59 years 1,255 1,244 1,247 1,180
60 - 64 years 985 1,147 1,178 1,181
65 - 69 years 595 829 1,059 1,089
70 - 74 years 380 501 734 936
75 - 79 years 210 294 419 615
80 + years 185 268 390 558
Total 21,785 23,167 24,819 26,462
Source: Author’s calculation based on Northern Ontario’s population projection model developed by the author.
Figure 10: Percentage Share of the Indigenous Population by Age Group
60.00 56.78
53.66
50.00
40.00 36.93
34.25
30.00
20.00
12.08
10.00 6.29
-
0--19 20-64 65+
2015 2020 2025 2030
Source: Author’s calculation based on Northern Ontario’s population projection model developed by the author.20 Northern Policy Institute / Institut des politiques de Nord
Thunder Bay District | January 2019
Thunder Bay District’s Labour Force:
Past, Present, and Future Trends
Demographic changes have a direct impact on the the population aged 15 to 64 in the Thunder Bay District. As
supply side of the economy through their influence on the the table shows, both the total population and the labour
labour force. An aging population and a declining share of force in the district declined slightly between 2001 and 2016.
working-age people can seriously restrain future economic The labour force participation rate declined among men,
development unless productivity growth accelerates or but rose slightly among women over the same period. On
steps are taken to increase participation of older workers, the other hand, the employment rate rose among men and
youth, and other underrepresented groups in the labour women between 2001 and 2016. The unemployment rate
force. declined slightly for men and women.
This study has shown that the Indigenous population Labour force participation and employment rates among
represents a growing segment of Thunder Bay District’s total Francophone men and women in the Thunder Bay District
population and its working-age population. A significant declined slightly between 2001 and 2016. A similar trend
gap exists, however, between the level of educational is observed for male immigrants while the participation of
achievement of Indigenous peoples and that of the female immigrants rose by 4.8 per cent during the above
general population, resulting in a severe labour market period. There was also a significant difference between
outcome disparity that affects the current and future the Indigenous labour force on-reserve and off-reserve. The
productive capacity of Thunder Bay’s labour force. unemployment rate among on-reserve men was 30.8 per
cent in 2016, but the unemployment rate among off-reserve
Table 4 and Figure 11 show labour market trends among
Indigenous men was much lower (12.1 per cent).
Table 4: Labour Market Trends, Population 15 to 64 Years of Age, Thunder Bay District, 2001-2016
Labour Market Outcome Men Men Women Women
Thunder Bay District 2001 2016 2001 2016
Total population 15 to 64 years of age 50,445 47,340 50,160 47,600
In the labour force 40,755 35,655 35,730 34,280
Employed 36,290 32,060 33,130 32,080
Unemployed 4,460 3,595 2,600 2,200
Not in the labour force 9,695 11,685 14,430 13,320
Participation rate 80.8 75.32 71.2 72.02
Employment rate 71.9 67.72 66 67.39
Unemployment rate 10.9 10.08 7.3 6.42
Francophone Population 2001 2016 2001 2016
Total population 15 to 64 years of age 2,525 1,760 2,395 1,760
In the labour force 2,095 1,295 1,740 1,255
Employed 1,870 1,175 1,615 1,220
Unemployed 225 125 125 40
Not in the labour force 430 465 650 505
Participation rate 83 73.58 72.7 71.31
Employment rate 73.9 66.76 67.4 69.32
Unemployment rate 11 9.65 7.2 3.19Northern Policy Institute / Institut des politiques de Nord
Thunder Bay District | January 2019 21
Labour Market Outcome Men Men Women Women
Immigrant Population 2001 2016 2001 2016
Total population 15 to 64 years of age 4,750 2,980 4,585 2,910
In the labour force 3,755 2,340 2,940 2,005
Employed 3,480 2,155 2,795 1,905
Unemployed 275 180 140 95
Not in the labour force 995 640 1,645 905
Participation rate 79 78.52 64.1 68.90
Employment rate 73.3 72.32 61 65.46
Unemployment rate 7.3 7.69 4.8 4.74
Indigenous Population 2001 2016 2001 2016
Total population 15 to 64 years of age 3,840 6,790 4,520 7,495
In the labour force 2,795 4,035 2,555 4,275
Employed 2,070 3,275 2,120 3,695
Unemployed 720 760 430 575
Not in the labour force 1,050 2,760 1,965 3,220
Participation rate 72.8 59.43 56.5 57.04
Employment rate 54 48.23 46.9 49.30
Unemployment rate 25.8 18.84 17 13.45
Source: Author’s calculations based on Statistics Canada, various censuses, custom tabulation
Figure 11: Labour Force Participation and Unemployment Rates in Population 15 to 64 Years of Age, Thunder Bay District, 2016
Participation Rate (%)
90.0
75.3 72.0 78.5
80.0 73.6 71.3
68.9
70.0 60.1 58.1
60.0 56.2
51.0
50.0
40.0
30.0
20.0
10.0
0.0
Thunder Bay Francophone Immigrant On-reserve Off-reserve
District Indigenous Indigenous
Men Women22 Northern Policy Institute / Institut des politiques de Nord
Thunder Bay District | January 2019
Unemployment Rate (%)
35.0
30.8
30.0
25.0
21.0
20.0 16.2
15.0 12.1
10.1 9.7
10.0 6.4 7.7
4.7
5.0 3.2
0.0
Thunder Bay Francophone Immigrant On-reserve Off-reserve
District Indigenous Indigenous
Men Women
Source: Author’s calculations based on Statistics Canada, 2016 census, custom tabulation.
In general, Indigenous peoples tend to underperform in level of educational attainment of the Indigenous labour
the labour market relative to non-Indigenous peoples. force is below the regional average. Records show that
The labour force participation rate among Indigenous per-student education funding of on-reserve Indigenous
peoples is below the regional averages (Figure 11). They primary and secondary schools has been significntly lower
are seriously underrepresented in the labour force. Their than the provincial average in Ontario.11 Lack of adequate
unemployment rates are also significantly higher than funding is partly responsible for a lower level of educational
the regional averages. In fact, the lower labour force achievement among the Indigenous population. We will
participation rate is partly attributable to the presence estimate the human capital composition index for the
of the high unemployment rate among the Indigenous Indigenous labour force later in this report.
workforce. It is also partly related to the fact that the
Size and Composition of the Future Labour Force
To forecast the future labour force in the Thunder Bay period, the Indigenous labour force is expected to increase
District, we use detailed population projections along from 8,299 in 2015 to 9,439 in 2030, a rise of approximately
with information regarding participation rates for men 13.7 per cent. As a result, the share of Indigenous peoples
and women in different age groups. We have assumed in the total regional labour force is expected to increase
that the participation rates during the projection period from 11.9 per cent in 2015 to 15.2 per cent in 2030. What are
stay constant at their 2016 level. Different assumptions the implications of the declining labour force for the future
regarding the participation rates would alter the labour economic performance of Thunder Bay and Northwestern
force estimates, but only to a limited extent. The main Ontario? What are the implications of the rising share of the
determinants of the future labour force are the size and age Indigenous labour force? It is known that the Indigenous
distribution of the population in each jurisdiction. population has a lower level of educational achievement.
How would this affect the human capital composition of
Table 5 provides labour supply projections for the Thunder
the regional labour force in the coming years? We will try
Bay District. The projections show that the labour force in the
to answer some of these questions in the next section of this
district is expected to decline from 69,939 in 2015 to 62,182
report.
in 2030 – approximately 11.1 per cent. During the same
Table 5: Projected Labour Supply, Total and Indigenous, Thunder Bay District
Year Total Labour Force Indigenous Labour Force Indigenous Share (%)
2015 69,939 8,299 11.87
2019 70,731 8,655 12.23
2025 65,524 9,087 13.86
2030 62,182 9,439 15.18
Source: Author’s calculations based on his population projections
11
Office of the Parliamentary Budget Officer, “Federal Spending on Primary and Secondary Education on First Nations Reserves,” December 6, 2016.You can also read


