The Differences Within, Diversity in Age Structure Between
                and Within Ethnic Groups
←
→
Page content transcription
If your browser does not render page correctly, please read the page content below
The Differences Within, Diversity in Age Structure Between
and Within Ethnic Groups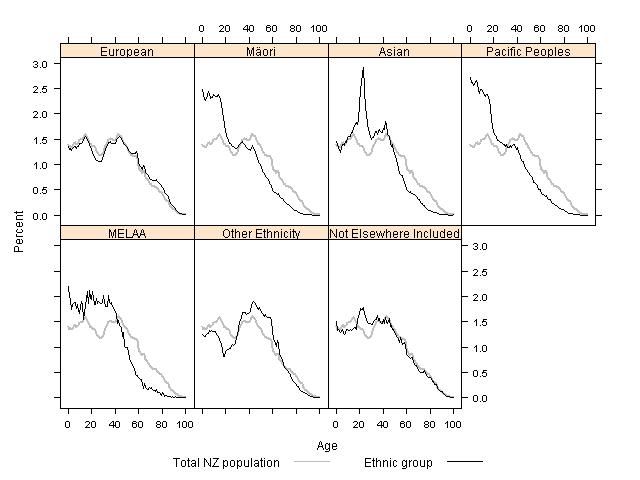
Reproduction of material
   Material in this report may be reproduced and published, provided that it does not
purport to be published under government authority and that acknowledgement is made
                                      of this source.

                                      Citation
   Goodyear, RK (Statistics New Zealand) (2009). The differences within, diversity in
  age structure between and within ethnic groups. Wellington: Statistics New Zealand

                            Published in June 2009 by

                               Statistics New Zealand
                                Tatauranga Aotearoa
                               Wellington, New Zealand
                              _____________________

                        ISBN 978-478-31585-1 (online)
                  Recommended retail price $35.00 (including GST)
Preface
The Differences Within, Diversity in Age Structure Between and Within Ethnic Groups is a guide
to some of the issues that researchers face when dealing with ethnic data. Ethnicity is a variable
that is used frequently to look at diversity of outcomes within a population, often as a proxy for
disadvantage. It is however, a very complex variable, with profound diversity below the highest
level ethnic categories. By taking one single variable, in this case age, and examining how it
differs underneath the highest level of the ethnic classification (European, Mäori, Pacific peoples,
Asian, Middle Eastern, Latin American and African (MELAA) and Other Ethnicity) and in
responses to other factors such as birthplace, we are able to understand some of this diversity.
This paper is largely based on information from the 2006 Census of Population and Dwellings,
as the census is the chief data collection that allows us to make meaningful exploration of a full
range of ethnic categories.
Information in this paper is useful for anyone working with ethnic data, such as medical or social
researchers and aims to raise awareness of the dangers of making broad assumptions about
ethnic groups. Care should be particularly applied to the Asian and MELAA groups as the data
revealed in this paper shows that there is huge diversity beneath the highest level of the ethnic
classifications.
This report was written by Rosemary Goodyear.
Geoff Bascand
Government Statistician
1Standards and further information
Percentage changes
Percentage movements are, in a number of cases, calculated using data of greater
precision than published. This could result in slight variations.
Rounding procedures
On occasion, figures are rounded to the nearest thousand or some other convenient
unit. This may result in a total disagreeing slightly with the total of the individual items as
shown in tables. Where figures are rounded the unit is in general expressed in words
below the table headings, but where space does not allow this the unit may be shown
as (000) for thousands, etc.
Prepared by
This report was written by Dr Rosemary Goodyear, a senior researcher for the Social
and Population group of Statistics New Zealand.
Liability statement
While all care and diligence has been used in processing, analysing and extracting data
and information in this report, Statistics NZ gives no warranty it is error free and will not
be liable for any loss or damage suffered as a result of the use, directly or indirectly, of
information in this report.
Statistics NZ’s Information Centre
For further information on the statistics in this report or for help finding and using
statistical information available on our website or in the INFOS database, contact the
Information Centre:
Email: info@stats.govt.nz
Phone toll-free: 0508 525 525
Phone international: +64 4 931 4600
Fax: +64 4 931 4610
Post: PO Box 2922, Wellington, 6140, New Zealand
Website: www.stats.govt.nz
2Contents
Preface............................................................................................................................. 1
Standards and further information ................................................................................... 2
Contents........................................................................................................................... 3
List of tables and figures .................................................................................................. 4
Tables........................................................................................................................... 4
Figures ......................................................................................................................... 4
1. Challenges of defining ethnicity ................................................................................... 5
2. Ethnicity within New Zealand ....................................................................................... 7
History .......................................................................................................................... 7
Current definition .......................................................................................................... 7
Level one ethnic categories.......................................................................................... 8
Some issues in understanding ethnicity ..................................................................... 10
Understanding multiple responses ......................................................................... 10
Ethnic intermarriage and ethnic mobility ................................................................. 12
Size of the ethnic group .......................................................................................... 12
Commonality does not imply homogeneity ............................................................. 13
An exploration of diversity: Age differences between and within ethnic groups ..... 13
Another source of diversity: People born overseas compared with born in New
Zealand ................................................................................................................... 20
Single and combination ethnic groups .................................................................... 21
Age or dependency ratios ....................................................................................... 22
3. Conclusions ............................................................................................................... 24
References..................................................................................................................... 26
3List of tables and figures
Tables
1 Single and multiple ethnic group affiliations for level 1 and level 2
ethnic groupings 11
Figures
1 Ethnic group as a percentage of the total population 08
2 Hierarchy of level 1 and level 2 ethnic groups 09
3 Age and sex structure of New Zealand population, 1906
and 2006 censuses 14
4 Ethnicity (level 1) and age structure, 2006 census 15
5 Ethnicity (level 1) and age structure for Asian ethnic groups
(level 2), 2006 census 16
6 Ethnicity (level 1) and age structure for European ethnic groups
(level 2), 2006 census 17
7 Ethnicity (level 1) and age structure for MELAA ethnic groups
(level 2), 2006 census 18
8 Ethnicity (level 1) and age structure for Pacific ethnic groups
(level 2), 2006 census 19
9 Ethnicity (level 1) and age structure for selected ethnic groups
(level 2) by overseas born/New Zealand born, 2006 census 21
10 Ethnicity (level 1) and age structure for selected single and
combination ethnic groups (level 2), 2006 census 22
11 Age ratios for level 2 ethnic groups, 2006 census 23
12 Brief timeline of settlement patterns within New Zealand 25
41. Challenges of defining ethnicity
Ethnicity is one of the major variables that governments and private researchers use when
analysing diversity, particularly equity of access and outcomes, within a population.1 Statistics
NZ lists the main purposes for collecting ethnic data in New Zealand:
• To monitor and report changes and disparities in outcomes among ethnic groups over
time.
• To monitor the changing ethnic diversity of New Zealand’s population at national,
regional and local levels, so that appropriate services may be delivered.
• To estimate future trends through population estimates and projections for Mäori,
European, Pacific and Asian populations.
• To monitor the demographic, social and economic progress of, and outcomes for, ethnic
groups.
• To evaluate the impact of central and local government policies on the economic and
social well-being of ethnic groups.
• To model the impacts and costs of policy changes, and to forecast expenditure on
services for particular groups.
• To assist in the delivery of services in a culturally appropriate way and to plan social
services which meet the special needs of ethnic groups.
• To identify significant communities of interest for liaison and development purposes.2
Once the monochromatic capital of the mainland, Christchurch's suburbs are now filling
with the vibrancy of more than 160 racial groups. These new Cantabrians have brought
with them experiences, culture, food, traditions and languages as varied as the shades
of their skin. The kaleidoscopic effect of their presence in this city has been felt by
everyone.
– The Press, Saturday, 23 December 2006, Ethnic enrichment of Christchurch,
Diverse City.
Ethnic divergence in outcomes forms the basis of debate and policy initiatives locally3 as well as
internationally. In New Zealand, the contract between Mäori and the Crown has also resulted in
both an obligation and a need to monitor the situation of Mäori; although the government also
monitors the situation of other ethnic groups, particularly Pacific peoples.
The job of a statistical agency is to define ethnicity in order to provide measurable categories
that can service the needs of official agencies to collect data “which helps them to understand
populations, trends in population characteristics and experiences across subgroups of the
population including ethnic (or in US terms, racial) groups”.4 Yet ethnicity is one of the hardest
concepts to define and consequently definitions have shifted over time to suit the cultural and
1
Not all countries collect ethnic data. Some countries, such as European countries that are influenced by
the legacy of World War II, continue to refuse to collect statistics on ethnicity or on ethnic groups.
2
Statistics New Zealand, “Ethnicity classification”. http://www.stats.govt.nz/statistical-
methods/classifications-and-related-statistical-standards/ethnicity/default.htm
3
For example: ‘Mäori criminals should have their sentences assessed against their ethnic and cultural
backgrounds, a United Nations report says. . . . Mäori Party co-leader Pita Sharples welcomed the report
and said Mäori were often the victims of "cultural ignorance" within the criminal justice system. The report
said Mäori were over-represented in prisoner statistics and that provisions in the Criminal Justice Act,
allowing people to provide "cultural" reasons for their offending, were underutilised. “Courts ignoring ethnic
factors.” B Fawkes, The Dominion Post, Monday, 20 August 2007
4
J Burton, A Nandi, Lucinda Platt, “Who are the UK’s minority ethnic groups? Issues of identification and
measurement in a longitudinal study”, Institute for Social and Economic Research, No.2008-26, September
2008, 8.
5policy contexts of society. There is also inconsistency in measurement between countries. A
tension exists between the official desire for categorisation and the shifting nature of ethnic
identification. UK researchers note that one of the key problems of categorical ethnic identities is
that these are used to “measure a multidimensional and fluid concept as if it were a uni-
dimensional, fixed and stable concept”.5 Measuring and analysing ethnic diversity is therefore a
complex and challenging task especially since the concept of ethnicity incorporates other related
topics. Indigeneity and cultural and religious difference, birthplace, language, and visible
difference (which is one mechanism whereby members of an ethnic group can be identified by a
combination of physical features including skin colour) are related to, or form part of ethnicity. 6
This paper provides a context for ethnic analysis in New Zealand by exploring the diversity that
exists within the high level groupings that are most commonly used for ethnic analysis:
European, Mäori, Pacific peoples, Asian, Middle Eastern, African and Latin American (hereafter
MELAA) and Other as well as an examination of multiple ethnicity.
Age structure is one of the most important demographic elements of a population and visualising
variability in age structure shows how analysing data at the highest level can obscure important
differences. This variability in age structure may be shaped by a number of factors: fertility rates,
the proportion of migrants in a given ethnic population, and the timing and circumstances
surrounding migration. Any analysis or policy formation needs to be aware of these subtleties.
Supporting evidence for this paper will be derived from the 2006 Census of Population and
Dwellings because of the size of the data set, which allows the disaggregation of broad level
ethnic groupings into lower level ethnic groupings.
5
J Burton, A Nandi, Lucinda Platt, 8.
6
Boston, J., Callister, P., & Wolf, A. (2006). The Policy Implications of Diversity. Institute of Policy Studies:
Wellington, NZ.
62. Ethnicity within New Zealand
History
An interest in ethnic measurement emerged in New Zealand even before the beginnings of
official government. Initially, the emphasis was on population counts. In 1769, Captain James
Cook made a rough enumeration of the number of inhabitants in Aotearoa (estimating
approximately 100,000 Mäori) while early missionaries as well as the official British resident,
James Busby, attempted to calculate the numbers of European and Mäori.7 By the late 19th
century, concerns about depopulation gave the New Zealand government an interest in
quantifying the number of Mäori in New Zealand. By the 20th century fears of ‘alien’ races
resulted in an attempt to define the number of other non-Europeans. Official classifications at this
time firmly focused on ‘race’ and ‘degrees of blood’.8
In 1921, the Department of Statistics instructed numerators to classify people of mixed race thus:
"Those who ranged in degree between half-caste and Mäori were to be included with Mäoris of
full blood”, while those between European and half caste would be classed as “half caste”. The
definition included some aspects of cultural identity. Whether half castes came under the Mäori
or the general census depended on whether they lived as European or Mäori. Any issue
(child/ren) of a Mäori and a ‘race alien’ were classed as a ‘race alien’.9
This concern with determining degrees of difference dominated enumeration for much of the
20th century. In the 1970s the collection of ethnic data changed again and emphasis gradually
changed from blood to identification. The 1971 Census asked ‘descent origin’ and in 1976 the
term changed to ‘ethnic origin’. The 1986 Census allowed people to list multiple affiliation rather
than fractions of affiliation. By 2001 the Census asked people "Which ethnic group do you belong
to? (Mark the space or spaces which apply to you?)”.10
Current definition
The current Official Statistics Ethnicity Standard, (Statistics NZ, 2005), defines ethnicity as the
ethnic group or groups that people identify with or feel they belong to. New Zealand is often seen
as unique in the way that it approaches the concept of ethnicity, both in the conceptualisation of
ethnicity, and in the collection of ethnicity data. Ethnicity is a concept quite separate and distinct
from race, ancestry, nationality, or citizenship although it can incorporate elements of these
concepts. There is an underlying assumption that an ethnic group is a group because of a
shared similarity and is more about cultural affiliation than a race-based concept. Indeed, in
defining ethnicity, the Ethnicity Standard explains an ethnic group is made up of people who
have some or all of the following characteristics:
• a common proper name
• one or more elements of common culture which need not be specified, but may include
religion, customs, or language
7
The Rev W. Williams estimated that in 1838 the North Island’s total Mäori population was about 106,000,
Alexander Busby, the Official British Resident thought that there were about 2,000 to 3,000 Europeans in
1840. A Grey, Aotearoa and New Zealand A historical geography, Canterbury University Press,
Christchurch 1994, 145-146.
8
S Howard and R Didham, “Ethnic intermarriage and ethnic transference”, 2.
9
Department of Statistics, Results of a Census of the Dominion of New Zealand taken for the night of the
17th April, 1921, General Report, Wellington 1925, 65. Information about race aliens first appeared in the
1916 Census. The 1936 census defined race alien as “all those who are of neither European nor Mäori
origin. Substantially (though not wholly, as noted in the remarks on “white” population) it relates to the
“coloured” races other than the native Mäori race.” Census and Statistics Department, Population Census,
1936, Vol.IX-Race, Wellington, New Zealand, 1945, i.
10
S Howard and R Didham, “Ethnic intermarriage and ethnic transference”, 2.
7• a unique community of interests, feelings and actions
• a shared sense of common origins or ancestry, and
• a common geographic origin.
People in the census can choose up to six ethnic groups although in practice most people
affiliate with one or two. In the 2006 Census, less than two percent of the population listed three
or more ethnic affiliations. There is some variation in other official collections but increasingly
other agencies are attempting to harmonise the collection of ethnicity in order to increase the
comparability of ethnic data.
Level one ethnic categories
As detailed in the Ethnicity Standard (Statistics NZ, 2005), six high level (level 1) ethnic groups
are used when summarising data.11 The six high level ethnic groupings in order of their
population size are European, Māori, Other ethnicity, Asian, Pacific peoples and MELAA. In
2006, the ‘Other ethnicity’ group consisted largely of people who responded as New Zealander,
as shown by the following graph. The 2005 standard is currently being reviewed in regard to
placement of New Zealander responses.
Figure 1
These groupings can be further disaggregated into level 2, level 3 and level 4 categories, with
over 200 ethnic categories at the most detailed level of the classification. The following diagram
illustrates how level 1 and level 2 categories fit together.
11
While the Asian ethnic group used to be aggregated with other ethnicities into a residual ‘Other’ grouping,
and is, in some small survey situations, still grouped in the ‘Other’ ethnic group, over time the number of
people identifying with ethnicities in the Asian ethnic grouping has increased and is generally now identified
separately.
8Figure 2
Hierarchy of level 1 and level 2 ethnic groups12
1 European 10 European nfd
11 New Zealand European
12 Other European
2 Māori 21 Māori
3 Pacific Peoples 30 Pacific Peoples nfd
31 Samoan
32 Cook Islands Maori
33 Tongan
34 Niuean
35 Tokelauan
36 Fijian
37 Other Pacific Peoples
4 Asian 40 Asian nfd
41 Southeast Asian
42 Chinese
43 Indian
44 Other Asian
5 Middle Eastern/Latin American/African 51 Middle Eastern
52 Latin American
53 African
6 Other Ethnicity 61 Other Ethnicity
9 Residual Categories 94 Don't Know
95 Refused to Answer
96 Repeated Value
97 Response Unidentifiable
98 Response Outside Scope
99 Not Stated
Note: the other ethnicity category is largely made up of the New Zealander response. See
Statistics NZ, Profile of New Zealander Responses, Ethnicity Question: 2006 Census for more
details.
Statistics NZ consulted extensively with data users when developing high level aggregations of
people’s responses13 and priority is given to meeting information needs of the majority of users.
As researchers Didham, Callister and Kivi noted in their 2008 paper, these groupings do not
always reflect individual preferences as people do not choose to be reclassified into these higher
groups and this reclassification involves certain assumptions. All the higher level groups, except
for Mäori, are not individual ethnic groups but collections of groups, an example being Pacific
peoples. “Therefore, they are not strictly ‘who we are’, but are who statistical agencies group us
with. For some people, it is not a grouping they would naturally choose.”14 High level categories
12
http://www.stats.govt.nz/statistical-methods/classifications-and-related-statistical-
standards/ethnicity/download+of+classification.htm
13
See information about the Review of Ethnicity, http://www.stats.govt.nz/analytical-reports/review-
measurement-ethnicity/default.htm.
14
P Callister, R Didham, A Kivi, “Who are we? The conceptualisation and expression of ethnicity”, 22.
9also exist because of statistical requirements such as confidentiality and the risks of data being
skewed by small numbers. Indeed, in many sample surveys numbers are too small for
information to be released about all the six high level groupings. Such groupings allow for easier
analysis and output but also reduce the complexity and multiplicity of ethnic responses and
obscure important ethnic differences.
Mäori also affiliate with specific iwi or tribal groupings that have their own distinct traditions and
histories, meaning that the generic Mäori grouping can be further disaggregated. In 2006, there
were 643,977 people in New Zealand who said that they were of Mäori descent, and 522,576 or
approximately 81 percent of these people said they identified with the Mäori ethnic group. The
largest iwi for people of Māori descent was Ngāpuhi with 122,211 people, while a total of
102,366 people of Māori descent did not know their iwi.
The six highest level ethnic groupings appear logical on a superficial level but should not be
viewed as homogenous. Certainly they appear to share at the broadest level a crude
geographical origin; although it is recognised that for Pacific and Asian peoples the geographical
origin is very extensive and involves a diverse range of cultures and peoples.
In the case of Asian peoples, the geographic boundaries implied by ethnicities included in the
group are open to dispute. Moreover there can be no implication, on geographic grounds, of
homogeneity within the group, given the ethno-cultural and historical diversity of the region.
The MELAA group includes ethnicities that originate from non-contiguous parts of the world, and
is really a way to identify the groups included previously under the ‘Other’ category. Any
discussion of the diverse range of groups, identities and languages within Asian, MELAA and to
some extent Pacific peoples, makes their heterogeneity obvious and exposes the problems of
making assumptions based simply on these broader level groupings. An examination of the
dynamics of the growing number of people with multiple ethnic identities further exposes the
complexities inherent in ethnic analysis.
Some issues in understanding ethnicity
Understanding multiple responses
Although ethnicity is a complex topic, the presence of people affiliating with more than one
ethnicity further complicates any ethnic analysis. Indeed until recently, people who gave multiple
ethnicities were allocated to one group, with a hierarchical prioritisation system that was
essentially based on perceived policy needs. As the level of multiple responses increased,
however, researchers such as Didham (2006) showed that prioritisation became increasingly
problematic. At the time of the 2001 Census some groups with high levels of multiple responses
lost large numbers of people, for example, almost a third of Pacific children were counted as
Mäori under the prioritised system.15 Statistics NZ discontinued prioritisation after the 2004
Review of the Measurement of Ethnicity Statistics.
While some statistical collections do not allow people to identify with more than one ethnicity,
New Zealand recognised that multiple ethnic responses are essential as many people cannot
simply respond with one ethnicity without denying part of their identity. This definition is
consistent with, for example, how ethnicity is conceptualised within Mäoridom whereby
“individuals with mixed Mäori background regardless of their ethnic heritage are considered
‘Mäori’ without denying any other ethnic heritage they might have.”16 It is important to remember
that ethnic groups are not necessarily independent and have a lot of overlap between them.
15
“Under this system Mäori had priority coding, followed by Pacific peoples, then Asian, then other ethnic
groups besides European, followed by “Other European” and, finally New Zealand European. P Callister, R
Didham, A Kivi, “Who are we? The conceptualisation and expression of ethnicity”, 26 See also R Didham,
‘Impact of Prioritisation on the Interpretation of Ethnicity Data’, Statistics New Zealand 2006.
16
Howard and Didham.
10Understanding that overlap, and the fluidity of ethnic grouping is the first key to understanding
the diversity that exists within, and indeed between, different ethnic groups.
Table 1 gives the proportion of each level 2 ethnic group that affiliate with multiple ethnicities.
This information reveals the extent of the overlap between ethnic groups at this level of analysis
and gives the denominator for each ethnic group.
Table 1
Single and Multiple Ethnic Group Affiliations, Level Two Ethnic Groupings
Counts Proportion
Level One
Level Two grouping Population Single Multiple Single Multiple
grouping
ethnicity ethnicity ethnicity ethnicity
European
European nfd 21,855 19,230 2,625 88 12
New Zealand European 2,381,076 2,062,635 318,441 87 13
Other European 239,892 181,806 58,083 76 24
Māori Māori 565,329 298,395 266,934 53 47
Pacific Peoples
Pacific peoples nfd 786 498 288 63 37
Samoan 131,103 86,763 44,337 66 34
Cook Islands Maori 58,011 30,759 27,255 53 47
Tongan 50,478 35,601 14,877 71 30
Niuean 22,476 9,177 13,296 41 59
Tokelauan 6,822 2,958 3,864 43 57
Fijian 9,864 4,752 5,109 48 52
Other Pacific peoples 8,118 4,368 3,747 54 46
Asian
Asian nfd 2,160 1,662 498 77 23
Southeast Asian 43,959 36,897 7,065 84 16
Chinese 147,570 130,551 17,016 89 12
Indian 104,583 95,097 9,483 91 9
Other Asian 59,736 55,398 4,338 93 7
MELAA
Middle Eastern 17,514 14,652 2,862 84 16
Latin American 6,657 5,094 1,563 77 24
African 10,647 8,586 2,061 81 19
Other Ethnicity Other Ethnicity 430,878 374,847 56,031 87 13
Note: nfd includes people who said they affiliated with an ethnicity at level one but did not provide enough
detail to be included at the more detailed level of the classification.
Approximately, one in eight people at the time of the 2006 Census affiliated with more than one
ethnic group. For some ethnic groups, however, a much greater proportion of people identified
with multiple ethnicities.
A range of factors may influence the degree to which ethnic populations may record higher
degrees of multiple ethnicities. These factors may include the size of the ethnic population, the
degree that intermarriage/partnership occurs and is acceptable, as well as the acceptability itself
of having multiple affiliations.
11Ethnic intermarriage and ethnic mobility
A paper on ethnic intermarriage in New Zealand suggests that age, education and whether a
person was born in New Zealand influence rates of intermarriage.17 Ethnic mobility (where
people change ethnic affiliations) and ethnogenesis (the formation or emergence of an ethnic
group within a larger community) further increase the likelihood of people identifying with multiple
ethnicities.
Shifts in ethnic identification may occur over time and in different contexts. For example, the
number of people identifying with Mäori ethnicity increased from the 1960s not just as a result of
natural increase but also through ethnic mobility as the perceived acceptability of being Mäori
increased. In 2007, researcher Andrew Sporle, told the New Zealand Herald “the number of
people claiming Mäori ethnicity had jumped in the past decade because of ‘what we call the
Shortland Street or Dr Ropata effect’. It suddenly became really cool to be Mäori.”18
The semantic meaning of ethnic terms themselves change, as researchers into ethnogenesis
has shown.19 A recent study of young New Zealanders found that they changed their expression
of cultural identity according to the situation, which could be seen as “a positive response to our
post-modern, conflictual world, which regularly demands multiple responses to differing values
and belief systems.”20 These trends, combined with continuing migration to New Zealand from a
diverse range of counties, result in increasing numbers of inter-ethnic marriages and younger
generations with potential multiple affiliations.
Size of the ethnic group
The size of the ethnic group is important. Statistically, smaller populations have fewer people to
contribute to variation and thus would generally be expected to show less within group
difference. However, with lower population denominators, small differences become magnified
when converting counts to proportions. Furthermore, the smaller the ethnic group, the more likely
they will interact with people outside their group. The more interaction they have outside of their
ethnic group the higher the likelihood of ethnic intermarriages, cross-ethnic group mixing and
identification, and rearing children who identify with mixed ethnicities. Of course the existence of
multiple ethnicities itself will magnify the statistical incidence of ethnic intermarriage.21 As shown
in table 1, the highest overlap can be seen in some of the smallest populations; some of the
Pacific ethnic groups who had migrated to New Zealand in waves from the 1960s onwards. Of
the larger populations, the Māori ethnic group shows the largest degree of ethnic group overlap,
where nearly half the Māori population affiliate with another ethnicity that is not Māori. As noted
by Howard and Didham, New Zealand has had a long history of ethnic intermarriage, particularly
between Mäori and European from the earliest days of contact.22 The lowest rate of multiple
affiliation comes from the ‘other Asian’ group, which includes Sri Lankan, Japanese, Korean,
Afghani, Bangladeshi, Nepalese, Pakistani, Tibetan, Eurasian, and Asians not elsewhere
classified.
17
P Callister, R Didham and D Potter, “Ethnic Intermarriage in New Zealand,” Statistics New Zealand
Working Paper, Sept 2005, 5.
18
“Ethnogenesis refers to the birthing of new cultural identities” and Voss explores these ideas by studying
the rise of a new identity among colonial settlers in San Francisco while it was still under Spanish rule. She
examines how these settlers forged a new identity as Californians which was separate from their ethnic
ancestry. B Voss, The Archaeology of Ethnogenesis. Race and Sexuality in Colonial San Francisco,
University of California Press, CA, 2008.
19
NZPA | Friday, 07 December 2007, http://stuff.co.nz/4315628a8153.html.
20
E Keddell, “Cultural Identity and the Children, Young Persons, and Their Families Act 1989: Ideology,
Policy and Practice’, Social Policy Journal of New Zealand, 32 Nov 2007, 52-53.
21
Callister, Didham and Potter, 5.
22
See Howard and Didham.
12Commonality does not imply homogeneity
Other issues that should be allowed for when carrying out ethnic analysis is that while
commonality is an important part of defining ethnicity, sharing some commonality does not imply
homogeneity. In effect there is no one ethnic experience but a multiplicity of experience as social
class and geographical location, among other factors, are also important determinants of
experience. For example, a 2003 report of the educational attainment of children noted that
although most outcome studies revealed that Mäori and Pacific students achieve “significantly
below the overall New Zealand mean for many curricula areas, and in many cases below
international mean achievement levels”. There is:
marked variation within Māori and within Pasifika achievement, with some of these children
achieving very highly, on average. . . . caution is required when considering the findings of
research, because the usual ethnic groupings of ‘Māori’ and ‘Pasifika’ (and probably Asian)
children in New Zealand research studies obscure the fact that, while there are commonalities
within these broad groupings, they are not homogeneous groups. There are diverse ethnic
groups within Māoridom (Adams, Clark, Codd, O'Neill, Openshaw, & Waitere-Ang, 2000) and
Pasifika people (Coxon, Anae, Mara, Wendt-Samu & Finau, 2002; Mara, 1998.23
Mäori and Pacific peoples are not discrete groupings but share a significant proportion of their
population with each other. Groups can be made up of different and distinct parts and ethnic
groups are no exception. An examination of age structure within level 1 ethnic groups reveals
some of that diversity of experience.
An exploration of diversity: Age differences between and
within ethnic groups
Age structure is one of the most well-known sources of between-group differences and is often
used in ethnic analysis. Age standardisation of data is a common analytical practice because
age differences can influence many of the characteristics in small populations, particularly of
ethnic groups. It may particularly affect outcome variables such as income and education.
Age structure is not constant and can vary markedly over time. For example, the age and sex
structure of New Zealand and its component ethnic groups changed dramatically over the years
between the 19th century and 2006. In the period of the gold rushes, for example, the rapid
inrush of men led to a strong male/female imbalance in the population. The birth-rate in the late
19th century, which approximated to over six children per woman, meant that early 20th century
New Zealand was a very youthful place.24 By the early 21st century, population ageing (at least
among the majority New Zealand European population) had resulted in a very different age
structure.
23
F Biddulph, J Biddulph & C Biddulph, “The complexity of community and family influences on children’s
achievement in New Zealand: Best Evidence Synthesis”, Report prepared for the New Zealand Ministry of
Education, Jan 2003, 48.
24
I Pool, A Dharmalingam & J Sceats, The New Zealand Family from 1840: A Demographic Study, AUP,
Auckland, 2007. www.auckland.ac.nz/uoa/aup/book/2007/the-new-zealand-family.cfm
13Figure 3
Age and Sex Structure of New Zealand Population, 1906 and 2006 Census
Note: The New Zealand population in 1906 did not include Mäori, who were enumerated
separately.
14Figure 4
Ethnicity (level 1) and Age Structure, 2006 Census
Other response largely consists of New Zealander.
Note: Not elsewhere included, is a residual category that includes non-response, illegible
responses, objection to answer, and responses that are out of scope of the question.
Information about residuals has been included to establish patterns for non-response. It is
interesting to note that the note elsewhere included age pattern is very close to the European
group, with a spike in the 20-40 age group, where the European response dips.
Figure 4 shows distinctive age structures at the level 1 ethnic group. Mäori and Pacific peoples
have high proportions of children but perhaps the most distinctive pattern emerges among the
Asian grouping with its sharp peak in people aged 20–24.
A further examination of the Asian category at level 2, however, shows that the level 1 graph
mainly reflects the age pattern of people affiliating with the Chinese ethnic group, who are the
largest group within the Asian category. In contrast, people affiliating as Indian, the next largest
Asian grouping, have a much flatter age structure with the highest proportion of people aged
between the mid 20s to early 40s.
15Figure 5
Ethnicity and Age Structure for Asian Ethnic Groups (level 2), 2006 Census
Note: even level 2 categories include a diverse range of ethnic groups. For example Southeast
Asian is made up of groups such as Thai, Cambodian, Burmese and Filipino.
Age structures for the European grouping are even more skewed. Figure 5 shows that people
affiliating with the New Zealand European ethnic group, the majority of the New Zealand
population, make up 90 percent of the European population. This numerical dominance means
that the European age structure clearly reflects the age structure of the New Zealand European
population. Level 1 age structure is being driven by the dominant level 2 ethnic grouping.
16Figure 6
Ethnicity and Age Structure for European Ethnic Groups (level 2), 2006 Census
Note: Other European is also a very diverse grouping, consisting of over 60 different ethnic
groups including English, Irish, Polish and South Slavs.
The MELAA grouping is a combination of geographically and culturally disparate groups. Figure
7 demonstrates this diversity in age structure. Middle Eastern is the largest group in this
category, making up approximately 50 percent of the total MELAA grouping and is itself a
diverse collection of groups including Turks, Iranians, Egyptians and Israelis. The MELAA total
bears little resemblance to any of the three age structures within this grouping.
Any analysis of the age structure of these groups at level 1 therefore will yield little useful
information about the component groups within this category. Caution should therefore be
applied when using this group for any analysis relating to ethnic disparity.
17Figure 7
Ethnicity and Age Structure for MELAA Ethnic Groups (level 2), 2006 Census
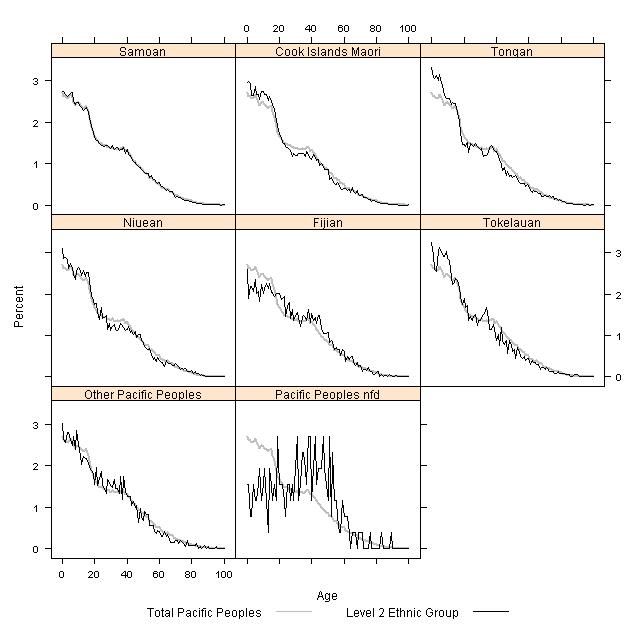
Pacific peoples is the only grouping that shows a level of homogeneity in age structure, see
figure 8. Although almost half (49 percent) are people affiliating with the Samoan ethnic group,
this does not disproportionately skew the age structure as the other Pacific groupings at this
level show very similar characteristics. There are small variations: people with Tongan ethnicity
had the highest proportion of infants and young children while people with Fijian ethnicity had the
lowest proportion. All the Pacific groupings have the most youthful age structure of any ethnic
grouping and share a strong similarity in age structure with Mäori.
18Figure 8
Ethnicity and Age structure for Pacific Ethnic Groups (level 2), 2006 Census
Note: the very small numbers in the Pacific Peoples nfd category results in erratic age patterns.
nfd= not further defined
The age distributions shown in figures 3 to 8 reveal the diversity of age structure for peoples
grouped below level 1 ethnic categories. Issues, problems and experiences will not be uniform
for this range of groups.
19Another source of diversity: People born overseas
compared with born in New Zealand
Another dimension that complicates the issue further within ethnic categories is the variation
between the overseas born and New Zealand born population. This variation is especially
important for groups when there have been two or more distinctive waves of migration to New
Zealand. These groups include people with Chinese, Indian and Lebanese origin.
This variation is particularly evident in the Chinese population, which is the largest group
numerically in the Asian category. Chinese arrived at the time of the goldrushes but government
restrictions made ongoing immigration from China difficult with the imposition of a poll tax. The
1899 Immigration Restriction Act directed that no person other than those of British or Irish birth
and parentage would be allowed to land in New Zealand unless they wrote and signed an
application in a European language. Over subsequent years this policy limited immigration from
outside these countries.25 In 1974 the government ended unrestricted immigration from United
Kingdom and Ireland and provided for the selection of immigrants from all sources on the same
criteria.26 Changes to legislation policies in subsequent years led to an increase in people of
different ethnicities and nationalities settling in New Zealand with a subsequent rise in a number
of groups particularly from Asia. New Zealand also took advantage of its English speaking status
and promoted the development of English language schools and the education of overseas
students. As the work of Manying Ip has revealed, these resulted in a collection of very different
population who would be included as Chinese. She notes that New Zealand born Chinese whose
families have been in New Zealand for generations have a very different experience to more
recent business migrants and the large student population.27
The following figures show a clear contrast between the age structures of New Zealand born and
overseas born Chinese, as discussed in the work of Manying Ip. The sharp peak that
characterises the Asian and Chinese age structures occurs only in the overseas-born Chinese
population. Since the overseas-born Chinese made up almost 80 percent of the Chinese
population in 2006, any variation in the New Zealand born population is disguised.
Many people with Chinese ethnicity who were aged 20–24 years were students: 74 percent of
Chinese people aged 20–24 said that they studied either full or part-time. In total, 46,146 people
or 40 percent of Chinese adults who specified their studying status said that they studied either
full or part time. The high proportion of students in the 20–24 group adds volatility to the age
structure of people with Chinese ethnicity.28
25
New Zealand 1990 Official Yearbook, Wellington, 1990, 188. New Zealand has also accepted refugees
since the early 20th century. Numbers increased in the 1970s when refugees who came under the United
Nations mandate settled in New Zealand, ibid 190.
26
ibid 144.
27
Ip, M, (ed) Unfolding History, Evolving Identity The Chinese in New Zealand, AUP, Auckland 2003. Ip, M,
New Zealand’s New Chinese Communities: Diversity and Mobility, A paper presented to the ‘Sub Ethnicity
in the Chinese Diaspora Conference’, University of Toronto, 12-13 Sept 2003.
28
Chinese is itself a grouping of ethnicities and so the term itself implies diversity rather than homogeneity.
Wikipedia defines Chinese people, as people of Chinese ethnicity and/or nationality with Zhonghua minzu,
the term for the supra-ethnic Chinese nationality which relates to the modern notion of a Chinese nationality
transcending ethnic divisions, with a central identity to China as a whole. It includes peoples who have
historically interacted, contributed and assimilated to various extents with Chinese civilization. Han Chinese
is a common descriptor for a grouping of ethnicities incorporating around 90 percent of the population in
China but there are also a significant group of ethnic minorities in China (China officially recognises 55
minorities, many of which are not Chinese ethnically and would not generally report themselves as
Chinese), who comprise the non-Han Chinese population in mainland China and Taiwan.
20Figure 9
Age Structure for Selected Ethnic Groups (level 2), by Overseas born/New Zealand born,
2006 Census
While the contrast between New Zealand-born Samoan and overseas-born people affiliating with
the Samoan ethnic group is not quite as striking, there is still a clear contrast between the two
groups.
In Figure 9 the peak ages for Samoan overseas-born are between the late 30s and late 50s,
reflecting the peak migration periods for Samoan immigrants in the 1960s and early 1970s. The
effects of migration show very clearly in these graphs: young children dominate the New Zealand
population in groups of fairly recent migrants, particularly in the Middle Eastern group.
Single and combination ethnic groups
Another source of complexity within and between ethnic groups comes when groups have high
percentages of multiple ethnicities, particularly Mäori and Pacific peoples. An examination of
ethnic combinations, using level 1 ethnicity reveals that single and combination groups can have
very differing age structures.
There has been an increasing incidence of multiple ethnicity among young people, which results
in the proportion of young children with a sole ethnicity declining, bringing further complexity into
any policy formation. Figure 10 shows these effects for selected groups. The very high
proportion of young children with Mäori and Pacific ethnicity is particularly evident in this figure.
21Figure 10
Ethnicity (level 1) and Age Structure for Selected Single and Combination Ethnic Groups,
2006 Census
Age or dependency ratios
Dependency ratios provide an insight into different population structures. These ratios show the
proportion of children and people aged 65 and over to the working age population. While they do
not necessarily reflect dependency, since for example people aged over 65 may still be working,
they are a useful summary measure of the age structure of the population. Calculating the
effects of age or dependency ratios for ethnic groups is complex since people may state more
than one ethnicity. Also as research on family ethnicity and ethnic intermarriage in New Zealand
has shown, there may be a range of ethnicities within families and households. Nevertheless as
a crude measure, dependency ratios do tell us something about the situation of different ethnic
groups.
The age or dependency ratios in figure 10 reflect a number of different influences: fertility rates,
life expectancy, length of time within New Zealand and the dynamics of the group. For example,
the Chinese ethnic population had a very large proportion people aged 20–24 and consequently
had one of the lowest dependency ratios of 31 dependent children or people aged 65 or over, for
100 adults aged 15–64 years. In contrast, the Tongan ethnic group with its very youthful
population had a dependency ratio of 85 dependents per 100 working population, with the major
component of dependents being children (78 children per 100 working age adults).
22Figure 11
Dependency Ratios for Level 2 Ethnic Groups, 2006 Census
Dependency ratios for selected level 2 ethnic groups
Ethnicity 2006 Census
Tongan
Samoan
Mäori
African
Fijian
Middle Eastern
Indian
New Zealand European
Total, New Zealand
Southeast Asian
Latin American
Chinese
0 10 20 30 40 50 60 70 80
Percent
over 65 ratio child dependency
Note: dependency ratios are calculated thus: child dependency = number under 15/working age
population, over 65 dependency ratio = number 65 and over/working age population.
233. Conclusions
This very brief discussion about the different age makeup of ethnic groups reveals the inherent
variety within ethnic groups at all levels of the ethnic classification. Analysts need to be aware of
these variations when analysing ethnic groups at the highest level of the classification.
For some groups such as Mäori and Pacific peoples, analysis at this level works reasonably
effectively as these groups show greater homogeneity in age structure. Yet even within the
Pacific groupings, although these all have young populations, there is a contrast between people
with Tongan and Tokelauan ethnicity (which had the highest dependency ratios) compared with
the Fijian population, which had a total dependency ratio much closer to the New Zealand
average (56 dependents per working population compared with 51 nationally). These differences
have implications for policy makers when creating policies for individual groups.29
For other groups, namely Asian and MELAA, analysis at the highest level of the ethnic
classification is unlikely to yield much useful information and could be misleading because of the
greater diversity within these groups. The large population of Chinese students skews the age
structure of the Asian population substantially. In the MELAA category, the considerable diversity
of disparate populations also means the level 1 category would yield little information about the
component groups.
Age structure is also likely to change in the future as populations become more settled in New
Zealand. As the timeline in figure 12 shows, many of the diverse ethnic populations within New
Zealand have arrived fairly recently and many of the characteristics of these populations are
shaped by that migration history.
The variability in age structure between groups at the level two of the ethnicity classification
reveals some of the issues involved when the ethnic characteristics of the population are
analysed at the highest level of the ethnic classification.
Age structure is just one of the characteristics that shows variability at more detailed levels of the
ethnic classification. Other social and economic characteristics such as religion, language,
education and employment also vary markedly at more detailed levels of the ethnic classification.
Other issues such as whether a person is overseas-born or identifies with a range of ethnic
group are also very important factors in variability of ethnic populations. As this brief analysis has
shown the characteristics of a New Zealand-born population such as New Zealand Chinese are
very different from that of the overseas born population despite their sharing a common ethnicity.
The small numbers of some ethnic groups means that analysis at a more detailed level may be
not practicable. It is doubly important, however, for the analyst to understand this complexity
before making assumptions about some of the more diverse groupings, particularly, Asian and
MELAA.
29
Statistics NZ, “Family Wellbeing indicators from the 1881-2001 Censuses”, 61.
24Figure 12
Timeline of Settlement in New Zealand
Source: Statistics New Zealand Yearbook 1990, Te Ara Encyclopaedia of New Zealand.
25References
Adler, N et al (2008). Reaching for a healthier life: facts on socioeconomic status and health in
the U.S. The John D. and Catherine T. MacArthur Foundation Research Network on
Socioeconomic Status and Health.
Allan, J (2007). Profile of New Zealander responses, ethnicity question, 2006 census.
Wellington: Statistics New Zealand.
Allan, J (2001). Review of ethnicity: international concepts and classifications. Wellington:
Statistics New Zealand.
Auckland Regional Council, (2007). Immigration and ethnicity in the Auckland region, 2006
census series.
Ball, A (2008). New Zealand incomes, 1997–2001 draft report. Wellington: Statistics New
Zealand.
Baker M, Howden-Chapman, P (Wellington School of Medicine) & Goodyear, R (Statistics New
Zealand, (2003). Crowding and health, in What is the extent of crowding New Zealand: an
analysis of crowding in New Zealand households, 1986–2001. Wellington: Statistics New
Zealand.
Biddulph, F, Biddulph, J & Biddulph, C (2003). The complexity of community and family
influences on children’s achievement in New Zealand: best evidence synthesis. Report prepared
for the New Zealand Ministry of Education.
Blakely, T, Tobias, M, Atkinson J, Yeh, L-C, & Huang, K (2007). Tracking disparity: trends in
ethnic and socioeconomic inequalities in mortality, 1981–2004. Wellington: Ministry of Health
and Otago University.
Boston, J, Callister, P, & Wolf, A (2006). The policy implications of diversity. Institute of Policy
Studies, Wellington, NZ.
Callister, P (2008). Skin colour: does it matter in New Zealand? Policy Quarterly 4(1): 18-25.
Callister, P, Didham, R & Kivi, A (2009). Who are we? The conceptualisation and expression of
ethnicity, official statistics research series 4. Available from:
http://www.statisphere.govt.nz/official-statistics-research/series/vol-4.htm
Callister, P, Didham, R, & Potter, D (2006). Measuring ethnicity in New Zealand: developing
tools for social analysis. Annual Meeting of the Population Association of America. Los Angeles.
Callister P, Didham, R & Potter, D (2007). Family ethnicity? Should we count, how should we
count and why? Paper presented at the International Conference on Social Statistics and Ethnic
Diversity: Should We count, How Should We Count and Why? Montreal 6-8 Dec 2007.
Callister, P, Didham, R, & Potter, D (2005). Ethnic intermarriage in New Zealand. Statistics New
Zealand Working Paper 5.
Census and Statistics Department, Population Census, 1936, Vol.IX-Race, Wellington, New
Zealand, 1945.
Curta, F (ed) (2005). Borders, barriers, and ethnogenesis. Brepols, Turnhout.
26Department of Statistics, (1925). Results of a census of the dominion of New Zealand taken for
the night of the 17th April, 1921, general report. Wellington: Author.
Department of Statistics, (1990). New Zealand 1990 Official Yearbook. Wellington: Author.
Ford, M & Kelly, P (2005). Conceptualizing and categorizing race and ethnicity in health services
research. Health Services Research, Oct 2005.
Goodyear, R, (2006). Life in a rural paradise: spatial inequalities within New Zealand: an urban
and rural perspective. Unpublished paper 2006.
Hamer, P (2007). Mäori in Australia, TPK and Griffiths University, 2007.
Harpending, H & Rogers, A (2000). Genetic perspectives on human origins and differentiation.
Annual Review Genomics Human Genetics 2000 1: 361-85.
Howard, DL, Sloane, PD, Zimmerman, S, et al. (2002). Distribution of African Americans in
residential care/assisted living and nursing homes: more evidence of racial disparity? American
Journal of Public Health. 2002;92(8):1272-7.
Howard, S & Didham, R (2005). Ethnic intermarriage and ethnic transference amongst the Mäori
population: implications for the measurement and definition of ethnicity. Ethnicity technical
support papers, available from:
http://www.stats.govt.nz/analytical-reports/review-measurement-ethnicity/papers.htm
Ip, M (ed) (2003). Unfolding history, evolving identity, the Chinese in New Zealand, Auckland:
AUP.
Ip, M (2003). New Zealand’s new Chinese communities: diversity and mobility. Paper presented
to the Sub ethnicity in the Chinese Diaspora Conference, University of Toronto, 12-13 Sept
2003.
Keddell, E (2007). Cultural identity and the Children, Young Persons, and Their Families Act
1989: ideology, policy and practice. Social Policy Journal of New Zealand, 32 Nov 2007, 52-53.
Lochner, K, Kawachia, I, Brennan, R & Bukac, S. (2003). Social capital and neighborhood
mortality rates in Chicago. Social Science and Medicine, Volume 56, Issue 8, April 2003, Pages
1797-1805.
Kukutai, T. (2003). The dynamics of ethnicity reporting Māori in New Zealand. A discussion
paper for Te Puni Kokiri. University of Waikato.
Kukutai, T (2008). Ethnic self-prioritisation of dual and multi-ethnic youth in New Zealand. A
discussion paper prepared for Statistics New Zealand by Tahu Kukutai (Tahatü Consulting).
Available from: http://www.stats.govt.nz/analytical-reports/review-measurement-
ethnicity/papers.htm
Kukutai, T & Didham, R (2007). Can national identity become ethnic identity? The case of the
emerging ‘New Zealander’ ethnic group. Paper prepared for the Conference on Social Statistics
& Ethnic Diversity, Montreal, Canada, 6–8 December 2007.
McKenzie, M, Gibson, J & Stillman, S (2007). Migration and mental health: evidence from a
natural experiment. World Bank Policy Research Working Paper 4138, February 2007, 20.
McKenzie, M, Gibson, J & Stillman, S (2006). How important is selection? Experimental vs non-
experimental measures of income gains from migration. IZA Discussion Paper series, April 2006.
27Phelan, J, Link, B, Diez-Roux, A, Kawachi, I, & Levin, B (2004). Fundamental causes of social
inequalities in mortality: a test of the theory. Journal of Health and Social Behavior, Vol. 45, No. 3
(Sept 2004), 265-285.
Salmond, C, & Crampton P, (2002). NZDep2001 Index of Deprivation. Department of Public
Health Wellington School of Medicine and Health Sciences. Retrieved July 2006 from:
http://www.moh.govt.nz/moh.nsf/Files/phi-research-report/$file/phi-research-report.pdf
Sporle, A & Cotterel, G (2007). Changing family wellbeing in an era of reform: different outcomes
for different ethnic groups. TASA/SAANZ conference, Auckland, 2007.
Strombergen, A, Rose, D & Nana, G (2002). Review of the statistical measurement of human
capital. Wellington: Statistics New Zealand.
Taylor, J, Haile, G, & Nguyen, A. (2005). Ethnic and gender differences in intergenerational
mobility: a study of 26 year olds in the USA. Scottish Journal of Political Economy, vol 52(4),
pp 544-564.
Taylor, G, Katz, V, & Moos, M, (1995). Racial disparity in pregnancy outcomes: analysis of black
and white teenage pregnancies. Journal of perinatology. 1995;15(6):480-3.
Te Ara: the Encyclopaedia of New Zealand. Available from http://www.teara.govt.nz/.
Voss, B (2008). The archaeology of ethnogenesis, race and sexuality in colonial San Francisco.
California: University of California Press.
Walker, L (2007). Trends in social homogamy in NZ 1981-2001. TASA/SAANZ conference,
Auckland.
Williams, JE, Massing M, Rosamond, WD, Sorlie, PD & Tyroler HA, (1999). Racial disparities in
CHD mortality from 1968–1992 in the state economic areas surrounding the ARIC study
communities. Atherosclerosis risk in communities. Annals of Epidemiology. 1999;9(8):472-80.
Luginaah et al, (2001). Health profiles of Hamilton: spatial characterisation of neighbourhoods for
health investigations. GeoJournal 53: 135-147, 2001, Netherlands, p. 135.
Statistics New Zealand, (2007). Guidelines for using ethnicity data: 2006 census. 2007 ethnicity
technical support papers. Wellington: Author. Available from: http://www.stats.govt.nz/analytical-
reports/review-measurement-ethnicity/papers.htm
Statistics New Zealand, (2007). Profile of New Zealander responses. Ethnicity technical support
papers. Wellington: Author. Available from: http://www.stats.govt.nz/analytical-reports/review-
measurement-ethnicity/papers.htm
Statistics New Zealand, (2004). Review of the measurement of ethnicity – a question of ethnicity.
Ethnicity technical support papers. Wellington. Available from http://www.stats.govt.nz/analytical-
reports/review-measurement-ethnicity/default.htm
Statistics New Zealand, (2005). Statistical standard for ethnicity 2005. Ethnicity technical
support papers. Wellington: Author. Available from http://www.stats.govt.nz/analytical-
reports/review-measurement-ethnicity/papers.htm
28You can also read