National Qualifications 2020 Awarding - Methodology Report - SQA
←
→
Page content transcription
If your browser does not render page correctly, please read the page content below
Technical Report
National Qualifications 2020 Awarding
— Methodology Report

Publication date: August 2020
Publication code: BA8262

Published by the Scottish Qualifications Authority
The Optima Building, 58 Robertson Street, Glasgow G2 8DQ
Lowden, 24 Wester Shawfair, Dalkeith, EH22 1FD

www.sqa.org.uk

The information in this publication may be reproduced in support of SQA qualifications. If it is
reproduced, SQA should be clearly acknowledged as the source. If it is to be used for any
other purpose, written permission must be obtained from SQA. It must not be reproduced for
trade or commercial purposes.

                              © Scottish Qualifications Authority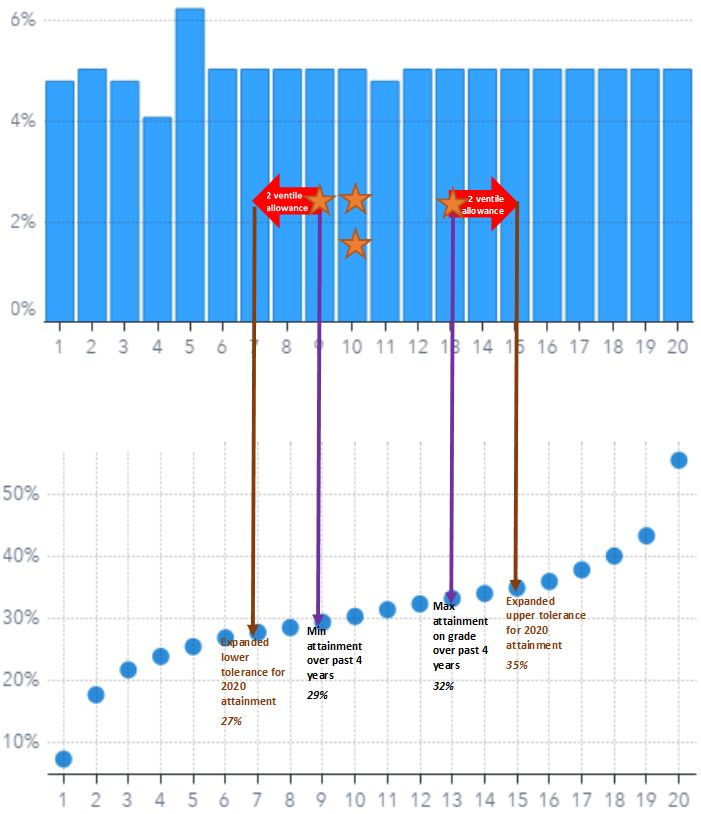
This document can be produced, on request, in alternative formats, including large type,
Braille and numerous community languages. For further details telephone SQA’s Customer
Contact Centre on 0845 279 1000.

SQA is committed to using plain English. We will try to make our publications as easy and
straightforward to understand as we can and will try to avoid all unnecessary jargon. If
there’s any language in this document that you feel is hard to understand, or could be
improved, please write to SQA at the Glasgow address or email: editor@sqa.org.uk.

Contents
1 Setting the scene                                                                      1
  Equality and fairness considerations                                                   1
2 Guiding principles                                                                     2
3 Business-as-usual approach to awarding                                                 3
  3.1    Setting grade boundaries                                                        3
         3.1.1 Historical presentation patterns across centres                           5
4 2020 decision-making data                                                              7
  4.1    Estimates                                                                        7
  4.2    Previous studies                                                                 9
  4.3    Rank ordering of candidates                                                     10
  4.4    Prior attainment                                                                10
         4.4.1 SQA data on prior attainment                                              10
         4.4.2 Non-SQA data on prior attainment                                          11
5 Consideration of technical options                                                     13
  5.1    Directly awarding centre estimates                                              13
         5.1.1 Description                                                               13
         5.1.2 Technical work undertaken                                                 13
  5.2    Multiple linear regression                                                      14
         5.2.1 Description                                                               14
         5.2.2 Technical work undertaken                                                 14
  5.3    Awarding — national moderation only                                             15
         5.3.1 Description                                                               15
         5.3.2 Technical work undertaken                                                 15
  5.4    Centre-level moderation — using previous centre outcomes                        16
         5.4.1 Description                                                               16
         5.4.2 Technical work undertaken                                                 17
  5.5    Awarding — using centre-supplied rank order                                     17
         5.5.1 Description                                                               17
         5.5.2 Technical work undertaken                                                 17
  5.6    Conclusion                                                                      18
6 SQA’s approach to moderating estimates for Awarding 2020                               19
  6.1    Support to centres in the estimation process                                    19
  6.2    Overview of 2020 entries and centre presentation                                20
  6.3    Comparison of 2020 estimates to historical attainment                           20
  6.4    Overview of the 2020 awarding approach to moderation                            22
  6.5    Detailed summary of the 2020 awarding moderation methodology                    24
  6.6    Definition of a national SPD for each course                                    24
  6.7    Defining tolerance ranges for the SPD at each grade for each course             27
  6.8    Definition of centre constraints                                                28
  6.9    Defining allowable tolerances for centre constraints to allow for variability   30
  6.10   Centres with limited or no history (on a course) over the past four years       31
  6.11   Adjusting for RNQ D grade changes when setting centre constraints               32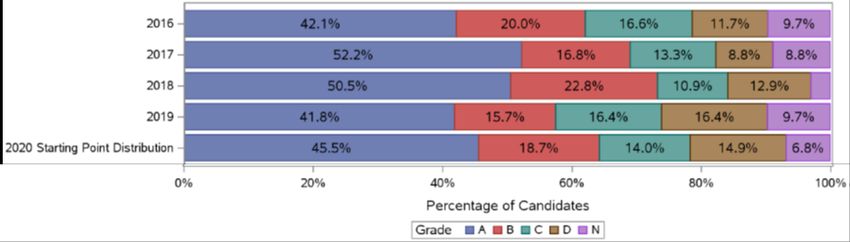
6.12   Moderation and adjustment of estimated grades per course by centre    33
  6.13   Adjustment of estimates (where necessary)                             33
  6.14   Maintaining the relativity of refined bands as estimated by centres   34
  6.15   Mathematical optimisation — the technique applied for adjustment      36
  6.16   Minimising extreme grade movements                                    36
  6.17   Treatment of small centres/courses                                    37
  6.18   Simultaneous optimisation to achieve the national SPD                 38
  6.19   Exclusion of centres with ‘no history’ from the moderation process    38
  6.20   Possible use of centre dialogue as part of the moderation process     39
  6.21   Equalities and fairness considerations                                39
7 National awarding meetings                                                   41
8 Outcomes of the moderation process                                           44
9 Final remarks                                                                45
Appendix 1: Assurance                                                          46
Appendix 2: Timeline                                                           47
1 Setting the scene
SQA considered a range of options around determining candidate entitlement to graded
National Courses in 2020 as a result of the impact of the COVID-19 public health
emergency. As a consequence of the cancellation of national examinations, announced on
19 March, an alternative certification model (ACM) has been developed and implemented to
allow SQA to award these qualifications as fairly and reliably as possible — over time,
across subjects and levels — given the current circumstances and in the absence of any
candidate performance assessment information.
Our approach is made up of four steps:
Step 1 — Estimates
Step 2 — Awarding
Step 3 — Results and certification
Step 4 — Appeals
This report describes the second step of the model, awarding.
The core element of the ACM is teacher and lecturer estimates, moderated by SQA.
Moderation is a process to ensure that the assessment outcome — the grade — is fair, valid
and reliable and to ensure consistency of teacher and lecturer assessment judgements
across centres. Centres have provided estimates based on the normal band scale of 1–9,
estimates based on a refined band scale of 1–19, and a rank order of candidates within each
refined band.
This technical report outlines the work undertaken since early March 2020 to determine
candidate entitlement to graded National Courses in 2020 as a result of the decision not to
run the diet of examinations in 2020. The work outlined in this report highlights the
challenges of relatively low-uptake qualifications at national and centre-levels, limited prior
attainment information, and the absence of assessment data based on candidate
performance in examinations and coursework. This meant that SQA was limited in adopting
a purely statistical approach to moderation. The data we have in 2020 includes estimates,
rank orders, and prior attainment data for a substantial proportion of Higher and Advanced
Highers. In addition, we have historical data, including estimates, and actual results by
subject and centre.
The outcomes of this year’s awarding process were for SQA to award grades A, B, C, D and
No Award as normal. The moderation of centre estimates is designed to ensure that the
grades awarded to candidates are as fair as possible and that national standards are
maintained.
The timeline outlined in appendix 2 provides an indication of how SQA has proactively
responded to this evolving issue including the refinement of the ACM.
Equality and fairness considerations
In parallel with establishing the overall ACM, SQA has developed an equality impact
assessment of the full end-to-end process to ensure it considered and sought to mitigate the
1potential for any aspect of the moderation approach to unfairly impact on one or more
groups of candidates with protected characteristics.
Whilst this technical report includes reference to equalities considerations related specifically
to the methodology adopted, it should also be read in conjunction with the 2020 Alternative
Certification Model — Equality Impact Assessment.
2 Guiding principles
Three guiding principles have underpinned our approach to developing and implementing
the ACM for 2020:
fairness to all learners
safe and secure certification of our qualifications, while following the latest public health
advice
maintaining the integrity and credibility of our qualifications system, ensuring that
standards are maintained over time, in the interests of learners
23 Business-as-usual approach to awarding
3.1 Setting grade boundaries
SQA has a responsibility to individual learners and to the wider community to ensure that the
standard of our qualifications is set appropriately and maintained over time and across
courses. This means that we have to make sure that the grade a candidate receives
recognises achievement against the knowledge, skills and understanding requirements of
the course. It also means that we have to make sure that it is not easier or harder to achieve
the same result across different courses.1
This is achieved through the development of course assessments based on an assessment
‘blueprint’ and consistent application of detailed ‘fit-for-purpose’ marking schemes through
quality-assured marking processes. Finally, during awarding meetings each year grade
boundaries are set following a consideration of a range of qualitative and quantitative
information, for the current year and the three previous years. The boundaries set are:
upper A (band 1), lower A (band 2) and lower C (band 6). All other grades and boundaries
are automatically calculated based on these boundaries. There is no other mechanism
currently used for setting grade boundaries. Our approach to awarding is discussed and
approved each year at SQA’s Qualifications Committee.
The combination of the above activities provides SQA with the confidence to award graded
National Courses.
SQA does not operate an explicit norm-referenced system where a fixed-proportion of
grades is awarded each year. Awarding meetings are held individually and there is no
process to shape national level performance. However, the approach does result in a
relatively stable national system as outlined in the tables below. Subject-by-subject variability
is acknowledged, for example, the results for larger uptake qualifications are more stable
over time than those for lower uptake qualifications.
Table 1: National 5 A–D distribution (2016–19)
National 5
A B C D A–D
2019 35.2% 23.8% 19.3% 12.5% 90.8%
2018 35.2% 23.0% 19.3% 12.3% 89.8%
2017 37.2% 23.8% 18.6% 6.5% 86.1%
2016 36.6% 23.7% 19.2% 6.6% 86.1%
Extended grade D scale from Diet 2018
1 A Guide to Setting Grade Boundaries
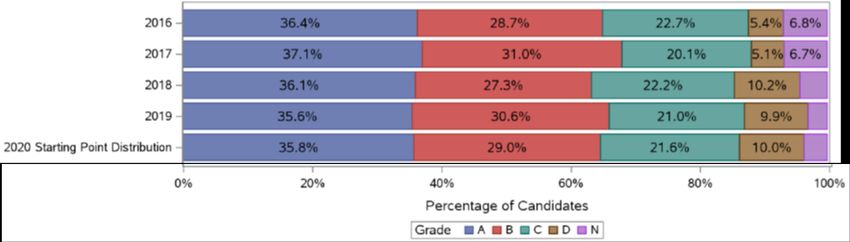
3Table 2: Higher A–D distribution (2016–19)
Higher
A B C D A–D
2019 28.5% 24.0% 22.4% 15.0% 89.9%
2018 28.7% 25.3% 23.1% 8.7% 85.8%
2017 29.0% 25.5% 22.8% 8.3% 85.6%
2016 29.5% 25.2% 22.8% 8.3% 85.8%
Extended grade D scale from Diet 2019
Table 3: Advanced Higher A–D distribution (2016–19)
Advanced Higher
A B C D A–D
2019 32.0% 24.9% 22.7% 8.3% 87.9%
2018 32.6% 25.9% 22.3% 7.9% 88.7%
2017 32.0% 25.6% 22.8% 7.9% 88.3%
2016 33.8% 25.9% 22.4% 7.4% 89.4%
Extended grade D scale from 2020
The year-on-year stability outlined in the above tables suggest that the setting of national
distributions in 2020 based on a consistent historical-based approach is possible. However,
subject-by-subject variation may need to be considered. The types of situations where a
consistent historical-based approach may not be appropriate include the following:
1 Where SQA has made a significant or material change to course assessment in that
period.
2 Where there was a significant adjustment in the period due to a non-functioning
assessment component.
3 Where there was a ‘reset’ of standard.
4 Where the actions of one centre with significant presentations in a small cohort served
to skew the decision-making or distribution.
5 Low-uptake courses.
6 New centres.
However, only making national-level adjustments to grades may advantage or disadvantage
some centres who have estimated differentially in 2020. Therefore, the first step in the
awarding process for 2020 should be an exercise to moderate centre estimates to address
differences in estimation approach, as far as possible. The last step in this year’s awarding
process should be a national awarding review of the resulting national distribution.
4National Courses
Graded National Courses (National 5, Higher and Advanced Higher) are assessed through a
combination of coursework and/or question papers as outlined in the relevant course
specification. However, in prescribed circumstances other existing processes, eg exceptional
circumstances, may overwrite these assessment requirements. There were 128 graded
National Courses in 2019, as outlined in Table 4.
Table 4: Graded National Courses (Diet 2019)
Level Number of subjects
National 5 48
Higher 46
Advanced Higher 34
3.1.1 Historical presentation patterns across centres
Entry patterns for the SQA National Course portfolio are characterised by high- and low-
uptake qualifications and new, returning or very low-uptake centres. For example, in Diet
2019 national level entry figures varied across National 5 from 87 (Urdu) to 46,626 (English),
across Higher from 62 (Gaelic) to 36,205 (English), and across Advanced Higher from
11 (Gaelic (Learners)) to 3,635 (Mathematics). Advanced Higher has very low national entry
numbers in some subject areas.
At a centre level, even for large entry subjects, entry levels can vary significantly. In 2020,
the greatest number of entries at centre level for National 5 was for Mathematics, but entry
levels ranged across centres from 1 to 337 (average 97). For Higher, the greatest number of
entries at centre level was for English, ranging across centres from 1 to 317 (average 88).
For Advanced Higher, the greatest number of entries at centre level was for Mathematics,
with a range across centres from 1 to 70 (average 11).
A significant proportion of courses have entries of 25 or less. This presents particular
challenges. In Diet 2019, there were 21,488 distinct centre/subject/level combinations
entered for National Courses (National 5, Higher and Advanced Higher). 15,588 (73%) of
these distinct centre/subject/level combinations had 25 or fewer candidates entered and
resulted. Table 5 breaks this down by level.
Table 5: Centre/subject/level combinations (Diet 2019) by level
Overall 25 or fewer candidates
National 5 9,126 5,539 (61%)
Higher 8,077 6,176 (73%)
Advanced Higher 3,924 3,873 (99%)
5In 2019 for National 5, at least half of class entry sizes were made up of 19 or fewer
candidates; for Higher, at least half of class entry sizes were made up of 14 or fewer
candidates; and for Advanced Higher, as least half of class entry sizes were made up of four
or fewer candidates. Relatively small numbers of candidates distributed across many centres
means it is challenging to make statistically significant decisions across centres and
nationally in some low-uptake subjects. This has significant implications for the use of a
purely statistical approach for centre moderation purposes for this year’s ACM.
64 2020 decision-making data
Whilst it was clear from the announcement on 19 March that examinations would not take
place, immediately after schools had closed, SQA had anticipated that coursework, a core
element of our qualifications, could be completed and marked. However, due to public health
advice it quickly became clear that was not possible. SQA announced on 24 March that
schools and colleges were not required to submit learner coursework for marking in Higher
and Advanced Higher courses. In addition, all other National 5 coursework due to be uplifted
in April and May was not submitted for marking as candidates could not complete work
safely. While considering the required arrangements, it became clear that we could no
longer proceed with the marking of the National 5 coursework in a safe and secure manner.
It was not therefore possible to include coursework data in the awarding approach.
In the absence of any data from candidate performance in examination or coursework, SQA
was required to focus on other sources of data as the basis for the awarding approach.
SQA decided to request a more granular estimate scale and rank order to support more
nuanced decision-making — in the absence of candidate marks — through the stages of the
ACM. Requests for both an extended estimate scale and rank order were made to address
two important aspects of accuracy of teacher estimation, ie absolute accuracy where the
actual grade a candidate achieves is estimated against a national standard, and the rank
order which is a relative accuracy judgement in the sense that, while it is not possible to
determine the actual grade, it is possible to rank candidates in a class relative to each other.
SQA asked for both teacher and lecturer estimates and rank orders to ensure that we had
the maximum amount of information available to inform decisions on grades for individual
candidates and the required quality assurance process.
4.1 Estimates
Use of estimates in business-as-usual awarding
This section covers the use of estimates in SQA’s business-as-usual awarding processes
and in 2020.
As a matter of course, teachers and lecturers are asked to submit estimated grades for their
candidates. Other than the skills of the estimator, the ‘accuracy’ of estimates is dependent
on three main variables:
valid evidence of performance in a centre to inform the estimate
the application of candidates in their study of the course and assessment
an understanding of the national standard
Estimates are currently used in awarding meetings as an indication of cohort ability. The
weight placed on estimates will vary from subject to subject but, to date, they have not been
a significant aspect of business-as-usual decision-making.
Accuracy of centre estimates
Centre estimates are not always accurate when compared to the grades candidates achieve
in practice. Estimating accuracy varies across centres, subjects and levels. Whilst the
7majority of candidates achieve within one band of their estimate, around one-third are
outwith this and only 45% achieve their estimated grade. As a result, some form of further
moderation of centre estimates would likely be required in 2020 to address expected under
and over-estimation.
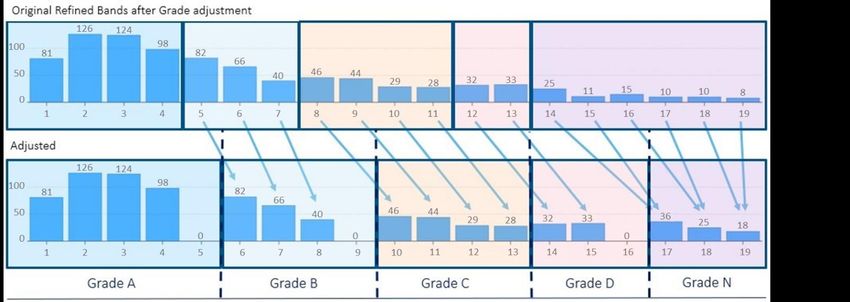
Refined band scale
In our business-as-usual approach, a nine-point band scale is used by centres for their
estimates and for purposes of SQA certification. As outlined above, a refined 19-point band
scale was introduced for the ACM in order to more closely reflect mark distributions. Each of
the business-as-usual bands has been split into two, except for lower A and D, which have
been split into three to give more granularity at the decision points for national awarding
purposes; and No Award (band 9), which has not been subdivided . This is mapped to the
nine-point band scale and is outlined in Table 6. Centres were provided with advice and
guidance to assist them in generating estimates using this refined band scale.
8Table 6: Refined band scale
Grade Band Refined band Notional % range
(BAU)
A 1 1 upper 1 93–100
A 1 1 lower 2 85–92
A 2 2 upper 3 80–84
A 2 2 middle 4 75–79
A 2 2 lower 5 70–74
B 3 3 upper 6 67–69
B 3 3 lower 7 65–66
B 4 4 upper 8 62–64
B 4 4 lower 9 60–61
C 5 5 upper 10 57–59
C 5 5 lower 11 55–56
C 6 6 upper 12 52–54
C 6 6 lower 13 50–51
D 7 7 upper 14 47–49
D 7 7 middle 15 44–46
D 7 7 lower 16 40–43
No Award 8 8 upper 17 35–39
No Award 8 8 lower 18 30–34
No Award 9 9 19 0–29
4.2 Previous studies
Studies from across the UK, for GCSE, AS level and A level, about the accuracy of teacher
estimates in comparison to actual results achieved, show similar trends to SQA’s data.2
The findings about individual variables are broadly similar: subject has a small but
unsystematic effect; sex and age have small effects that are inconsistent across subjects;
2 British Educational Research Association, Volume 31, No 1 Feb 2005, Teacher Estimates of
candidates’ grades: Curriculum 2000 Advanced Level Qualifications, Debra Dhillon, AQA, UK
9centre type has a small effect that may be attributable to correlation between centre type and
attainment. There are likely some effects on estimation accuracy of ethnicity (that is more
over-estimation for some ethnic minority groups) and disadvantage (that is more over-
estimation for the more disadvantaged in general and less over-estimation for the higher
attainers) but those effects have not been quantified.3
To help mitigate these effects on this year’s estimates, SQA has incorporated a section on
bias into its SQA Academy course on estimation for teachers and lecturers.
4.3 Rank ordering of candidates
To inform the awarding approach, centres were asked to provide a rank order for each of
their candidates within each refined band.
Baird (1997) concluded, most of the evidence suggested that centres were good at rank
ordering students.4 SQA has not used candidate rank order in assessment decision-making
for many years, but it was previously used to form part of an alternative evidence appeals
process. Rank order is still based on professional teacher/lecturer judgement but removes
the need for teachers/lecturers to make specific grading decisions. In this approach teachers
and lecturers are being asked to rank candidates on their attainment relative to other
candidates. However, there are challenges of comparable decision-making within and
across centres and if used as the only source of data this could result in candidates of
equivalent attainment in different centres gaining different grades. Centre rank orders must
therefore be linked to an estimate in any approach. For example, a centre may have 100
candidates ranked 1 to 100 but the highest ranked candidate may be estimated at grade C,
band 6 (current 1–9 scale) therefore this would have to be factored into how any historical
distribution is laid over the centre rank order. The inclusion of ‘ties’ in a rank potentially
hinders the efficacy of rank orders. We advised centres to use ties sparingly and only for
large multi-class cohorts.
4.4 Prior attainment
4.4.1 SQA data on prior attainment
SQA only holds meaningful prior attainment data at Higher and Advanced Higher. Prior
attainment data is not available at National 5 or for all candidates in Higher and Advanced
Higher due to a variety of curriculum approaches. However, it is a useful predictor of
performance where present. It is currently used as an indication of cohort ability in awarding
meetings. The extent of prior attainment (at the subject/level immediately below) in Diets
2017–19 is summarised in Tables 7 and 8.
3 Ming WEI Lee, Merlin Walter, 2020 Ofqual Research And Analysis: Equality Impact Assessment
Literature Review
4 Baird J A (1997) Teachers Estimates of A level Performance, Guilford, Internal Report RAC/763,
Associated Examining Board
10Table 7: National 5 prior attainment in Higher courses
Percentage of candidates
Year Level
No prior Prior
2017 H 23.27 76.73
2018 H 22.74 77.26
2019 H 21.94 78.06
Table 8: Higher prior attainment in Advanced Higher courses
Percentage of candidates
Year Level
No prior Prior
2017 AH 2.18 97.82
2018 AH 2.07 97.93
2019 AH 2.11 97.89
There are variations in prior attainment by subject area. Prior attainment volumes are higher
for higher-uptake subjects. In some National Courses at Higher, it can be as low as 5%, for
example, Classical Studies. However, prior attainment — where available — provides a
general indication of cohort ability within a National Course at a national level and an
additional measure in any centre moderation activity.
4.4.2 Non-SQA data on prior attainment
The approaches to awarding that are likely to be used in other parts of the UK in the summer
of 2020 are heavily based and dependent on data on the prior attainment of candidates who
would have sat examinations this year. A major source of this data are the Key Stage 2
National Curriculum tests which have, as one of their main purposes, to produce a measure
of cohort ability that can be used to inform setting of grade boundaries for general
qualifications.
Whilst SQA has prior attainment data for candidates at Higher and Advanced Higher who
have previously sat qualifications at lower levels, we do not have a source of prior attainment
data that could be used to inform awarding decisions at National 5.
The closest comparable assessment information is the Scottish National Standardised
Assessments (SNSA), introduced in 2017. These assessments, in Literacy and Numeracy,
are completed by learners in P1, P4, P7 and S3. Their primary purpose is ‘…to help identify
children’s progress, providing diagnostic information to support teachers’ professional
11judgement’.5 This purpose means that SNSA assessments are not delivered at a fixed point
in the school year.
The primary purpose of SNSA and the way it is administered means that it does not provide
a useable source of prior attainment data for SQA as part of its alternative certification model
for 2020. Teacher professional judgement (ACEL) will be used to inform the journey of
learners from broad general education into the senior phase and will take into account a
wide range of other evidence including SNSA.
5 https://standardisedassessment.gov.scot/
125 Consideration of technical options
SQA considered and evaluated several technical options for the awarding model. These are
outlined below in the following order:
directly awarding centre estimates
multiple linear regression
awarding — national moderation only
centre-level moderation — using previous centre outcomes
awarding — using centre-supplied rank order
5.1 Directly awarding centre estimates
5.1.1 Description
SQA would directly award the estimates submitted by centres so that all candidates would
be resulted with their band 1–9 estimate. No moderation of the estimates to address any
over- or under-estimation would be undertaken.
5.1.2 Technical work undertaken
SQA reviewed estimated and resulted grades from Diet 2019. For estimates with a
completion status of ‘C’, (ie where the candidate for whom the estimate was submitted had
completed the examination and any coursework) 48% of grades estimated at National 5
matched resulted grades; at Higher 44%; and at Advanced Higher 43%. Estimate accuracy
varied by grade with greater grade accuracy seen at grade A compared to other grades. Any
comparison of estimates with results needs to be undertaken at candidate rather than at
course level. At course level this type of comparison may suggest a strong correlation whilst
at candidate level this is rarely the case. The comparisons in this section are made at
candidate level.
Nationally, if estimates had been awarded directly in Diet 2019, overall the national A–C
rates would have been very similar to the national A–C rates resulted for National 5 and
Higher, but the national grade A rates would have been much lower. This is because whilst
grade A estimates were on the whole more accurate, generally lower numbers of grade As
were estimated than resulted in Diet 2019.
However, we know that this averages out learners who achieved more than their estimate
and others who achieved less than their estimate, so candidate estimates are not always
reliable.
13Table 9: Estimates and published results in 2019
National 5: A A–B A–C A–D NA
Estimates 27.8% 51.8% 78.6% 90.8% 9.2%
Published results 35.1% 58.9% 78.2% 90.7% 9.3%
Higher: A A–B A–C A–D NA
Estimates 23.8% 48.6% 77.0% 89.6% 10.4%
Published results 28.3% 52.3% 74.8% 89.9% 10.1%
Advanced A A–B A–C A–D NA
Higher:
Estimates 27.0% 56.1% 84.0% 92.7% 7.3%
Published results 31.8% 56.7% 79.4% 87.8% 12.2%
Note: Estimates percentages and published result percentages have been calculated on
different groups of candidates, as some candidates do not have an estimate and result.
The use of teacher estimates with no moderation was not progressed as a way forward, as
this would not address any potential over- and under-estimation. As a result, this would not
maintain national standards across centres or be fair to candidates.
5.2 Multiple linear regression
5.2.1 Description
Multiple linear regression is a statistical technique that uses several explanatory variables to
predict the outcome of another variable of interest. To explore its potential for awarding, a
model was developed and tested using three variables: estimates, coursework marks and
candidate prior attainment where this was available, to predict an overall course ‘mark’ for
each candidate. These three variables are currently used in awarding meeting decision-
making.
5.2.2 Technical work undertaken
The model used Diet 2019 data for five National 5 and Higher subjects: English,
Mathematics, Chemistry, Physical Education and History. These were selected to cover a
small number of different subject/assessment types. Preliminary statistical modelling
indicated that, should all the data for the variables be available, they could not reliably
predict candidate performance in the previous diet for subjects/levels with high entry
numbers.
In all cases, at least 40% of predicted grades did not match actual grade outcomes in Diet
2019 which does not provide a robust basis for awarding. As coursework marks will not be
14available in 2020 and, with prior attainment information varying from subject/level to
subject/level, the use of a predictive modelling approach was not progressed further. This
option would not maintain standards across centres and would not be fair to candidates.
A further limitation of multiple linear regression is that it cannot account for systematic over-
or under-estimation and/or bias at a centre level.
5.3 Awarding — national moderation only
5.3.1 Description
Under this approach for each National Course a national target grade and/or band
distribution would be established based on agreed criteria. Centre estimates would be fitted
to this distribution, with all estimates of the same category receiving the same result. For
example, the Higher Mathematics distribution is set as grade A: 30%, grade B: 20%, etc.
Starting with the first band, entire bands would be added to the ‘A’ category until the national
subject/level distribution ‘A’ percentage set was achieved or exceeded. This would be an
entirely automated process with no moderation at centre level.
5.3.2 Technical work undertaken
This option was assessed based on the original estimate scale (1–9), rather than on the
refined band scale used for 2020, using Diet 2019 data and with target distributions set to
actual result distributions awarded as per August 2019 certification. The process assumed a
‘target’ distribution (here, set to be the Diet 2019 observed attainment distribution) and
allocated each band in turn starting from the best band (band 1) to the grade A result until
the target grade A rate was exceeded. At this point, allocations of a number of bands had
been made to result grade A. The next available band is then allocated to result grade B,
and this process continues until the A–B cumulative ‘target’ distribution is exceeded. The
next available band is then added to result grade C, and this process continues until the
cumulative A–C ‘target’ distribution is exceeded. The allocations could be automated
(coded), and in this case always exceeded the target distributions.
The outcomes of investigating this option indicated that the original estimate scale was not
sufficiently granular to allow it to work effectively. This reflects the fact that SQA uses nine
estimate bands, one of which (band 1) contains the perceived strongest learners estimated
to be in the 85%+ category, and two bands (8,9) that indicate ‘No Award’ performance. This
leaves only bands 2, 3, 4, 5, 6, 7 to allocate to result outcomes (A, B, C, D).
Due to every estimated band being treated in the same way and the cumulative distribution
required to be the same or exceeded with the approach used, the result was national
subject/level distributions that were far from the target distributions in some cases. Table 10
illustrates the end result of a national moderation approach applied to Diet 2019 data for
selected courses.
15Table 10: Change in Higher grade distribution
Percentage point change in grade distribution
Subject Entries Estimates A B C A–C D No
Award
Chemistry 10,047 10,064 6.69 -1.26 5.84 11.27 -9.16 -2.11
English 35,461 35,408 5.85 1.39 -5.66 1.58 2.55 -4.12
History 9,987 9,989 8.13 0.52 -3.71 4.95 -1.01 -3.94
Mathematics 18,626 18,742 1.74 9.87 -4.07 7.54 -4.85 -2.69
Modern 8,653 8,688 5.68 0.8 -3.38 3.08 -1.69 -1.39
Studies
Physical 9,896 9,931 2.86 0.59 3.79 7.24 -6.75 -0.49
Education
The above demonstrates the use and limitations of the current estimate scale. Note that the
grade A and A–C rates are always higher here due to using the rule ‘add more estimate
bands until the cumulative distribution is exceeded’. It would also be possible, using absolute
values, to choose the allocation that led to allocations that were closest to the target
thresholds.
A further limitation of national moderation only is that it cannot account for systematic over-
or under-estimation and/or bias at a centre level. This option was not progressed further, as
it would not maintain standards across centres and would not be fair to candidates.
5.4 Centre-level moderation — using previous centre outcomes
5.4.1 Description
The first stage of this approach is the same as that for Awarding — National Moderation
Only outlined above. For each National Course, a national target grade and/or band
distribution would be set based on agreed criteria. Centre estimates would be fitted to this
distribution, with all estimates of the same category receiving the same result. For example,
the Higher Mathematics distribution is set as grade A: 30%, grade B: 20%, etc. Starting with
the first band, entire bands are added to grade A until the national subject/level distribution
grade A percentage set is achieved or exceeded. At the end of this phase, all estimates of
the same value would have the same result.
A second phase would then attempt to address centre outcomes that appear very different
based on historic centre-level performance measure(s). These measures could include year-
on-year percentage point changes in resulted grade A rate and A–C rate, year-on-year
differences in average Insight tariff scores.
165.4.2 Technical work undertaken
This model has also been evaluated using data from Diet 2019. Estimates on the current
nine-band scale were fitted to the starting target distribution of the actual national level grade
distribution for 2019 based on national awarding. At a centre/subject/level, the data that SQA
holds historically allows the calculation of a number of summary values and measures,
which provide an indication of the relative strength of qualification attainment in previous
sessions.
Options for flagging results for moderation include:
ranking centres by difference from a three-year historic average (eg difference in resulted
grade A rate and A–C rate)
ranking centres by difference in their average resulted Insight tariff score from a previous
year/ three-year historic average
flagging centres with resulted A–C and/or grade A rates that are outwith historic
minimum or maximum ranges
If SQA determined measures to calculate in advance and how to prioritise these, centres
could be flagged using these measures. The measures themselves would not indicate how
to proceed or address any under- or over-estimation; decision rules would need to be
developed for this purpose.
For some of the centres with large entries, it may have been possible to calculate a chi-
squared statistic (or some goodness-of-fit measure) to assess whether the outcome
distribution is significantly different from the three-year historic average distribution above for
each centre. However, the level of entries and expected frequencies of each result category
required for this approach would be very limited based on the prevalence of low-uptake
course/centres combinations that characterises SQA’s National Courses. Even in the
uncommon cases where sufficient data was available, lack of fit does not then give any
information on appropriate and acceptable ways to adjust the estimates.
In addition to the large number of low-uptake courses across many centres, the large
number of centre/course combinations and the absence of historic data for some
centre/course combinations are challenges for the implementation of this approach. This
option was not progressed further in this form.
5.5 Awarding — using centre-supplied rank order
5.5.1 Description
Using this approach for each National Course in each centre a distribution is applied.
Candidates are allocated to grades from rank 1 to the final ranked candidate.
5.5.2 Technical work undertaken
2020 is the first time for a number of years that rank order information has been collected.
As a result, we did not have real centre rank order data to work on in advance of its receipt.
Findings from modelling indicated that rank orders may be useful in allowing lower level of
refinement in the allocation of results to learners, but doing this in a systematic way that is
able to reflect genuine changes to cohort strengths within a centre leads to the same
17problem that it depends on knowledge of what the expected centre outcomes for that
qualification should be, ie this shares all the same challenges of the centre-level moderation
approaches.
Essentially, if a centre-level expected distribution of attainment could be reliably arrived at,
rank order would be potentially useful in the allocation to that distribution. However, as
outlined in previous sections, low-uptake qualifications and/or centres complicates this
approach. Nevertheless, rank orders may be useful in centre moderation approaches.
Using rank orders would allow for more granular decision-making, could facilitate differential
adjustments across the grade distribution at centre level and would preserve centre rank
orders. However, rank orders cannot be compared across centres because they are a
judgement made by a teacher/lecturer about the relative performance of candidates in their
centre. Consequently, this option was not progressed further in this form.
5.6 Conclusion
The technical models considered do not offer a simple solution for SQA. In principle, national
moderation is attractive as it will ensure some consistency with results from previous years,
thus helping to maintain national standards over time. However, this cannot be done without
first carrying out centre-level moderation to ensure consistency of standards across centres,
credibility of qualifications, and fairness to all candidates across Scotland. The initial
modelling work used a range of different approaches, none of which on their own could be
utilised for awarding 2020. However, what we learned from our analysis of these options
assisted SQA in developing and trialling a suitable approach to awarding for 2020 that made
best use of SQA’s historical attainment data and the estimates and rank orders supplied by
centres this year.
186 SQA’s approach to moderating estimates for
Awarding 2020
As outlined in section 5, the starting input into the awarding process was the estimates
received from centres and their associated rank orders. However, as already outlined,
published research and SQA’s own historic analyses show that estimates are not always
accurate. Accordingly, in the context of the ACM, a process for moderating the estimates
was necessary.
This section details the approach to moderation applied in the awarding step of the ACM,
and covers the following:
It provides context for the 2020 moderation process by comparing the estimates received
from centres to historical attainment.
It sets out the awarding moderation methodology, which incorporates both centre-level
moderation and a national-level plausibility check of moderation outcomes per course.
6.1 Support to centres in the estimation process
To support each centre in determining fair and accurate estimates and rankings in 2020,
SQA provided centres with the following:
Historical data on the centre’s previous three years’ estimates and attainment, so that at
a departmental level, teachers and lecturers could understand if they had been accurate,
lenient or severe in the past by comparing estimates with achieved results, and at centre
level managers had information on which to base their review prior to sign off.
An online course and published guidance: Information for Centres — Producing
Estimates Session 2019–20, on best-practice estimating processes. The course included
links to further resources such as course documents and SQA Understanding Standards
material that illustrated grade-related standards. In this information provided, we asked
centres to quality assure their estimates at both departmental and whole-centre level.
The SQA Academy online course also included a section on implicit bias and made explicit
reference to a range of characteristics including sex and socio-economic status. In that
section, centres are advised that candidate evidence should be valued for its own worth and
merit as an indicator of course attainment, and that a conscious effort should be made to
consider and avoid the negative impact of potential implicit bias.
In using these estimates as the basis for awarding SQA, needed to take account of the
possibility that centres’ estimation behaviour may be changed this year as a result of the
additional data on the reliability of their previous estimates and the guidance on estimating
provided by SQA this year.
Equality and fairness considerations — Estimates and rank orders
SQA was very clear from the start of the estimating process that estimates should be
generated by centres with due regard for equalities. This was to reduce the likelihood of bias
in estimates at the earliest stage of the process, prior to any moderation process by SQA.
19As noted above, to support centres in this respect, SQA provided clear guidance on the
need to avoid bias in the estimating process, supported by training materials made available
via SQA Academy.
The estimating stage was the only stage prior to certification day where deliberate and
explicit consideration of individual candidates occurred. All processes and stages described
hereafter in this report refer to the application of standardised principles and rules to
pseudonymised data at refined band and centre level. This is an important aspect of
ensuring fairness for all centres and candidates.
6.2 Overview of 2020 entries and centre presentation
Estimates were received for 21,382 distinct centre/course combinations entered for National
Courses (National 5, Higher and Advanced Higher). 15,370 (72%) of these distinct
centre/course combinations presented 25 or fewer candidates. Table 11 breaks this down by
level.
Table 11: Centre/course combinations (2020) by level
Overall 25 or fewer
candidates
National 5 9,251 5,520 (60%)
Higher 8,364 6,146 (73%)
Advanced Higher 3,767 3,704 (98%)
Total 21,382 15,370 (72%)
6.3 Comparison of 2020 estimates to historical attainment
After receiving the centre estimates on 29 May 2020, SQA undertook analyses to assess
their alignment with known historical national attainment for years 2016 to 2019.
As attainment by grade at a National Qualification level has tended to be relatively stable
over the past four years, the analyses sought to assess whether the 2020 estimates
matched, in broad terms. those stable trends.
The tables on the next page compare the distribution of estimated grades and A–C rate, to
attained grade distribution and A–C rate for each of the years 2016 to 2019. For additional
contextualisation, the percentage point change relative to 2019 is also provided.
20Table 12: Comparison of 2020 estimates to historical attainment for National 5
National 5
No
A B C A to C D Award
2016 Attainment results 36.5% 23.7% 19.2% 79.4% 6.7% 14.0%
2017 Attainment results 37.1% 23.8% 18.6% 79.5% 6.5% 14.0%
2018 Attainment results 35.1% 23.1% 19.3% 77.4% 12.4% 10.2%
2019 Attainment results 35.1% 23.8% 19.2% 78.2% 12.5% 9.3%
2020 Estimates 41.6% 24.6% 22.4% 88.6% 7.3% 4.1%
Change from 2019 +6.5 +0.8 +3.1 +10.4 -5.2 -5.2
Table 13: Comparison of 2020 estimates to historical attainment for Higher
Higher
No
A B C A to C D Award
2016 Attainment results 29.2% 25.2% 22.8% 77.2% 8.5% 14.3%
2017 Attainment results 28.7% 25.5% 22.8% 77.0% 8.4% 14.5%
2018 Attainment results 28.4% 25.3% 23.0% 76.8% 8.8% 14.4%
2019 Attainment results 28.3% 24.1% 22.4% 74.8% 15.2% 10.1%
2020 Estimates 39.3% 26.9% 22.6% 88.8% 7.2% 4.1%
Change from 2019 +11.0 +2.9 +0.1 +14.0 -8.0 -6.0
Table 14: Comparison of 2020 estimates to historical attainment for Advanced Higher
Advanced Higher
No
A B C A to C D Award
2016 Attainment results 33.5% 25.8% 22.4% 81.7% 7.5% 10.8%
2017 Attainment results 31.7% 25.5% 22.8% 80.0% 8.1% 11.9%
2018 Attainment results 32.3% 25.9% 22.3% 80.5% 8.0% 11.5%
2019 Attainment results 31.8% 24.9% 22.7% 79.4% 8.4% 12.2%
2020 Estimates 45.2% 28.4% 19.2% 92.8% 4.8% 2.4%
Change from 2019 +13.4 +3.5 -3.5 +13.4 -3.5 -9.8
21These tables show that estimated A to C attainment rates were 10.4 percentage points
higher at National 5, 14.0 percentage points higher at Higher and 13.4 percentage points
higher at Advanced Higher since 2019. The table also highlights that estimation at grade A
contributed most to the significantly higher estimated A–C rate, particularly at Higher and
Advanced Higher.
There may be several reasons why estimates were above historic attainment, which has
been relatively stable over time. Some teachers and lecturers may have been optimistic,
given the circumstances of this year, or may have believed, correctly or incorrectly, that this
cohort of candidates may have achieved better grades due to a range of factors. It is not
possible to draw definitive conclusions.
However, as the national awarding body, with responsibility for maintaining the integrity and
credibility of our qualifications system, and ensuring that standards are maintained over time,
the estimates highlight a clear case for moderation this year. Further, the difference between
estimates and historic attainment was significant in most subjects. Overall, there was
significant, but not uniform, variation between historic attainment and 2020 estimates across
subjects, levels and centres.
6.4 Overview of the 2020 awarding approach to moderation
Details of the awarding moderation methodology are provided in subsequent sections of this
report. This section prefaces the detailed description of the methodology by providing a brief
and high-level summary of the moderation approach and setting out the basis on which it
was adopted for awarding.
Fundamentally, moderation was undertaken at centre level, where a centre’s 2020 estimated
attainment level for each grade on a course was assessed against that centre’s historical
attainment for that grade on that course — with additional tolerances to allow for year-on-
year variability in a centre’s attainment.
In addition, at a national level, an assessment was undertaken for each course, to ensure
that cumulatively across all centres, the national attainment level for each grade for that
course matched historical attainment levels for that grade on that course — again with
additional tolerances added to allow for variability in national attainment on a course.
Rationale for adopting this moderation approach
The key reasons for adopting this moderation approach are outlined below:
(i) Fundamentally, a centre’s estimates are assessed against that centre’s own
historic attainment with allowance for variability: A centre’s historic attainment on
a grade per course provides a justifiable basis for assessing that centre’s 2020
estimates for the same grade on that course. This is more justifiable, for example, than
assessing the centre’s estimates against a nationally derived comparator.
22(ii) The approach allows for variability in attainment relative to historic attainment
through an expanded tolerance range for attainment at each grade: It does not
restrict a centre’s 2020 attainment to its minimum and maximum historic attainment.
The tolerable attainment ranges used in the moderation process are deliberately wider,
to allow for variability on historic attainment.
(iii) The assessment is undertaken at each grade for each course, which provides a
level of granularity: Theoretically, a centre’s estimates could have been assessed on
a whole-centre basis, eg total estimated attainment for each grade at the centre
compared to historical total attainment for the same grade. However, such an
approach would have ignored the potential for variable attainment by course at a
centre.
The adopted approach assesses estimates from a centre by both course and grade,
and thus considers and reflects historic centre attainment, with tolerances, by course
and grade.
(iv) Estimates are only adjusted where necessary and only by the minimum amount
needed to bring attainment within the tolerable ranges for that grade: Where a
centre’s estimated 2020 attainment for a grade on a course differs materially, ie
outwith the tolerable ranges including the allowances for variability on historic
attainment, the estimates will be adjusted. Notably however, the adjustment process
will seek to move the minimum number of entries necessary to bring the grades within
the allowable tolerance. It will not for example, seek to meet a pre-defined mid-point or
minimum-point. This reflects, amongst other things, our approach of trusting teacher
estimates and only adjusting where necessary.
(v) The inclusion of a process to ensure that national standards for the course are
maintained: In addition to centre moderation to ensure consistency with that centre’s
historic attainment, this approach also ensures that the cumulative moderated
outcomes across centres for a course are within pre-defined national tolerances. This
was achieved through use of starting point distributions (SPDs), which are described in
detail in section 6.6 below.
The main purpose of the SPDs was to ensure that the cumulative result of centre
moderation was broadly consistent with historic attainment by grade for each course,
nationally.
236.5 Detailed summary of the 2020 awarding moderation methodology
The process map below graphically summarises the awarding moderation approach. Each
step in the process is described in detail in the subsequent sub-sections.
Figure 1: Summary of the moderation approach
Estimates
(from centres)
Centre-level constraints
National Starting Point for all grades and A-C,
Distributions (SPDs) based on historic
performance
Moderation and Adjustment (based on application of
Mathematical Optimisation techniques)
Centres with no
history on the
given course
Checks of outputs by SQA to
ensure that model outcomes
are in line with principles
Awarding meetings to confirm
moderated outcomes
Final Awarded Grades
6.6 Definition of a national SPD for each course
To ensure that SQA’s guiding principles were met, particularly Principle 3: Maintaining the
integrity and credibility of our qualifications system, ensuring that standards are maintained
over time, in the interests of learners, it was necessary to create a frame of reference
against which both the estimates and the outcomes of the moderation process could be
assessed.
Although the moderation was undertaken at centre level, a reference was also needed for
each National Course, to ensure that the cumulative outcome of the centre moderation
process by grade was broadly consistent with national historic attainment for that grade on
that course.
Nationally, this frame of reference was provided by an SPD for each course. In simple terms,
an SPD provides a projection of what a reasonable attainment distribution by grade for each
course should be for 2020 based on quantitative and qualitative analyses of historic
attainment and trends for the course and, where it was available, candidate prior attainment.
24SPDs were first derived through a quantitative process that sought to take the average of as
many recent comparable years of attainment data as was available for the course. In
particular, the derivation was based — where possible, on historic attainment data that
captured the introduction of revised National Qualifications (RNQ) changes that widened the
D grade from a notional 45–49% to a notional 40–49%.
Table 15 below summarises the approach taken for each level.
Table 15: Summary approach for deriving SPDs for each level
National 5 The SPDs for National 5 were derived by taking the mean of the
proportional national attainment levels for each grade in years 2018 and
2019 for the given course.
Higher The SPDs for Higher were based on the proportional national attainment
level for each grade in 2019 with some adjustment (described below).
As 2020 reflects only the second year of the D grade extension for Higher, it
was recognised that centres and learners could still be adjusting to the D
grade extension.
To reflect this, we drew on the changes observed for National 5 in the
second year of the D grade extension at that level for the same subject.
Specifically, the percentage change seen between the first and second year
of the D band extension for National 5, was assumed and applied to the
2019 attainment for Higher in order to project 2020 attainment.
Advanced 2020 is the first year for which grade D has been extended for Advanced
Higher Higher courses.
Whilst the SPDs for Advanced Higher were fundamentally based on 2019
attainment therefore, an adjustment was made to reflect the D grade
extension in 2020.
The adjustment was based on the application of the average change seen
in attainment levels observed in the first year of the D grade extension at
National 5 (2017–18) and the first year of it being implemented for Higher
(2018–19).
This initial SPD was supplemented by a qualitative review by key SQA subject expert staff
and appointees including Qualifications Development heads of service, qualifications
managers and principal assessors. In some cases, this review resulted in adjustment to the
initial quantitively-derived SPD based on insight provided or trends highlighted by these
subject experts. In addition, for Higher and Advanced Higher courses where SQA held prior
attainment data for candidates on the equivalent course at the lower level (National 5 and
Higher respectively), distributions were generated using SQA’s progression matrices for live
entries. These distributions provided an additional sense check for Higher and Advanced
Higher SPDs, and for the vast majority of courses were remarkably similar to the SPDs
generated using historical data.
For example, course content and associated guidance might have been enhanced such that
teachers and candidates better understood assessment requirements relative to previous
25years. Accordingly, the subject experts might advise that a slightly different national
distribution would be expected for 2020, relative to previous years.
To further illustrate what an SPD is, the charts below show SPDs for National 5 English and
National 5 Gaelic (Learners). The former is a high uptake course with reasonably stable
year-on-year attainment; whilst the latter is comparably low-uptake and has more variable
year-on-year attainment. (For contextualisation, the historic attainment by grade over the
past four years is also shown for each course.)
Figure 2: 2020 SPD for National 5 English — alongside historic attainment for years
2016 to 2019
Figure 3: 2020 SPD for National 5 Gaelic (Learners) — alongside historic attainment
for years 2016 to 2019
As can be seen, the SPD for National 5 English mirrors the recent trends in attainment for
this course for grades A, B and C. Furthermore, the impact of the D grade extension as
projected for 2020 is visible in the SPD, relative to 2016 and 2017.
Whilst attainment for National 5 Gaelic (Learners) is more variable, it can also be observed
that the SPD seeks to provide a representative view of what has been attained in previous
years. However, the tolerance range around the SPD — discussed in section 6.7 below, is
more meaningful for these low-uptake courses. Therefore, for each grade, the tolerance
range, rather than the absolute proportional attainment shown in Figure 3 above, is what
would have been used in the moderation process.
266.7 Defining tolerance ranges for the SPD at each grade for each
course
As seen earlier with National 5 Gaelic (Learners), there can be year-on-year variability in
national attainment levels for each grade. If moderation was undertaken using only the
absolute SPD proportions for each grade, for example those SPD proportions shown in
Figures 2 and 3 above, the possibility for year-on-year variation in attainment as typically
seen for many courses historically, would have been precluded for 2020.
To allow for some variability in moderation outcomes at a national level therefore, tolerances
are added to the SPD proportion for each grade for a course, to widen the range of allowable
national outcomes around the SPD.
The tolerances are derived from the 90% confidence intervals for mean attainment levels for
each grade over the four years 2016 to 2019, adjusted for RNQ changes where appropriate.
Taking the SPDs for National 5 English and National 5 Gaelic (Learners) shown above for
example, the tolerable ranges of allowable outcomes per grade for each of these courses,
are shown below. Note that a tolerance for total A–C rate was also used.
Figure 4: Tolerances for SPDs for National 5 English
27You can also read