Ensemble projection of the sea level rise impact on storm surge and inundation at the coast of Bangladesh
←
→
Page content transcription
If your browser does not render page correctly, please read the page content below
Nat. Hazards Earth Syst. Sci., 18, 351–364, 2018
https://doi.org/10.5194/nhess-18-351-2018
© Author(s) 2018. This work is distributed under
the Creative Commons Attribution 4.0 License.

Ensemble projection of the sea level rise impact on storm surge
and inundation at the coast of Bangladesh
Mansur Ali Jisan, Shaowu Bao, and Leonard J. Pietrafesa
Department of Coastal and Marine Systems Science, Coastal Carolina University, Conway, South Carolina, USA

Correspondence: Mansur Ali Jisan (mjisan@g.coastal.edu)

Received: 16 June 2017 – Discussion started: 17 July 2017
Revised: 4 December 2017 – Accepted: 10 December 2017 – Published: 24 January 2018

Abstract. The hydrodynamic model Delft3D is used to study         whereas for present-day SLR simulations it was found within
the impact of sea level rise (SLR) on storm surge and in-         the range of 1000–1250 km2
undation in the coastal region of Bangladesh. To study the           These results revealed that even if the future TCs remain at
present-day inundation scenario, the tracks of two known          the same strength as at present, the projected changes in SLR
tropical cyclones (TC) were used: Aila (Category 1; 2009)         will generate more severe threats in terms of surge height and
and Sidr (Category 5; 2007). Model results were validated         the extent of the inundated area.
with the available observations. Future inundation scenarios
were generated by using the strength of TC Sidr, TC Aila and
an ensemble of historical TC tracks but incorporating the ef-
fect of SLR.                                                      1   Introduction
   Since future change in storm surge inundation under SLR
impact is a probabilistic incident, a probable range of future    In addition to routine inundation from upstream river water
change in the inundated area was calculated by taking into        and the downstream tides, the coastal part of Bangladesh is
consideration the uncertainties associated with TC tracks, in-    frequently flooded by storm surges induced by tropical cy-
tensities and landfall timing.                                    clones (TCs). Typically, TC-induced storm surges in this area
   The model outputs showed that the inundated area for           initiate in the central or southern part of the Bay of Ben-
TC Sidr, which was calculated as 1860 km2 , would become          gal or near the Andaman Sea. TCs normally occur during
31 % larger than the present-day scenario if a SLR of 0.26 m      April–May, the pre-monsoon period, and again from October
occurred during the mid-21st-century climate scenario. Sim-       to November, the post-monsoon period. Harris (1963) men-
ilarly to that, an increasing trend was found for the end-21st-   tioned that five basic processes (i.e. pressure, direct wind,
century climate scenario. It was found that with a SLR of         earth’s rotation, waves and rainfall effects) cause the water
0.54 m, the inundated area would become 53 % larger than          level rise under storm conditions. Pietrafesa et al. (1986) also
the present-day case.                                             pointed out that high water at the mouths of coastal estuar-
   Along with the inundation area, the impact of SLR was ex-      ies, bays, and rivers can block discharges of upstream wa-
amined for changes in future storm surge level. A significant     ters and contribute to upstream flooding, a non-local effect.
increase of 14 % was found in storm surge level for the case      Among these processes, storm surges form primarily due to
of TC Sidr at Barisal station if a SLR of 0.26 m occurred in      the TC wind stresses mechanically driving the surface fric-
the mid-21st century. Similarly to that, an increase of 29 %      tional layer onshore. Assuming an idealized balance between
was found at storm surge level with a SLR of 0.54 m in this       pressure gradient force and surface wind stress with assumed
location for the end-21st-century climate scenario.               small bottom stress, the surge related to TC wind stress can
   Ensemble projections based on uncertainties of future TC       be expressed as 1η = τgρhwL
                                                                                              , where L is the fetch of the wind
events also showed that, for a change of 0.54 m in SLR, the       (the distance over which the wind blows), τw is the wind
inundated area would range between 3500 and 3750 km2 ,            stress due to the friction between the moving air and water
                                                                  surface, g is the gravity, ρ is the density of water, h is the

Published by Copernicus Publications on behalf of the European Geosciences Union.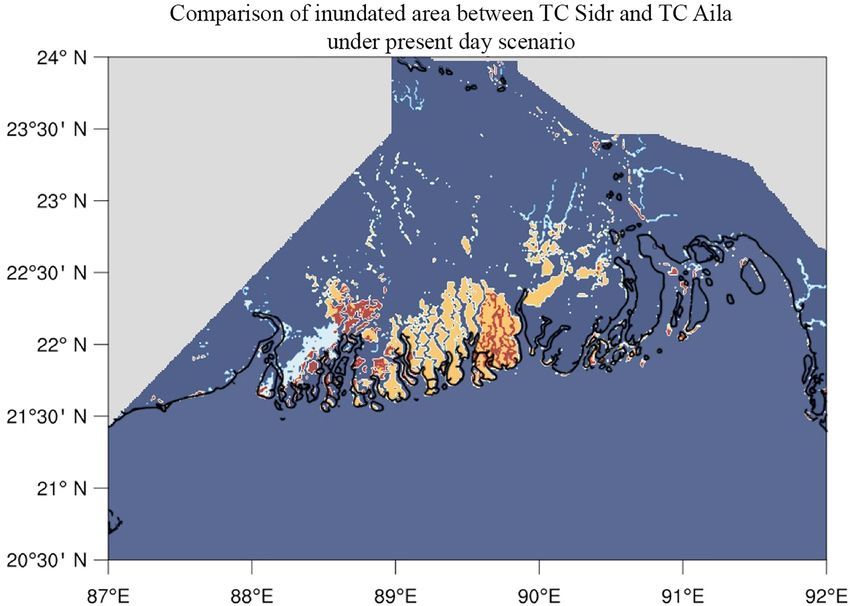
352                                       M. A. Jisan et al.: Ensemble projection of the sea level rise impact on storm surge

depth near the coast (Hearn, 2008). Also, as a secondary pro-           Previous studies have analysed the likely impact of cli-
cess, due to the differences in pressure level, the water level      mate change, especially SLR, on storm surge and inunda-
rises in the areas of low atmospheric pressure and falls in the      tion in this region. Using hydrodynamic models, Ali (1996)
areas of high atmospheric pressure, which is how the rising          showed that with increases of 1.0 and 1.5 m of SLR (10 and
water level offsets the low atmospheric pressure to keep the         15.5 %), the entirety of Bangladesh would get flooded under
total pressure constant (Harris, 1963).                              the strength of future TCs. Karim and Mimura (2008) used a
   According to Murty et al. (1986), the surge amplifies as          1-D hydrodynamic model to study inundation under several
it approaches the coast due to the shallow continental shelf         scenarios of climate and for the case of future TCs by chang-
of the Bay of Bengal and hence it causes massive flood-              ing sea surface temperature, SLR, wind speed and sea level
ing in the low-lying coastal areas. A large percentage of the        pressure. Based on their results, Karim and Mimura (2008)
Bangladeshi population resides in the low-lying coastal re-          concluded that with an increase of 2 ◦ C in SST and 0.3 m
gions of the country. Most of the areas near the coastal zone        of SLR, the flood risk area would be 15.3 % more than the
of Bangladesh have been formed by the process of riverine            present-day risk area and the depth of flooding would in-
sedimentation and because of that the low-lying areas are rel-       crease by as much as 22.7 % within 20 km from the coastline.
atively flat and as such are susceptible to flooding even under      Both Ali (1996) and Karim and Mimura (2008) considered
normal astronomical tide conditions. Furthermore, the trian-         SST rise and the future strength of TCs when simulating the
gular shape of the Bay of Bengal region makes storm surges           future storm surge and inundation.
more distressing, as a funnelling effect occurs. The geomor-            However, the impacts of climate change on the frequency
phological characteristics of the region have made the locales       and intensity of TCs are still debatable (Knutson et al., 2010).
prone to major TC events, events which have occurred mul-            The projection of the TC characteristics in the Bay of Ben-
tiple times in the past, directly causing loss to lives, property,   gal region is unclear as well. To improve these uncertain-
livelihoods and the economy of the country (Haque, 1997).            ties, a reasonable method with which to examine the impact
   Future climate change scenarios may further exacerbate            of future SLR on storm surge and inundation would be to
the threats of TC-induced storm surge and inundation. Ac-            construct an ensemble of tracks and intensities of possible
cording to the Intergovernmental Panel on Climate Change             landfalling TCs along the Bangladesh coast based on the his-
Fourth Assessment Report (IPCC 4AR), there is a high prob-           torical TC records. From this statistical approach, we can
ability of major changes in TC activity across various ocean         quantify the probable impact of TC tracks under future SLR
basins including the Arabian Sea and the Bay of Bengal. Ac-          change. To date, such an approach has not been done and will
cording to Milliman et al. (1989), this Ganges–Brahmaputra–          be the method of this study.
Meghna delta region has long been characterized as a highly             We first use Delft3D to simulate the present-day storm
vulnerable zone due to its exposure to the increasing trend          surge and inundation using the strength of two recent TCs
of SLR. According to the SLR analysis done by the South              (Sidr and Aila) and validate the simulations with observa-
Asian Association for Regional Cooperation based on the 22-          tional data. The future storm surge and inundation scenarios
year records at Charchanga, Cox’s Bazar and Hiron Point,             were then generated by incorporating the projected SLR.
sea level at these locations is rising at rates of 6.0, 7.8 and         The study was carried out in the Ganges–Brahmaputra–
4 mm yr−1 (SMRC, 2003). These rates are much higher than             Meghna delta region (Fig. 1a). According to the Integrated
the global rate of SLR (∼ 3.2 mm yr−1 ) over the last 25 years       Coastal Zone Management plan, 19 districts of Bangladesh
(Pietrafesa et al., 2015). Based on Warrick et al. (1996), the       located near the Bay of Bengal area were defined as the
sea level in the Bay of Bengal is also influenced by local fac-      coastal areas and considered in this study. We selected two
tors, including tectonic setting, deltaic processes, and sedi-       TC cases in this study: a strong Saffir–Simpson (SS) Cate-
ment load; for example, the coastal region of Bangladesh has         gory 5 that directly hit the study area, TC Sidr, and a Cate-
been subsiding due to the pressure on the Earth’s crust from         gory 1 storm that made landfall in the south-western part of
the sediment with thick layers that have formed over millions        the study domain, TC Aila.
of years. Warrick et al. (1996) also analysed the recent his-           TC Sidr made landfall near the Barguna district (Fig. 1a)
tory of land accretion and suggested that the subsidence is          in 2007, causing ∼ 3000 human fatalities and leaving mil-
also balanced by land accretion due to sediment supply from          lions homeless. This Category 5 cyclone is considered one
the coast. These physical phenomena have been shaping the            of the most powerful cyclones in the past 15 years to have
coast of Bangladesh over the past 100 years. A global SLR of         made landfall in Bangladesh and affected over nine million
26–59 cm has been projected over the next 84 years to 2100           people living in the coastal areas. The districts of Patuakhali,
by the IPCC under the scenario A1F1 (Meehl et al., 2007).            Khulna, Barguna and Jhalokathi were badly affected. During
In this proposed work, we will use the SLR projections from          TC Sidr, around 15 % of the affected population took refuge
Caesar et al. (2017), which is based on IPCC AR5 and sug-            in nearby cyclone shelters. In the village of Angul Kata in
gests projections of SLR of 26 cm for the middle of the 21st         Barguna district, around 1500 people took shelter in eight re-
century (2040–2060) and 54 cm for the end of the 21st cen-           inforced pillars to protect themselves from the tidal surge of
tury (2079–2099).

Nat. Hazards Earth Syst. Sci., 18, 351–364, 2018                              www.nat-hazards-earth-syst-sci.net/18/351/2018/
M. A. Jisan et al.: Ensemble projection of the sea level rise impact on storm surge                                                 353

Figure 1. (a) Map of the study area for this work. The red and green lines represent the tracks of TC Sidr and TC Aila respectively.
The area marked in green indicates the Sundarban mangrove forest region. Locations of the Ganges, Brahmaputra and Meghna rivers are
shown on the map. Khulna, Barisal and Chittagong, which are landfall locations for the historical TCs used for ensemble projection, are
shown inside a circular box on the map. Two circles over the study area are the observation stations of Bangladesh Inland Water Transport
Authority (BIWTA). The black-coloured outline shows the extent of the model grid over the region. (b) Topography and bathymetry of the
model domain. Negative depth values represent water bodies (ocean and rivers) and positive depth values areas represent land.

around 5 m. If there had been no shelters, the death toll could        2     Methodology
have reached into the hundreds in that area.
   The other cyclone studied in this paper, TC Aila (Fig. 1a)          2.1     Modelling methodology
occurred in the Bay of Bengal region in 2009. Although a
Category 1 storm, Aila, caused ∼ 190 deaths and affected               2.1.1    Application of the numerical model
4.8 million people, the devastation left a long-term impact.
                                                                       To develop the present-day and future inundation scenario
The locales mainly affected were Khulna, Patuakhali and
                                                                       in the coastal regions of Bangladesh, the Delft3D-FLOW
Chandpur. The storm surge due to Aila broke a dam in Patu-
                                                                       (Delft Hydraulics, 2006), a multidimensional (2-D or 3-
akhali and submerged five villages, destroying a huge num-
                                                                       D) hydrodynamic and transport simulation programme was
ber of homes and leaving thousands of people homeless.
                                                                       used that calculates non-steady flow and transport phenom-
Most of the people living in those affected areas took shel-
                                                                       ena resulting from tidal and meteorological forcing. Delft3D-
ter in the nearest cyclone shelters. According to government
                                                                       FLOW solves the unsteady shallow water equation in two
sources, approximately 2 500 000 houses had been destroyed
                                                                       (depth-averaged) or three dimensions. The system of equa-
completely and 3 700 000 houses had been damaged.
                                                                       tions consists of the horizontal equations of motion, the
   The structure of the paper is as follows: a brief description
                                                                       continuity equation and the transport equations for con-
of the Delft3D-FLOW model and the methodologies used
                                                                       servative constituents. The equations are formulated in or-
to simulate future changes in storm surge and inundation to
                                                                       thogonal curvilinear coordinates or in spherical coordinates.
generate ensemble projections of storm surge inundation are
                                                                       Delft3D-FLOW module’s two-dimensional, depth-averaged
discussed in Sect. 2. In Sect. 3, validation of the model re-
                                                                       flow equations can be applied to model tidal waves, storm
sults, present-day storm surge inundation scenarios, ensem-
                                                                       surges, tsunamis, harbour oscillations (seiches) and transport
ble projection of storm surge inundation and future change in
                                                                       of pollutants in vertically well-mixed flow regimes. In this
storm surge level1 are presented. Section 4 includes discus-
                                                                       paper Delft3D’s 2-D mode for barotropic depth-integrated
sion of model results and the uncertainties associated with
                                                                       flow has been applied. The equations are listed below.
the future projections. Finally, Sect. 5 presents the conclud-
ing remarks on research findings.                                                                     p
                                                                                           ∂ (d + ζ )υ Gηη

                                                                       ∂ζ           1
                                                                           +p       p
                                                                        ∂t      Gξ ξ Gηη            ∂ξ
                                                                                                      p
                                                                                    1      ∂ (d + ζ )ν Gξ ξ
                                                                           +p       p                          =Q                 (1)
                                                                                Gξ ξ Gηη            ∂ξ

   1 In this paper, the storm surge results refer to the total water
level including both normal tides and the water level change due to
storm.

www.nat-hazards-earth-syst-sci.net/18/351/2018/                                   Nat. Hazards Earth Syst. Sci., 18, 351–364, 2018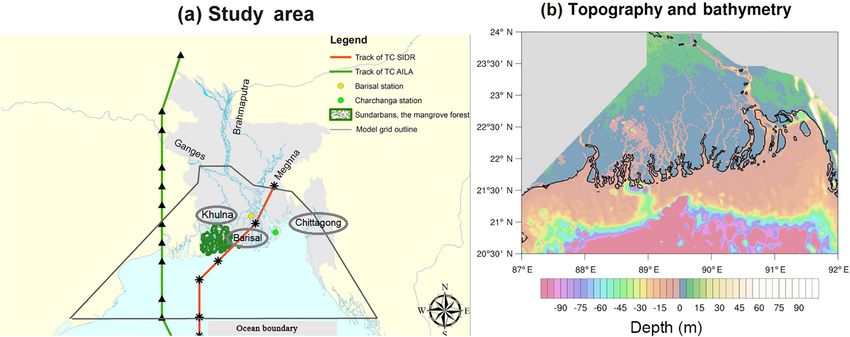
354 M. A. Jisan et al.: Ensemble projection of the sea level rise impact on storm surge
∂u u ∂u v ∂u uv
p
∂ Gξ ξ 2.1.3 Wind and pressure field
+p +p +p p
∂t Gξ ξ ∂ξ Gηη ∂η Gξ ξ Gηη ∂η Track data of TCs Sidr and Aila were obtained from the
p
v2 ∂ Gηη g ∂ζ Indian Meteorological Department (http://www.imd.gov.in).
−q −fv+ p Using those data as input, TC surface winds and mean sea
G
p
G ∂ξ Gξ ξ ∂ξ
ξξ ηη level pressure fields were generated using the Wind Enhance-
1 ∂Patm ment Scheme (WES) (Heming et al., 1995) method based on
=− p + Fξ (2) the analytical equation by Holland (1980). Delft3D slightly
ρ0 Gξ ξ ∂ξ
p improved the original WES by introducing TC asymmetry.
∂v u ∂v v ∂v uv ∂ Gξ ξ Unlike some previous method that incorporates TC wind
+p +p +p p
∂t Gξ ξ ∂ξ Gηη ∂η Gξ ξ Gηη ∂η asymmetry information from observations (Xie et al., 2006),
p in WES the asymmetry was brought about by applying the
u2 ∂ Gξ ξ g ∂ζ
−q +fu+ p translation speed of the cyclone centre displacement as the
G
p
G ∂η Gξ ξ ∂ξ steering current and by introducing rotation of wind speed
ξξ ηη
due to friction (Delft Hydraulics, 2011; Heming et al., 1995).
1 ∂Patm
=− p + Fη (3) According to Holland’s equation, gradient wind speed
ρ0 Gηη ∂η Vg (r) at a distance r from the Centre of the cyclone is ex-
pressed as the following:
where ξ , η are the spatial coordinates, ζ represents the wa-
ter level above some horizontal plane of reference (m), u and 0.5
v are the velocities in the ξ and η direction (m s−1 ), d is the AB (pn − pc ) exp − rAB r 2f 2
Vg (r) = + − rf . (4)
water depth below some horizontal plane of reference (m), ρr B 4 2
f is the Coriolis forcing due to the rotation of the earth,
g is the acceleration of gravity (m s−2 ), Patm is the atmo- Here ρ is the density of air, pc is the central pressure and
spheric pressure at the water surface (kg m−1 s−2 ), Q is the pn is the ambient pressure and the Coriolis parameter is rep-
discharge of water, evaporation or precipitation per unit area resented by f . A and B are determined empirically, with the
(m s−1 ), ρ0 is the density of water, Gξ ξ is the coefficient
p
physical meaning of A as the relation of pressure or wind
used to transfer one coordinate system into another one (m), profile relative to the origin and parameter B defining the
Fξ is the turbulent momentum flux in ξ direction (m s−2 ), shape of the profile. Delft3D introduces a central pressure
Fη is the turbulent momentum flux in η direction (m s−2 ). dV
drop of pd = pn − pc . By equating drg = 0 and assuming
Along with the appropriate set of initial and boundary condi- f = 0 in the region of maximum winds where the Coriolis
tions, the above-mentioned equations have been solved on an force is small compared to the pressure gradient and centrifu-
Arakawa-C type finite difference grid. Delft3D-FLOW man- gal forces, the radius of maximum winds Rw can be given as
ual (Delft Hydraulics, 2006) contains detailed information follows:
about these numerical aspects.
Rw = A1/B . (5)
2.1.2 Model grid and bathymetry
Thus, Rw is independent of the relative values of ambient
The grid was set up using spherical coordinates. The grid and central pressure and is defined entirely by the scaling
spacing varies from a minimum of 125 m to a maximum of parameters A and B. Substitutions lead to the expression for
1140 m. The finer resolution was applied over land to calcu- the maximum wind speed Vm
late the inundation or wetting process accurately.
In this study, the land topography data were obtained Bpd 0.5
from NASA’s Shuttle Radar Topography Mission (SRTM) Vm = , (6)
ρe
90 m resolution data sets (Fig. 1b). The bathymetries of
the rivers and estuaries are specified using the cross sec- where e is the base of the natural logarithm
tions measured by the Institute of Water and Flood Man- (= 2.71828182846).
agement, Bangladesh. The ocean bathymetry was speci- Complete details on this method can be found in the user
fied using the data from the General Bathymetric Chart of manual of Delft3D-FLOW (Delft Hydraulics, 2006), Hol-
the Oceans 30 arcsec interval gridded data (BODC, 2003, land (1980) and Vatvani et al. (2002).
Fig. 1b). Bathymetry and topographic data were interpolated The circular grid of TC wind fields used in this study con-
over the model domain using triangular interpolation and sists of 36 columns and 500 rows and the data were updated
grid-cell averaging methods of Delft3D (Delft Hydraulics, at 6 hourly intervals throughout its movement until landfall.
2006). Figure 2 shows a snapshot of the wind field of TC Sidr over
the model domain before landfall, generated using Holland’s
equation above.
Nat. Hazards Earth Syst. Sci., 18, 351–364, 2018 www.nat-hazards-earth-syst-sci.net/18/351/2018/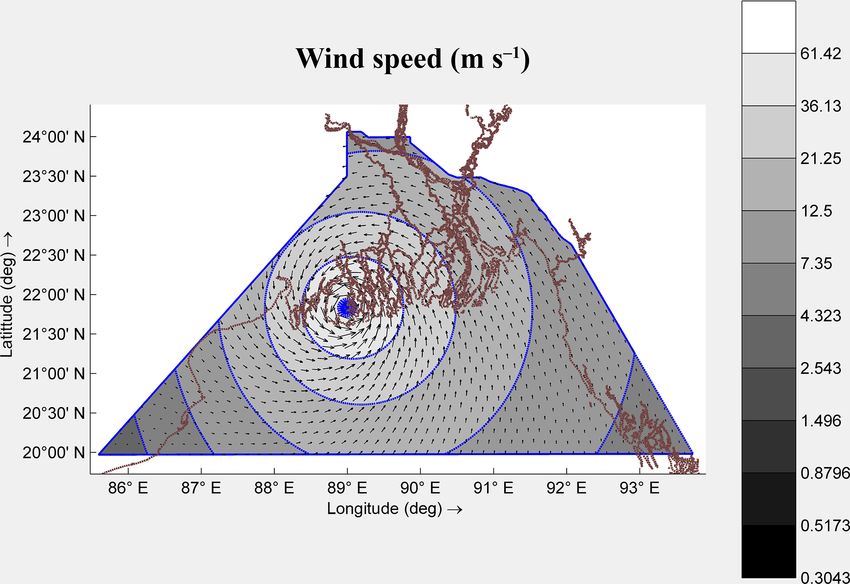
M. A. Jisan et al.: Ensemble projection of the sea level rise impact on storm surge                                                 355

                                                                     Table 1. Manning’s roughness coefficient for different land covers.

                                                                                         Land cover     Manning’s
                                                                                                        coefficient
                                                                                         River               0.015
                                                                                         Mangrove            0.080
                                                                                         Ocean                0.01
                                                                                         Land                0.025

                                                                     terms of storm surge and inundation to identify the changes
                                                                     between present-day and future SLR scenarios.
                                                                        Now, future storm surge inundation due to SLR is a prob-
                                                                     abilistic event that requires the uncertainties associated with
Figure 2. Distribution of the wind field over the model domain for   the input parameters to be properly addressed. To do this and
TC Sidr during landfall generated using Holland’s equation.          obtain statistically significant results, we created an ensem-
                                                                     ble of tropical cyclone tracks. The ensemble tracks were gen-
                                                                     erated from different historical tropical cyclones that made
2.1.4    Roughness                                                   landfall over the study domain with different intensities (Ta-
                                                                     ble 2). Along with the uncertainties associated with future
The spatially varying Manning’s roughness value was de-              landfall locations, the intensities of Sidr-like and Aila-like
fined based on land cover, such as vegetation, rivers and            TCs may be different. So, to address the uncertainty with the
ocean (Table 1). In the study domain, a mangrove forest,             intensity, we increased and decreased their intensity by 10 %
Sundarbans, is located in the south-western region, near TC          to simulate a probable range of future storm surge inunda-
Sidr’s landfall location (Fig. 1a). Sakib et al. (2015) found        tion.
that Sundarban plays a significant role as a buffer in reducing         Storm surge inundation can also vary based on landfall
the total inundation during TC passages. Therefore, in this          timing. If a storm made landfall during the high astronomical
study, the mangrove region was considered. In selecting the          tide condition, its flooding would have been much higher at
roughness values, methods described in Zhang et al. (2012)           that time than what could happen during a low astronomical
were followed and slightly modified values were defined for          tide condition. For example, the tides shown in Figs. 3 and 7
the study area based on the vegetation types in that area.           as the water level oscillations have amplitudes as high as 3 m,
                                                                     which could significantly affect the extension of flooded area,
2.1.5    Boundary conditions                                         depending on whether the storm’s landfall coincides with a
                                                                     high tide or a low tide. We note that TC Sidr and TC Aila
Upstream boundaries were specified as discharges at the              made landfall during the high-tide conditions, which may
mouths of the three major rivers, the Ganges, the Brahma-            not always be applicable for the future TCs. To also address
putra and the upper Meghna, obtained from the Bangladesh             uncertainties with the TC landfall timing, experiments were
Water Development Board (BWDB) as daily discharge.                   conducted by changing the timing of the landfall to iden-
The downstream ocean boundary was defined by the                     tify the impact of high tide and low tide on storm surge and
Topex/Poseidon Inverse Tidal model, based on Egbert et               inundation. The change of timing in these tide-related ex-
al. (1994). Location of the downstream ocean boundary is             periments was implemented by modifying the tracks of the
shown in Fig. 1a.                                                    storms so that their landfalls coincide with a high tide, a
                                                                     tide, or a zero-tide condition, in addition to their actual tidal
2.2     Calculation procedure for present-day and future             phases. Here in this study, future storm surge inundation sce-
        storm surge and inundation scenario                          narios caused by the ensemble tracks will then be simulated
                                                                     by incorporating the projected SLR. By taking all these pa-
To generate storm surge and inundation for the present-day           rameters into consideration, we conducted a total of 108 en-
climate scenario, upstream discharge and downstream wa-              semble simulations (36 for each of one present-day and two
ter level data from the present day were used. For future            SLR scenarios). Parameters that were considered in making
SLR scenarios, present-day hydrodynamic conditions and               ensemble projections are shown in Table 3.
the strengths of present-day TCs were used but the future
sea level was modified based on the SLR projections by
Caesar et al. (2017). Scenarios were generated for both the
mid-21st-century and the end-21st-century time horizons for
these TCs, Sidr and Aila. Finally, comparisons were made in

www.nat-hazards-earth-syst-sci.net/18/351/2018/                                Nat. Hazards Earth Syst. Sci., 18, 351–364, 2018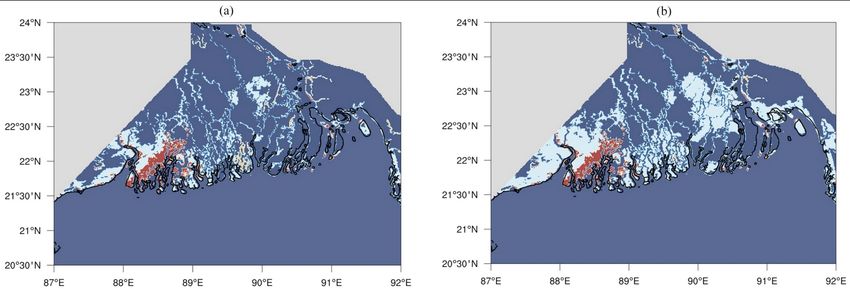
356                                        M. A. Jisan et al.: Ensemble projection of the sea level rise impact on storm surge

Figure 3. Comparison of observed and modelled water levels for TC Sidr and TC Aila at Barisal and Charchanga observation stations.
(a) Measured and modelled water level comparison for TC Sidr in Barisal, (b) TC Sidr in Charchanga, (c) TC Aila in Barisal and (d) TC Aila
in Charchanga.

3     Results                                                          The simulated water levels were compared against the mea-
                                                                       sured data from BIWTA at two locations: Barisal and
3.1    Validation of the model                                         Charchanga (Fig. 1a). Barisal station is located more towards
                                                                       the inland, whereas Charchanga is located near the coastline,
Hourly tidal data from the Bangladesh Inland Water Trans-              where the grid cell resolution was coarse. However, none of
port Authority (BIWTA) were used to evaluate the perfor-               them are in the open ocean water, which is important for get-
mance of the model used in this study. The model sim-                  ting a clear idea about storm surge level. TC Sidr made land-
ulation’s root mean square error (RMSE)7 , mean abso-                  fall near Barisal station (Fig. 1a) and the impact of the storm
lute error (MAE)8 and dimensionless Nash–Sutcliffe coeffi-             surge was clearer at Barisal station than that of TC Aila,
cient (E)9 (Nash and Sutcliffe, 1970) were calculated and              which made landfall outside the model domain (Fig. 1a);
listed in Table 4. A Nash–Sutcliffe coefficient ranges be-             therefore, its impact was not as clear as that of Sidr.
tween negative infinity (no skill simulation) and one (perfect            In Fig. 3a for TC Sidr at Barisal station, the modelled wa-
simulation).                                                           ter level, including storm surge and astronomical tides, was
           v                                                           slightly lower than the observations, and at Charchanga sta-
           u n
           uP                       2
                 X      − Xmodel,i                                     tion (Fig. 3b) the measured water level variation displayed
           t i=1 obs,i
           u
                                                                       smaller amplitudes than the model outputs for positive tides,
RMSE =                                                     (7)
                        n                                              larger amplitudes than the modelled water level for negative
          1X n                                                         tides, perhaps due to the coarse resolution of bathymetry.
MAE =           Xobs,i − Xmodel,i                          (8)         Similar types of variation between measured and modelled
         n i=1
                                                                       water level were found for TC Aila (Fig. 3c and d). Neverthe-
           n
           P                       2                                  less, the modelled water level variations during TCs Sidr and
                 Xobs,i − Xmodel
           i=1
                                                                       Aila agreed reasonably well with measured data, as also con-
E = 1−       n                                                 (9)     firmed by the calculated RMSE, MAE and Nash–Sutcliffe
            P                     2
                  Xobs,i − Xobs                                        coefficient (Table 4). Therefore, we conclude that the method
           i=1

Nat. Hazards Earth Syst. Sci., 18, 351–364, 2018                                 www.nat-hazards-earth-syst-sci.net/18/351/2018/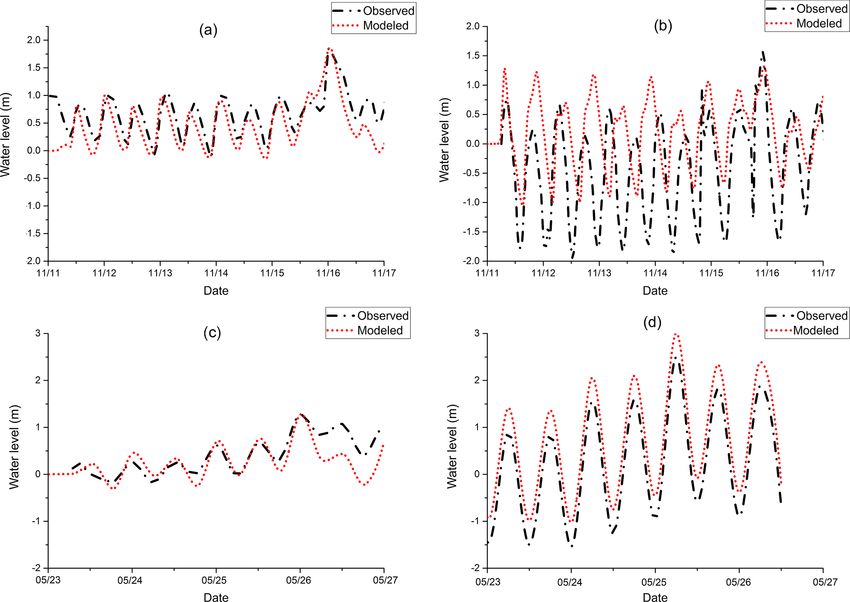
M. A. Jisan et al.: Ensemble projection of the sea level rise impact on storm surge 357
Table 2. List of 12 historical TC events used for ensemble projection of storm surge inundation.
Name Date Landfall Maximum
location sustained
wind (km h−1 )
Tropical storm 13 14–18 November 1973 Noakhali 102
Cyclone 12 23–28 November 1974 Bhola 139
Tropical storm 19 7–12 November 1975 Chittagong 93
Tropical storm 1 22–25 May 1985 Noakhali 110
Cyclone 4 21–30 November 1988 Khulna 205
Cyclone 2 22–30 April 1991 Chittagong 235
Cyclone 2 26 April–2 May 1994 Cox’s Bazar 215
Cyclone 4 18–25 November 1995 Cox’s Bazar 190
Cyclone 1 13–20 May 1997 Noakhali 165
Tropical storm 4 24–27 October 2008 Barguna 85
Tropical storm Mahasen 10–16 May 2013 Patuakhali 85
Tropical storm Roanu 18–21 May 2016 Chittagong 110
Table 3. Parameters considered for ensemble projection of storm surge inundation, which includes the TC intensities, tidal conditions and
the SLR scenarios.
TC name Intensities Tide conditions SLR
TC Sidr +10 %, present day, −10 % high, low, actual, zero present day, 0.26, 0.54 m
TC Aila +10 %, present day, −10 % high, low, actual, zero present day, 0.26, 0.54 m
12 historical TC tracks actual intensities actual present day, 0.26, 0.54 m
can be used to study the impact of SLR on storm surge and Table 4. Computed values of RMSE, MAE and Nash–Sutcliffe co-
inundation in future climate change scenarios. efficient for both TC Sidr and TC Aila.
3.2 Present-day inundation scenario Stations TC Sidr TC Aila
RMSE MAE NASH RMSE MAE NASH
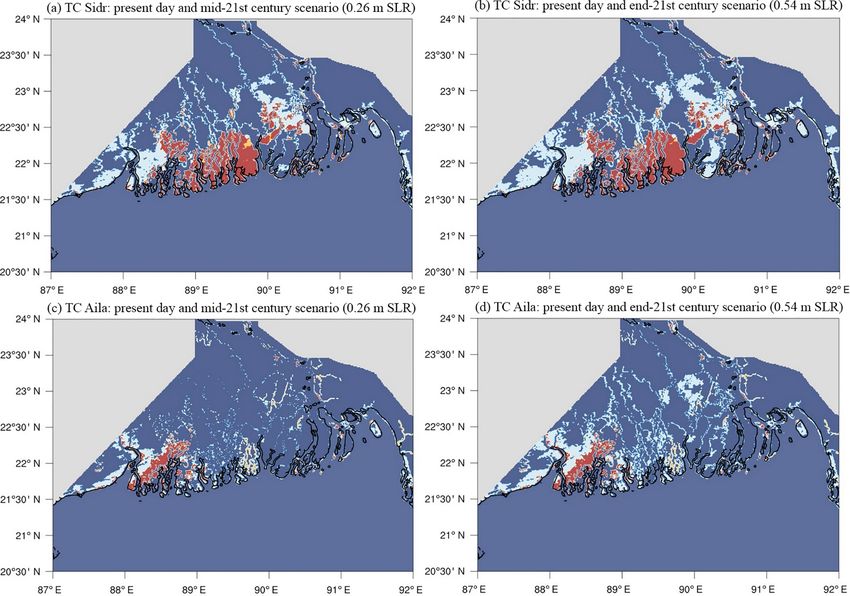
The storm surge inundation scenarios due to the two TCs (m) (m) (m) (m)
considered are shown in Fig. 4. It can be seen from Fig. 4 Barisal 0.23 0.16 0.85 0.33 0.24 0.65
that the area flooded by TC Sidr (yellow and red shaded) was Charchanga 0.26 0.19 0.80 0.28 0.17 0.73
much larger than the area flooded by TC Aila (white and red
shaded), a result that is consistent with the fact that the Cat-
egory 5 TC Sidr was much stronger than the Category 1 TC 3.3 Impact of future climate scenarios on storm surge
Aila and directly hit the study area. The maximum sustained inundation
wind speed for TC Sidr was 260 km/h, whereas for TC Aila
it was 110 km h−1 . The landfall location of Sidr was on the Future inundation scenarios were generated for two different
eastern side of Sundarban, while for Aila, the landfall loca- time horizons: one for the mid-21st century and the other
tion was towards the western side of Sundarbans. That ex- for the end-21st century. The initial ocean water level rose
plains why the inundations due to TC Sidr were located near by 0.26 m and 0.54 m for the mid-21st century and end-21st
the eastern side of Sundarban, whereas for Aila, the inunda- century. The upstream river discharge and downstream ocean
tion was located mainly in the western part. The extent of water level were used from present-day climate scenarios.
inundation due to Sidr (1860 km2 ) was 54 % larger than that In this section we seek to answer the following question:
of Aila (1208 km2 ). if present-day TCs were to happen in future SLR scenarios,
Sakib et al. (2015) showed that Sundarban acted as a buffer what storm surge and inundation hazard would they cause?
zone in reducing the impact of Sidr and thereby reduced Therefore, the tracks and intensities of the two present-day
much of the potential inundation depth and extent of flood- TCs, Sidr and Aila, were used as the model wind input pa-
ing. As mentioned before, in the model simulation the impact rameters.
of Sundarban was realized using a higher Manning’s rough- The model-simulated inundated areas and the percent vari-
ness value as resistance against the surge. ations were shown in Table 5 and Fig. 5. Figure 5 shows
that under future SLR scenarios, the inundated areas caused
www.nat-hazards-earth-syst-sci.net/18/351/2018/ Nat. Hazards Earth Syst. Sci., 18, 351–364, 2018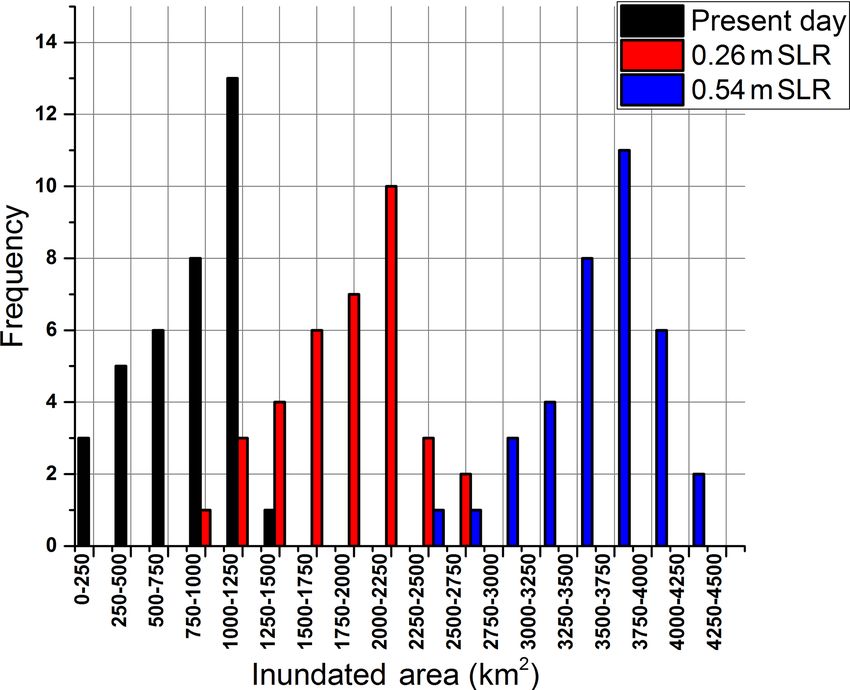
358                                         M. A. Jisan et al.: Ensemble projection of the sea level rise impact on storm surge

                                                                       Table 5. Comparison of the inundated area between present-day and
                                                                       future SLR scenarios and calculated change in percentage with re-
                                                                       spect to the present-day scenario.

                                                                        SLR scenario                      TC Sidr                  TC Aila
                                                                                                   Inundated     Increase   Inundated     Increase
                                                                                                   area (km2 )   (%)        area (km2 )   (%)
                                                                        Present day                  1860        n/a          1208        n/a
                                                                        Mid-21st century             2437        31 %         1550        28 %
                                                                        End-21st century             2846        53 %         1770        47 %

                                                                       n/a means not applicable.

                                                                       Ensemble projection of future storm surge inundation
                                                                       under SLR conditions
Figure 4. Yellow denotes the areas flooded by TC Sidr but not by
Aila, and the white represents the area inundated by TC Aila but not   As discussed in Sect. 2.2, the future change in storm surge
by Sidr. Red is the area flooded by both TC Sidr and TC Aila. Blue     inundation can vary based on the intensity, landfall location
shows the non-flooded area (either land or constant water).
                                                                       and timing of future TCs. By considering all these uncer-
                                                                       tainty factors mentioned in Table 3, a column plot was cre-
                                                                       ated (Fig. 6) for present-day sea level and future SLR sce-
by TCs Sidr and Aila would be significantly larger than
                                                                       narios. Ensemble simulation outputs also showed an evident
those under the present-day climate condition, as indicated
                                                                       increase in the inundated area under the effect of SLR. For
by the white-shaded areas. For the Category 5 TC Sidr,
                                                                       the present-day scenario (black column), out of 36 simu-
the inundated area would be 31 % (2437 km2 ) and 53 %
                                                                       lations, frequency of storm surge inundation incidents that
(2846 km2 ) larger than present day’s 1860 km2 inundated
                                                                       would likely occur in the range of 1000–1250 km2 is 13.
area, in mid-21st-century (0.26 m SLR) and end-21st-century
                                                                       Whereas for 0.26 m of SLR (red column), peak of the column
(0.54 m SLR) climate scenarios, respectively (Fig. 5a and b).
                                                                       shifted towards the right with a maximum frequency of inun-
   Similarly, for the Category 1 TC Aila, there would be
                                                                       dation events occurring within the range of 2000–2250 km2
an increase in inundated areas. The simulated inundated
                                                                       (10 times out of 36 simulation results). For 0.54 m of increase
areas for TC Aila under the mid-21st-century and end-
                                                                       in sea level (blue column), the peak of the column shifted
21st-century scenarios were 1550 km2 (28 %) and 1770 km2
                                                                       more towards the right and the maximum number of simula-
(47 %) (Fig. 5c and d), whereas for the present-day scenario
                                                                       tion outputs (11 out of 36 simulations) showed the range of
it was found to be 1208 km,2 .
                                                                       inundation to be within 3500–3750 km2 . These results show
   However, in Fig. 5, there are several small areas of yel-
                                                                       that even though the change in intensities of future TCs is
low indicating zones flooded under present conditions but not
                                                                       indefinite and the landfall timing is uncertain, an increase in
flooded during future SLR conditions. This is because Fig. 5
                                                                       sea level is going to increase the area of inundation.
showed snapshots of the inundation conditions at one par-
ticular time. Some areas may experience alternating wetting
                                                                       3.4    Impact of sea level rise on future storm surge level
and drying conditions, which may explain why some areas
are flooded with present SLR and not with higher SLR: this
                                                                       In addition to the inundated area, SLR would also greatly
is the case only at a particular time. The authors expect that
                                                                       affect storm surge levels. Similarly to the approach used in
those areas are flooded at other times.
                                                                       the inundation study (Sect. 3.3), TCs Sidr- and Aila-induced
   All these simulations were carried out using the present-
                                                                       storm surges in the future SLR scenarios were simulated us-
day tides, upstream river discharges and TC tracks and
                                                                       ing their recorded strengths.
strengths, with only the initial seawater level raised to re-
                                                                          The simulated storm surge water levels in the future SLR
flect the effect of the projected future SLR. Therefore, the
                                                                       scenarios were compared with both the observed and model
results suggest that even if the future TCs strengths, tides,
                                                                       generated ones under the present-day scenarios (Fig. 7). It is
and river discharges remain the same as in the present-day
                                                                       to be mentioned that, while generating the future water level
climate condition, future SLR would significantly increase
                                                                       under the effect of SLR, the baseline was only changed by
the inundated area by as high as 53 %.
                                                                       considering the SLR effect and based on that factor the future
                                                                       storm surge level was calculated. Apart from that, the water
                                                                       level is the same as present-day TCs.
                                                                          From Fig. 7a and Table 6 we can see that for the case
                                                                       of TC Sidr the simulated storm surge level would become

Nat. Hazards Earth Syst. Sci., 18, 351–364, 2018                                   www.nat-hazards-earth-syst-sci.net/18/351/2018/
M. A. Jisan et al.: Ensemble projection of the sea level rise impact on storm surge 359
Figure 5. Comparison of the inundated areas between present-day and future climate scenarios for (a) TC Sidr mid-21st century 0.26 m SLR,
(b) TC Sidr end-21st century 0.54 m SLR, (c) TC Aila mid-21st century 0.26 m SLR and (d) TC Aila end-21st century 0.54 m SLR. White
represents the flooded areas that were not in the present-day scenario but were flooded due to future SLR. Red shows the inundated areas
that were similar both for present-day and future SLR scenario.
2.13 m at Barisal station, which is around 14 % higher than At Charchanga, the storm surge would be higher than the
the present-day scenario. Similarly to that, under the end- present-day condition for TC Aila. Under the 0.26 m mid-
21st century 0.54 m SLR scenario in Barisal, the storm surge 21st-century SLR scenario, the storm surge would become
would be around 29 % higher than the present-day scenario 3.07 m which is 23 % higher than the present-day condition
and the peak water level would reach 2.41 m. (Fig. 7d, Table 6). And for the end-21st century, this would
An increase in storm surge was also found at Charchanga be 55 % higher (3.87 m) than the present day.
station. For TC Sidr, under the mid-21st-century scenario To analyse the linearity/non-linearity of storm surge level
(0.26 m SLR), the model-simulated storm surge level was with respect to SLR, we conducted additional experiments
found to be 14 % higher (1.87 m) than the present day and based on 5 SLR scenarios; present-day sea level, 0.26 m of
34 % higher (2.19 m) (Fig. 7b, Table 6) than the present day SLR, 0.33 m of SLR, 0.4 m of SLR, 0.47 m of SLR, 0.54 m
for the end-21st-century (0.54 m SLR) climate scenario. It is of SLR, respectively. Results from these experiments are pre-
to be noted that a slight phase shift in the model simulation sented in Table 6.
occurred at this station from 13 to 15 November. This could For the case of TC Sidr at Barisal and Charchanga stations,
happen due to the presence of a seiche. However, for rest of storm surge level increased almost linearly with respect to
the period, phase variations are similar to the observed ones. the addition of water due to the effect of SLR. For example,
For TC Aila in Barisal, under the mid-21st-century SLR with a SLR of 0.47 m, the percentage increases in storm surge
scenario the storm surge would become 22 % higher (1.58 m) level with the SLR scenarios at Barisal and Charchanga sta-
than the present day, which was 1.29 m (Fig. 7c, Table 6). tions were 96 and 94 %, respectively (Table 6). On the other
During the end-21st-century climate scenario, the increment hand, for the case of TC Aila, with a SLR of 0.26 m, the in-
would become even higher as the SLR would be 0.54 m. creases in storm surge level were found to be 112 and 219 %
Storm surge under the 0.54 m end-21st-century SLR condi- respectively for Barisal and Charchanga stations (Table 6).
tion would be 52 % higher (1.96 m) than the present day. The increase in storm surge level for TC Aila at Charchanga
station is significantly higher than what we found at Barisal
www.nat-hazards-earth-syst-sci.net/18/351/2018/ Nat. Hazards Earth Syst. Sci., 18, 351–364, 2018360 M. A. Jisan et al.: Ensemble projection of the sea level rise impact on storm surge
Figure 6. Ensemble projection of the future SLR impact on storm
surge inundation. The column in black represents the inundation
events for the present-day sea level condition, the red one is for
0.26 m of SLR and the blue column is for 0.54 m of SLR conditions.
In total 108 simulations were conducted for one present and two
future SLR scenarios.
station (Table 6). This difference is likely due to the different
roles played by the topography and bathymetry near the two
stations and their coarse resolution in the model grid. In the
absence of strong interaction with the bottom topography, the
increase in peak water level during the TCs should approxi-
mately match the mean SLR. However, both Charchanga and
Barisal are located away from the open water, and thus the Figure 7. Comparison of storm surge water levels between present-
complex topography and bathymetry play a role in regulat- day and future SLR scenarios. (a) TC Sidr at Barisal, (b) TC Sidr at
ing water levels in a complex way. The large simulated storm Charchanga, (c) TC Aila at Barisal and (d) TC Aila at Charchanga.
surge level increase for TC Aila at Charchanga station may The observed, modelled present-day, mid-21st-century and end-
be unrealistic and in our opinion, it is an artificial effect due 21st-century storm surge levels are denoted by the black dashed-
to the coarse resolution of the model grid near the station. dotted, red-dotted, blue-dashed and green dash-dotted lines.
4 Discussions additional pressure gradient force was found acting towards
the coast which made the inundated area much larger. There-
In this paper, we showed that even if the future TCs keep the fore, this method was not used in this study. Instead, in this
same strength as the present-day ones their impact will be study, the future SLR was added to the whole ocean domain
much higher in a changing climate due to the effect of SLR. depth.
Several other factors not included in the modelling could To make the future SLR simulation realistic, we consid-
make the storm surge and inundation situation far worse ered the increased sea level in ocean bathymetry and in-
than that shown in the modelling result. These factors in- creased the depths by 0.26 and 0.54 m by considering land
clude mangrove coverage decrease, morphological changes, submergence near the coast. In that case, the result looked
TC strength increase, and upstream river discharge changes. much more realistic than the previous one and this is the
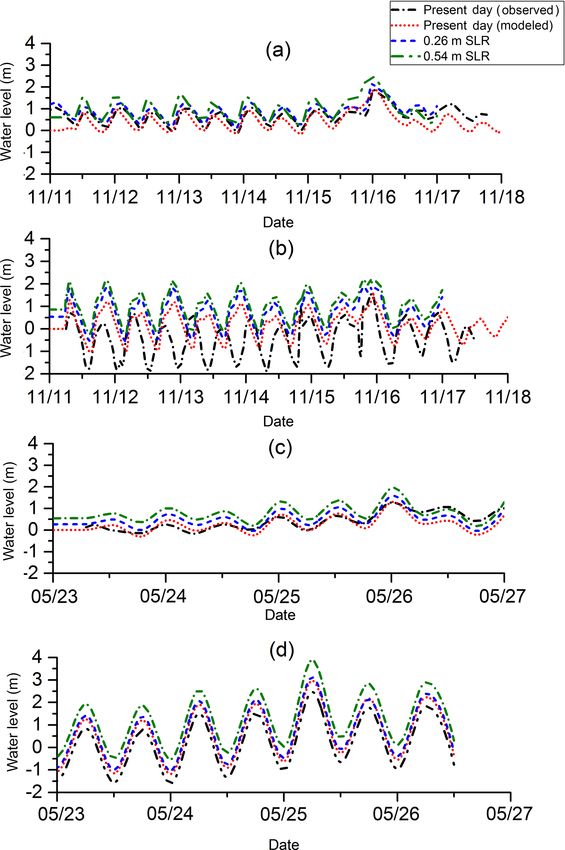
For including the effect of future SLR in the model sim- method we followed in this paper. For example, for the case
ulations, several methodologies were examined. One of the of TC Aila under the end-21st-century scenario in which we
methods with which we experimented in this study was to used a SLR of 0.54 m at the open ocean boundary instead of
include the increased sea level in open ocean boundary in- adding it to ocean depth and used the hydrodynamic condi-
stead of adding it in to the whole ocean depth by keeping tions from the present day, the total inundated area was found
the coastline fixed. This method was used by some previous to be 79 % larger than the present-day one. Similarly to that,
studies (Pickering et al., 2012). However, in such a case, an for the mid-21st-century scenario (a 0.26 m SLR), the inun-
Nat. Hazards Earth Syst. Sci., 18, 351–364, 2018 www.nat-hazards-earth-syst-sci.net/18/351/2018/M. A. Jisan et al.: Ensemble projection of the sea level rise impact on storm surge 361
dated area was found to be 69 % larger than the present-day
Table 6. Comparison of storm surge level between present day and future SLR scenarios and increase in storm surge level with respect to the present day and SLR scenario for the case
of TC Sidr and TC Aila at Barisal and Charchanga observational stations. The SLR scenarios of 0.33, 0.40 and 0.47 m were used to examine the linearity/non-linearity of increase in
SLR (%)
scenario. However, when we added the SLR in ocean depth,
increase
219 %
218 %
230 %
249 %
254 %
the mid-21st-century and end-21st-century inundated areas
n/a
in
were found to be 28 and 47 % larger than the present-day sce-
nario. This increase in the inundated area was much smaller
present day (m)
Charchanga
than the one that we found by adding the SLR at the open
increase from
0.57 (23 %)
0.72 (29 %)
0.92 (37 %)
1.17 (47 %)
1.37 (55 %)
ocean boundary. Figure 8 displays the differences in the in-
undated area based on the consideration of SLR in the model
input.
(%)
n/a
As discussed earlier, TC Sidr made landfall near Sundar-
ban, where the mangrove forest zone acted as a buffer in re-
surge
2.50
3.07
3.22
3.42
3.67
3.87
(m)
ducing the impact of the storm surge flood. That is why, even
TC Aila
though it was a TC 5, its impact was not as high as might
have been expected. In this study, the roughness of the man-
SLR (%)
grove forest zone on the south-western part of Bangladesh
increase
112 %
112 %
115 %
113 %
124 %
was considered to be fixed for the present day as well as for
n/a
in
future scenarios. However, Mukhopadhyay et al. (2015) pre-
dicted that 17 % of the total mangrove cover could disappear
present day (m)
by 2105. If this decreasing trend of vegetation was consid-
increase from
Barisal
0.29 (22 %)
0.46 (36 %)
0.53 (41 %)
0.67 (52 %)
0.37 (29%)
ered in this study, the flooded area could be much larger.
Morphological changes were not considered in this study,
but according to Goodbred et al. (2003), each year the east-
(%)
n/a
ern, central and western estuaries lose land at rates of 0.13,
0.16 and 0.16 cm yr−1 , respectively. This could also lead to
surge
1.29
1.58
1.66
1.75
1.82
1.96
(m)
increases in the inundated areas for future scenarios. As the
focus of the paper is to estimate the future scenario of storm
surge and inundation due to the effect of SLR and to compare
SLR (%)
them with the present-day scenarios, it is important that we
increase
102 %
keep the roughness and morphological changes constant so
88 %
94 %
90 %
94 %
n/a
that consistent comparisons can be made. in
Some previous research showed that there could be in-
present day (m)
Charchanga
creases in hurricane strength and landfall probability in the
increase from
0.23 (14 %)
0.31 (19 %)
0.36 (22 %)
0.44 (27 %)
0.55 (34 %)
future due to global climate change (Haarsma et al., 2013;
Bender et al., 2010; Bengtsson et al., 2007). Though we
slightly modified the present-day TC strengths and selected
(%)
n/a
12 historical TC tracks to reduce landfall uncertainties and
to make an ensemble projection of future storm surge inun-
surge
1.64
1.87
1.95
2.00
2.08
2.19
(m)
dation, strength may be much higher than the ones that we
TC Sidr
considered for this study. In such case, the devastation could
well be much greater under projected SLR conditions, which
SLR (%)
is very alarming
increase
storm surge level with respect to SLR conditions.
100 %
103 %
100 %
In this paper, we used the present-day river discharge data
97 %
96 %
n/a
in
as an upstream boundary for generating future inundation
scenarios. However, using the INCA-N, an inland catchment
present day (m)
modelling system and considering the projected climatic and
increase from
Barisal
0.26 (14 %)
0.34 (18 %)
0.39 (21 %)
0.45 (24 %)
0.54 (29 %)
socioeconomic scenarios, Whitehead et al. (2015) showed
that there would be a significant increase in future monsoon
intensities due to the impact of climate change. That would
(%)
n/a
make future flooding scenarios much worse than those expe-
rienced presently. So, based on the changes in TC intensity,
n/a means not applicable.
surge
1.87
2.13
2.21
2.26
2.32
2.41
(m)
river discharges, and land-use changes, the situation could
well become more impacted than in this study.
SLR (m)
The findings of our study are important for local govern-
ments to consider while they make new management and
0.00
0.26
0.33
0.40
0.47
0.54
policy decisions and to improve TC preparedness plans by
www.nat-hazards-earth-syst-sci.net/18/351/2018/ Nat. Hazards Earth Syst. Sci., 18, 351–364, 2018362 M. A. Jisan et al.: Ensemble projection of the sea level rise impact on storm surge
Figure 8. Comparison of inundated areas for TC Aila between the present day and end-21st-century (0.54 m SLR) scenario. White represents
the flooded areas that were not in the present-day scenario but were flooded due to future SLR. Red shows the inundated area that is similar
both for present-day and future scenario case. Blue areas are either land or constant waters (those which are already water at the model
initialization time). Panel (a) represents the inundated area when SLR was considered on ocean depths instead of adding it to the open ocean
boundary and (b) shows the inundated area when we considered the SLR on the ocean boundary.
increasing numbers of shelters and heights. In TC shelters, nario) and 3500–3750 km2 (under 0.54 m SLR scenario).
the first floor should be kept above the high surge waters. Besides the inundated area, we investigated the changes in
Our study showed that, in the future, there would be an in- storm surge level if TC Sidr and TC Aila were to make land-
crease in surge level from a minimum of 14 % up to 55 % if fall under future SLR conditions. Similarly to the inundated
a TC 1 or a TC 5 makes landfall under increased SLR condi- area, increases in storm surge levels were found for future
tions (Table 6). So, the authority may consider increasing the scenarios. The significant increase in simulated storm surge
height of the first floor due to the future risk of an increase in and inundation hazards highlights the need for local govern-
storm surge level and safety of local populations. Also, our ments to improve cyclone preparedness in future SLR sce-
model outputs showed that the inundated area increase would narios.
range from 28 to 53 % (Table 5) if any TC 1 or TC 5 was to
make landfall with SLRs of 0.26 or 0.54 m. This shows that
a huge number of new areas are going to face the impacts Data availability. Tropical cyclone tracking data used in this study
of storm surge inundation, and by considering this issue, it is were collected from the Indian Meteorological Department’s Re-
high time to increase the number of TC shelters in the coastal gional Specialized Meteorological Centre’s Best Track archive
areas of Bangladesh. (http://www.rsmcnewdelhi.imd.gov.in/). The ocean bathymetry
data are available from https://www.gebco.net/. The model outputs
are available upon request from the authors.
5 Conclusion
Employing the Delft3D-FLOW model, we simulated coastal Competing interests. The authors declare that they have no conflict
storm surge and inundation for present-day and future SLR of interest.
scenarios and compared the changes between them. Af-
ter validating the present-day model, simulations were con-
ducted for mid-21st century and end-21st century climate Acknowledgements. The authors would like to thank Coastal Car-
scenarios in which the SLRs have been found at 0.26 m and olina University’s Cyberinfrastructure Project (http://ci.coastal.edu)
0.54 m respectively. The model results showed that, with in- for providing access to computational resources. Also, we would
like to acknowledge Susan Kay from Plymouth Marine Labora-
creases of 0.26 m and 0.54 m SLR, there would be increases
tory, UK for her thoughtful opinions regarding the SLR input in
of 31% and 53% in inundated area if TC Sidr was to make model and Institute of Water and Flood Management, Bangladesh
landfall with its present-day strength. There would also be in- for providing important data and support for this work. The au-
creases of 28% and 47% in inundated area if Category 1 TC thors also appreciate the helpful comments and suggestions from
Aila was to make landfall with its present-day strength but the three anonymous reviewers. The computation was conducted on
under SLRs of 0.26 m and 0.54 m. Outputs from the ensem- the Coastal Carolina University Cyberinfrastructure Project and the
ble projections showed that, even if the TC intensities, land- National Science Foundation’s Extreme Science and Engineering
fall location and timings are uncertain, the most probable ex- Discovery Environment (XSEDE) project.
tent of the inundated area would shift from 1000–1250 km2
(present day) to 2000–2250 km2 (under 0.26 m SLR sce-
Nat. Hazards Earth Syst. Sci., 18, 351–364, 2018 www.nat-hazards-earth-syst-sci.net/18/351/2018/M. A. Jisan et al.: Ensemble projection of the sea level rise impact on storm surge 363
Edited by: Piero Lionello Meteorological Office global model, Met. Apps., 2, 171–184,
Reviewed by: three anonymous referees https://doi.org/10.1002/met.5060020211, 1995.
Holland, G. J.: An analytic model of the wind and
pressure profiles in hurricanes, Mon. Weather
Rev., 108, 1212–1218, https://doi.org/10.1175/1520-
References 0493(1980)1082.0.CO;2, 1980.
Karim, M. F. and Mimura, N.: Impacts of climate change
Ali, A.: Vulnerability of Bangladesh to climate change and sea and sea-level rise on cyclonic storm surge floods in
level rise through tropical cyclones and storm surges, in: Climate Bangladesh, Global Environ. Change, 18, 490–500,
Change Vulnerability and Adaptation in Asia and the Pacific, https://doi.org/10.1016/j.gloenvcha.2008.05.002, 2008.
Springer, the Netherlands, 171–179, https://doi.org/10.1007/978- Knutson, T. R., McBride, J. L., Chan, J., Emanuel, K., Holland, G.,
94-017-1053-4_16, 1996. Landsea, C., Held, I., Kossin, J. P., Srivastava, A. K., and Sugi,
Bender, M. A., Knutson, T. R., Tuleya, R. E., Sirutis, M.: Tropical cyclones and climate change, Nat. Geosci., 3, 157–
J. J., Vecchi, G. A., Garner, S. T., and Held, I. M.: 163, https://doi.org/10.1038/ngeo779, 2010.
Modeled impact of anthropogenic warming on the fre- Meehl, G. A., Stocker, T. F., Collins, W. D., Friedlingstein, A. T.,
quency of intense Atlantic hurricanes, Science, 327, 454–458, Gaye, A. T., Gregory, J. M., Kitoh, A., Knutti, R., Murphy, J. M.,
https://doi.org/10.1126/science.1180568, 2010. Noda, A., Raper, S. C. B., Watterson, I. G., Weaver, A. J., and
Bengtsson, L., Hodges, K. I., Esch, M., Keenlyside, N., Korn- Zhao, Z.: Global climate projections, in: Climate Change 2007:
blueh, L., Luo, J.-J., and Yamagata, T.: How may tropical cy- The Physical Science Basis, edited by: Solomon, S., Qin, D.,
clones change in a warmer climate?, Tellus A, 59, 539–561, Manning, M., Marquis, M., Averyt, K., Tignor, M. M. B., Miller,
https://doi.org/10.1111/j.1600-0870.2007.00251.x, 2007. H. J., and Chen, Z., Cambridge University Press, Cambridge,
BODC.: Centenary Edition of the GEBCO Digital Atlas, published 2007.
on CD-ROM on behalf of the Intergovernmental Oceanographic Milliman, J. D., Broadus, J. M., and Gable, F.: Environmental and
Commission and the International Hydrographic Organization as economic implications of rising sea level and subsiding deltas:
part of the General Bathymetric Chart of the Oceans, British the Nile and Bengal examples, Ambio, 18, 340–345, 1989.
oceanographic data centre, Liverpool, 2003. Mukhopadhyay, A., Mondal, P., Barik, J., Chowdhury, S. M.,
Caesar, J., Janes, T., and Lindsay, A.: Climate projections over Ghosh, T., and Hazra, S.: Changes in mangrove species
Bangladesh and the upstream Ganges–Brahmaputra–Meghna assemblages and future prediction of the Bangladesh
system, under review, Environ. Sci. Process. Imp., in review, Sundarbans using Markov chain model and cellular au-
2017. tomata, Environ. Sci. Process. Imp., 17, 1111–1117,
Delft Hydraulics: Delft3D-FLOW user manual, Delft, the Nether- https://doi.org/10.1039/C4EM00611A, 2015.
lands, 2006. Murty, T. S., Flather, R. A., and Henry, R. F.: The storm surge
Delft Hydraulics: Wind Enhancement Scheme for cyclone mod- problem in the Bay of Bengal, Prog. Oceanogr., 16, 195–233,
elling, Delft, the Netherlands, 2011. https://doi.org/10.1016/0079-6611(86)90039-X, 1986.
Egbert, G. D., Bennett, A. F., and Foreman, M. G. G.: Nash, J. E. and Sutcliffe, J. V.: River flow forecasting through con-
TOPEX/POSEIDON tides estimated using a global ceptual models part I – A discussion of principles, J. Hydrol., 10,
inverse model, J. Geophys. Res., 99, 24821–24852, 282–290, https://doi.org/10.1016/0022-1694(70)90255-6, 1970.
https://doi.org/10.1029/94JC01894, 1994. Pickering, M. D., Wells, N. C., Horsburgh, K. J., and
Goodbred, S. L., Kuehl, S. A., Steckler, M. S., and Sarker, M. Green, J. A. M.: The impact of future sea-level rise on
H.: Controls on facies distribution and stratigraphic preservation the European Shelf tides, Cont. Shelf Res., 35, 1–15,
in the Ganges–Brahmaputra delta sequence, Sediment. Geol., https://doi.org/10.1016/j.csr.2011.11.011, 2012.
155, 301–316, https://doi.org/10.1016/S0037-0738(02)00184-7, Pietrafesa, L. J., Janowitz, G. S., Chao, T. Y., Weisberg, R. H.,
2003. Askari, F., and Noble, E.: The physical oceanography of Pam-
Haarsma, R. J., Hazeleger, W., Severijns, C., Vries, H., Sterl, A., lico Sound, University of North Carolina Sea Grant Publica-
Bintanja, R., Oldenborgh, G. J., and Brink, H. W.: More hurri- tion UNC-WP-86-5, Raleigh, North Carolina, 125 pp., 1986.
canes to hit western Europe due to global warming, Geophys. Pietrafesa, L. J., Bao, S., Yan, T., Slattery, M., and Gayes, P. T.: On
Res. Lett., 40, 1783–1788, https://doi.org/10.1002/grl.50360, Sea Level Variability and Trends in United States Coastal Waters
2013. and Relationships with Climate Factors, Adv. Adapt. Data Anal.,
Haque, C. E.: Atmospheric hazards preparedness in Bangladesh: a 7, 1550005, https://doi.org/10.1142/S1793536915500053, 2015.
study of warning, adjustments and recovery from the April 1991 Sakib, M., Nihal, F., Haque, A., Rahman, M., and Ali, M.: Sun-
cyclone, in: Earthquake and Atmospheric Hazards, Springer, darban as a Buffer against Storm Surge Flooding, World J. Eng.
the Netherlands, 181–202, https://doi.org/10.1007/978-94-011- Technol., 3, 59–64, https://doi.org/10.4236/wjet.2015.33C009,
5034-7_6, 1997. 2015.
Harris, D. L.: Characteristics of the hurricane storm surge, SMRC: The Vulnerability Assessment of the SAARC Coastal
Tech. Pap. 48, US Weather Bureau, Washington, D. C., 139 pp., Region due to Sea Level Rise: Bangladesh Case, Dhaka
1963. SMRC-No. 3, SAARC Meteorological Research Center, Dhaka,
Hearn, C. J.: The dynamics of coastal models, Cambridge Univer- Bangladesh, 2003.
sity Press, Cambridge, 2008.
Heming, J. T., Chan, J. C. L., and Radford, A. M.: A new
scheme for the initialization of tropical cyclones in the UK
www.nat-hazards-earth-syst-sci.net/18/351/2018/ Nat. Hazards Earth Syst. Sci., 18, 351–364, 2018364 M. A. Jisan et al.: Ensemble projection of the sea level rise impact on storm surge Vatvani, D. K., Gerritsen, H., Stelling, G. S., and Rao, A. K.: Cy- Xie, L., Bao, S., Pietrafesa, L. J., Foley, K., and Fuentes, M.: clone induced storm surge and flood forecasting system for India, A real-time hurricane surface wind forecasting model: Formu- in: Solutions to Coastal Disasters ’02, San Diego, CA, 2002. lation and verification, Mon. Weather Rev., 134, 1355–1370, Warrick, R. A., Bhuiya, A. A. H., Mitchell, W. M., Murty, T. S., https://doi.org/10.1175/MWR3126.1, 2006. and Rasheed, K. B. S.: Sea-level Changes in the Bay of Ben- Zhang, K., Liu, H., Li, Y., Xu, H., Shen, J., Rhome, J., gal, in: The Implications of Climate and Sea–Level Change for and Smith, T. J.: The role of mangroves in attenuat- Bangladesh, Springer, the Netherlands, 97–142, 1996. ing storm surges, Estuarine, Coast. Shelf Sci., 102, 11–23, Whitehead, P. G., Barbour, E., Futter, M. N., Sarkar, S., Rodda, https://doi.org/10.1016/j.ecss.2012.02.021, 2012. H., Caesar, J., Butterfield, D., Jin, L., Sinha, R., Nicholls, R., and Salehin, M.: Impacts of climate change and socio- economic scenarios on flow and water quality of the Ganges, Brahmaputra and Meghna (GBM) river systems: low flow and flood statistics, Environ. Sci. Process. Imp., 17, 1057–1069, https://doi.org/10.1039/C4EM00619D, 2015. Nat. Hazards Earth Syst. Sci., 18, 351–364, 2018 www.nat-hazards-earth-syst-sci.net/18/351/2018/
You can also read