Revisiting the Comparison of Public and Private Water Service Provision: An Empirical Study in Portugal - MDPI
←
→
Page content transcription
If your browser does not render page correctly, please read the page content below
water
Article
Revisiting the Comparison of Public and Private
Water Service Provision: An Empirical Study
in Portugal
Rui Cunha Marques *            and Pedro Simões
 CERIS, Instituto Superior Técnico, Universidade de Lisboa, 1049-001 Lisbon, Portugal;
 pedrotsimoes@tecnico.ulisboa.pt
 * Correspondence: rui.marques@tecnico.ulisboa.pt; Tel.: +351-21-841-8305

 Received: 3 May 2020; Accepted: 19 May 2020; Published: 21 May 2020

 Abstract: The controversy between the performance of public and private ownership of water and
 wastewater services is common worldwide. In most cases, this discussion is biased due to ideological
 issues or insufficiency or inconsistency of information. This study aims to compare the performance
 of private water utilities with that of public water utilities, using rich, robust, and audited information
 from Portuguese operators. The benchmarking exercise focuses on three distinct areas, namely,
 the efficiency and effectiveness of the investments made, the quality of service provided, and the
 tariffs and prices implemented. From the analysis performed, it is concluded that, on average, the
 performance of private water utilities exceeds that of public water utilities, and prejudice in most
 cases is unjustified regarding private ownership. Anyway, water, as an essential service, should
 always be provided, regardless of utility ownership.

 Keywords: water and wastewater services; public and private ownership; investments; quality of
 service; tariffs

1. Introduction
      Water and sanitation services (hereafter WSS) are responsible for the provision of essential activities
for the population, society, and the environment, and they make strong contributions to their economic
and social cohesion [1]. Therefore, these services are of high importance and they are structural pillars
for the sustainability and development of societies. Given that these services provide quasi-public
goods, included in the sustainable development goal No. 6 [2] and human right to water [3], they
have a high social value which justifies the adoption of public policies regarding universal service and
service provision with high quality while safeguarding affordable tariffs [4].
      Traditionally, the private sector has had high importance for WSS. Note that, at an early stage, in
the 19th century and at the beginning of the 20th century, the participation of the private sector was
mainly engaged to capitalize on the sector’s know-how and leverage water supply projects to cities,
which were new, innovative, and of large size [5].
      Currently, economists primarily justify the benefits of private provision in WSS with several
economic theories that are easily understandable, such as public choice, property rights, and transaction
costs theories [6]. From an empirical perspective, these theories support the best results and the
efficiency of private ownership, because private managers have greater incentives than public managers
to be efficient and innovative [7]. This can be justified by better salaries, rewards or other benefits
provided to private managers. Conversely, public managers are not so performance (results) based
oriented, because they must act under the severity of the public administration rules [8]. Moreover, the
greater pressure of the shareholders for the results obtained, which is effective in the private sector and

Water 2020, 12, 1477; doi:10.3390/w12051477                                        www.mdpi.com/journal/water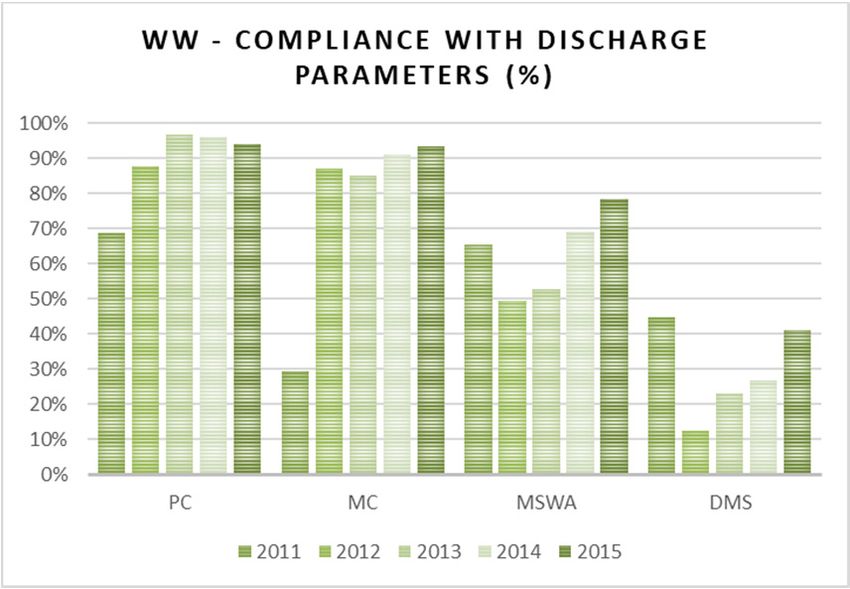
Water 2020, 12, 1477                                                                                   2 of 21

inapplicable in the public sector, can explain this issue, as can the greater flexibility and adaptability of
the operational management under private ownership [9].
     Internationally, it is possible to observe important private sector participation in WSS, although
the contractual arrangements (i.e., concession) found in the Portuguese panorama are not always
adopted elsewhere. Many countries have adopted public-private partnership (PPP) arrangements,
especially BOT (build, operate, and transfer) projects for the construction and operation of water or
wastewater treatment plants when they require high investment and/or specific know-how [10]. The
media has covered a set of unsuccessful cases, as in Buenos Aires in Argentina or Cochabamba in
Bolivia [11], in several countries in Africa, or even in some European countries, pointing to private
companies that are associated with the water sector as devils [12].
     Actually, the protagonists of this debate, either public or private providers, are often surrounded
by prejudice and/or political ideology [13]. Moreover, there are always good and bad examples of
public and private water utilities [14]. However, it is worth questioning why unsuccessful cases have
occurred and whether responsibilities should, in fact, be attributed to private public ownership; i.e.,
among other issues, how can a public entity be incompetent to manage private contracts but competent
to manage the services directly?
     In this scope, it should also be questioned, when comparing the operating performance or the
level of tariffs implemented, whether:

•     the amount of rents (i.e., upfront payments) is removed;
•     the depreciation periods of investments are identical between public and private ownership;
•     the benefits of taxes paid or the use of subsidies by public utilities are accounted for; and,
•     the risk sharing is the same in private and public projects.

     In short, most comparisons in the literature are biased, either because they compare apples with
oranges or because they are filled with ideological content that prevents comparison with the necessary
equity [15].
     In Portugal, among the main reforms of the water sector, the implementation of different
management models of WSS stands out, particularly private sector participation, which became
possible in 1993 after the enactment of Law No. 372 and that had not been allowed since 1974 [16].
Thus, in the past 25 years, there has been a growth in the private sector participation in the water
sector in Portugal, both as a unique shareholder through public service concessions and as a minority
shareholder, through institutional PPPs, commonly known as mixed enterprises [17]. The private
sector has brought several benefits to the Portuguese WSS, for example, capacity and effectiveness of
investment, efficiency and innovation and know-how, the high quality of service provided to the end
user, or even the increased social awareness. However, stakeholders generally feel that they are not
properly recognized by society. Moreover, these results are often ’disguised’ by external factors that go
beyond the private partner itself (such as high upfront rents paid to municipalities).
     From another perspective, different actors have contributed to some instrumentalization of the
public opinion. Whereas this instrumentalization can be legitimate, it can sometimes be motivated by
prejudice, ideologies, or political agendas, suggesting that private ownership provides less efficient WSS
with higher prices and worse quality of service and aims at high profits than public ownership [18,19].
This study was developed with the support of the Association of the Portuguese Companies for
the Environment Sector (AEPSA) and mainly intends to analyze and compare the performance of
public and private ownership of water utilities in Portugal [20]. For this purpose, the effectiveness
of the investments, the quality of service provided, and the tariff levels were compared while using
credible and robust information provided by the Water and Waste Services Regulatory Authority
(ERSAR), complemented by information from other government agencies or sources or from the
operators themselves. Thus, the analysis and evaluation of the performance of the private sector and
a comparison with other management models in Portugal is carried out through the discussion of
three statements or, in other words, through the statistical and factual testing of three hypotheses or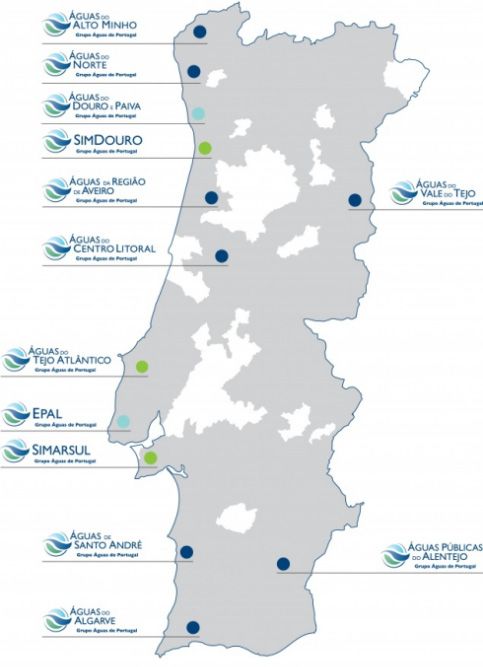
Water 2020, 12, 1477                                                                                  3 of 21

perspectives, which are often considered to be valid by society in relation to the WSS supplied by
private companies:
•     Hypothesis 1 (H1)—investments made by private operators are less productive than those made
      by public operators, with greater waste of resources and less value for money;
•     Hypothesis 2 (H2)—private operators provide a worse quality of service than public operators,
      motivated by the reduction of their expenses and, thus, the maximization of their profits; and,
•     Hypothesis 3 (H3)—private operators apply higher tariffs than public operators, thereby
      maximizing their profits.
     More than estimating whether private management is more efficient than public management or
vice versa, this paper aims to emphasize that, for the sustainable development of the water sector in
Portugal and in any country, all of the management models can be relevant and make their contributions,
and viable and credible options should not be ruled out. After this brief introduction, this article is also
composed of three more sections that address the legal and institutional framework for WSS, compare
the performance between public and private management, and finally summarize the conclusions.

2. Institutional and Regulatory Framework

2.1. Evolution
      Since the 1990s, WSS in Portugal has gone through major developments concerning access, the
quality of service provided, and the market structure. The restructuring of the water sector, which
began in 1993, dealt with unbundling, separating the ”wholesale“ from the ”retail“ segments for
both water and wastewater, opening the sector to private capital and, later, establishing a regulatory
authority dedicated to water services, which has unequivocally marked the progress and quality of the
water sector in Portugal [21]. In this period, for example, water supply coverage grew from 81% to
96% and the water quality test compliance improved from 50% to 99%, whereas, in wastewater, the
coverage level (collection) improved from 28% to 82% and the quality of water resources from 28% to
78% [22].
      Since 1993, the central state administration, through the company Águas de Portugal (AdP), has
assumed an important role in the reform of the water sector in Portugal, especially in its unbundling,
with several regional systems in various regions of the country being created. The system concerns
water supply, addressing availability problems of water resources, as in the Algarve or in the regions
of Porto and Minho, and wastewater treatment, handling significant pollution problems, for example,
in the Estoril Coast or in the Aveiro Region.
      Moreover, in the 1990s, the private sector participation, especially in the ”retail“ systems, grew
and reached considerable levels, although below the expectations, reaching more than a dozen systems
in 2000. From 1998 onwards, several operators have also been created with the enactment of the
municipal companies (MC) laws [23].
      In 2000, the Strategic Plan for Water Supply and Wastewater was published (PEAASAR). This
first plan, which encompassed the period between 2000 and 2006, played a major role not only in
leveraging a new restructuring of the sector, but also in defining objectives and policies to guide
social, environmental, and economically sustainable solutions [24]. After this period, the government
conceived the PEAASAR 2007–2013, addressing and guiding aspects more related to the operational
component and targeting a more rational use of public expenses [25]. Subsequently, a new strategy
was developed in the PENSAAR 2020 (Strategic Plan for Water Supply and Wastewater 2020). Based
on the balance sheet of the previous plans, the PENSAAR 2020 defines a strategy that is based on
sustainability objectives in all its components, including technical, environmental, economic, financial,
and social aspects [21].
      The various reforms and plans were financed by several billion Euros from European funds.
Europe financed the unbundling of systems at an early stage and then financed their merging and was
decisive for the substantive improvement of the main indicators of WSS access and quality of service.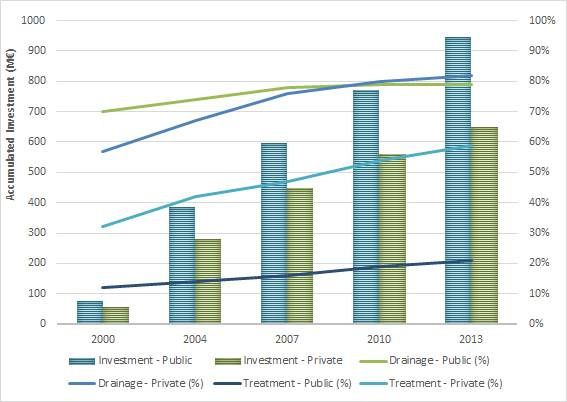
Water 2020, 12, 1477                                                                                4 of 21

     Although the progress of the water sector has been undeniable, there is doubt regarding the added
value from the several billion Euros spent and whether the option or adoption of another development
model, as occurred in Chile or even Spain, would enable even better results or, at least, the same kind
of results at a lower cost.

2.2. Institutional Framework
      Many diverse types of actors coexist in the water sector. At the administration level, roles
are played by the Ministry of the Environment (ME), which is the highest authority for the water
sector, the Water and Waste Services Regulatory Authority (ERSAR), the Portuguese Environment
Agency (APA), and the other structures of the public administration or with responsibility in the sector,
namely, the National Water Council (CNA), the Coordination Commissions for Regional Development
(CCDRs) and Water Resources Regional Administrations (ARHs), the Competition Authority (AC),
and the Court of Auditors (TC). Finally, Águas de Portugal (AdP) has a very important structuring
role in the development of the water sector, along with the municipalities that are the holders of the
services and the private operators that disseminate good practices in the sector and contribute to
increasing coverage.
      Concerning the public policies for the sector, ME stands out as the authority with the most
responsibility for the various policies of the environmental sector, which includes water.
      For regulation, ERSAR is the WSS sector-specific regulator. As part of its tasks, ERSAR is
responsible for supervising, controlling, and regulating WSS, regardless of the management model
adopted, and it is responsible for imposing sanctions on providers that do not comply with the
provisions of the legislation for the sector. Thus, ERSAR’s mission is to ensure three key objectives:
the protection of users’ rights, the economic and financial sustainability of the operators, and the
environmental sustainability [23].
      Regarding environmental regulation, APA aims to create more effective conditions in the
management of environmental and sustainable development policies. The role of this agency is
also to propose, develop, and monitor the implementation of policies concerning the fight against
climate change, and the emission of air pollutants, environmental impact assessment, prevention of
serious risks, integrated control of pollution, and environmental education, ensuring the participation
and awareness of the public and environmental non-governmental organizations (NGOs).
      Additionally, in the area of regulation, AC has transversal powers over the Portuguese economy
for the application of competition rules, along with regulatory bodies in the sector. Furthermore, TC
has the task of supervising the legality and regularity of income and public expenditure, assessing
public financial management, carrying out financial responsibilities, and exercising the other powers
assigned to it by law.
      Other important institutions are CNA, which is an independent consultation body of the Portuguese
government in the field of water resource management, and CCDRs, which are decentralized bodies of
the central administration that hold regulatory power coordination, along with planning, licensing,
and supervision functions, in particular in the case of water abstraction and wastewater discharge, in
addition to being the authorities that are responsible for the management of European Community
funds. However, the Water Law established the creation of ARHs, which cover part of the powers
of CCDRs, in particular to accomplish water management tasks, including planning, licensing, and
supervision, which currently constitute departments of APA.
      The municipalities are the entities that are responsible for WSS and their provision. In this scope,
they may directly or indirectly fulfill their tasks by granting their services to private entities or by
delegating them to third parties, including MC, of public or mixed capital.
      AdP, belonging to the state0 s business sector, is the main business group of the environment sector
in Portugal, providing services to nearly 80% of the population in Portugal. The public company’s
mission is to contribute to solving national problems in the fields of water supply and wastewater.
The AdP Group, in the “wholesale” component, provides services to 234 of the 308 Portuguese
Water 2020, 12, 1477 5 of 21
municipalities and, in the “retail” component, it is responsible for serving water supply and sanitation
to approximately 1,2 million people, which represents more than 10% of the population (AdP website).
Water 2020, 12, x FOR PEER REVIEW 5 of 21
Figure
Water 2020, 12, 1 displays
x FOR the simplified institutional framework for the water sector in Portugal. 5 of 21
PEER REVIEW
Figure 1. Institutional framework of the water sector in Portugal.
Figure 1. Institutional framework of the water sector in Portugal.
Figure 1. Institutional framework of the water sector in Portugal.
2.3. Regulation
2.3.
2.3. Regulation
Regulation
In Portugal, there is a regulatory authority (vertical) for the sector, ERSAR, which has,
In
according Portugal,
In Portugal, thereis is
there
to its Statutes, a regulatory
arelevant
regulatory authority
authority
regulatory (vertical)
(vertical)
functions forall
for thefor
of thethe
sector, sector, which
ERSAR,
management ERSAR, which
has,
models, has,
according
pursuing
according
to its to
Statutes, its Statutes,
relevant relevant
regulatory regulatory
functions for functions
all of the for all of
management the management
models,
the protection of users' rights and safeguarding the sustainability and economic viability of the models,
pursuing the pursuing
protection
the
of protection
users’
systems. rights
ERSAR, of users'
and as rights and
safeguarding
a competent safeguarding
theauthority,
sustainability the
alsoand sustainability
haseconomic andmonitoring
viability
the function of ofeconomic
the systems.viability
and ERSAR,of as
thea
controlling
systems.
drinking ERSAR,
competent as aalso
authority,
water quality. competent authority,
has the function also has the
of monitoring and function of monitoring
controlling drinking waterand quality.
controlling
drinking water
The strategy quality.
strategyofofthethe regulatory model
regulatory that was
model that adopted
was adoptedby ERSAR, which consists
by ERSAR, which ofconsists
an integrated
of an
The strategy
regulatory
integrated approach,
regulatoryof comprises
the regulatory
approach, two model
major
comprises thatmajor
was intervention
intervention
two adopted
plans, oneby ERSAR,
at plans, onewhich
a structural atlevel,consists
regarding
a structural of an
the
level,
integrated
external
regarding regulatory
environment
the externalof approach,
environment comprises
the operators, of and two major
another
the operators, atandintervention
the behavioral
another at theplans,
level, one at alevel,
comprising
behavioral structural level,
thecomprising
regulation
regarding
of
theoperators’ thebehavior
regulation external environment
[26]. behaviorof[26].
of operators’ the operators, and another at the behavioral level, comprising
the regulation of operators’
Figure 2, below,
below, behavior
illustrates
illustrates the [26].of
the scope
scope of ERSAR’s
ERSAR's regulatory
regulatory model
model in in mainland
mainland Portugal.
Portugal.
Figure 2, below, illustrates the scope of ERSAR's regulatory model in mainland Portugal.
Figure
Figure 2. Scope
Scope of
of regulation
regulation of
of the
the Water Waste Services
Water and Waste Services Regulatory
Regulatory Authority
Authority (ERSAR).
(ERSAR).
Figure 2. Scope of regulation of the Water and Waste Services Regulatory Authority (ERSAR).
2.4. Market Structure
2.4. Market Structure
The ownership of WSS belongs to the municipalities, with the exception of the water company
The in
(EPAL), ownership of WSSisbelongs
Lisbon, which to thecase
an atypical municipalities,
and whose with
assetsthe
areexception
held by of
thethe waterstate.
central company
WSS
(EPAL), in Lisbon, which is an atypical case and whose assets are held by the central state.
management, which can be granted or delegated to third parties, has mainly been associated with WSS
management, which can be granted or delegated to third parties, has mainly been associated with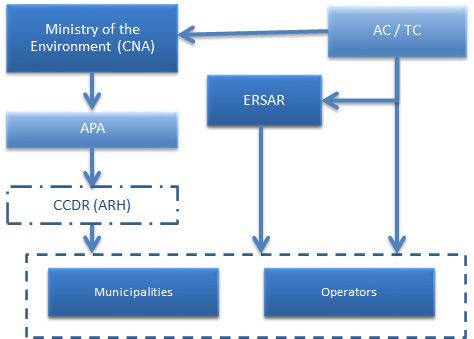
Water 2020, 12, 1477                                                                                                  6 of 21

2.4. Market Structure
     The ownership of WSS belongs to the municipalities, with the exception of the water company
(EPAL),   in Lisbon,
   Water 2020, 12, x FOR which     is an atypical case and whose assets are held by the central state.
                          PEER REVIEW                                                                               6 of 21WSS
management, which can be granted or delegated to third parties, has mainly been associated with the
   the sector.
public public sector.
                 There wasThere nowas   no private
                                    private           management
                                              management        in the in  the water
                                                                        water  sector sector   in Portugal
                                                                                      in Portugal          between
                                                                                                     between         19741993.
                                                                                                               1974 and
   and   1993.
     Since  1993, there has been a proliferation of private sector participation in the WSS. Currently, the
         Since 1993,
private sector          there has
                  (in various        been ainproliferation
                                   ways),       the “retail”ofsegment,
                                                                  private sector  participation
                                                                             provides  servicesintothe  WSS.
                                                                                                      more     Currently,
                                                                                                            than  20% of the
Portuguese population. In addition, corporatization (in which a public entity is governed 20%
   the private    sector   (in various   ways),   in the  “retail”   segment,   provides  services  to more  than        of
                                                                                                                   by private
   the Portuguese population. In addition, corporatization (in which a public entity is governed by
law) has proliferated extensively, with ’wholesale’ services operating on a business basis and “retail”
   private law) has proliferated extensively, with 'wholesale' services operating on a business basis and
services opting for business management models over the years, with particular emphasis on the MC
   “retail” services opting for business management models over the years, with particular emphasis
delegation model.
   on the MC delegation model.
     TheTheawarding
               awarding  ofofWSSWSSprovision
                                      provisionbelongs
                                                   belongs toto the
                                                                 the municipalities
                                                                      municipalitiesbyby    law.
                                                                                         law.      However,
                                                                                                However,      municipalities
                                                                                                           municipalities
maymay
     provide     these   services   in  a  direct way,   through      municipal   services   (that are
          provide these services in a direct way, through municipal services (that are directly manageddirectly managed by
municipal    bodies,    without     administrative      or  financial    autonomy—DMS)
   by municipal bodies, without administrative or financial autonomy—DMS) or through             or through   municipalized
services  (MSWA), services
   municipalized       which have       administrative
                                   (MSWA),       which have andadministrative
                                                                  financial autonomy       and are managed
                                                                                   and financial     autonomy by   their
                                                                                                                 and   areown
boards  of directors,
   managed      by their although
                          own boards   they   do not have
                                           of directors,      legal personality.
                                                         although     they do not have legal personality.
         Municipalities
     Municipalities      cancanalsoalso  delegate
                                    delegate    WSSWSS      provision
                                                      provision          to MCs,
                                                                    to MCs,        seeking
                                                                              seeking a more  a business-oriented
                                                                                                 more business-oriented
                                                                                                                    approach
   approach     and   a  clear  escape    to private  law   [27].  The  provision   might   also  be assigned
and a clear escape to private law [27]. The provision might also be assigned to private entities through       to private
   entities through
concession              concession
             or to public             or of
                               entities   to a
                                             public  entities
                                               different       of a different
                                                           nature    throughnature    through
                                                                                partnership      partnership[28].
                                                                                               agreements     agreements
   [28].
     In Portugal, most municipalities do not provide “wholesale” WSS services, as this service is mainly
         In Portugal, most municipalities do not provide “wholesale” WSS services, as this service is
provided by regional systems that are controlled by the AdP group, even though the municipalities
   mainly provided by regional systems that are controlled by the AdP group, even though the
participate in the companies as minority shareholders. The AdP group comprises 13 companies, of
   municipalities participate in the companies as minority shareholders. The AdP group comprises 13
which 10 provide wholesale services, as shown in Figure 3.
    companies, of which 10 provide wholesale services, as shown in Figure 3.

                              Figure3.3.Companies
                            Figure       Companies of the Águasde
                                                      the Águas dePortugal
                                                                   Portugal  (AdP)
                                                                           (AdP)   group.
                                                                                 group.

         Table 1 presents the organizational structure the “retail” component of WSS, when considering
    the different management models [29].
Water 2020, 12, 1477 7 of 21
Table 1 presents the organizational structure the “retail” component of WSS, when considering
the different management models [29].
Table 1. Management models of the “retail” component of water and sanitation services.
Management Water Wastewater
Model No. Population (103 ) * No. Population (103 ) *
DMS 184 2966 (29.5%) 191 3678 (36.5%)
MSWA 19 2274 (22.6%) 18 2235 (22.2%)
MC 23 1793 (17.8%) 23 1796 (17.8%)
Private operators 28 1971 (19.6%) 23 1714 (17.0%)
Other models 4 ** 1043 (10.5%) 2 *** 647 (6.3%)
Total 258 10.070 257 10.070
* Census 2011 population; ** EPAL, Águas do Norte, Águas da Região de Aveiro (AdRA) and Águas de Santo André
(AdSA); *** Águas do Norte and AdRA.
In Portugal, WSS are mostly unbundled. Thus, the “wholesale” and “retail” systems, both for water
supply and wastewater, are usually provided by different operators. Concerning horizontal integration,
there are different situations both for services in the “wholesale” and in the “retail” segments.
In the “wholesale” services, due to the high investment costs in infrastructure and the clear
benefits that exist in exploiting economies of scale, there is a high degree of horizontal integration,
with a few examples of companies providing services at the municipal level (e.g., ICOVI, Águas da
Serra and Águas de Santo André). Concerning the “retail” services, the conditions are not favorable to
regional management, so there is a low level of horizontal integration, with only eight entities (by the
end of 2018) providing water services on a regional basis [29] although the creation of several regional
entities is underway.
As far as the provision of “retail” services is concerned, most of the time, operators provide water
and wastewater services together. They sometimes also include municipal waste management services
and, less often, transport or other activities.
2.5. Major Figures
The reforms of the water sector in Portugal in the last 25 years led to very interesting results.
Although, as stated, the value for money might not have been the best, there was a noteworthy progress
in the water sector. Taking the audited and credible data of the Portuguese regulator ERSAR into
account (see its website and its annual reports on the Portuguese water sector status-quo), currently,
the water supply coverage is about 96% when it was a little bit higher than 80% in the 90’s. More
than 567 mil water tests were performed in the last year, with a score of 98.72% of conformity. In
the 90’s, the conformity percentage was approximately 60%. The number of water sources reduced
substantially and, currently, they mostly consist of surface water of large dimension and the systems
are much more robust and resilient. Particularly in the South, where the weather is more adverse
and the climate change effect has been worse, for example, in the tourist region of the Algarve water
scarcity has no longer taken place. The water production in 2019 was about 782 hm3 , from those 573
hm3 were billed, corresponding to about 29% of water losses. In the 90’s, water losses reached almost
50%. The existing assets were ageing and the mains replacement level was near 0%. Nowadays, the
replacement level of more than 110 thousand km of existing mains is nearly 1%. In 2019, the per capita
consumption was 192 liter per inhabitant and per day. The improvement in wastewater services was
even more significant. The wastewater collection and treatment coverage is approximately 83% and in
the 90’s was less than 50%. The remaining population is isolated and served by individual systems.
Currently, about 1.5 million of sewage is conveniently treated per day according to the EU legislation
in the wastewater treatment plants. Finally, the household charges with WSS for a consumption ofWater 2020, 12, 1477 8 of 21
10 m3 was 23.98 € in 2019, which represented a high affordability, being less than 1% of the monthly
average of the household income.
3. Performance of the Public and Private Sectors
3.1. Overview
In Portugal, the provision of these services may be the responsibility of different operators, with
either public or private ownership. However, there is the biased idea that water services are always
very profitable activities and their provision by private entities is achieved with lower quality and
performance and with excessive profits [30,31].
This idea that prevails in Portuguese society and internationally has no substantive basis.
Performance studies and analyses (including, for example, studies promoted by the regulator itself) do
not conclude that the performance of private operators is lower, but quite the contrary [15,32].
In a recent audit, the TC raised a number of issues that had consequences for the image and
credibility of the private management model in Portugal, although criticism was not the intention,
since the issues were not different from those that were addressed in other audits of public entities. In
spite of that, at no time does the TC state that private management should not be implemented or that
it shows a worse performance than public management [33].
Hence, the aim of this article was to test the three hypotheses or perspectives that were mentioned
in the introduction concerning effectiveness of investments (H1), quality of service provided (H2), and
tariffs adopted (H3). This was done in the clearest possible way while using information based on
the RASARP published by ERSAR [34]. In some cases, and to analyze the most updated information,
the most recent accounts reports of the operators and other complementary information were also
examined. Therefore, the performance comparison of the sample of private companies with those
of different management models using statistical analysis provides evidence of the most efficient
management model. The three different hypotheses for diverse perspectives (investments, quality of
service, and tariffs) aim to avoid and counterweight that a good performance in a particular perspective
can be compensated by the lower or higher performance in other perspective, for example, a higher
level of quality of service and a higher tariff.
3.2. Analysis of the Investments Made (H1)
Stakeholders, in general, see private companies as investing poorly, often overvaluing the estimates
of investments or making investments that are not useful in an attempt to take advantage of their
implementation, given that some of the companies belong (or belonged) to or have preferential relations
with the construction industry [35].
These arguments do not get much support, since all investments are approved by the holder
(municipality) and are subject to the opinion of the regulatory agency, in addition to the fact that
some of the companies see these investments in infrastructure as a cost. Besides, these companies are
generally responsible for the operation and maintenance of investments, and the investments made
must be efficient and effective.
Thus, hypothesis or perspective 1 (H1) considers that the investments made by private operators
show lower productivity than those that are made by public operators, denoting a greater waste of
resources and a lower value for money. Accounting for this thesis, the effectiveness and efficiency of
investments made both by the private and the public sectors were analyzed. Note that the analysis of
investments was focused on the period between 2000 and 2013 (for PEAASAR I and II). Nevertheless,
the main source of information refers to PENSAAR 2020 (pp 38 and 52), where the values of investment
made in the WSS in the “retail” segment by both the private and public sectors are detailed, while
assuming that this investment is continuous and that the invested amounts are constant in the period
considered and with slightly different percentages for water supply (40%) and wastewater (60%). The
size of the public and private sectors is also taken into account.Water 2020, 12, 1477 9 of 21
It is necessary to assess not only the amount spent, but also the evolution of the WSS level of
coverage in order to analyze the effectiveness and efficiency of the investment made.
Despite the significant growth of the private sector in the water sector in Portugal, currently
reaching approximately 20% of the population, the investment per inhabitant by the private sector
seems to be significantly higher than that by the public sector, as shown in the following Tables 2 and 3.
Table 2. Investments made and efficiency of investments in water service.
Water Investment Expenditure by Increase in
(2000–2013) (106 €) Coverage/Inhabitant (€/inhab.)
Private 433,92 1.10325
Public 630,80 1.15398
Table 3. Investments made and efficiency of investments in wastewater service.
Wastewater Investment Expenditure by Increase in
(2000–2013) (106 €) Coverage/Inhabitant (€/inhab.)
Private 650.88 763.08
Public 946.20 893.55
The analysis of Tables 2 and 3 shows that although the private sector serves only approximately
20% of the population, it has a level of investment that is very close to that of the public sector. This
analysis identified the values of 1085 M€ for the private sector and 1577 M€ for the public sector. This
means that despite the lower population served, the private sector is able to achieve a relative weight
of nearly 40% of the total investment made.
Thus, there appears to be greater effectiveness and efficiency in the accomplishment of investments
in WSS by the private sector, while taking the lower expenditure made for an increase in coverage into
account (€/inhabitant). Although this difference is significant, it would be much greater if European
Union funding were considered, which, as pointed out, constituted the lion’s share of investments in
the public sector and were virtually insignificant in the private sector.
The large investment made by private operators has been reflected, as expected, in an accelerated
growth in their coverage over the period 2000–2013, with increases of 23%, 25%, and 27% in the level
of coverage of water service, wastewater collection, and wastewater treatment, respectively.
The public sector, in turn, has lower WSS coverage growth values, which can also be explained, at
least partially, by several factors, including the starting level, the capacity to make investment in the
sector, and the type of investments made.
Regarding the starting level, in 2000, the average level of coverage of the public sector was
already much higher than that observed in the private sector, instigated by the (almost total) public
management in the metropolitan regions of Lisbon and Porto. This was also one of the reasons that
justified the private sector participation in some municipalities with very low levels of coverage.
This might mean that, for the increase in coverage, investments may be higher (infrastructure
in the most rural areas), and some of these investments may end up having another aim beyond
increasing coverage (which includes the network optimization, etc.). Figure 4 illustrates the evolution
of the investment made and the WSS coverage by management model in the period between 2000
and 2013.Water 2020, 12, 1477 10 of 21
Water 2020, 12, x FOR PEER REVIEW 10 of 21
Figure 4.4. Evolution
Figure Evolutionofofwater
water service
service coverage
coverage (left)
(left) andand wastewater
wastewater (right)
(right) and ofand
the of the investments
investments made.
made.
While analyzing the figure mentioned, there is a much faster growth in the level of coverage by
After
private examining
operators thepublic
than by previous Tables (2 and 3) and Figure 4 and with the abovementioned
operators.
cautions,
After itexamining
seems possible to confirm
the previous Tables the
2 andevidence that the
3 and Figure 4 and private operators
with the are, in fact,
abovementioned more
cautions,
effective and more efficient in carrying out investments in WSS, with lower expenditures
it seems possible to confirm the evidence that the private operators are, in fact, more effective and per
inhabitant and per percentage of increase in service coverage in both water and wastewater
more efficient in carrying out investments in WSS, with lower expenditures per inhabitant and per services.
The savingsofofincrease
percentage resources inby the private
service sector,
coverage per inhabitant,
in both water and as observed, services.
wastewater are close to
The5%savings
for water
of
services and 15% for wastewater services.
resources by the private sector, per inhabitant, as observed, are close to 5% for water services and 15%
Thus, when
for wastewater considering the analysis of the investments made and their effects in increasing
services.
WSSThus,
coverage, it is possible to
when considering thereject H1, of
analysis given the evidencemade
the investments that and
private
theiroperators
effects inhave been more
increasing WSS
effective and efficient in implementing planned investments than public sector operators.
coverage, it is possible to reject H1, given the evidence that private operators have been more effective
and efficient in implementing planned investments than public sector operators.
3.3. Analysis of the Quality of Service (H2)
3.3. Analysis of the Quality of Service (H2)
Another myth regarding the water sector in Portugal concerns the quality of service provided
by private
Another operators. It is commonly
myth regarding the watersaid that
sector in private
Portugalcompanies
concerns the aimquality
for profit, meaning
of service that the
provided by
best way
private to increase
operators. It isorcommonly
guaranteesaid profit
thatisprivate
by saving resources
companies aimwhile reducing
for profit, the quality
meaning that theof service
best way
provided.
to increaseThis assertion profit
or guarantee revealsis some prejudice,
by saving and while
resources it is strongly
reducing ideological
the quality[36,37].
of service provided.
First, a poor
This assertion or worse
reveals quality of and
some prejudice, service
it is does not ideological
strongly necessarily [36,37].
lead to lower expenses. Usually,
whatFirst,
is observed
a poor or is worse
precisely the opposite,
quality of servicesince
does the
not operational
necessarily leadexpenses (OPEX)
to lower increases
expenses. (e.g.,
Usually,
majorisbursts,
what observedinterruptions,
is precisely and water losses).
the opposite, sinceSecond, the regulatory
the operational expenses agency
(OPEX)regulates
increasesthe(e.g.,
quality of
major
service,interruptions,
bursts, and the standards are established
and water losses). Second,by contract, so performance
the regulatory is not exclusively
agency regulates the quality aofresult
service,of
the choices
and of private
the standards managers, which
are established are constrained
by contract, by legal
so performance andexclusively
is not contractuala requirements.
result of the choices
Finally,
of private what iswhich
managers, suggested is precisely
are constrained the and
by legal opposite; that requirements.
contractual is, due to prejudice, political
interference, and isa suggested
Finally, what preconceived public the
is precisely image, private
opposite; thatcompanies have additional
is, due to prejudice, politicalincentives
interference, to
provide
and a high quality
a preconceived of service
public image,and, therefore,
private companiesa better quality
have of service
additional should to
incentives beprovide
expecteda fromhigh
these entities.
quality of service and, therefore, a better quality of service should be expected from these entities.
Thus, the assessment of hypothesis or perspective perspective 2 (H2), which assumes that private operators
provide aaworse
provide worse quality
quality of service
of service to customers
to customers than operators,
than public public operators,
indicatesindicates
that privatethat private
operators
operators
may may be to
be motivated motivated
reduce theirto reduce
operating theirandoperating and capital
capital expenses and,expenses and, thus,
thus, maximize theirmaximize
profits.
theirThe
profits.
analysis of this perspective was developed using a set of key performance indicators
(KPIs)Theforanalysis of this
the various perspective
WSS management was developed using a setthe
models, comprising of key performance
different indicators
perspectives (KPIs)
of services
for the various
provision, such asWSS management
the protection models,
of users’ comprising
interests, the different
the financial sustainabilityperspectives of services
of the operator, and
provision, suchsustainability.
environmental as the protection of users' interests, the financial sustainability of the operator, and
environmental sustainability.
The set of KPIs adopted fundamentally comprises the KPIs used by ERSAR, taking into account
The set of KPIs adopted fundamentally
the reference values (benchmarks) comprises the KPIs
that were recommended by thatused by ERSAR,
entity and the taking
weightedintoaverages.
account
the sample
The reference valuesall(benchmarks)
includes that were
the mainland country, onlyrecommended
excluding theby that (have
islands entitya different
and the regulator)
weighted
averages.
and a coupleTheofsample includes
outliers. Table 4all the mainland
below shows thecountry,
selectedonlyKPIs.excluding the islands (have a different
regulator) and a couple of outliers. Table 4 below shows the selected KPIs.Table 4. Quality of service assessment indicators.
KPI
Water Wastewater
Physical accessibility (%) Physical accessibility (%)
Water 2020, 12, 1477 11 of 21
Reply to written suggestions and complaints (%) Reply to written suggestions and complaints (%)
Mains failures (No./1.000 connections) Flooding occurrences (No./1.000 connections)
Energy efficiency [kWh/(m 3.100 m)] Energy
Table 4. Quality of service assessment efficiency [kWh/(m3.100 m)]
indicators.
Safe water (%) Compliance with discharge parameters (%)
Non-revenue water (%) KPI
Water losses on mains
Water [l/(km.h)] Wastewater
Physical accessibility (%) Physical accessibility (%)
3.3.1.Reply
Coverage Level
to written suggestions and complaints (%) Reply to written suggestions and complaints (%)
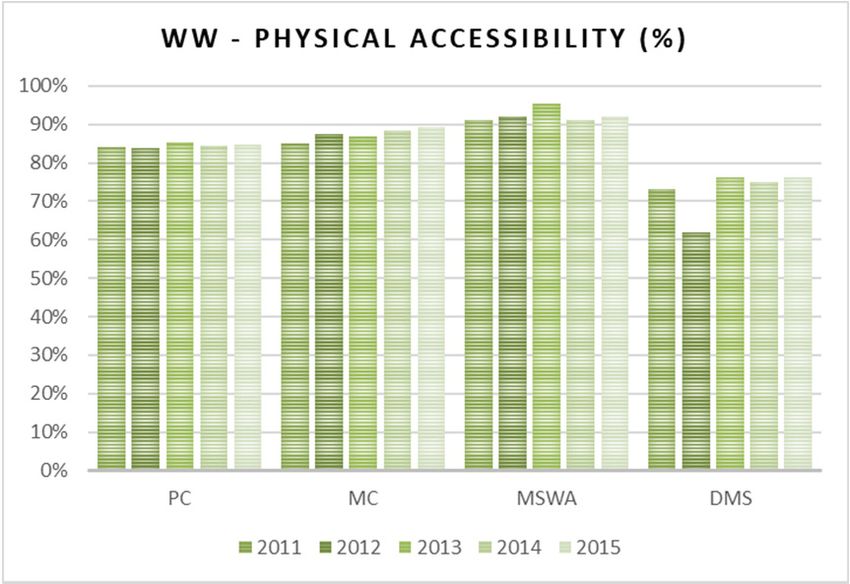
The Mains failures
coverage (No./1.000
level, usingconnections)
the indicator of Flooding
physical occurrences (No./1.000
accessibility, aims connections)
to evaluate the
Energy efficiency [kWh/(m3 ·100 m)] Energy efficiency [kWh/(m3 ·100 m)]
population's access to WSS through the total number of households connected. Figure 5 illustrates
Safe water (%) Compliance with discharge parameters (%)
the evolution ofNon-revenue
the indicatorwater
between
(%) 2011 and 2015. The annual reports of ERSAR are the source
for the data. Water losses on mains [l/(km·h)]
As expected, the investment in coverage expansion in the rural environment does not have the
same effect as that
3.3.1. Coverage Levelin urban areas. In this sense, ERSAR recommends different reference levels,
depending on the features of the region (urban or rural). Thus, ERSAR considers that, in
The coverage
predominantly level,areas,
urban using operators
the indicator of physical
must have a accessibility, aims
coverage level oftoatevaluate
least 95%the and
population’s
that, in
access to WSS through the total number of households connected. Figure 5 illustrates the evolution
predominantly rural areas, they must have a coverage level of at least 80%, while for wastewater the of
the indicator
values are 90%between
and 70%,2011 and 2015. The annual reports of ERSAR are the source for the data.
respectively.
Figure
Figure 5.
5. Evolution
Evolution of
of coverage
coverage levels
levels in
in water
water (left)
(left) and
and wastewater
wastewater services
services (right).
(right).
By
As analyzing
expected, Figure 5, it seems
the investment in that there was
coverage a clearin
expansion effort of all environment
the rural the operators does
to achieve the
not have
targets that were proposed by ERSAR, since nearly all of them, on average,
the same effect as that in urban areas. In this sense, ERSAR recommends different reference levels, obtained the
classification
depending onof 'good'
the in the
features indicator
of the region for water
(urban service,Thus,
or rural). although
ERSAR some exceptions
considers that, remain.
in predominantly
urbanHowever, the focusmust
areas, operators is onhave
the private sector,
a coverage whose
level of atactivity
least 95%takes place
and mostly
that, in rural areas
in predominantly (as
rural
compared to public operators) and ends up presenting a level of coverage that is
areas, they must have a coverage level of at least 80%, while for wastewater the values are 90% and very close to the
reference level for predominantly urban areas (i.e., almost 95%). Thus, this seems to indicate a better
70%, respectively.
performance of the
By analyzing private
Figure 5, itoperators
seems thatconcerning
there was athe water
clear effortservices coverage
of all the operators level. The same
to achieve the
scenario can be observed for wastewater, even though the results, in general, are
targets that were proposed by ERSAR, since nearly all of them, on average, obtained the classification worse for all
operators.
of ’good’ in the indicator for water service, although some exceptions remain.
However, the focus is on the private sector, whose activity takes place mostly in rural areas (as
3.3.2. Customer
compared Service
to public operators) and ends up presenting a level of coverage that is very close to the
reference level for predominantly
Customer service is evaluated urban areas (i.e.,
by means of thealmost 95%).
ERSAR’s Thus, this
indicator seems to
response to indicate a better
complaints and
performance
suggestions, of the private
which can beoperators
observedconcerning
through thethewater services coverage
management level. The
of complaints andsame scenario
suggestions
can be observed
received and duly forforwarded.
wastewater,Figure
even though the results,
6 illustrates in general,
the evolution are indicator.
of this worse for all
Dataoperators.
are based on
ERSAR’s annual reports (RASARP).
3.3.2. Customer Service
Customer service is evaluated by means of the ERSAR’s indicator response to complaints and
suggestions, which can be observed through the management of complaints and suggestions received
and duly forwarded. Figure 6 illustrates the evolution of this indicator. Data are based on ERSAR’s
annual reports (RASARP).Water 2020, 12, 1477 12 of 21
Water 2020, 12, x FOR PEER REVIEW 12 of 21
Water 2020, 12, x FOR PEER REVIEW 12 of 21
Figure 6.
Figure 6. Customer service
Customerservice
6. Customer in
servicein water
inwater (left)
water(left) and
(left) and wastewater
and wastewater services
wastewater services (right).
services (right).
(right).
Figure
Since
Since these
these are essential public
are essential public services,
services, it
it is
is recommended
recommended that that the
the users
users′0 requirements
requirements and and
Since these are essential public services, it is recommended that the users′ requirements and
complaints
complaints are adequately treated. Therefore, a ’good’ performance level, according to ERSAR, is
are adequately treated. Therefore, a 'good' performance level, according to ERSAR, is
complaints are adequately treated. Therefore, a 'good' performance level, according to ERSAR, is
assigned
assigned when
when thethe operators
operators respond
respond toto all
all of
of the
the complaints
complaints andand suggestions
suggestions from
from users
users inin due
due time
time
assigned when the operators respond to all of the complaints and suggestions from users in due time
(i.e., 100%
(i.e., 100% response).
response). In turn,
In turn,
turn, thethe average
the average performance
average performance
performance is is assigned
is assigned between
between 85% 85% and
and 100%.
100%.
(i.e., 100% response). In assigned between 85% and 100%.
By analyzing
By analyzing Figure
analyzing Figure
Figure 6, 6, it can
6, itit can be
can be observed
be observed that
observed that no
that no management
no management model,
management model,
model, on on average,
on average, reaches
average, reaches
reaches the the
the
By
'good'
’good’ level
level of
of performance.
performance. However,
However, the
the private
private sector
sector stands
stands out
out as
as the
the only
only sector
sector that,
that, during
during
'good' level of performance. However, the private sector stands out as the only sector that, during
the period
the period under
period under review,
under review,
review, hashas always
has always increased
increased the
the quality
quality of
of service
service and,
and, inin 2015,
2015, only three
only three
three ofof the
of the 29
the 29
29
the always increased the quality of service and, in 2015, only
operators
operators did did not achieve the “good” level of performance, showing higher concern for the issues
operators did not
not achieve
achievethe the“good”
“good”level
levelofof
performance,
performance, showing
showinghigher
higherconcern
concernfor for
the the
issues and
issues
and problems
problems identified
identified by itsbyusers.
its users.
and problems identified by its users.
3.3.3. Service
Service Failures
Failures
3.3.3. Service Failures
Concerning watersupply,
Concerning water supply,service
service failures
failures areare evaluated
evaluated by means
by means of a whose
of a KPI, KPI, whose
aim isaim is to
to assess
Concerning water supply, service failures are evaluated by means of a KPI, whose aim is to
assess the frequency
the frequency of interruptions.
of interruptions. Figure 7Figure
shows 7the
shows the performance
performance evolutionevolution of the
of the various various
operators.
assess the frequency of interruptions. Figure 7 shows the performance evolution of the various
operators. ERSAR’s
ERSAR’s annual annual
reports arereports
the dataare the data source.
source.
operators. ERSAR’s annual reports are the data source.
Figure 7. Evolution of water supply failures.
Figure 7. Evolution of water supply failures.
Figure 7. Evolution of water supply failures.
For this KPI, the reference level of ERSAR is the occurrence of one failure per 1000 connections,
For this
this KPI,
Foraverage the
the reference
referenceislevel
KPI,performance level of
of ERSAR
ERSAR is
is the
the occurrence
occurrence of
of one
onefailure
failure per
per1000
1000 connections,
and the defined by the results that were achieved between 1 andconnections,
2.5 failures
and
and the
the average
average performance
performance is
is defined
defined byby the
the results
results that
that were
were achieved
achieved between
between 1 1
and and
2.5 2.5 failures
failures per
per 1000 connections. In this context, both private operators and MCs show good performance.
per
1000 1000 connections.
connections. In this
In thissector
context,context,
both both
private private
operators operators and MCs show good performance.
However, the private once again stands out, asand MCs show
it mainly good performance.
operates in rural areas. However,
This is
However,
the private the private
sector once sectorstands
again once again
out, asstands
it mainly out, as it mainly
operates in rural operates
areas. in isrural
This areas.
another signThis is
of the
another sign of the quality of the operation and maintenance carried out by private operators and of
another
quality sign of the
of the operationquality of the operation
and maintenance and maintenance carried out by private operators and of
the effectiveness of the investments made.carried out by private operators and of the effectiveness of
the effectiveness
the investments of the
made. investments made.
As far as wastewater service is concerned, the KPI relative to floods aims to evaluate the
As
As farasaswastewater
far wastewater service
service is concerned,
is concerned, therelative
thenetwork.
KPI KPI relative toaims
floods aims tothe evaluate the
occurrence of floods originating in the drainage Theto floods
ERSAR's to evaluate
reference value for occurrence
this KPI is
occurrence
of floods of floods originating
originating in the in the drainage
drainage network. The ERSAR's reference value
thisfor this KPI
thatisa
that a maximum of 0.25 floods occurnetwork.
per yearThe for ERSAR’s
every 1000 reference value In
connections. for turn, KPI
the isaverage
that a maximum of 0.25 floods occur per year for every 1000 connections. In turn, the average
performance is defined by the occurrence of floods between 0.25 and one per 1000 connections.
performance is defined by the occurrence of floods between 0.25 and one per 1000 connections.
Figure 8 illustrates the evolution of this indicator for the different operators. The annual reports of
Figure 8 illustrates the evolution of this indicator for the different operators. The annual reports of
ERSAR are the source for the data.
ERSAR are the source for the data.Water 2020, 12, x FOR PEER REVIEW 13 of 21
Water 2020, 12, 1477 13 of 21
maximum of 0.25 floods occur per year for every 1000 connections. In turn, the average performance is
defined by the occurrence of floods between 0.25 and one per 1000 connections. Figure 8 illustrates the
evolution of this indicator for the different operators. The annual reports of ERSAR are the source for
the data.
Water 2020, 12, x FOR PEER REVIEW 13 of 21
Figure 8. Evolution of floods in wastewater service.
It is observed that none of the management models, on average, are able to reach the level of
performance considered to be satisfactory (by ERSAR), and this is a situation that, of course, should
be reviewed and improved. Despite the negative performance of most operators, a generally
positive evolution of private operators is noticeable, in contrast with the trend shown by the other
operators. Moreover, the best results are achieved by the private sector alongside the MCs.
3.3.4. Energy Efficiency
Energy efficiency aimsFigure to assess the level
8. Evolution of of use in
floods ofwastewater
energy resources
service. by operators, particularly
Figure 8. Evolution of floods in wastewater service.
the energy consumption that is necessary to pump water or wastewater. Figure 9 shows the
performance
It
It is evolution
observed
is observed thatof
that the energy
none
none of
of the efficiency indicator.
the management
management models,
models, on on average,
average, are are able
able to
to reach
reach the
the level
level of
of
A good
performance level
performance considered of
consideredtoperformance
tobe for
besatisfactory
satisfactory(bythis indicator
(byERSAR),
ERSAR),and in the
andthis
this water
is is service,
a situation
a situation in
that,
that, accordance
of of course,
course, with
should
should be
ERSAR’s
be reviewed
reviewed guidelines,
and and is achieved
improved.
improved. when
Despite
Despite the
theoperators
the negative negative are able toof pump
performance
performance 1most
m3 of operators,
mostofoperators, water over a100
a generally meters,
generally
positive
consuming
positive a maximum
evolution of of
private0.4 kWh
operatorsof electricity
is (and
noticeable, a
in minimum
contrast of
with 0.27
the kWh).
trend
evolution of private operators is noticeable, in contrast with the trend shown by the other operators. In turn,
shown the
by average
the other
performance
operators. level
Moreover, Moreover, is determined
the best
the best results by energy consumption
results arebyachieved
are achieved by the
the private between
private
sector 0.4 and
sectorthe
alongside 0.54
alongside kWh
MCs. the MCs.per m 3 and per
100 meters head. For wastewater, the values are 0.45 and 0.45 and 0.68 kWh per m3 and per 100
3.3.4. Energy
meters Efficiency
head, respectively.
Energy
Figure 9 shows that the different operators, on average, are not able to achieve a “good”
Energy efficiency
efficiencyaims
aimstotoassess
assessthethelevel
levelofof use
use of of energy
energy resources
resources by by operators,
operators, particularly
particularly the
performance in this indicator. Additionally, private sector performance should be emphasized,
the energy consumption that is necessary to pump water or wastewater.
energy consumption that is necessary to pump water or wastewater. Figure 9 shows the performance Figure 9 shows the
because despite not achieving a “good” performance rating, on average, it has the best result among
performance
evolution of the evolution
energy of the energy
efficiency efficiency indicator.
indicator.
all management models. Data are based on ERSAR’s annual reports.
A good level of performance for this indicator in the water service, in accordance with
ERSAR’s guidelines, is achieved when the operators are able to pump 1 m3 of water over 100 meters,
consuming a maximum of 0.4 kWh of electricity (and a minimum of 0.27 kWh). In turn, the average
performance level is determined by energy consumption between 0.4 and 0.54 kWh per m3 and per
100 meters head. For wastewater, the values are 0.45 and 0.45 and 0.68 kWh per m3 and per 100
meters head, respectively.
Figure 9 shows that the different operators, on average, are not able to achieve a “good”
performance in this indicator. Additionally, private sector performance should be emphasized,
because despite not achieving a “good” performance rating, on average, it has the best result among
all management models. Data are based on ERSAR’s annual reports.
Figure
Figure 9.
9. Evolution
Evolutionof
of energy
energy efficiency
efficiency in
in water
water (left)
(left) and
and wastewater
wastewater services
services (right).
(right).
3.3.5.ANon-Revenue
good level ofWater
performance for this indicator in the water service, in accordance with ERSAR’s
guidelines,
The non-revenue when
is achieved waterthe operators
indicator areto
tries able to pump
reflect 1 m3 of
the level ofwater overand
financial 100 meters,
physicalconsuming
losses of
a maximum of 0.4 kWh of electricity (and a minimum of 0.27 kWh). In turn, the average
water that enters into the system and that is not billed to customers. Figure 10 illustrates the performance
level is determined
evolution by energy
of the indicator consumption water
for non-revenue between
by 0.4
theand 0.54 kWh
various per m3 and
management per 100 meters head.
models.
3
For wastewater, the values are 0.45 and 0.45 and 0.68 kWh per m and per 100 meters head, respectively.
Figure 9 shows that the different operators, on average, are not able to achieve a “good” performance
in this indicator. Additionally, private sector performance should be emphasized, because despite
Figure 9. Evolution of energy efficiency in water (left) and wastewater services (right).
3.3.5. Non-Revenue Water
The non-revenue water indicator tries to reflect the level of financial and physical losses of
water that enters into the system and that is not billed to customers. Figure 10 illustrates theYou can also read