Water Conservation Plan Update 2021 - City of Moab
←
→
Page content transcription
If your browser does not render page correctly, please read the page content below
Water Conservation Plan Update 2021
City of Moab
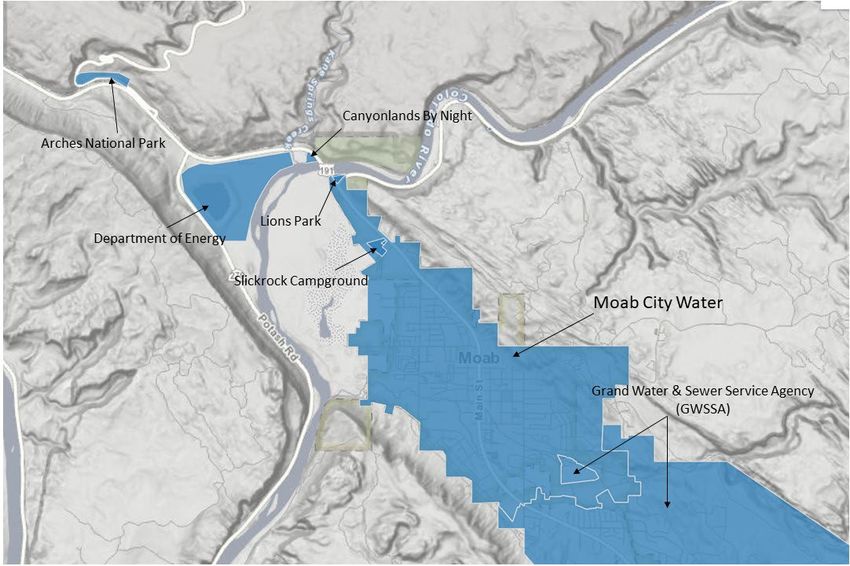
Table of Contents
INTRODUCTION ............................................................................................................................... 3
SECTION 1: SYSTEM PROFILE .......................................................................................................... 4
  1.1 History, Government and Population ................................................................................... 4
  Fig 1. Projected Population Growth ........................................................................................... 4
  1.2 Water governance structure**............................................................................................. 5
  Fig. 2 Map of Current Service Area ............................................................................................. 5
  1.3 Water Distribution System.................................................................................................... 6
  Fig. 3 Number and Type of Connections in 2020........................................................................ 6
  1.4 Water Treatment System...................................................................................................... 6
SECTION 2: SUPPLY ......................................................................................................................... 6
  2.1 Sources – Aquifers, Surface Water, and Water Rights ......................................................... 6
     2.1.1 History ** ....................................................................................................................... 6
     2.1.2 Aquifer and surface water descriptions and maps** .................................................... 6
  Table 1. SUPPLY CATEGORIZED BY TYPE of SOURCE** .............................................................. 7
  2.2 Secondary Water (Irrigation Sources)................................................................................... 7
     2.2.1 Moab Irrigation Company .............................................................................................. 7
     2.2.2 The Colorado River ......................................................................................................... 8
  2.3 Water Rights** ..................................................................................................................... 8
SECTION 3: WATER MEASUREMENT............................................................................................... 8
  3.1 Water Measurement Methods and Practices** .................................................................. 8
SECTION 4: SYSTEM WATER LOSS ................................................................................................... 8
  4.1 Water Loss ............................................................................................................................ 8
  4.2 Leak Detection and Repair .................................................................................................... 9
SECTION 5: WATER USE ................................................................................................................ 10
  5.1 Water Use ........................................................................................................................... 10
     Fig. 3 Water Use by Sector and Year..................................................................................... 10
     Table 2. Potable vs. Non-Potable Water Use ........................................................................ 10
     5.1.1 Water Use – Permanent Residents .............................................................................. 11
     Fig. 3 Population vs Water Use ............................................................................................. 11
     Fig. 6 Gallons per Capita per Day by Type ............................................................................ 12
     Table 3. Gallons per Capita per Day 2005 - 2020.................................................................. 12
     5.1.2 Water Use – Visitors .................................................................................................... 13
  5.2 Water Production and Projections** ................................................................................. 13
     Fig. 4 Water Produced by Source / Year ............................................................................... 13
     Fig. 4 Water Production Trends by Source ........................................................................... 14
  5.3 Billing................................................................................................................................... 14
SECTION 6: WATER CONSERVATION............................................................................................. 16
  6.1 Introduction ........................................................................................................................ 16
  6.2 Water Use Reduction Goal ................................................................................................. 16
  6.3 Water Conservation Metric ................................................................................................ 17
6.4 Current Conservation Measures ......................................................................................... 17
6.5 Current Conservation Ordinances and Standards .............................................................. 18
6.6 New Conservation Measures for the Next Five Years ........................................................ 18
6.6.1 Planning Efforts** ........................................................................................................ 18
6.6.2 Ordinances and Policies ............................................................................................... 18
6.6.3 City Facilities Improvements ........................................................................................ 19
6.6.4 Outreach and Education .............................................................................................. 20
6.6.5 Programs ...................................................................................................................... 20
6.7 Responsibility for Meeting Conservation Goals ................................................................. 21
6.8 Action and Implementation Timeline ................................................................................. 21
SECTION 7: ECOLOGICAL CONCERNS ............................................................................................ 21
7.1 Introduction ........................................................................................................................ 21
7.2 Matheson Wetlands............................................................................................................ 22
7.3 Mill Creek ............................................................................................................................ 22
7.4 Pack Creek ........................................................................................................................... 22
SECTION 8: OTHER CONSIDERATIONS .......................................................................................... 23
8.1 Colorado River .................................................................................................................... 23
8.2 Water Banking .................................................................................................................... 23
Acknowledgements
This plan was written as a joint effort between City Staff and the Water Conservation and
Drought Management Advisory Board. City staff included Mila Dunbar-Irwin, Chuck Williams,
Mark Jolissaint, Levi Jones, Marcy Mason and Ben Billingsley. Contributors from the Water
Conservation and Drought Management Board were Jeremy Lynch, Eve Tallman, Arne
Hultquist, Mike Duncan, Kara Dohrenwend, and Steve Getz. Other contributors include Elaine
Gizler and Dave Engleman.INTRODUCTION The City of Moab 2021 Water Conservation Plan has been prepared to comply with the Utah Water Conservation Plan Act of 1998 amended in 2004 with HB71 Section 73-10-32. Statute requires that every Utah water conservancy district and water retailer adopt a Water Conservation Plan every five years and file the plan with the Utah Board of Water Resources. This 2021 Water Conservation Plan Update presents updated data for water supply and demand, trends, future growth and consumption projections, and proposes policies and actions to achieve regional conservation goals. The Regional Water Conservation Goal for the “Upper Colorado River” area (Carbon, Emery, Grand, and San Juan Counties) is 20% by 2030, from an average of 333 gallons / day / person (GPCD) to 267GPCD. Moab is close to this goal and is currently at 278GPCD according to 2020 population estimates. The 2020 Census data will be available in 2022, at which time, the City will have a more accurate resident number, and it is likely the actual GPCD will be lower. The City proposes to meet and exceed the Regional Goal by setting a new goal of 230GPCD by 2030. This represents a 50% decrease in outdoor landscape irrigation and would result in the total volume of residential water use staying the same, while still accounting for the projected increase in population. A goal of 230GPCD by 2030 is a representation of the water conservation values of the community and an effort to keep water use at a safe level to ensure sustainable quality of life for the City of Moab and its environs. To meet this goal, the City plans to implement a suite of water conservation measures including policies, outreach, infrastructure improvements, and water resource management planning. Proposed policies include regulating landscapes and turfgrass for new development, water wise development standards, and re-landscape incentives. Outreach and education for current residents as well as making technical resources and expertise available are a key component of meeting the City’s goal. The City has committed to system upgrades which will be completed over the next five years and have the potential to reduce loss and improve efficiency, as well as developing a new source (well). In addition, the City is embarking on a water resource management planning effort in coordination with other water providers who share the groundwater supply, to make smart decisions now and prevent shortages in the future. Underpinning all of these efforts is on-going research by state, local, and federal agencies to improve data accuracy and forecasting. Data for this plan comes from ongoing studies by the Utah Division of Water Rights (DWRI), the United States Geological Survey (USGS) and the Utah Geological Survey (UGS) as well as the City and neighboring water users, Grand Water and Sewer Service Agency (GWSSA), and Moab Irrigation Company (MIC). Population data was derived from the 2020 US Census.
SECTION 1: SYSTEM PROFILE
1.1 History, Government and Population
The City of Moab was incorporated in 1902 and is the largest city in Grand County. The City of
Moab has a Council-Manager form of government, with five elected Council members, a
separately elected Mayor, and an appointed City Manager.
The area has been known for mining, filming, and now tourism over the decades. It is the
jumping off point for Arches and Canyonlands National Parks, as well as home to world-
renowned mountain bike and 4x4 trails, which means that the area seems millions of visitors
every year. This transient population makes water planning more complicated, and can be a
point of contention for those concerned that our GCPD does not differentiate between visitors
and residents, resulting in each resident being “responsible” for some portion of the tourism
impact. Please see Section 6, Water Conservation, for more details.
The resident population of the City has slowly grown over the past ten years, with an average
estimated growth rate of 1.01%. Current resident population is estimated at 5,341 using this
assumed growth rate, and will be updated with the 2020 Census data available in 2022. Using
simply the average growth rate from the past 10 years, Moab City would see an increase of
approximately 2,500 people in the next 40 years.
Fig 1. Projected Population Growth

                                                                                Estimated Population
               9000                                                                                                                                                                                                 7984
               8000
               7000
               6000                                                     5341
  Population

               5000
               4000
               3000
               2000
               1000
                  0
                      2005
                             2007
                                    2009
                                           2011
                                                  2013
                                                         2015
                                                                2017
                                                                       2019
                                                                              2021
                                                                                     2023
                                                                                            2025
                                                                                                   2027
                                                                                                          2029
                                                                                                                 2031
                                                                                                                        2033
                                                                                                                               2035
                                                                                                                                      2037
                                                                                                                                             2039
                                                                                                                                                    2041
                                                                                                                                                           2043
                                                                                                                                                                  2045
                                                                                                                                                                         2047
                                                                                                                                                                                2049
                                                                                                                                                                                       2051
                                                                                                                                                                                              2053
                                                                                                                                                                                                     2055
                                                                                                                                                                                                            2057
                                                                                                                                                                                                                   2059

                                                                                                                   Year

However, build-out projections are complex, and have many different scenarios based on
current zoning, potential zone changes, types of uses, and possible future regulations such as
water availability. 2020 Census data may be higher than the previous growth rates, and post-
covid, Moab seems to have undergone a boom in popularity if the housing market is any
indication of current residential demand.
There are currently 240 vacant properties within City limits, representing 725 buildable acres
(there are 1116 vacant acres, but the remaining 391 acres are unbuildable due to natural
hazards). Approximately 30% of these are zoned for commercial uses. The lowest end of the
build-out scenario is one single-family dwelling on each residentially zoned property and non- residential uses on the others, which adds only about 223 people (using as average of 3 people / household) to the projected population. The build-out number gets much higher assuming each property uses their total density allowance, and higher still if any are rezoned to zones allowing more density than currently permitted. With a medium scenario, where every vacant residential property is subdivided and developed to the maximum density allowed by current zone (excluding multi-family options), then there are 3,000 new units built, and approximately 9,000 more people. The City is currently looking into these various scenarios to develop smart land use policy based on limited resources and community desires. The matter is complicated further by the addition of other water users outside City limits who share the aquifer – residents of both Grand County and San Juan County. Acknowledging this reality is the inspiration behind the initiation of the Moab Spanish Valley Water Providers Coalition, a water resource management planning group to be convened later in 2021. It is impossible to address the population of Moab without representing tourism. Though the City only has around 5,000 permanent residents, the area (including Spanish Valley) sees more than a million visitors per year, many of which stay at least one night in the many overnight accommodations available in both City limits and Grand County. 1.2 Water governance structure** Fig. 2 Map of Current Service Area
1.3 Water Distribution System
The City of Moab supplies drinking water to almost all the residents and businesses within the
City. Three wells and three springs provide drinking water year round, and an additional spring
and well are used for irrigation only. Water sources in the distribution system for the City of
Moab vary seasonally and yearly. From the north end of town, water from Skakel Spring is
pumped through a chlorination station and into a one-million-gallon tank, which then feeds the
Northwest low pressure zone of the city. Birch Springs 1, 2 and 3 and Wells #6 and #10 south of
Moab are channeled into pipes and flow into two gas chlorination stations. From each of these
chlorination stations, water flows downhill to the City grid. Two one-million-gallon storage
tanks are not in line with the main transmission lines, but branch off at the south end of the
system. See Section 2 for volume and supply information.

Fig. 3 Number and Type of Connections in 2020
 Type of Connection      Number in 2020
 Residential             1,773
 Commercial              430
 Institutional           60
 TOTAL                   2,263

The City of Moab’s water system operates as an Enterprise Fund in which fees are charged to
users of the system to pay for the costs. The Water Fund revenue sources consists of water
base and usage fees from residential and commercial customers, bulk water sales, water impact
fees, and proceeds from debt service secured by water rates. In April of 2021 the water
revenue was used to secure a bond to enable the City to complete a backlog of necessary water
related projects in the next 5 years, including developing a new well, Well #12. These projects
also include water line improvements along Mill Creek Drive, a new 2 million gallon storage
tank on Spanish Valley Drive, and various optimization projects on existing facilities. The Water
Department keeps up on leak and loss maintenance regularly (see Section 4).

1.4 Water Treatment System
   •   New sewer plant
   •   Potential for re-use of water (Matheson wetlands)

SECTION 2: SUPPLY
2.1 Sources – Aquifers, Surface Water, and Water Rights
2.1.1 History **
2.1.2 Aquifer and surface water descriptions and maps**
During the last several years the City, GWSSA and several other concerned entities funded a
USGS study to help better understand the aquifers in our area (citations here). The City of
Moab also hired a consultant, Ken Kolm, to further understanding of this very complex system
(citations here).
Due to the complexity of the aquifers fed by snow melt from the La Sal Mountains there is not
complete agreement on exactly how the system functions, and there is still a wide range in the
estimates of how much water is in the aquifer and what the recharge rate is. This discussion is
ongoing in the community and will be a part of groundwater management planning efforts.
The complexity of our water source not only makes quantifying it difficult, but it also means our
water supply is relatively invisible to residents and visitors alike. Conservation of a resource
that may only be understood to be gone when wells run dry creates a challenging conservation
planning atmosphere. The City of Moab and others in the community can help lead the
conversation about understanding our water system is complex, how we are working to
understand the security of our water supply, and how every resident can help through water
conservation.
Table 1. SUPPLY CATEGORIZED BY TYPE of SOURCE**

2.2 Secondary Water (Irrigation Sources)
2.2.1 Moab Irrigation Company
Moab Irrigation Company (MIC) is a non-profit organization founded about 1890 which has
senior water rights to almost all of the water in the Mill Creek drainage, including North Fork,
which is usually around 6,000 acre-feet per year. Headwaters of both branches of Mill Creek are
high on the west side of the La Sal mountains. Mill Creek is the principal drainage supplying
water to Spanish Valley.
There are three diversions in the upper reaches of the creek that supply water to three ditches
– Wilson Mesa, South Mesa, and Horse Creek – for agricultural and irrigation uses. There is
another large diversion, discussed below, supplying water through Sheley Tunnel to Ken’s Lake,
which is a reservoir supplying irrigation water to upper valley users.
There are three more diversions on Mill Creek below its confluence with North Fork. The two
lower dams are near each other and not far from the intersection of Spanish Valley Drive and
Powerhouse Lane. The uppermost dam of this group supplies mostly small farms on the
southeast edge of the city. The remaining two dams supply two "ditches" (long since replaced
by closed plastic piping) that stretch from east to west across Moab City. The users on these
ditches are more than a hundred of mostly urban landscapers who enjoy relatively inexpensive
irrigation water compared to what it would cost to irrigate with city culinary water. Delivery
takes advantage of the steady downhill grade to the west to hydrostatically pressurize the
pipelines; no pumps are used. The majority of these users flood irrigate their properties.
Since 1980, all flow (except a BLM required 3 cfs minimum in-stream flow) in Mill Creek is
diverted by Grand Water and Sewer Service Agency (GWSSA) into Ken's Lake where it is used
for irrigation in the upper valley. [A hydrologist employed to study the City’s culinary water
supply asserts that this reduced (since 1980) stream flow has detrimentally reduced the city’s
production from its springs and wells at the golf course as well as Skakel Springs farther north
along a NW trending Kayenta fault line.] MIC charges GWSSA for this diverted water, and in
turn if MIC wishes to augment its city pipelines in late summer (a common occurrence in recent
frequent drought years) when Mill Creek flow is low, GWSSA charges MIC for water pumped
from Valley Fill Aquifer wells in the same geographic area as MIC diversions. Ken's Lake also
owns a large number of MIC shares, for which it pays an assessment fee like any other MIC
shareholder.
In summer, MIC frequently takes all Mill Creek flow at its two lower dams to serve its city users,
leaving Mill Creek almost dry, particularly in the daytime when more people are watering than
they do at night. Water does seep back into the creek below the lower dam so that by the time
Mill Creek crosses Main Street (Hwy 191) there is some flow back in the creekbed. The
aesthetics and ecological amenity of leaving some modest flow, ideally even in drought years, in
the creek all the way through town is desirable, but there's not enough water to serve MIC
customers and leave some in the creek unless water distribution can be made more efficient.
Doing so is certainly possible, but it requires considerable upgrade to both MIC and user
systems with technologies such as pumps, timers, tanks, automated diversion dams and
automated valves. Surface water is messy to handle, involving foreign material such as sand,
limbs, leaves and beavers, making the situation more complicated.
Similarly, the idea of using MIC water, its pipelines, or at the least its right-of-way through town
to grow a secondary municipal water system surfaces periodically. This is possible, but likely
means converting MIC from a non-pressurized to a pressurized, metered system, which is not
currently in City or MIC budgets.
2.2.2 The Colorado River
Another potential secondary irrigation system is surface water out of the Colorado River. The
City of Moab holds xxcfs/AF in water rights (see above) and has the opportunity to conserve
culinary water and add non-potable supply for outdoor irrigation needs. Developing this system
would cost XX$$ and take XX years and is not within the scope of City capital improvement
projects at the moment. However, as a means to further conserve culinary water supplies, this
development could be well warranted in the future.
2.3 Water Rights**
   •   Summary of Moab water rights
   •   Other water rights on the same source
   •   Opportunity for water banking

SECTION 3: WATER MEASUREMENT
3.1 Water Measurement Methods and Practices**
   •   Requirement: List current water measurement methods and practices
          o Percent of metered connections by type, reading frequency, calibration schedule,
              new development laws and replacement schedule.

SECTION 4: SYSTEM WATER LOSS
4.1 Water Loss
There were approximately 550 acre-feet of water, or about 20%, lost between production and
metered connections in 2020, which is typical for recent years. The City engineering and public
works team attributes this loss to four possible causes:
1. Dispersed Leaks: individual leaks may be too small to be noticed but taken together
could have a significant effect. Water lines are in various types of soils, some of
which may be able to absorb a slow leak for a long time without evidence showing.
2. Water Line Breaks: these are repaired quickly, but large amounts of water can be
lost during the leaking period.
3. Unmetered Connections: there may be older connections that are as yet unmetered.
4. Fire Hydrant Exercise: public works exercises fire hydrants on a schedule, and the
water used is not metered.
Source overflow from springs is not metered and bypasses the system, so would not be Commented [1]: Is this true?
counted as loss.
4.2 Leak Detection and Repair
Moab City has four full time Water Department personnel directly supervised by the Public
Works Director. They work around the clock to provide safe drinking water for the City of
Moab. They monitor and perform regular maintenance on the water production and treatment
process daily and always make necessary repairs immediately. They have a SCADA system that
is able to monitor and control various parts of the water system remotely from a desktop
computer or a phone app with full control of all the pumps in the system. This means they are
able to see intrusion alarms and all of the tank levels in real time.
The Water Department takes leaks seriously and responds immediately to all identified issues,
making a conscious effort to lose the least amount of water possible during repairs. They are
always on high alert and inspecting the water system for leaks and have personnel on-call 24/7
through local dispatch through the Sheriff’s office or by the on-call number (435)210-1982. The
City Water Department responded to 35 water leaks in 2020 and completed repairs on 8 water
mains and 22 service lines.
The Treasury and Water Departments work closely together on water conservation. The Water
Department reads all water meters, most of which are digitally broadcast, and reports those
readings to the Treasury Department monthly. The Treasury Department is able to identify high
usages through their billing software which creates a re-read list. The Water Department will
then verify the unusually high readings on the ground and report the conditions back to the
Treasury Department. If there is evidence of a water leak the homeowner is notified
immediately and work begins on a solution. When the leak is properly fixed, the homeowner
can request a rebate on the amount of their water bill caused by the leak. This is intended as an
incentive to fix leaks and not simply let them run, though, that has happened in the past, and it
may be time to add a penalty for those who do not choose to fix their leaks.
In addition, the Water Department works to educate customers on ways to conserve water.
From irrigation watering schedules to overflowing swamp coolers and leaking faucets, they help
customers identify high usage areas and come up with solutions.
In an effort to maintain water quality the Water Department cleans and inspects water storage
facilities every 5 years. They flush low flow and dead-end lines on a regular basis and upon
restoring water after an outage, they flush water mains until free of sand. There is sediment
that flows naturally from the springs and settles in main lines due to aging infrastructure. Newinfrastructure additions strictly follow AWWA water standards. From installation and pressure
testing to treatment and sampling all applicable standards are followed every time to maintain
water quality.
SECTION 5: WATER USE
5.1 Water Use
Total water used from 2005 – 2020 has decreased. In recent years, the proportion of water
going to commercial uses has begun to decrease in comparison to residential use as well, as the
City becomes more built-out and residentially focused, and commercial and agricultural uses
move out into Spanish Valley. The City has set the goal of a 50% reduction is outdoor landscape
irrigation by 2030 to effectively keep residential draw the same as it is today, regardless of the
projected increase in population.
Fig. 3 Water Use by Sector and Year
Total Water Used (AF) by Year and Sector 2005-2020
2,500.00
2,000.00
1,500.00
1,000.00
500.00
-
2005 2006 2007 2008 2009 2010 2011 2012 2013 2014 2015 2016 2017 2018 2019 2020
Residential Commercial Institutional Industrial Wholesale Unmetered
Table 2. Potable vs. Non-Potable Water Use
The City of Moab only began keeping records on non-potable water production and use in
2017. There are only three connections that are considered non-potable water used for
irrigation. Well #7 is used exclusively by the Golf Course for spring irrigation to make up for
shortfalls when their usual water source (GWSSA) does not have enough supply. They use
varying levels per year depending on available surface water. The City Center well is exclusively
used for irrigation of City facilities near City Hall, and McConkie spring is a diversion near Old
City Park used for irrigation there.SOURCE 2020 2019 2018 2017
City Center Well 1.35 N/A N/A N/A
McConkie Spring (Irrigation) 120.00 120.00 120.00 152.03
Well #7 Golf Course (Irrigation) 8.43 18.00 182.70 41.06
Total Per Year 129.78 138.00 302.70 193.09
5.1.1 Water Use – Permanent Residents
Total water use has been trending downwards in the past 15 years, even as population has
risen. This is due to shifting uses from commercial and mining towards residential, conversion
of agricultural land to residential use, replacement of an old sewage treatment facility, and
likely some water conservation awareness as well. In 2005 the total water used was 1,965 acre-
feet and in 2020 the total was 1,667 acre-feet. The City of Moab aims to keep total water use at
or around the current level into 2030, regardless of population growth.
Fig. 3 Population vs Water Use
Population Growth and Total Water Used
5400 2,500.00
5300
2,000.00
5200
Population
5100 1,500.00 Acre Feet
5000 1,000.00
4900
500.00
4800
4700 -
2005 2006 2007 2008 2009 2010 2011 2012 2013 2014 2015 2016 2017 2018 2019 2020
Axis Title
Est. Population (based on US Census Data) Total Water UsedFig. 6 Gallons per Capita per Day by Type
GPCD 2005-2020 by Type
400.00
350.00
300.00
250.00
200.00
150.00
100.00
50.00
-
2005 2006 2007 2008 2009 2010 2011 2012 2013 2014 2015 2016 2017 2018 2019 2020
GPCD Residential GPCD Commercial GPCD Institutional GPCD Total
Table 3. Gallons per Capita per Day 2005 - 2020
Year Population GPCD GPCD GPCD GPCD Total
Residential Commercial Institutional
2005 4936 192.76 162.72 - 355.48
2006 4968 191.78 161.60 - 353.38
2007 5001 164.18 129.78 - 293.96
2008 5,033 174.56 144.34 - 318.89
2009 5,066 168.42 150.65 - 319.06
2010 5,111 135.46 183.40 - 318.87
2011 5,097 131.05 157.60 - 288.64
2012 5,186 142.79 166.56 - 309.35
2013 5,184 143.89 207.67 - 351.56
2014 5,225 162.38 156.24 - 318.62
2015 5,251 145.69 136.18 - 281.88
2016 5,261 135.68 171.73 - 307.41
2017 5,219 139.50 139.97 46.21 325.69
2018 5,288 143.66 127.38 36.12 307.17
2019 5,336 145.33 99.91 27.43 272.67
2020 5,341 166.47 89.23 22.97 278.675.1.2 Water Use – Visitors Commented [2]: This is interesting, the number is so
No discussion of water use in Moab would be complete without addressing the impact of our small I have a tough time believing it, but since it's true we
need to educate the people who say "Moab is using all its
many visitors. Currently, overnight accommodations account for approximately 16% of the water for motels"
commercial water used. In 2019 (a more typical year than 2020), this was a total of 95AF. As
visitors increase, we can expect their water usage to increase concurrently unless more
conservation measures are implemented at overnight accommodations. Outreach efforts are
part of the five year conservation plan. However, considering that overnight accommodations
only account for 16% of the City’s commercial usage, this sector does not have an oversize
impact on the total.
5.2 Water Production and Projections**
Fig. 4 Water Produced by Source / Year
Water Source Data (AF)
5-yr 2016 2017 2018 2019 2020
average (2,388 (2,540 (2,478 (2,264 (2,218
AF) AF) AF) AF) AF)
Birch Springs 1,2,3 (WS003) 535.82 515.78 551.85 539.83 503.63 468.42
Sommerville Springs Nos. 1 535.79 518.19 572.11 517.06 472.09 469.22
& 2 (WS001,2)
Well No. 10 (WS010) 529.13 533.68 565.79 487.91 521.26 409.36
Well No. 6 (WS007) 415.20 450.83 426.63 368.13 458.60 478.65
Skakel Springs (WS012) 241.73 232.35 230.31 262.53 169.92 264.30
McConkie Spring (Irrigation, 130.68 120.00 152.03 120.00 120.00 120.00
estimated)
Well #7 Golf Course 80.14 16.67 41.06 182.70 18.00 8.43
(Irrigation)
Total Per Year 2,468.48 2,387.50 2,539.78 2,478.16 2,263.50 2,218.38Fig. 4 Water Production Trends by Source
Water Production 2016-2020 (AF)
700.00
600.00
500.00
400.00
300.00
200.00
100.00
-
2016 (2,388 AF) 2017 (2,540 AF) 2018 (2,478 AF) 2019 (2,264 AF) 2020 (2,218 AF)
Birch Springs 1,2,3 (WS003)
Sommerville Springs Nos. 1 & 2 (WS001,2)
Well No. 10 (WS010)
Well No. 6 (WS007)
Skakel Springs (WS012)
McConkie Spring (Irrigation, estimated)
Well #7 Golf Course (Irrigation)
• Requirement: comparison graph with a) reliable supply through 2060, b) current water
use projections, and c) efficient use
• Water source development, supply, and cost projections
5.3 Billing
The City recently updated water rates to adopt a stronger tiered rate structure to encourage
conservation, particularly for commercial properties. These new rates were only recently
adopted in the winter of 2020 / 2021 and have yet to see a full summer season. We are hoping
that it will encourage adoption of conservation behaviors and more awareness of water use.
See below for the current rates.
Residential, within the City $13.00 minimum charge (includes the first 3,000 gal.)
$1.13/thousand for 3,001 to 10,000 gal.
$1.50/thousand for 10,001 to 60,000 gal.
$1.88/thousand for 60,001 or more gal.
Residential, outside the City $18.85 minimum charge (includes the first 3,000 gal.)
$1.50/thousand for 3,001 to 10,000 gal.
$2.25/thousand for 10,001 to 60,000 gal.
$2.63/thousand for 60,001 or more gal.
Commercial, within the City $37.50 minimum charge (includes the first 2,000 gal.)
$1.50/thousand for 2,001 to 5,000 gal.
$2.25/thousand for 5,001 to 10,000 gal.
$3.40/thousand for 10,001 to 50,000 gal.$4.25/thousand for 50,001 or more gal.
Commercial, outside the City $44.25 minimum charge (includes the first 2,000 gal.)
$3.00/thousand for 2,001 to 5,000 gal.
$3.38/thousand for 5,001 to 10,000 gal.
$4.25/thousand for 10,001 to 50,000 gal.
$4.68/thousand for 50,001 or more gal.
Shop Water Retail Fee (City Public
$32.50 for first 2,000 gallons, $12.75/1,000 gal.
Works Yard)
Shop Water Government Fee (City
$26.00 for first 2,000 gallons, $9.38/1,000 gal.
Public Works Yard)
Construction Fire Hydrant Fee $32.50 for first 2,000 gallons, $12.75/1,000 gal.
Construction Fire Hydrant Rental Fee $15 per day
City Parks & Cemeteries $0.81/1,000 gal.
Moab Golf Course Well #7 Current Commercial Rate
Water turn-on fee, after failure to pay $25.00 during normal working hours;
City water/sewer charges $50.00 after normal working hours
Water meter re-read charges
The City crew will re-read the
$10.00
customer’s meter.
The City crew will test a customer’s
$20.00
meter.
The City crew will change a tested
customer’s meter, at the customer’s Actual labor costs with a one hour minimum
request.
The costs incurred for these requests
will be paid within thirty days. If that
bill is not paid, the water will be turned
off until the debt is satisfied, and a During regular working hours, actual labor costs with
reconnect charge (1/2 hour minimum) a ½ hour minimum
during regular hours or reconnect
charge (2 hour minimum) after hours,
will be applicable.
after hours, actual labor costs with a 2-hour
minimum
If the problem proves to be the city’s
responsibility, there will be no charge
to the customer.
There is a space on City bills for a small message, which can be anything from information
about the new rates to conservation messages. Currently, the City is sending out the
Sustainability website address as a place for water conservation tips and resources. There is
current information maintained on that site as well as links to other water conservationresources and programs. In the future, the City is contemplating bill restructuring to include conservation goals and measurements aimed at such. SECTION 6: WATER CONSERVATION 6.1 Introduction The City of Moab is interested in a nuanced approach to conservation that does not simply focus on up-and-coming technologies and strategies alone (which are often the rediscovered practices of yesteryear's farmers anyway). The multi-pronged approach described in this Water Conservation Plan is comprised of policies, infrastructure improvements, investment in technologies and incentive programs, outreach and education, coordinated resource management, and on-going research and data refinement. The ultimate goal is to better define and achieve conservation as a term and set of practices which become embedded in the community ethos and carry forward to a sustainable future. 6.2 Water Use Reduction Goal In 2000, Governor Levitt proclaimed a conservation goal of 25% in gallons per capita day (GPCD) by 2050 using 2000 water use as the indexing year. The conservation proclamation was aimed at municipal and industrial (M&I) users, agriculture was intentionally omitted from the goal. A few years later Governor Herbert decreased the timeline and proclaimed a conservation goal of 25% by 2025 using the same year, 2000, as the indexing year. The goals were not intended to reduce the total demand for M&I water, they were established to make room for new growth because a fair number of regions were reaching the limit of their water resources. Since then, the Utah Legislature began getting involved which led to a 2015 Legislative Audit, followed by a 2017 Follow-up Audit, then a Third-Party Review, and finally a 2017 Recommended State Water Strategy. Those efforts recommended the State develop regional water conservation goals. The Utah Division of Water Resources (UDWR) was tasked with the project and developed the latest goals in their document Utah’s Regional M&I Water Conservation Goals. Grand County was put in the “Upper Colorado Region” which also includes Carbon, Emery and San Juan County. The draft recommendations were for the Upper Colorado Region to reduce their per-capita water consumption by another 17% and the final recommendations were for 20% reduction from average regional 2015 usage (333GPCD) by 2030. The 20% reduction for the region resulted in a recommended goal of 267GPCD. Moab is currently at 278GPCD (depending on accurate population data) and has set a new goal of 230GPCD by 2030. The table below shows the percent reduction from the year 2000 as per the original call from Governor Levitt, which Moab would meet with the 267GPCD regional goal, and exceed with a new goal of 230GPCD.
Year           Population Total AF        gallons per     % change
                                           capita day      from 2000
 2000           4779         1926.63       359.9           0.0%
 2015           5251         1657.96       281.9           21.7%
 2020           5341         1667.31       278.7           22.6%
 2030           N/A          N/A           267             25.6%
 2030*          5906*        1667*         230*            36%

6.3 Water Conservation Metric
The State has determined the metric for conservation goals at gpcd, or gallons per capita per
day. The metric is a reasonable measure if you were only measuring municipal use. The concept
being we are measuring household use and the number of people in households affects that
number. However, adding commercial, industrial, and institutional into the metric is
problematic because the people who are supported by that water use may not be living in the
area where the water is being used. Furthermore, differing industrial and commercial uses may
not have any relationship to the number of people being served by the water provider.
Furthermore, trying to determine whether metrics represent conservation or a change in
economy are not represented using the current measurements.
The City of Moab has a tourism economy. There are between 1.6 and 2.6million visitors in our
community per year. As such, the metric per capita does not include the numbers of visitors our
municipality supports, who use at least 16% of all commercial water, or 95AF, just on overnight
accommodations. This does not include the amount of water used in other businesses catering
to visitors such as restaurants, washing of off highway vehicles, etc. The City of Moab is
interested in considering other metrics to determine their conservation goals. One which has
potential is an Equivalent Residential Unit (ERU). It is already used for a variety of requirements
associated with water supply and could be a metric which allows a comparison between
economies and water conservation strategies.
6.4 Current Conservation Measures
Leak protection program / rebates
The leak protection program provides a rebate for the amount assumed to be lost due to a leak
after the customer has fixed it. This is intended to provide an incentive for fixing leaks.

New Water Treatment Facility
The new Wastewater Treatment Facility uses only 20,000 gallons of water per month whereas
the old one used 2 million gallons per month. This saves the City over 23.5million gallons of
water per year.

Outreach, Education
The City of Moab maintains a column in the Moab Happenings and the monthly City Newsletter
devoted to issues of Sustainability. Water conservation is an important and frequent topic in
these articles.
6.5 Current Conservation Ordinances and Standards
The City of Moab does not currently have any ordinances or standards addressing water
conservation directly. However, the WaterNOW Alliance just awarded the City a grant for
technical assistance to develop three things: 1) a greywater ordinance, 2) a landscaping
ordinance, and 3) new development standards, which will be completed in early 2022. The City
is looking forward to working with WaterNOW Alliance as well as USU Extension experts to get
smart, relevant, and up-to-date ordinances adopted as soon as possible. The City will also be
working on an Emergency Drought Management Plan.
6.6 New Conservation Measures for the Next Five Years
6.6.1 Planning Efforts**
• Water Resource Management Plan (Moab Spanish Valley Water Providers Coalition)
• USGS monitoring and research
6.6.2 Ordinances and Policies
A. Landscape Ordinance
The Water Board recommends developing a landscape ordinance which would have three main
components. 1) Requiring new development to use waterwise landscaping principles, limit or
omit turfgrass, and design in conjunction with greywater systems (see below), 2) Instituting
outdoor landscape watering rules for all residents during times of drought (see Drought
Management Plan), and 3) Developing a recommended/required species list for any new
development in Moab. This effort will be particularly helpful in conserving culinary water
supply, which is currently being used as irrigation water on most properties in the City for lack
of a secondary irrigation system.
A key component to the success of the landscaping ordinance is outreach to current residents
and businesses to encourage adoption of waterwise landscaping and abandonment of unused
turfgrass. City staff is working on opportunities to improve existing demonstration landscaping
around City Hall, as well as removing turfgrass and installing waterwise landscaping in
prominent location. These demonstration areas will serve to encourage current residents to do
the same in their own homes and will provide inspiration and education to current and future
residents.
This ordinance is planned for development in 2021 and adoption by 2022.
B. Grey Water Ordinance
Residents of the City of Moab (City) began installing grey water systems a couple of years ago as
pilot projects with the Southeast Utah Health Department (SEUHD). The projects were
successful and with the new information SEUHD collaborated with the Utah Division of Water
Quality to re-write the rules associated with permitting grey water reuse in Utah. Since then,the SEUHD has permitted several residential homes including affordable housing projects. The systems are relatively easy to install compared to most landscaping irrigation systems and inexpensive if installed during the building of a new home. The City plans to take advantage of the local expertise and the willingness of new homeowners to embrace these systems. This effort will make the City more resilient to drought and conserve water by reusing grey water to irrigate landscapes instead of sending it to the Wastewater Reclamation Facility and discharging it out of the area. It is estimated that new residences with lots less than .25 acres could save 50% of the water they would have used for outdoor irrigation. The City is developing ordinances that would require the indoor plumbing associated with grey water systems be installed during the construction or re-construction of new single family and multi-resident housing. The City also intends to encourage the use of these systems by refunding some of the impact fees associated with new construction to home and multi- housing units if they complete the installation with outdoor grey water irrigation. The City is also looking to make the City’s water portfolio more resilient by developing grey water ordinances for new commercial developments. The ordinance would require new commercial buildings to install either grey water or rainwater catchment systems that would provide all the water required for the landscaping associated with the new development. C. New Development Standards In conjunction with the landscaping and greywater ordinances, the City will implement standards for new development that incorporate waterwise landscaping principles and water saving construction features. Landscaping will be required to be waterwise, using a recommended list of plants and features, as well as a limitation on turfgrass area. New construction will be required to use WaterSense labeled fixtures and appliances, and stub for greywater. D. Emergency Drought Management Plan The City intends to develop and adopt an Emergency Drought Management Plan to prepare for a situation of actual shortfall in water production. With thoughtful pre-planning, the City will be able to take the time needed for calculations, engage the public, and decide what measures make the most sense to conserve water when a drastic situation arrives. This may involve recommendations to install infrastructure for emergency shut-offs or secondary lines in all new construction so irrigation may be divorced from culinary uses. The City aims to adopt this plan within the next five years. 6.6.3 City Facilities Improvements There are opportunities to improve municipal water efficiency which the City intends to complete as funds become available, beyond the infrastructure improvements bonded for and contained within the Capital Improvements Plan (mentioned in Section 1). There are three main City parks that use water for irrigating turfgrass – Rotary Park, Swanny Park, and Old City Park.
In addition, the City maintains the ballfields outside City Hall and various other smaller areas.
Improvements to the system involve four things:
        1) installing smart timers and moisture meters for more efficient watering
        2) removing grass where it is not needed
        3) evaluating and fixing old systems to water where needed and not where it’s not
        4) replacing plants which have died and are still being irrigated, allow them to establish,
        and re-evaluate and reduce irrigation appropriately
In addition, there are opportunities to install green infrastructure and improve stormwater
management to facilitate more infiltration and less runoff, as well as contribute to a greener
streetscape. As City drainage features are renewed or repaired, green infrastructure can be
incorporated into new designs and implemented where possible. If funding becomes available,
the City will be able to develop a green infrastructure plan for areas where projects would be
possible. The proposed greywater ordinance could work in concert with green infrastructure
between residential property and City streets.
6.6.4 Outreach and Education
Successful water conservation in Moab will depend on both tangible and intangible elements.
Efforts like replacing old fixtures and repairing leaks are opportunities to passively conserve
water by updating systems. Behavior change is the intangible piece of the puzzle which will
require a different approach. The City of Moab values the impact of education and outreach on
water conservation and will be continuously working to develop a community spirit of water
conservation without sacrificing quality of life or economic opportunities.
Planned outreach efforts include articles in the local newspaper, the City Newsletter, and Moab
Happenings, changing the design of the water bill to include conservation-oriented metrics,
creating and distributing door hangars at properties with inefficient watering systems to offer
consultation and resources, educational mailings with best practices and goals, and providing
resources from local landscape designers, USU extension, and other knowledge holders to
assist residents and businesses in their water conservation efforts. Keeping the community
informed about progress towards our conservation goals is a key component of the outreach
and education effort, and an essential piece of meeting our water conservation goals.
6.6.5 Programs
If funding becomes available, the City can invest in programs to accelerate landscaping
conversion and outdoor irrigation water savings. These may include the following:
     • Turfgrass buy-back / rebate: providing cash payments or rebates for property owners to
        replace lawn with water wise landscaping (this is a common program to encourage lawn
        conversion)
     • Conservation rebates: direct water-bill rebate rewards for meeting conservation goals
        on top of the tiered rates
     • Free smart timers and moisture meters: providing smart technologies to assist property
        owners with efficient watering
     • Penalty for failing to fix leaks: adopting a penalty in addition to the rebate for failing to
        fix a leak in a timely manner
6.7 Responsibility for Meeting Conservation Goals
Chuck Williams, City Engineer: cwilliams@moabcity.org
Levi Jones, Public Works Director: ljones@moabcity.org
Mila Dunbar-Irwin, Sustainability Director: sustainability@moabcity.org
Carly Castle, Assistant City Manager: ccastle@moabcity.org
6.8 Action and Implementation Timeline
Year Action
2021 • Water-wise landscaping guide sent to all addresses in Moab City including
information on watering turfgrass, resources for xeriscaping, and other ways to
reduce use of water outdoors
• Establish Moab/Spanish Valley Water Providers Coalition
2022 • Adopt Landscaping Ordinance and Greywater Ordinance
• Adopt new development standards including water wise elements
• Adopt Moab/Spanish Valley Water Providers Coalition Water Resource
Management Plan
• Inform community of the newly adopted Water Conservation Plan Update
2023 Implement incentive programs (when / if financially feasible):
o promote fixture replacement and inventory old fixtures where possible;
o campaign to reduce water waste in the home and improve efficiency;
o offer smart timers;
o implement turfgrass buyback program
2024 Update landscaping guide and outreach regarding landscaping and greywater
ordinances and new development standards
2025 Work with USU Extension to develop demonstration xeriscape garden in Moab
SECTION 7: ECOLOGICAL CONCERNS
7.1 Introduction
The Mill Creek Watershed, its creeks and the wetlands they are connected to at the Colorado
River’s edge, are critical components of not only a functional watershed and sustainable
aquifer, but also have importance to community residents. It is critical to include functional
riparian corridors and wetlands while exploring ways to ensure sustainable water for the Moab
and Spanish Valley communities. Not only are the riparian corridors important for wildlife, but
they also are important transportation and natural corridors through the town. Springs and
smaller wetlands within the system arguably act as indicators of overall water quantity in the
system in a qualitative way.
Water Conservation and Drought Management in the Moab Valley needs to include
maintenance and enhancement of the ecological components as well as water delivery to
residents and businesses.7.2 Matheson Wetlands
The Matheson Wetland is a unique and rare wetland in the American Southwest along
the Colorado River. The wetlands are not incorporated into the City of Moab’s town limits, but
they are sandwiched between the City of Moab and the Colorado River. They are effected by
the City of Moab and the entire Mill/Pack Creek hydrobasins surface and groundwater
practices. The wetlands are owned by the State of Utah Department of Natural Resources and
The Nature Conservancy in approximately 50/50 split. The Wetlands are co-managed by the
same two agencies.
The wetlands have had difficulty maintaining hydric vegetation during the previous two
decades due to several anthropogenic and natural impacts. Climate change and drought have
reduced the regularity of high seasonal flows in the Colorado that would flood the wetlands.
Mill Creek historically provided some surface water and maintained the groundwater table but
currently it is entrenched and several feet below the surface area of the wetlands. Increased
domestic use of springs on the Northwest portion of the valley has also altered the water
budget. There is also some concern that decreases in the freshwater layer by any of the
previously stated means could affect the level of the brine layer under the freshwater layer and
allow it to reach the surface or leach to the Colorado River.
This conservation plan suggests that the City of Moab support the wetland monitoring
plan being developed by the State of Utah Division of Water Rights and management agencies
of the wetlands. It is further suggested that the City of Moab and other Spanish Valley
institutions pursue stormwater management plans the slow water down as opposed to
diverting directly to Mill and Pack Creek.
7.3 Mill Creek
See Section 2.2.1 on Moab Irrigation Company.
7.4 Pack Creek
Pack Creek is a small stream that runs through Moab and Spanish Valley. Although Pack Creek is
not a source of culinary water the aquifer below it is used for culinary and irrigation purposes.
The aquifer has relatively high total dissolved solids (TDS) and the creek is not meeting the
beneficial use standards for TDS, temperature and E. coli. However, the creek and the aquifer
still provide irreplaceable environmental goods and services to Spanish Valley and its residents.
The water quality in Pack Creek is very good above its diversions near the USFS boundary. The
water is used to irrigate a small community there. The creek is generally dry from the USFS
boundary until ½ mile above Spanish Trail Road where the groundwater table becomes shallow
and recharges the creek. The valley is somewhat pinched there, and several springs of varying
water quality add volume to the creek. From there till the confluence with Mill Creek, Pack
Creek and the underlying aquifer are responsible for a verdant riparian area that has several
human benefits. During the irrigation season Pack Creek is responsible for most of the water in
Mill Creek below their confluence due to withdrawals on Mill Creek. In the Mill Creek the Pack
Creek water and the underlying valley fill aquifer also provide water to the Matheson Wetlands.
The environmental concerns with the wetlands were discussed earlier in this document.The growing population, development plans and long-term drought have made the valley fill aquifer a target for new water development. The aquifer itself is temporal with a relatively small amount of annual recharge. There are concerns that continued development of the valley fill aquifer will result in lower water tables, reduced or ceased recharge to Pack Creek, deterioration of water quality and subsequent termination of the environmental goods and services the residents of Spanish Valley and Moab currently profit from. SECTION 8: OTHER CONSIDERATIONS 8.1 Colorado River Moab City has water rights out of the Colorado River, and could potentially change some of their unusable groundwater rights to increase the rights out of the Colorado. This water has been contemplated for use as an eventual secondary irrigation system, relieving some of the pressure of the culinary water drawn from the aquifer and allowing for a more ready method of regulation should the need for outdoor watering restrictions arise. Developing this system would require a large amount of funding and infrastructure, however, and is not currently feasible. In the more immediate future, it would be possible to shift non-potable water, such as that used for construction sites, to surface water from the Colorado rather than culinary groundwater. Setting up a metered pump station would not be exceedingly onerous, and the City just needs to identify a suitable location. There is already a construction water pump station at the boat ramp at the 191 bridge, which is owned by Le Grand Johnson, a construction and paving company. 8.2 Water Banking Water banking is adding water to an aquifer for later use, putting it “in the bank” so to speak, either literally or figuratively through water rights. The banked water is allowed to percolate down into the aquifer where it then disperses and is available for later use. In concept, this can either be done at the surface level, and recharge goes to shallow aquifers, or via deep injection wells to access deeper aquifers. In Moab, water for recharge could come from the Colorado River, storm water, or future flash floods generated by increasing monsoonal storms predicted by climate change models. Untreated Colorado River water could be pumped up the valley, used for purposes mentioned above, and eventually be emptied into designated recharge areas such as Kens Lake, flood irrigated fields, or purpose-built shallow ponds or wells. This could be a way for the City to “use” water that is currently considered lost from the system due to variations in seasonal needs and continuously flowing springs. There are about xx acre feet of water the City does not actively put to use each year that instead of running off to the river, could conceivably be banked for future withdrawals. Developing a water bank is not currently on the City’s priority list, however, it is something to keep in mind for the future.
You can also read