Impact of Ducting on Heat Pump Water Heater Space Conditioning Energy Use and Comfort
←
→
Page content transcription
If your browser does not render page correctly, please read the page content below
PNNL-23526

Prepared for the U.S. Department of Energy
under Contract DE-AC05-76RL01830

Impact of Ducting on Heat Pump
Water Heater Space Conditioning
Energy Use and Comfort

SH Widder                  JM Petersen
GB Parker                  MC Baechler

July 2014
PNNL-23526

Impact of Ducting on Heat Pump
Water Heater Space Conditioning
Energy Use and Comfort

SH Widder            JM Petersen
GB Parker            MC Baechler

July 2014

Prepared for
the U.S. Department of Energy
under Contract DE-AC05-76RL01830

Pacific Northwest National Laboratory
Richland, Washington 99352
Summary

    Increasing penetration of heat pump water heaters (HPWHs) in the residential sector will offer an
important opportunity for energy savings, with a theoretical energy savings of up to 63% per water
heater1 and up to 18% of residential energy use (EIA 2009). However, several barriers must be overcome
before this technology will reach widespread adoption in the Pacific Northwest region and nationwide.
One significant barrier noted by the Northwest Energy Efficiency Alliance (NEEA) is the possible
interaction with the homes’ space conditioning systems for units installed in conditioned spaces. Such
complex interactions may decrease the magnitude of whole-house savings available from HPWHs
installed in the conditioned space in cold climates and could lead to comfort concerns (Larson et al. 2011;
Kresta 2012). Modeling studies indicate that the installation location of HPWHs can significantly impact
their performance and the resultant whole-house energy savings (Larson et al. 2012; Maguire et al. 2013).
As a result, NEEA’s Northern Climate HPWH Specification, which describes the characteristics a HPWH
must have to be incentivized in cold climates in the Pacific Northwest, requires exhaust ducting for their
Tier II-specified product and requires full ducting for a Tier III-specified product (NEEA 2013).2
However, field data are not currently available to substantiate these requirements. As installing HPWHs
with exhaust or full ducting increases the cost and complexity of the HPWH installation, when it is
required, such field data are necessary to verify modeling assumptions regarding the magnitude of
interactions between the HPWH and the space conditioning system and to justify the need to install
exhaust-only or full (supply and exhaust) ducting for HPWHs installed in conditioned space in cold
climates.

    This HPWH demonstration examines the overall performance of HPWHs installed in a conditioned
space with a number of supply and/or exhaust ducting configurations, as well as the interactions between
the HPWH and the home’s heating/cooling system. Specifically, this field evaluation of two HPWHs in
the Pacific Northwest National Laboratory Lab Homes is designed to measure the performance and
impact on the Lab Home heating, ventilating and air conditioning (HVAC) system during heating and
cooling season periods of HPWHs in two pairs of configurations:
1. a HPWH configured with exhaust ducting compared to an unducted HPWH
2. a HPWH with both supply and exhaust air ducting as compared to an unducted HPWH.

Important metrics evaluated in these experiments include water heater energy use, HVAC energy use,
whole-house energy use, interior temperatures (as a proxy for thermal comfort), and cost impacts.

    In general, the Lab Homes evaluation found that installing exhaust-only ducting on a HPWH in
conditioned space increased whole-house energy use, while full ducting decreased whole-house energy
use, as shown in Figure S.1. Specifically, the data from these experiments suggest that exhaust-only
ducting increased space conditioning energy use 4.0 ± 2.8% in the heating season as compared to the
unducted HPWH, due to increased infiltration of colder outdoor air resulting from depressurization of the
interior space. Full ducting was observed to substantially mitigate the impact of the HPWH on the

1
  Based on the DOE test procedure (10 CFR 430.32(d)) and comparison of an electric resistance water heater
(Energy Factor, EF = 0.90) versus a HPWH (EF = 2.4)
2
  NEEA incorporates three product Tiers into their Northern Climate HPWH Specification to recognize variations in
product performance and supported applications.

                                                       iii
HVAC system. The fully ducted HPWH decreased HVAC energy use 7.8 ± 2.3% as compared to the Lab
Home with an unducted HPWH.
Fully Ducted Water Heater Unducted Water Heater
Exhaust Only Ducted Water Heater % Difference in HVAC Energy Use
Percent Change in HVAC Energy Use Due
120 8%
Daily HVAC Energy Use [kWh/day]
6%
100
4%
to Ducting Configuration
2%
80
0%
60 -2%
-4%
40
-6%
-8%
20
-10%
0 -12%
Exhaust Only Ducted Fully Ducted Comparison
Comparison
Figure S.1. Daily HVAC Energy Use (kWh/day) and Difference in HVAC Energy Use (%) for the
Exhaust-Only Ducted Comparison and the Fully Ducted Comparison Periods in the Heating
Season
In addition, the experimental data indicate that the penalty of installing a HPWH in conditioned space
may not be as large as modeling studies suggest, due to the buffering of interior walls resulting in
localized cooling in the water heater closet, with very little impact on surrounding interior temperatures.
Only approximately 43.4 ± 12.2% of the theoretical space conditioning load was made up by the HVAC
system in the heating season, and 37.2 ± 4.7% cooling season. The study also verified the benefit of
HPWHs installed in conditioned space in providing supplemental cooling, decreasing HVAC energy use
by 9.3% compared to an exhaust-only or fully ducted HPWH. No significant impacts on interior
temperatures were observed, as the cooling effect of the HPWH was largely localized in the water heater
closet.
Although fully ducting the HPWH was observed to be an effective strategy to mitigate space
conditioning impacts of HPWHs installed in conditioned space, this ducting configuration may also
increase water heater energy use due to cooler supply air temperatures. This study shows that cooler
crawlspace temperatures increased water heater energy use 4.3 ± 1.8% for the HPWH operating in “Heat
Pump” mode; however, this incremental difference is small compared to the difference in HVAC energy
use accomplished by the different ducting configurations.
Therefore, from a whole-house perspective, the net energy impacts of HPWHs installed in
conditioned spaces are driven by the HVAC system interaction, as shown in Table S.1. Similarly, the
cost-effectiveness of installing ducting on HPWHs will be driven by the HVAC system interaction. In
this experiment, full ducting provided a lifetime energy savings of $1,982 compared to an unducted
ivHPWH over an assumed 10-year life of the water heater. This corresponds to an decrease in whole-house
energy costs of approximately 4.2%. Conversely, the exhaust-only ducting increased total energy costs
by $1,306, or 2.9%, compared to the same unducted HPWH over a 10-year lifetime in Richland’s heating-
dominated climate. Table S.1 also provides the estimated annual energy and cost impacts when the
maximum possible, or theoretical, HPWH space conditioning interaction is assumed, for comparison.
The magnitude of these energy cost impacts far outweigh the cost of full ducting assumed in this analysis.
Table S.1. Annual Difference in HVAC, Water Heater, and Whole-House Energy Use (kWh/yr and %)
and Associated Energy Costs Calculated Based on the Experimental Data and the
“Theoretical” Difference in HVAC Energy Use
Annual Difference in
HVAC Energy Use Water Heater Whole-House Energy Cost Lifetime
Energy Use Energy Use Cost
kWh/yr kWh/yr kWh/yr $/yr $
(%)* (%)* (%)* (%)*
Exhaust-Only
858 ± 440 −144 ± 74 714 ± 446 86 1,306
Comparison
(6.2 ± 3.2) (-6.8 ± 3.5) (2.9 ± 1.8) (2.9)
Fully Ducted
−1079 ± 408 48 ± 49 −1031 ± 411 −125 −1,982
Comparison
(-7.8 ± 3.0) (2.3 ± 2.3) (-4.2 ± 1.7) (-4.2)
Theoretical
1953 ± 1056 −144 ± 74 1809 ± 1059 219 2,192
Exhaust-Only
(14.1 ± 7.6) (-6.8 ± 3.5) (7.3 ± 4.3) (7.3)
Comparison
Theoretical Fully
−2210 ± 928 48 ± 49 −2162 ± 930 −262 −2,620
Ducted
(-16.0 ± 6.7) (2.3 ± 2.3) (-8.8 ± 3.8) (-8.8)
Comparison
* Percentage difference in annual energy use estimates are presented as a percent of that equipment load (e.g., the
annual difference in HVAC energy use is presented as a percentage of HVAC energy usage).
However, to validate these findings and further explore the depressurizations caused by the HPWH
with exhaust-only ducting, repeating similar experiments with spatial measurement of differential
pressure could identify key sources of infiltration. In addition, conducting an experiment to precisely
evaluate the effect of inside walls on buffering of thermal loads could help validate or refute the findings
related to the relative magnitude of the interaction between the HPWH and HVAC system, compared to
the maximum theoretical interaction. Such inputs could be used to develop more detailed modeling using
a multi-zone energy model to validate space interactions of HPWH duct configurations. A calibrated
model could then be used to evaluate variability with climate and the relative impacts with different
heating and cooling system assumptions. This additional modeling, and associated cost analysis, of
HPWH and space conditioning system interactions for a variety of climate zones, HVAC system types,
and HPWH operating modes is necessary to assess the cost-effectiveness of ducting and to make formal
recommendations regarding appropriate installation of HPWHs under more diverse scenarios.
vAcknowledgments
This project was funded by the U.S. Department of Energy, Energy Efficiency and Renewable Energy
Building America Program (Eric Werling and Sam Rashkin, Program Managers); the Bonneville Power
Administration (Kacie Bedney, Stephanie Vasquez, and Janice Peterson (Contractor); Project Managers);
and the U.S. Department of Energy, Office of Electricity Delivery and Energy Reliability (Dan Ton,
Program Manager). Additional support was provided by the project partners Northwest Energy Works
(Tom Hews/Brady Peeks) and GE Appliances (Scott Schaeffer).
The authors also wish to acknowledge the contributions of other PNNL staff: Susan Sande for her
assistance in procuring equipment and overseeing the Lab Homes modifications, Jamie Spangle for her
financial expertise, Maura Zimmerschied for editorial support, Todd Samuel for his consistent and
significant management support, Marye Hefty for her leadership and intuition, Nathan Bauman for his
metering expertise, Spencer Gilbride and Austin Winkelman for their assistance in implementing
experiments, and other Lab Homes researchers who accommodated this experiment and abided by the
schedule.
The authors also acknowledge the technical support provided by Greg Sullivan, Principal, Efficiency
Solutions, LLC, Richland, Washington, for assistance with occupancy simulation development, metering,
and data collection.
viiAcronyms and Abbreviations
ACHn air changes per hour natural
ACH50 air changes per hour at 50 Pascals of depressurization with respect to the outside
ASHP air source heat pump
BA Building America
Btu British thermal unit
Cp,water specific heat capacity of water (1 Btu/lb·°F or 0.2931 Wh/lb·°F)
CFM cubic feet per minute
CoolingCapHPWH cooling capacity of heat pump water heater
CoolingInput the amount of cooling added by the heat pump water heater in Btu/h
COP coefficient of performance
COPHPWH system coefficient of performance of the HPWH; a ratio of the energy delivered
as hot water to the electrical energy provided to the equipment
DR demand response
EF energy factor
ERWH electric resistance water heater
gal/day gallons per day
gpm gallons per minute
GE General Electric
HPWH heat pump water heater
HVAC heating, ventilating and air conditioning
kW kilowatt
kWh kilowatt-hour
LBNL Lawrence Berkeley National Laboratory
NEEA Northwest Energy Efficiency Alliance
NREL National Renewable Energy Laboratory
PON,HPWH rated input power to the water heater in Btu/h
PAHPWH performance adjustment factor that accounts for the impact of ambient
temperature on the efficiency of the HPWH
PNNL Pacific Northwest National Laboratory
SEEM a residential energy use modeling program developed by Ecotope
QHPWH heat pump water heater energy consumption
QHVAC thermal energy provided from the conditioned space
Qwater thermal energy provided as hot water
RE recovery efficiency as measured by the DOE test procedure for residential water
heaters (10 CFR 430.23) in percent
SEER seasonal energy efficiency ratio
viiiTout outlet water temperature in °F
Tin inlet water temperature in °F
Tin,air indoor air temperature in °F;
Ttank set point of tank thermostat in °F
Vwater the average daily hot water volume drawn in gallons
W watt
Wh watt-hour
WH water heater
ρ density of water in pounds per gallon (8.34 lb/gal)
ixContents
Summary ............................................................................................................................................... iii
Acknowledgments................................................................................................................................. vii
Acronyms and Abbreviations ............................................................................................................... viii
1.0 Introduction .................................................................................................................................. 1.1
1.1 Project Scope ........................................................................................................................ 1.2
2.0 Background on Space Conditioning Interaction of Heat Pump Water Heaters Installed in
Conditioned Space ........................................................................................................................ 2.1
3.0 Experimental Protocol .................................................................................................................. 3.1
3.1 GE Generation II GeoSpring Hybrid Water Heater ............................................................. 3.1
3.2 Monitoring Approach ........................................................................................................... 3.2
3.2.1 Electrical Measurements ........................................................................................... 3.4
3.2.2 Temperature and Environmental Sensors.................................................................. 3.4
3.2.3 Data Acquisition System ........................................................................................... 3.5
3.3 HPWH Installation ............................................................................................................... 3.5
3.4 Occupancy Simulation ......................................................................................................... 3.8
3.4.1 Electrical Loads ......................................................................................................... 3.8
3.4.2 Hot Water Draw Profile ............................................................................................ 3.9
3.4.3 HVAC Operation....................................................................................................... 3.11
4.0 Results and Discussion ................................................................................................................. 4.1
4.1 Baseline ................................................................................................................................ 4.1
4.1.1 Air Leakage ............................................................................................................... 4.1
4.1.2 Energy Comparison ................................................................................................... 4.2
4.2 Impacts of Various Ducting Configurations on HVAC Energy Use ................................... 4.4
4.2.1 Cooling Season HVAC Energy Use Impacts ............................................................ 4.4
4.2.2 Heating Season HVAC Energy Use Impacts ............................................................ 4.5
4.3 Impacts on Thermal Comfort ............................................................................................... 4.9
4.4 Water Heating Energy Use ................................................................................................... 4.13
4.5 Whole-House Energy Impacts and Cost-Effectiveness........................................................ 4.16
5.0 Conclusions .................................................................................................................................. 5.1
5.1 Summary of Findings ........................................................................................................... 5.1
5.2 Recommendations and Future Experiments ......................................................................... 5.2
6.0 References .................................................................................................................................... 6.1
xiFigures
S.1 Daily HVAC Energy Use and Difference in HVAC Energy Use for the Exhaust-Only
Ducted Comparison and the Fully Ducted Comparison Periods in the Heating Season............... iv
3.1 Diagram of Key Components in a Unitary HPWH....................................................................... 3.1
3.2 Crawlspace Thermocouple Locations ........................................................................................... 3.4
3.3 GE Gen-II GeoSpring HPWH Installed in Lab Home Water Heater Closet ................................ 3.6
3.4 Transfer Grille and Thermostat Locations. Left: transfer grilles installed between water
heater closet and adjacent master bedroom closet. ....................................................................... 3.6
3.5 Left: Exhaust Ducting Approach on HPWH. Right: Supply Ducting Configuration on the
HPWH........................................................................................................................................... 3.8
4.1 Comparison of Cumulative HVAC Energy Use of Lab Home A versus Lab Home B ................ 4.3
4.2 Average Daily Water Heater Energy Use Profile for Lab Home A and Lab Home B in Heat
Pump Mode ................................................................................................................................... 4.4
4.3 Daily HVAC Energy Use and Difference in HVAC Energy Use for the Exhaust-Only
Ducted Comparison and the Fully Ducted Comparison Periods in the Cooling Season .............. 4.5
4.4 Daily HVAC Energy Use and Difference in HVAC Energy Use for the Exhaust-Only
Ducted Comparison and the Fully Ducted Comparison Periods in the Heating Season............... 4.6
4.5 Comparisons in the Heating Season and Cooling Season of Average HPWH Energy Usage,
Average Daily Thermal Energy Provided as Hot Water, Average Theoretical Contribution to
Hot Water Thermal Energy Provided by the Space, and the Average Difference in Daily
HVAC Energy Use in Lab Home B with an Unducted HPWH Compared to Lab Home A
with a Fully Ducted HPWH .......................................................................................................... 4.8
4.6 Water Heater Closet and Master Bedroom Interior Temperatures for Lab Home A and Lab
Home B for Six Days. ................................................................................................................... 4.10
4.7 Average Temperature and Standard Deviation in Each Room During the Exhaust-Only
Ducted Comparison Period in the Cooling Season ....................................................................... 4.11
4.8 Average Temperature and Standard Deviation in Each Room During the Fully Ducted
Comparison Period in the Cooling Season ................................................................................... 4.12
4.9 Average Temperature and Standard Deviation in Each Room During the Exhaust-Only
Ducted Comparison Period in the Heating Season ....................................................................... 4.12
4.10 Average Temperature and Standard Deviation in Each Room During the Fully Ducted
Comparison Period in the Heating Season.................................................................................... 4.13
4.11 Average Daily HPWH Energy Use During Exhaust-Only Comparison and Fully Ducted
Comparison Periods in the Cooling Season .................................................................................. 4.14
4.12 Average Daily HPWH Energy Use During Exhaust-Only Comparison and Fully Ducted
Comparison Periods in the Heating Season .................................................................................. 4.15
4.13 HPWH Outlet Temperature and Tank Temperature for the Fully Ducted and Exhaust-Only
Cases ............................................................................................................................................. 4.16
xiiTables
S.1 Annual Difference in HVAC, Water Heater, and Whole-House Energy Use and Associated
Energy Costs Calculated Based on the Experimental Data and the “Theoretical” Difference
in HVAC Energy Use ................................................................................................................... v
2.1 Components of Net Annual Source Energy Savings by BA Climate Zone When Replacing
an ERWH with a 50 gal HPWH Installed in Conditioned Space with Electric Resistance
Heat and Air Conditioning as the Heating and Cooling System. .................................................. 2.3
2.2 Components of Net Annual Source Energy Savings by BA Climate Zone When Replacing
an ERWH with a 50 gal HPWH Installed in Conditioned Space with an ASHP as the
Heating and Cooling System. ....................................................................................................... 2.4
2.3 Comparison of Water Heating Energy Savings and HVAC System Interactions and
Percentage Change in Net Energy Savings Due to HVAC System Interactions. ......................... 2.4
3.1 Metering Strategy and Equipment ................................................................................................ 3.2
3.2 Domestic Hot Water Heater Daily Use by End Use.. ................................................................... 3.10
4.1 Building Envelope Leakage as Measured by Blower Door Tests in the Baseline and
Experimental Homes..................................................................................................................... 4.2
4.2 Average and Standard Deviation of the Water Heater Closet Temperature in the Heating and
Cooling Seasons for the Exhaust-Only Ducted and Fully Ducted Comparisons .......................... 4.9
4.3 Average and Standard Deviation of Interior Temperatures Measured in the Main Body of the
House and the HPWH Closet Temperature in the Heating Season and Cooling Season for the
Exhaust-Only Ducted and Fully Ducted Comparisons ................................................................. 4.11
4.4 Annual Difference in HVAC, Water Heater, and Whole-House Energy Use and Associated
Energy Costs Calculated Based on the Experimental Data and the “Theoretical” Difference
in HVAC Energy Use ................................................................................................................... 4.18
xiii1.0 Introduction
Water heating represents approximately 18% of residential energy consumption, or 4.6 quadrillion
Btus of source energy use annually (EIA 2009) and efficient water heater options are necessary to achieve
significant energy savings in the residential sector. Heat pump water heaters (HPWHs) offer an efficient
option for the 41% of homes with electrically heated water heaters, with a theoretical energy savings of
up to 63%.3 Previous research has demonstrated the laboratory performance of HPWHs and has shown
savings of 47 to 63% are possible, based on standardized testing protocols (Larson et al. 2011).
The HPWH is the largest savings measure in the residential sector in the Northwest Power and
Conservation Council’s Sixth Northwest Power Plan at 492 average megawatts (Northwest Power and
Conservation Council 2010). There is also considerable energy savings potential nationwide for HPWH
technology. The nationwide installed base of electric water heaters is 46.8 million units (EIA 2009). If
only 10% of these water heaters were replaced with HPWHs that meet ENERGY STAR criteria, the
annual savings are estimated to be as much as 22 billion kilowatt-hours (kWh) and $2.7 billion in
customer electricity bills.
However, significant barriers must be overcome before this technology can reach widespread
adoption in the Pacific Northwest region and nationwide. One significant barrier noted by the Northwest
Energy Efficiency Alliance (NEEA) is the possible interaction with the homes’ space conditioning
systems for units installed in conditioned spaces. Such complex interactions may decrease the magnitude
of whole-house savings available from HPWHs installed in the conditioned space in cold climates and
could lead to comfort concerns (Larson et al. 2011; Kresta 2012). Modeling studies indicate that the
installation location of HPWHs can significantly impact their performance and the resultant whole-house
energy savings (Larson et al. 2012; Maguire et al. 2013). As a result, NEEA’s Northern Climate HPWH
Specification, which describes the characteristics a HPWH must have to be incentivized in cold climates
in the Pacific Northwest, requires exhaust ducting for their Tier II-specified product (NEEA 2013).4
There are currently only two manufacturers offering a total of five models of equipment meeting NEEA’s
Tier II specification (NEEA 2014).
In addition, if exhaust ducting on HPWHs is required or otherwise installed in some or all climates, it
will also be important to understand the source of supply air and the implications for interior
depressurization, particularly for tight homes and homes in high-radon areas. NEEA’s Northern Climate
HPWH Specification requires full ducting for a Tier III-specified product (NEEA 2013) and new
Northwest Energy Efficient Manufactured Housing specifications may necessitate similar requirements
(Larson and Hewes 2012). There are currently no manufacturers that offer equipment certified to meet
NEEA’s Tier III specification (NEEA 2014). However, the AirGenerate is now available with intake and
exhaust ducting (AirGenerate 2014) and intake/outlet duct adapter kits are available from State Water
Heaters (State Water Heaters 2012).
3
Based on the DOE test procedure (10 CFR 430.32(d)) and comparison of an ERWH (Energy Factor, EF = 0.90)
versus a HPWH (EF = 2.4)
4
NEEA incorporates three product Tiers into their Northern Climate HPWH Specification to recognize variations in
product performance and supported applications.
1.1Installing HPWHs with exhaust or full ducting increases the cost and complexity of the HPWH
installation, when it is required. Field data are necessary to verify modeling assumptions regarding the
magnitude of interactions between the HPWH and space conditioning system to justify the need to install
exhaust-only or full (supply and exhaust) ducting for HPWHs installed in conditioned space in cold
climates.
Another barrier to widespread HPWH market penetration is the impact of HPWHs on demand-
response (DR) programs, since HPWH DR characteristics are currently unknown. Many utilities
currently employ electric resistance water heaters (ERWHs) to reduce peak load by turning off the water
heater during times of peak demand. Some utilities are also demonstrating the potential of using HPWHs
to increase load for areas with high renewable energy penetration and to provide additional balancing and
ancillary (voltage regulation) services. There is a need to understand DR characteristics of HPWHs as
compared to ERWHs, including dispatchable kilowatts (kW), thermal capacity, and response time, to
effectively integrate HPWHs with utility DR programs.
1.1 Project Scope
This HPWH demonstration examines the overall performance of HPWHs installed in a conditioned
space with a number of supply and/or exhaust ducting configurations, as well as the interactions between
the HPWH and the home’s heating/cooling system. Space conditioning impacts of HPWHs include the
impact on the heating, ventilating and air conditioning (HVAC) system and thermal comfort issues that
could affect occupant satisfaction and market acceptance of these technologies. The project compares the
performance of a HPWH with no ducting, exhaust ducting, and full ducting (supply and exhaust) under
identical occupancy schedules and hot water draw profiles in the Pacific Northwest National Laboratory
(PNNL) Lab Homes. The following sections describe the experimental protocol and test apparatus used
to collect data, present the baselining procedure, discuss the results of each experiment, and provide key
conclusions based on the collected data for the space conditioning experiments.
In addition, this project characterized the DR of this second-generation HPWH to various price
signals. The results of the DR experiments are reported separately (Widder et al. 2013).
1.22.0 Background on Space Conditioning Interaction of Heat
Pump Water Heaters Installed in Conditioned Space
The current understanding regarding the interaction of HPWHs with space conditioning systems and
current recommendations regarding the installation of ducting in cold climate systems are based on
theoretical models that have not been verified by field data.
The National Renewable Energy Laboratory (NREL) has developed modeling capabilities for
HPWHs within the BEopt™ (Building Energy Optimization) software using the EnergyPlus simulation
engine, which calculates results on an hourly basis and includes transient effects (Wilson and Christensen
2012). Ecotope has also updated the SEEM energy model5 to include HPWH and space conditioning
interactions (Larson et al. 2011). In addition, in the 2010 residential water heater energy conservation
standard final rule (75 FR 20112 (April 16, 2010)), The U.S. Department of Energy (DOE) accounted for
HVAC interactions when calculating the savings associated with HPWHs (DOE 2010).
In general, these models appear to assume a complete energy balance around the water heater. That
is, 100% of the thermal energy provided as hot water (Qwater) is provided by both the water heater
electrical energy consumption (QHPWH) and thermal energy from the surrounding conditioned space
(QHVAC), as shown in Equation 1:
Qwater = QHPWH + QHVAC (1)
The calculations that occur in the EnergyPlus and SEEM energy models are typically dynamic hourly
simulations that also model standby losses from the tank and related impacts on interior temperatures.
However, from a simple energy balance perspective the standby losses can be ignored.
The thermal energy provided as hot water can be determined using Equation 2, as follows:
Qwater = Vwater ρ Cp,water (Tout − Tin)/1000 (2)
where
Qwater = the energy provided to the water in kWh
Vwater = the average daily hot water volume drawn in gallons
Tout = the measured outlet water temperature in °F
ρ = the density of water in pounds per gallon (8.34 lb/gal)
Cp,water = the specific heat capacity of water (1 Btu/lb·°F or 0.2931 Wh/lb·°F)
Tin = the measured inlet water temperature in °F.
The electrical energy provided as hot water is modeled directly, based on the performance of the HPWH
as a function of surrounding ambient temperature, the temperature of the hot water tank, and the
5
The SEEM program is designed to model small-scale residential building energy use. The program consists of an
hourly thermal simulation and an hourly moisture (humidity) simulation that interacts with duct specifications,
equipment, and weather parameters to calculate the annual heating and cooling energy requirements of the building.
SEEM, written at Ecotope, was developed by and for the Council and NEEA. SEEM is used extensively in the
Northwest to estimate conservation measure savings for regional energy utility policy planners. For more
information, see http://rtf.nwcouncil.org//measures/support/seem/.
2.1frequency and magnitude of hot water draws. The thermal energy contribution from the surrounding
conditioned space, which is made up by the HVAC system, can then be determined as the difference
between these two quantities, as indicated by Equation 1.
Note that the relative energy consumed as electricity, versus that transferred from the space, is a
function of the efficiency of the water heater. The coefficient of performance of the HPWH (COPHPWH) is
a measure of the thermal energy provided to the water versus the electrical energy consumed by the
HPWH, as shown in Equation 3:
(3)
Therefore, the total thermal energy provided as hot water and the thermal load on the space (QHVAC)
can also be calculated as a function of the efficiency of the water heater, as shown in Equations 4 and 5:
Qwater = QHPWH × COPHPWH (4)
QHVAC = QHPWH × (COPHPWH − 1) (5)
In Chapter 7 of the technical support document for the 2010 residential water heater energy
conservation standard final rule, DOE describes a similar calculation to determine a rate of cooling
introduced to the space, or heat removed from the space (DOE 2010). Specifically, DOE defined the
“cooling input” as described in Equation 6:
( )
(6)
where
CoolingInput = the amount of cooling added by the heat pump water heater in Btu/h
Ttank = the set point of tank thermostat in °F
Tin,air = the indoor air temperature in °F
PON,HPWH = the rated input power to the water heater in Btu/h
RE = the recovery efficiency as measured by the DOE test procedure for residential
water heaters (10 CFR 430.23) in %
PAHPWH = the performance adjustment factor that accounts for the impact of ambient
temperature on the efficiency of the HPWH
CoolingCapHPWH = the cooling capacity of heat pump water heater
and ρ, Cp, and Vwater are as previously defined. Modeling based on these assumptions has
demonstrated that space heating penalties can significantly reduce potential savings in cold climates,
depending on the type of heating system installed in the home.
NREL estimates that the heating system impact can decrease savings from a HPWH 33–67% if the
home is heated by an electric resistance furnace (Maguire et al. 2013). The colder climates will
experience the most significant impact, while the warmer climates will experience smaller impacts
because they are heating for less of the year, as shown in Table 2.1. This is observed as the change in
space heating in energy use increases in colder climate zones. Conversely, the change in space cooling
energy use decreases in colder climates. However, the change in space cooling energy is much smaller
than the change in space heating energy use, due to the relative efficiency of the heating and cooling
2.2systems. When the space cooling benefit is accounted for, the total change in net energy savings due to
HVAC system interactions ranges from a decrease of 14 to 63% of the water heating energy savings from
the HPWH alone.
Table 2.1. Components of Net Annual Source Energy Savings (in MMBtu) by BA(a) Climate Zone
When Replacing an ERWH with a 50 gal HPWH Installed in Conditioned Space with Electric
Resistance Heat and Air Conditioning as the Heating and Cooling System. Source: Maguire
et al. 2013.
Change Percent Percent
Total Percent
in Change in Change in Change in
Change in Change in Net
BA Water Space Water Change in
COP Space Water Heating
Climate Heating Heating Heating Water Heating
HPWH Cooling Savings Due to
Zone Energy Energy Savings Due Savings Due to
Energy Use HVAC System
Use Use to Heating Cooling
Interactions(b)
HPWH Penalty(b) Benefit(b)
Hot-
2.0 −16.59 5.44 −32.79% −3.14 18.93% −13.86%
Humid
Mixed-
1.9 −19.38 10.08 −52.01% −2.22 11.46% −40.56%
Humid
Hot-Dry 1.7 −17.08 8.32 −48.71% −1.90 11.12% −37.59%
Mixed-
1.5 −18.79 9.97 −53.06% −1.62 8.62% −44.44%
Dry
Marine 1.7 −20.72 15.44 −74.52% −0.52 2.51% −72.01%
Cold 1.6 −21.01 12.66 −60.26% −1.49 7.09% −53.17%
Very
1.5 −22.47 14.95 −66.53% −0.91 4.05% −62.48%
Cold
(a) BA = Building America
(b) A positive change in water heating energy savings indicates increased savings (decreased energy use), while a negative
change in water heater energy savings indicates decreased savings (increased use) as compared to the modeled water heater
energy savings from the HPWH without accounting for the space conditioning impact.
If the home is heated by a heat pump, the space conditioning impact is reduced as a function of the
efficiency of the heating system. For an air source heat pump (ASHP) with a seasonal energy efficiency
ratio (SEER) of 13, NREL demonstrated the space conditioning impact was reduced by more than half to
between 11 and 35%, depending on the climate zone, as shown in Table 2.2.
2.3Table 2.2. Components of Net Annual Source Energy Savings (in MMBtu) by BA Climate Zone When
Replacing an ERWH with a 50 gal HPWH Installed in Conditioned Space with an ASHP as
the Heating and Cooling System. Source: Maguire et al. 2013.
Percent
Change Percent
Change in Total Percent
in Change Change in Change in
Change in Change in Net
BA Water in Space Water Space
Water Water Heating
Climate COPHPWH Heating Heating Heating Cooling
Heating Savings Due to
Zone Energy Energy Savings Due Energy
Savings Due HVAC System
Use Use to Heating Use
to Cooling Interactions(a)
HPWH Penalty(a)
Benefit(a)
Hot- 2.0 −16.98 1.90 −11.19% −3.65 21.50% 10.31%
Humid
Mixed- 1.9 −19.78 4.17 −21.08% −2.54 12.84% −8.24%
Humid
Hot-Dry 1.7 −17.5 2.79 −15.94% −2.15 12.29% −3.66%
Mixed- 1.5 −19.19 4.28 −22.30% −1.79 9.33% −12.98%
Dry
Marine 1.7 −21.13 5.28 −24.99% −0.59 2.79% −22.20%
Cold 1.6 −21.41 6.16 −28.77% −1.68 7.85% −20.92%
Very 1.5 −22.84 8.09 −35.42% −1.03 4.51% −30.91%
Cold
(a) A positive change in water heating energy savings indicates increased savings (decreased energy use), while a negative
change in water heater energy savings indicates decreased savings (increased use) as compared to the modeled water heater
energy savings from the HPWH without accounting for the space conditioning impact.
The cooling system interaction is typically smaller than the heating system interaction due to the
efficiency of the refrigeration cycle in air-conditioning and ASHP equipment (Maguire et al. 2013).
Modeling by Larson et al. (2011) demonstrated similar impacts for the climate zones in the Pacific
Northwest, with between 52 and 57% of water heater savings diminished by increased heating system
energy use for an electric resistance furnace installed in conditioned space, as shown in Table 2.3.
Accounting for the cooling system benefit reduced the net impact slightly, to between 46 and 52% of the
annual water heating energy savings.
Table 2.3. Comparison of Water Heating Energy Savings (kWh/yr) and HVAC System Interactions
(kWh/yr), and Percentage Change in Net Energy Savings Due to HVAC System Interactions
(%). Source: Larson et al. 2011.
Change Change in
Percent Change in Percentage Total Percent
in Water Space
PNW Change in Space Cooling Change in Change in Net
Heating Heating
Climate Savings Due Energy Use Savings Due to Savings Due to
Energy Energy Use
Zone to Heating (SEER 13 Cooling HVAC System
Use (Zonal
Penalty(a) ASHP) Benefit(a) Interactions(a)
HPWH Resistance)
Heating
823 −52% −46%
Zone 1(b)
Heating
−1578 845 −53% −91 6% −48%
Zone 2
Heating
907 −57% −52%
Zone 3
(a) A positive change in water heating energy savings indicates increased savings (decreased energy use), while a negative
2.4change in water heater energy savings indicates decreased savings (increased use) as compared to the modeled water heater
energy savings from the HPWH without accounting for the space conditioning impact.
(b) For regional energy analysis, the Pacific Northwest divides the region, which consists of Montana, Idaho, Washington, and
Oregon, into three Heating Zones based on the different climates experienced in the region. See the Northwest Power and
Conservation Council’s Sixth Power Plan for more details. (Northwest Power and Conservation Council 2010;
http://www.nwcouncil.org/media/6290/SixthPowerPlan_Appendices.pdf, pp. E-17 and E-18).
However, comparative field data are not available to verify modeling assumptions or modeled
performance.
2.53.0 Experimental Protocol
The purpose of this project is to evaluate the energy performance and DR characteristics of General
Electric’s (GE’s) second-generation GeoSpring™ hybrid water heater in controlled experiments in
PNNL’s matched pair of Lab Homes.6 The research protocol consists of two primary experiments
designed to measure the performance and impact on the Lab Home HVAC system during heating and
cooling season periods of HPWHs in two pairs of configurations:
1. a GE GeoSpring HPWH configured with exhaust ducting compared to an unducted GeoSpring
HPWH
2. a GeoSpring HPWH with both supply and exhaust air ducting as compared to an unducted GeoSpring
HPWH
Both homes deployed identical simulated occupancy and hot water use schedules so that the
performance and effects of the HPWHs can be isolated from all other variables. The following sections
describe the key experimental resources and equipment, the research protocol, and the baselining
procedure implemented to provide data quality and significance.
3.1 GE Generation II GeoSpring Hybrid (Heat Pump) Water Heater
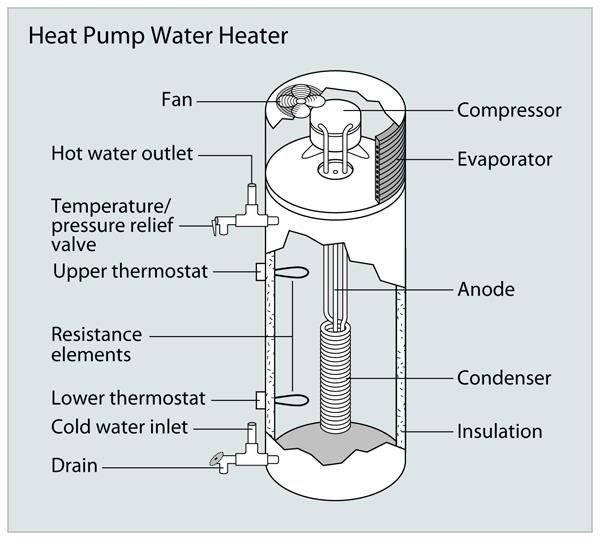
HPWHs work by transferring heat from the ambient air to the water in the tank via a refrigeration
cycle, similar to heat pumps that condition air. This process provides more energy to the water than it
uses in electricity. Figure 3.1 shows the key components in a HPWH.
Figure 3.1. Diagram of Key Components in a Unitary HPWH. Source: U.S. DOE; energysavers.gov.
The HPWH selected for evaluation in this project is the second-generation GE GeoSpring Hybrid
Water Heater (model GEH50DEEDSR), which is enabled with Brillion™ wireless communication and
6
(http://labhomes.pnnl.gov)
3.1control technology. Two GE GeoSpring HPWHs were purchased for this project, both of which were
manufactured in Louisville, Kentucky. The GE GeoSpring HPWH has a nominal 50-gallon tank and two
methods of heating water: a highly efficient compressor and two 4500-watt (W) electric elements. The
unit is equipped with onboard controls that dictate which heating mode is used to heat water. These
modes consist of “Heat Pump,” “Hybrid,” “High Demand,” “Standard,” and “Vacation.” The specific
control strategies employed in each of these modes are explained in detail in documentation on the GE
website (GE Appliances 2012) and have been evaluated in the laboratory by Larson and Logsdon (2012).
The GE GeoSpring HPWH has a typical operating range between 100°F and 140°F, although
temperatures lower than 100°F are accessible in the “Vacation” setting.
For this experiment, the two GE GeoSpring water heaters were installed in the water heater closets in
the conditioned spaces in Lab Home A and Lab Home B. The homes were modified by PNNL for this
experiment as described in Section 3.3. Both HPWHs were operating in “Heat Pump” mode for all
experimental periods, to maximize the impact on the space conditioning system.
3.2 Monitoring Approach
The monitoring approach included metering and system-control activities taking place at both the
electrical panel and at the hot water end use. Monitoring was broken into electrical, air temperature,
relative humidity, water temperature, and flow rate measurements. Table 3.1 highlights the performance
metric (the equipment/system being monitored), the monitoring method and/or point, the monitored
variables, the data application, and whether the monitoring existed in the Lab Homes or was newly
installed and commissioned as part of this HPWH evaluation. All metering was done using Campbell®
Scientific data loggers at 1-minute, 15-minute, and hourly intervals. Metering points in the PNNL Lab
Homes not relevant to the HPWH experiments and further technical specifications on the controllable
breaker panel, data acquisition system, and relevant sensors are described in detail in a previous report
(Widder et al. 2012).
Table 3.1. Metering Strategy and Equipment
Monitoring
Monitored Parameter Monitored Variables Data Application
Method/Points
Electrical Power Measurements
Whole-House Electrical
Power and Circuit Level
Comparison and difference
Power 1 Campbell Scientific
calculations between homes of
HPWH Electrical Power data acquisition system
–time-series power profiles
Electric Power for HPWH with 42 circuit kW, amps, volts
and
Fan transducers at electrical
–energy use differences and
Power for Electric Heaters power mains and panel
savings
Electric Power for Air
Conditioning or Heat Pump
3.2Monitoring
Monitored Parameter Monitored Variables Data Application
Method/Points
Air Temperature and Humidity Measurements
13 ceiling-hung Comparison and difference
thermocouples/1–2 calculations between homes of
Space Temperatures sensors per room/area, Temp., °F –temperature profiles
and 1 HVAC duct supply –time-series temperature
temperature per home changes
2 relative-humidity Comparison and difference
Space Relative Humidity sensors per home (main calculations between homes of
RH, %
(RH) living area, hall outside –RH profiles and
of bathroom) –time-series RH changes
Thermocouple or
Water Heater Closet Determine impact of supply
thermistor directly in
Supply Air Temperature Temp., °F air temp on HPWH
front of supply air grille
and RH performance
or in duct (if ducted)
Thermocouple or Determine HPWH
Return Air Temperature thermistor directly in Temp., °F temperature difference across
and RH front of return air grille RH, % the coil and impact of exhaust
or in duct (if ducted) air temp on conditioned space
Four thermocouples
equally spaced Assess impact of HPWH on
Water Heater Closet Air approximately 2 ft apart water heater closet
Temp., °F
Temperature and RH to capture the vertical temperature and determine
temperature gradient in extent of stratification
the water heater closet
Thermocouple(s) or
thermistor(s) to measure Determine impact of
temperature in at least crawlspace air temp on
Crawlspace Temp Temp., °F
one location (near duct supply-ducted HPWH
inlet) and one at each performance
end (east and west)
Temp., °F
Humidity, % Analytical application to
Meteorological Package station mounted Wind speed, m/s quantify setting and develop
Measurements on Lab Home B Wind direction routines for application to
Barometric pressure, mm other climate zones
Rainfall, inches
Water Temperature Measurements
Characterize impact of
Inlet Water Temperature Insertion thermocouple Temp., °F incoming water temperature
on HPWH performance
Monitor outlet water
Outlet Water Temperature Insertion thermocouple Temp., °F temperature to determine
impact on delivered hot water
Thermocouple(s) near
Tank Temperature tank on thermal cut-out Temp., °F Monitor tank temperatures
sensors
Flow Rate Measurements
Turbine flow meter, in Verify water draws are in
Outlet Water Flow Rate line with hot water outlet Flow rate, gpm accordance with specified
prior to mixing valve profile
Verify airflow rate to HPWH
Exhaust Air Flow Rate Exhaust fan flow meter Flow rate, CFM in different duct
configurations
3.33.2.1 Electrical Measurements
In each home, all 42 of the panel electrical breakers were monitored for amperage and voltage. The
resulting data were used to calculate apparent and real power (kVA/kW). All data were captured at
1-minute intervals by the data logger.
3.2.2 Temperature and Environmental Sensors
Space Temperature. Identical networks of temperature sensors are deployed in both homes. Each
defined area of the home (individual rooms, hallway, and open living areas) has at least one
thermocouple; a total of 17 space temperature thermocouples were installed per home. These include four
thermocouples installed vertically spaced in the water heater closets to evaluate stratification within the
closet. All temperature measurements were taken with Type T thermocouples at 1-minute intervals by the
Campbell Scientific data logger.
Supply and Exhaust Air Temperatures. Type T thermocouples (two) were installed to measure supply
and exhaust process air through the heat pump compressor. Three crawlspace temperature sensors
monitoring the temperature of the crawlspace were also installed, which will be the temperature of the
supply air when the HPWH is configured in the fully ducted arrangement. A diagram of the crawlspace
temperature locations is shown in Figure 3.2.
Lab Home
crawlspace
Thermocouple
locations
Gravel
driveway
Road
Figure 3.2. Crawlspace Thermocouple Locations (plan view)
Water Temperature. Water temperatures were recorded for the incoming water to the tank, the
outgoing water delivered to the fixture, and for the tank at the high and low thermal cut-out sensors. All
temperature measurements were taken with Type T thermocouples at 1-minute intervals by the Campbell
Scientific data logger.
3.4Water Flow Rate. The water flow rate is measured using a low-flow impeller-type flow meter with
375 to 1380 pulses per gallon (0.07–5 gallon or 0.2–20 gallon range, depending on the model) with a 6–
24 VDC output. This information is important to verify that the water draw schedule is identical in both
homes and to verify overall draw volumes and rates. After installation, it was determined that the meters
required field calibration. After field calibration, the flow meter in Lab Home A had a K-factor of 480
and that in Lab Home B had a K-factor of 1,371.
Relative Humidity. Two humidity sensors were installed in each home, one in the living area and one
in the hallway. These data were collected and compared to verify that comparable humidity profiles were
present in each home.
3.2.3 Data Acquisition System
All metering equipment, data loggers and indoor and outdoor sensors were installed and
commissioned prior to initiating testing. Data from all sensors were collected via four data acquisition
systems, one for environmental sensors and one for energy sensors in each home. Data were downloaded
using Internet Protocol cellular modems. A polling computer, located in the metering lab on the PNNL
campus, was connected to each logger using Campbell Scientific software. Data were recorded on
1-minute, 15-minute, and hourly intervals. One-minute data was used for all analysis to capture any
short-duration changes in energy use within the home—for example, from a heating element cycling on—
and to limit error introduced from averaging over longer time periods. Data were averaged over hourly
intervals for analysis. Calculated hourly averages were compared to the recorded hourly data as part of
the data quality assurance process.
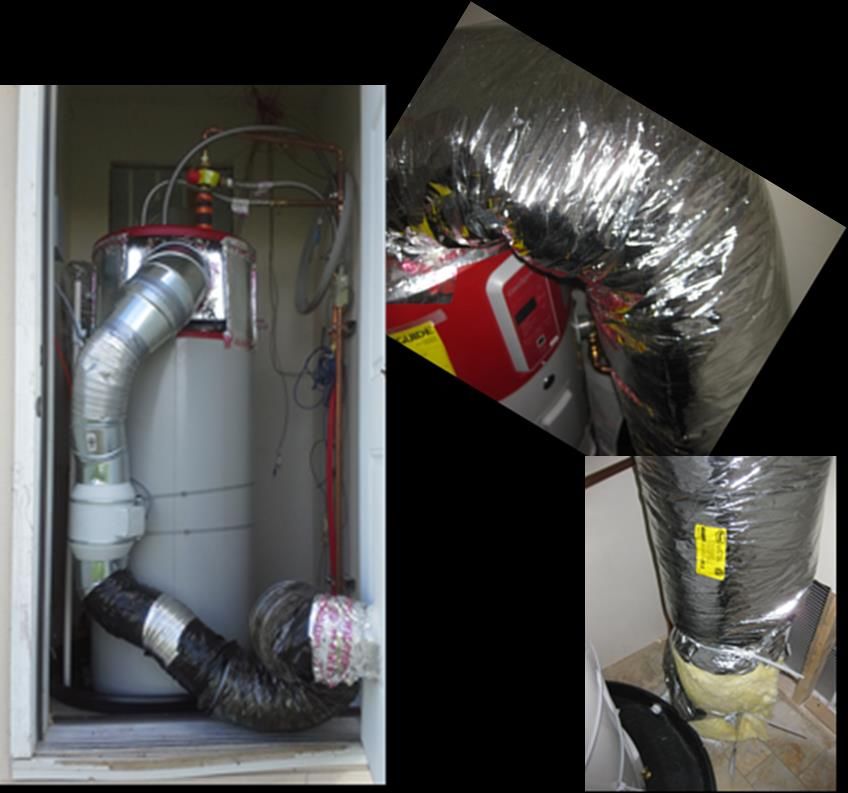
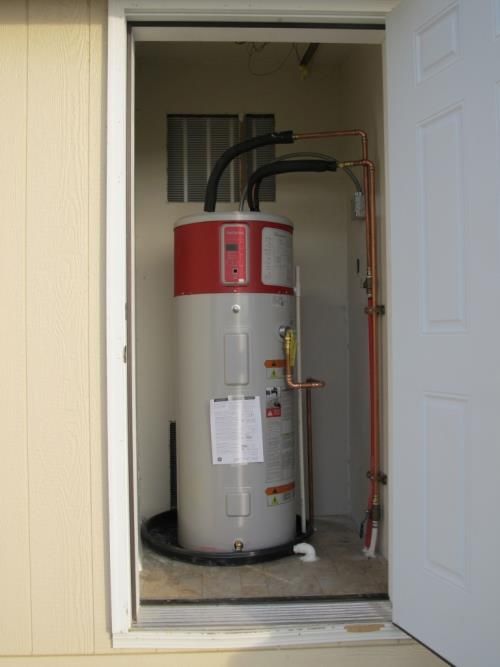
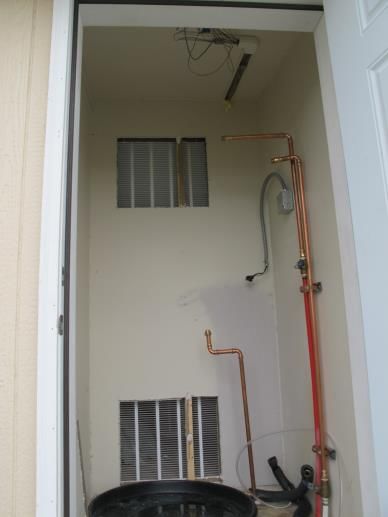
3.3 HPWH Installation
From December 2012 through February 2013, the Lab Homes were modified to each be equipped
with a GE GeoSpring HPWH. The HPWHs were installed in the water heater closets in both homes, as
shown in Figure 3.3. Installation of the HPWHs was in accordance with regional protocols developed by
NEEA for the Northern Climate Specifications and the GE product installation instructions (NEEA 2013;
GE Appliances 2014).
3.5Figure 3.3. GE Gen-II GeoSpring HPWH Installed in Lab Home Water Heater Closet
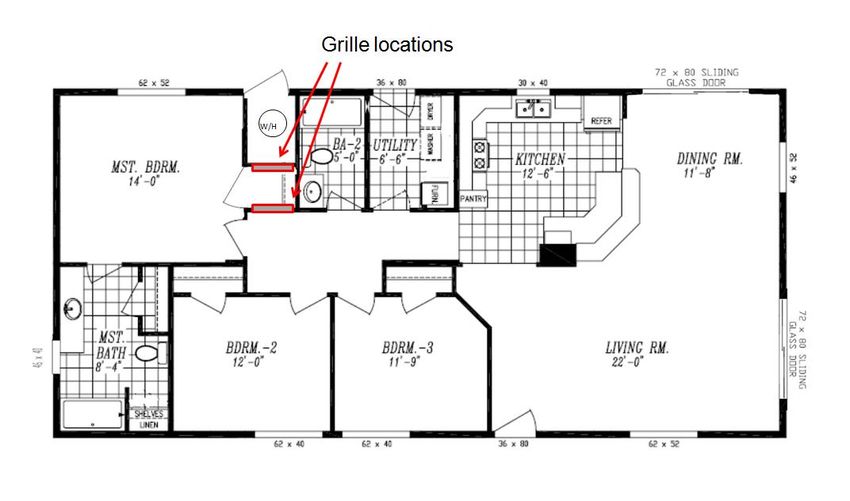
The water heater closet was modified to allow free airflow with two pairs of 25-inch 20-inch metal
transfer grilles into the master bedroom closet (adjacent to the water heater closet) and the hallway
(adjacent to the master bedroom closet), as indicated in Figure 3.4.
Thermostat
Figure 3.4. Transfer Grille and Thermostat Locations. Left: transfer grilles (25-inch 20-inch) installed
between water heater closet and adjacent master bedroom closet. Right: location of grilles
on wall 1) between water heater closet and master bedroom closet and 2) between master
bedroom closet and hallway to provide sufficient free airflow to the water heater closet
One grille was installed low on the wall and one high, to help induce mixing. They were provisioned
with magnetic covers to allow for blocking one of the airflow paths to study the impact of grille
placement and size on HPWH performance. Each grille area is greater than 100% of the requirement
specified in the GE product literature of 240 square inches (GE Appliances 2014).
3.6The water heater in Lab Home A7 was modified to accommodate supply and exhaust ducting. The
ducting was designed to be easily connected and disconnected based on the experiment. The design for
exhaust and supply ducting was developed in coordination with the project collaborators, including GE
technical staff who reviewed the proposed approach. The exhaust ducting conforms to GE patent
information on exhaust ducting for a GE HPWH (Nelson et al. 2012). Off-the-shelf duct components
were used to construct a 6-inch diameter exhaust duct, which connects to a shroud designed to fit over the
HPWH fan housing with the HPWH cover removed.
However, due to the location of the water heater closet exterior access door, the exhaust ducting had
to be configured through the exterior access door to allow the door to remain operable. This required a
longer, more circuitous exhaust ducting path. Because of the increased flow resistance caused by such
configuration, and to overcome the additional static pressure requirements of drawing supply air, an inline
120-V, 2-speed exhaust fan was installed in the exhaust duct and wired to the HPWH compressor fan to
operate only when the HPWH compressor fan is running. With 0.25 inches of static pressure, the fan is
designed to deliver 163 cubic feet per minute (CFM) of air at the low-speed setting and 250 CFM of air at
the high-speed setting.8
The supply ducting was a novel approach, with the airflow path drawing air from the crawlspace to
the air intake on the top of the HPWH. A shroud was constructed that could be fastened to the top of the
HPWH air intake, over the filter. An insulated 8-inch duct dropped straight down from the shroud to the
water heater closet floor and penetrated through the floor to the crawlspace, as shown in Figure 3.5.
7
The water heater in Lab Home B had no ducting capability.
8 Soler & Palau. Mixed Flow Duct Fan, 8-3/8 In. L, Ball. Specifications are available through Grainger at:
http://www.grainger.com/Grainger/SOLER-PALAU-Mixed-Flow-Duct-Fan-3CGA6
3.7Exterior
Door
Figure 3.5. Left: Exhaust Ducting Approach on HPWH. Right: Supply Ducting Configuration on the
HPWH
3.4 Occupancy Simulation
To simulate occupancy for the HPWH experiments, hot water draw profiles were implemented
identically in both homes. The hot water draws used a modulating solenoid valve at the kitchen sink hot
water supply and were controlled via the Campbell data acquisition system. Other occupancy loads in the
homes were simulated via a programmable breaker panel (one per home) employing motorized breakers
to simulate sensible loads associated with occupancy, lighting, and equipment and appliance loads. The
simulated electrical loads and the selection of the hot water draw profile are described in the following
section.
3.4.1 Electrical Loads
Controllable breakers were programmed to activate connected loads on schedules to simulate human
occupancy. The bases for occupancy simulation were data and analysis developed in previous residential
simulation activities (Hendron and Engebrecht 2010; Christian et al. 2010). The occupancy simulations
3.8You can also read