Clinical Evaluation of Fever-Screening Thermography: Impact of Consensus Guidelines and Facial Measurement Location
←
→
Page content transcription
If your browser does not render page correctly, please read the page content below
Clinical Evaluation of Fever-Screening Thermography: Impact of Consensus Guidelines and Facial Measurement Location YANGLING ZHOU University of Maryland PEJMAN GHASSEMI Food and Drug Administration MICHELLE CHEN Johns Hopkins University DAVID MCBRIDE University of Maryland JON P. CASAMENTO Food and Drug Administration T. JOSHUA PFEFER Food and Drug Administration QUANZENG WANG ( quanzeng.wang@fda.hhs.gov ) Food and Drug Administration Research Article Keywords: Keywords: fever screening, thermography, medical guidelines, inner canthi, infectious disease epidemics, COVID- 19, receiver operating characteristic, Pearson correlation coe cients, thermometry, facial maximum temperatures DOI: https://doi.org/10.21203/rs.3.rs-28139/v1 License: This work is licensed under a Creative Commons Attribution 4.0 International License. Read Full License Page 1/25
Abstract
Infrared thermographs (IRTs) have been used for fever screening during infectious disease epidemics,
including SARS, EVD and COVID-19. Although IRTs have signi cant potential for human body temperature
measurement, the literature indicates inconsistent diagnostic performance, possibly due to wide variations
in implemented methodology. A standardized method for IRT fever screening was recently published, but
there is a lack of clinical data demonstrating its impact on IRT performance. We have performed a clinical
study of 596 subjects to assess the diagnostic effectiveness of standardized IRT-based fever screening and
evaluate the effect of facial measurement location. Temperatures from 17 facial locations were extracted
from thermal images and compared with oral thermometry. Statistical analyses included calculation of
receiver operating characteristic curves and area under the curve (AUC) values for detection of febrile
subjects. Pearson correlation coe cients for IRT- based and reference temperatures were found to vary
strongly with measurement location. Approaches based on maximum temperatures in either inner canthi or
full-face regions indicated stronger discrimination ability than maximum forehead temperature (AUC values
of 0.95-0.97 vs. 0.86-0.87, respectively) and other speci c facial locations. These values are markedly better
than the vast majority of results from in prior human studies of IRT- based fever screening. Thus, our
 ndings provide clinical con rmation of the utility of consensus approaches for fever screening, including
the use of inner canthi temperatures, while also indicating that full-face maximum temperatures may
provide an effective alternate approach.

1. Introduction
Fever is a key symptom of infectious diseases that have caused epidemics such as Severe Acute
Respiratory Syndrome (SARS) in 2003, in uenza A (H1N1) in 2009, Ebola virus disease (EVD) in 2014 and
coronavirus (COVID-19) in 20201-6. Fever screening is a medical countermeasure used at international
borders, public transportation hubs and hospitals to mitigate the propagation of these diseases. Often, a
diagnostic based on radiative heat transfer from the human body (i.e., infrared technology) is used for
primary screening in combination with other approaches, such as symptom questionnaires3,7,8. If the
subject is determined to be positive in primary screening, a secondary screening may be implemented
including contact measurements (e.g., oral thermometry) and/or sampling for a laboratory test.

Non-contact infrared thermometers (NCITs)9,10 and infrared thermographs (IRTs)11 represent the primary
device types currently used in practice for real-time screening of infectious disease during epidemics. NCITs
and IRTs are passive remote sensing devices that detect mid- and/or long-wave infrared (IR) radiation and
convert that radiation to temperature based on the Stefan-Boltzmann law12. NCITs estimate temperature at
a reference body site (usually oral) based on measurements of a single region of skin (e.g., forehead)13,
whereas IRTs provide a 2D temperature distribution – typically of the face – thus enabling a wider range of
options for body temperature estimation. Although NCITs currently represent the primary tool for fever
screening during epidemics14, their accuracy has been called into question, particularly relative to IRTs15,16.
NCIT error may be due to a range of factors including the common use of forehead measurement locations,
which are subject to uctuations due to environmental factors like ambient temperature and air ow7.

 Page 2/25
Human subject studies have demonstrated that IRTs can estimate body temperature and detect febrile
individuals with moderately high accuracy. Several studies on IRT-based fever detection screening in
hospital settings found “optimal” sensitivity (Se) and speci city (Sp) values – the point on the receiver
operator characteristic (ROC) curve where both Se and Sp are high – in the 0.70-0.80 range15,17,18. Hewlett
et al. studied patients arriving at a hospital during the 2009 H1N1 in uenza pandemic and found Se/Sp of
0.70/0.92 (area under the curve, AUC = 0.86) for IRT-identi ed subjects with fever above 100 °F (37.8 °C),
although no data was provided on detection of subjects infected with H1N1 in uenza19. One study
performed in an airport also indicated similar Se/Sp levels, yet identi ed a minimal number of infected
travelers20; this result was attributed to a lack of high fevers in the infected travelers identi ed. Similarly, in
another airport screening study, Cho et al. were only able to detect 6 febrile travelers out of over 350,000
screened21. This lack of sensitivity may have been due in part to using a wide- eld screening approach
rather than the single-subject approach implemented in most of the aforementioned studies. In an
extensive review of screening procedures during infectious disease epidemics, Mouchtouri et al.22, indicated
that thermal diagnostics can be somewhat effective, yet often require great resource expenditures (e.g.,
device cost, personnel), and in the case of some epidemics like SARS, their practical impact may be
minimal. However, this review did not address variations in IRT device quality and implementation, which
are likely signi cant factors in determining real-world effectiveness23,24.

Improvements in IRT-based temperature measurement accuracy could enable detection of lower grade
fevers (e.g., 37-38 °C). Such temperatures may be associated with early disease stages, such when
symptoms are starting to become evident in COVID-19 25 and viral shedding is particularly high26. This
capability may be particularly relevant to transportation and containment, since individuals with fully
developed symptoms may remain home or seek medical care, whereas those with less severe symptoms are
more likely to travel. Furthermore, in diseases with signi cant person-to-person variations in symptom
intensity, fully developed illness with low grade fever would be more common. Alternately, enhanced IRT
system accuracy could enable improved Se or Sp for high grade fever, thus reducing the large number of
false positives that are likely due to the high prevalence of afebrile individuals and wide variations in normal
temperatures27 or slightly improving the likelihood of detected infected individuals.

Optimizing IRT-based screening requires consideration of fundamental device performance, implementation
practices and confounding factors such as environmental conditions. With the steady increase in use of
IRTs for medical applications, consensus documents for IRT evaluation and application have recently been
published. International standard IEC 80601-2-59:201723 provides recommendations for performance
characterization of fever- screening IRTs. In a prior study, we implemented and evaluated these
recommendations using two commercial IRTs28, but we are not aware of any prior IRT clinical study which
has implemented this standard. A consensus technical report, ISO/TR 13154:201724, describes best
practices for IRT deployment, implementation and operation. These include approaches that have not been
commonly employed during disease epidemics, such as including a high-quality blackbody in the thermal
image to minimize the impact of environmental factors as well as IRT instability and drift. This report also
recommends measurements be performed on individuals rather than a crowd, and that the inner canthus
(tear duct) regions be measured in order to reduce measurement variability.
 Page 3/25
IRTs measure body surface temperatures that can be calibrated to or matched with corresponding oral or
tympanic temperatures, which provide optimal discrimination based on ROC curve analysis. While some
prior studies have equated oral and tympanic temperatures with core temperature, it is more accurate to say
that these internal, yet accessible sites act as well-correlated surrogates for core temperature27,29. In IRT
images, a variety of facial measurement locations and processing methods have been investigated to
optimize IRT fever screening performance. The inner canthi are thought to be an ideal location for non-
contact temperature measurements. Perfused by the internal carotid artery, they have high temperature
stability, are typically the warmest regions on the face, and have the highest correlation with internal body
temperature11,30,31. However, another study concluded that the correlation between ear (contact) and eye
(non-contact) temperature was lower than expected32. The maximum temperature around the eyes has also
been studied8. Several other IRT measurement regions have been evaluated, including the entire face1,19,33,
temples34, nose34, cheeks34, ear34, mouth (open and closed)34, and the forehead1,35. From these previous
studies, it is di cult to draw a clear conclusion regarding the optimal approach for temperature
measurement from IRT images.

The purpose of this study was to generate independent data to assess the potential of IRTs for fever
screening when implemented according to international consensus documents, while also elucidating the
impact of facial measurement location and other key issues on IRT-based fever screening performance.
Speci cally, our goals included: (a) acquisition of clinical IRT and reference temperature data in a large
population of febrile and non- febrile subjects using standardized methods; (b) evaluation of facial
measurement locations for their impact on correlation to – and absolute agreement with –oral temperature;
and (c) comparative statistical analysis of febrile subject detection performance using these methods.

2. Methods
Over the course of 18 months – from November 2016 to May 2018 – we conducted a clinical study of 596
subjects at the Health Center of the University of Maryland (UMD) at College Park. Both FDA and UMD
Institutional Review Boards (IRBs) approved this study under FDA IRB study #16-011R and written informed
consent was obtained from all subjects. All experiments were performed in accordance with relevant
guidelines and regulations. Informed consent has been obtained for publishing recognizable images (Figure
3a) in this paper. The screening area was prepared according to consensus document speci cations23,24.
Measurements of study subjects were performed with an oral thermometer, multiple NCITs and two IRTs.
The NCIT data and analysis will be the subject of a future paper. As detailed below, the current work focuses
on analysis of a subset of the measurements acquired for each subject.

2.1 Experimental setup and temperature measurement

As noted in ISO/TR 13154 and IEC 80601-2-59, a screening thermograph system includes an IRT and an
external temperature reference source, or blackbody. The reference source should have a known radiance
temperature (function of real temperature and emissivity, ε) over the range of 33°C to 40°C with an
expanded uncertainty (coverage factor of 2 for a ~95% level of con dence ) of ± 0.3°C or less and a
combined stability and drift of ± 0.1°C over the temperature interval for measurement, and its image size
 Page 4/25
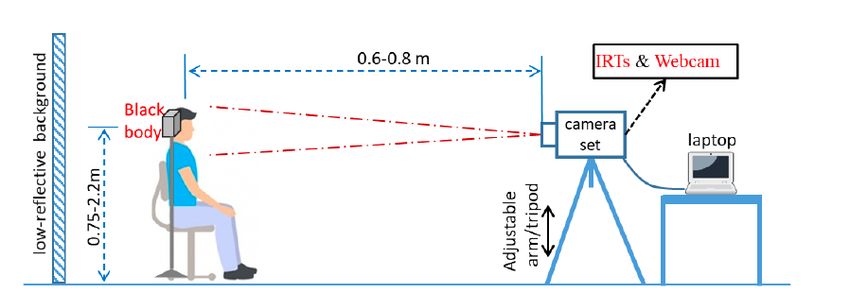
should be greater than or equal to 20×20 pixels. A workable target plane (WTP) is a speci c region of the
target plane that is used for temperature measurement; it should accommodate a subject's face positioning
from 0.75 to 2.2 meters above the oor. The WTP image pixel size should be at least 320×240. For ambient
conditions, the temperature should be 18-24°C and relative humidity should be 10-75%. Forced cooling or
heating of the target due to air ow or lighting should be avoided or at least minimized.

Based on ISOTR 13154 recommendations, a screening room was established as illustrated in Figure 1. The
setup consisted of a webcam (C920, Logitech, Lausanne, Switzerland) and two IRTs (IRT-1: 320×240 pixels,
A325sc, FLIR Systems Inc., Nashua, NH; IRT-2: 640×512 pixels, 8640 P-series, Infrared Cameras Inc.,
Beaumont, TX) that were mounted in adjacent positions on a tripod. A WTP with dimensions of 320×240
pixels was identi ed for each IRT – the entire image for IRT-1 and a subset of the image in the most uniform
region for IRT-2. We developed a graphical user interface (GUI) with MATLAB to simultaneously control the
webcam and two IRTs, as well as to collect images and patient/environmental information. Both IRTs had
30 Hz frame rates, and detailed speci cations and fundamental performance testing results can be found in
our prior study28. A blackbody (SR-33, CI Systems Inc.) with a 4 × 4 inch emitter (image size > 20 × 20
pixels) was set at 35°C then positioned perpendicular to the sight line of the cameras and placed within the
frame alongside the subject’s face for temperature drift compensation. We previously veri ed that
blackbody drift and uncertainty satis ed relevant standards28. The subject-to-camera distance was 0.6-0.8
meters to ensure that both the subject's face and the blackbody were included in the WTP with a resolution
that satis ed recommended speci cations. Room temperature was maintained between 20°C and 24°C and
relative humidity between 10% and 62%, as measured by a weather tracker (Kestrel 4500 NV, Weather
Republic LLC, Downingtown, PA). Ambient temperature and subject ε (0.98 for human skin36) were entered
into the IRT control program as input parameters for calibrating measured temperature. To prevent direct
air ow to a subject’s face, an air vent in the room was blocked by a magnetic air de ector. A black, low-
re ectivity cloth (ε=0.97; Type 822 E0.97, Group 8 technology, Provo, UT) was used as the backdrop.

To minimize the in uence of outside temperature, each subject was instructed to wait for 15 minutes before
measurements started. Once seated, the subject was asked to remove all obstructions from the face (e.g.,
eyeglasses and hair on forehead) and look at the IRTs. Then, the tripod was adjusted to center the subject's
face in the cameras' elds of view. For each subject, four rounds of measurements were performed within
~25 minutes, following the procedure shown in Figure 2. In each round, temperatures were measured with
two IRTs (facial images) and several NCITs (forehead temperature). NCIT measurements performed in this
study are beyond the scope of the current paper but are under analysis for a future publication.

During each round of imaging, the webcam acquired one standard color image, while each IRT acquired
three consecutive frames (acquisition time ~ 0.1 sec) that were averaged to reduce noise and form a single
mean thermal image. In the last round, the subject was instructed to open their mouth to enable thermal
imaging of sublingual tissue. Images from the second to fourth rounds of measurements were omitted in
the current analysis, to better approximate a realistic screening scenario, but will be evaluated in a future
study.

 Page 5/25
Oral thermometry was used to establish reference temperatures32. A thermometer (SureTemp Plus 690,
Welch Allyn, San Diego, CA) was placed under the subject’s tongue in a sublingual pocket (heat pocket).
Then the temperature was read in two different modes, a “fast” mode in several seconds and a “monitor”
mode after three minutes. Fast mode data were not used in this study due to insu cient accuracy. The
monitor mode has accuracy of ±0.1 °C, which was con rmed against a NIST-traceable contact thermometer
(6413, Traceable® Products, Webster, TX) using a laboratory water bath (89202-926, VWR International,
Radnor, PA). The reference temperature ( ) was calculated as the mean of two oral temperature
measurements in monitor mode (during rounds 1 and 3). All subject data were discarded if the difference
between two readings was larger than 0.5 °C, due to the likelihood of a measurement error.

2.2 Facial region delineation and temperature measurement

Temperatures from several facial areas – including the forehead, canthi, mouth and entire face – were
compared to assess impact on fever screening (Figure 3). Standards documents do not specify a method
for delineating facial key-points such as canthi in IRT images, so we implemented an image registration
approach37 to identify these points by matching facial landmarks on visible light images to IRT images.
However, key-points for about half of these images required manual labeling. Based on the identi ed facial
key-points, different regions/points on thermal images were de ned (Figure 3).

As shown in Figure 3, the extended forehead area was determined in the vertical direction by hairline and
eyebrows. The maximum single-pixel temperature in the extended forehead area ( ) was rst
obtained. Then, the center forehead area was de ned in the horizontal direction by the canthus points and in
the vertical direction by 70% of the height of the forehead area from the bottom edge (eyebrows), and its
maximum temperature ( ) was obtained. Five points were de ned in the forehead center region
rectangle – the center point and the middle points of the top, bottom, left and right edges. At each of these
points, the mean temperature of a 3 × 3 pixel region was used to determine results ( , , ,
and ).

Two inner canthus points were identi ed in each IRT image using the registration method37. Two small
circular regions of interest (ROIs) were de ned with a diameter of 13 pixels, using the inner canthus points
as their outer edge. The mean and maximum temperatures of the left ( ̅ and ) and right ( ̅
and ) ROIs were obtained. From these values, the mean and maximum of ̅ and ̅
( ̅ and 1) and the maximum of and ( 2) were also calculated. An
extended canthus region was delineated, which was centered at the two canthus points and having a width
of 96 pixels. Its top edge extended upwards to the bottom of the eyebrows, and its bottom edge extended
downwards by the same amount. The maximum temperature ( ) of this area was obtained.

The mouth region was de ned by a rectangle that included all the facial key-points around the mouth, then
the maximum temperature of this region ( ) was identi ed. The entire face region was de ned
horizontally by the edges of the face and in the vertical direction by the chin and hairline, and its maximum
temperature was determined ( ).

 Page 6/25
2.3 Data analysis

2.3.1. Temperature compensation

Since IRTs exhibit varying degrees of instability and drift28, a blackbody was used for thermal image
compensation. By comparing the IRT-measured blackbody temperature ( ) with its set temperature
( ) of 35˚C, we identi ed an appropriate offset for each image. Speci cally, the equation =
 − was used, where is the offset value added to every pixel in the image. Unless
otherwise speci ed, all data in this paper were compensated with the blackbody in this manner.

2.3.2 Statistical analysis

To assess the effect of facial location for fever screening, results were analyzed using comparative
boxplots, scatter plots, correlation coe cients, and receiver operating characteristic (ROC) curves.
Temperatures obtained from IRT images were compared with the reference temperature ( ). The
pairwise difference between and temperatures extracted from different facial locations ( ) was
obtained. Comparative boxplots were used to display and compare pairwise differences. The Pearson
correlation coe cient ( value) was used to quantify the degree of linear correlation between and
 .

ROC curves38 – which plot sensitivity (Se, true positive rate) vs. 1-speci city (Sp, true negative rate) for a
range of cut-off levels – were used to assess discrimination between febrile and afebrile subjects. True
febrile status was de ned as > 37.5˚C20,39,40. An ROC curve for each facial temperature location was
generated from 1000 IRT- based cut-off temperatures equally spaced between 30°C and 40°C. At each cut-
off temperature, the numbers of positive and negative subjects – and thus pairs of Se/Sp values – were
determined based on true febrile status. The area under the ROC curve (AUC) was calculated to provide an
aggregate measure of performance (where an AUC of 1.0 indicates perfect diagnostic performance). AUC
values for different facial temperatures were compared using pairwise tests with a 95% con dence interval
(Analyse-it, Method validation edition, Analyse-it Software, Ltd., Leeds, UK). For each ROC curve, the optimal
IRT cut-off temperature was determined as either the point on the ROC curve closest to (0, 1)38 or the
Youden index41. As both methods yielded very similar results, we only used the former method to nd the
optimal cut-off temperature which minimizes the quantity [(1–Se)2 + (1–Sp)2] and thus yields the greatest
combined sensitivity and speci city.

3. Results
3.1 Subject demographics

A total of 596 subjects were recruited; all were at least 18 years old and free of disease affecting the skin in
canthi area or forehead one week prior to the screening date. Among these subjects, 33 had two oral
temperature readings with difference greater than 0.5°C, and thus were removed from the database. Of the
remaining 563 sets of subject data, we excluded 19 from IRT-1 and 23 from IRT-2 due to motion artifacts

 Page 7/25
that degraded image quality. Finally, we had 544 data sets for IRT-1 and 540 data sets for IRT-2.
Demographic information for study subjects is summarized in Table 1.

 Table 1 Demographics of study subjects
 IRT-1 IRT-2
 Subjects % Subjects %
 Female 329 60.5 328 60.7
 Male 215 39.5 212 39.3
 Age 18-20 263 48.3 262 48.5
 21-30 247 45.4 0 0.0
 31-40 21 3.9 21 3.9
 41-50 4 0.7 4 0.7
 51-60 7 1.3 7 1.3
 >60 2 0.4 2 0.4
 Ethnicity White 257 47.2 254 47.0
 Black/African-American 78 14.3 79 14.6
 Hispanic/Latino 39 7.2 39 7.2
 Asian 138 25.4 136 25.2
 Multiracial 30 5.5 30 5.6
 American Indian 2 0.4 2 0.4
 > 37.5°C 47 8.6 47 8.7

3.2 Temperature measurement accuracy and correlation

Temperatures for different facial locations from thermal images were compared with . For each IRT,
comparative boxplots of pairwise differences with were constructed (Figure 4). For all temperatures
from both IRTs, pairwise differences were positive. This is consistent with prior studies, and expected given
that sublingual tissue is not typically subjected to the levels of convective heat loss that external tissues
experience42. Overall, the forehead region showed the greatest discrepancy, then the canthus regions, and
the entire face maximum shows the least difference.

 Table 2 Pearson correlation coefficients (r values) between facial temperatures and Tref

 Forehead Inner canthi Mouth Face
 ̅ ̅ ̅ 1 2
 IRT-1 0.46 0.41 0.49 0.47 0.43 0.55 0.63 0.60 0.58 0.63 0.65 0.70 0.71 0.73 0.75 0.60 0.78
 IRT-2 0.46 0.39 0.49 0.46 0.41 0.54 0.62 0.53 0.51 0.56 0.59 0.70 0.69 0.73 0.76 0.60 0.79

Pearson correlation coe cients for all measurement locations were highly consistent with the pairwise
difference results (Table 2). Among the seven forehead temperatures, r values varied from 0.39 to 0.63 with
 showing the highest correlation and agreement with , followed by . The maximum
temperature around the mouth ( ) showed results that were similar to . Correlation results
for inner canthi temperatures were in general higher than for the forehead, ranging from 0.51 to 0.76. The
highest values (>0.7) were found for maximum temperatures across left and right inner canthi regions (
 2 ), the extended inner canthi region ( ), and the entire face ( ). As had the largest
 value, this metric may best estimate .

 Page 8/25
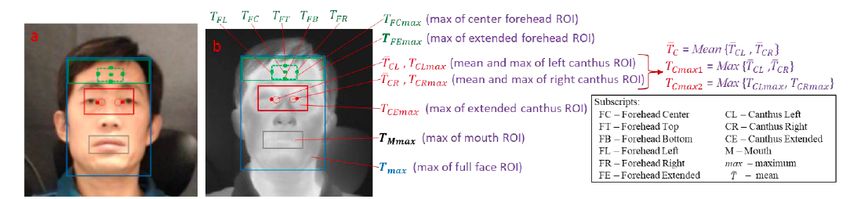
Facial temperature correlations were further analyzed with scatter plots of versus for select
facial locations (Figure 5). These included 1, which aligns with IEC TR 13154 recommendations
(although this approach is not explicitly de ned), as well as , and , which showed
the best values for extended forehead, extended inner canthi and whole face regions, respectively. As
expected, scatter plots show a large grouping of values near 37 °C, representing the high proportion of
afebrile subjects (84% of readings were between 36.4 – 37.4 °C). 1 results showed the greatest
variability, most notably in the sub-febrile range. results showed improved correlation with in
this range, as well as across higher values. and measurements were less variable than
other measurements and well-correlated to , approaching a linear relationship. Data for the two IRT
systems showed only minor differences in correlation.

3.3 Fever detection performance

ROC curve analysis was used to evaluate performance of IRT-based detection of febrile subjects and its
dependence on facial measurement location. Figure 6 shows ROC curves for 1, ,
and , while AUC values for all measurements are found in Table 3. In Figure 6, the = line denotes
random discrimination; all ROC curves from our study were well above this line. and yielded
optimal ROC curves with AUC values > 0.95 , indicating high discrimination effectiveness. IRT-2 showed
slightly better performance for than . ROC curves for 1 and indicated lower
performance, with the most notable feature being a slow convergence to high sensitivity as speci city
decreased. In general, discrimination performance for aligned well with correlations to shown in
(Table 2).

 Table 3 AUC values from the ROC curves for different facial locations
 Forehead Inner canthi Mouth Face
 ̅ ̅ ̅ 1 2

IRT- 0.82 0.79 0.82 0.80 0.81 0.84 0.86 0.88 0.87 0.88 0.88 0.94 0.93 0.94 0.95 0.89 0.95
1
IRT- 0.82 0.79 0.82 0.79 0.79 0.84 0.87 0.91 0.87 0.90 0.92 0.95 0.93 0.94 0.95 0.88 0.97
2

 Table 4 Results of pairwise comparisons of the AUC values for Tmax , TCEmax TFEmax and TCmax1. Bold values indicate p >0.05.

 Page 9/25
IRT-1 IRT-2

 AUC AUC difference AUC AUC difference
 p-value p-value
 difference with 95% CI Difference with 95% CI
 - 0.095 0.036 to 0.154 0.002 0.083 0.024 to 0.141 0.006

 - 0.095 0.031 to 0.159 0.003 0.096 0.034 to 0.158 0.002

 - 1 0.067 0.005 to 0.129 0.034 0.052 0.020 to 0.10 0.016

 - 1 0.068 0.009 to 0.126 0.023 0.038 -0.003 to 0.079 0.068

 1 - 0.028 -0.042 to 0.098 0.437 0.044 -0.022 to 0.111 0.192

 - 0.000 -0.018 to 0.019 0.975 0.013 -0.008 to 0.034 0.214

The statistical signi cance of AUC differences between 1, , and was
evaluated using six pairwise tests (Table 4). For both IRTs, there was no statistically signi cant difference
(p ≥ 0.05) between AUC values of and , and these parameters were both signi cantly higher
(p < 0.05) than . When compared to 1 , showed a signi cantly higher AUC, but
 showed a signi cantly greater result for only one of the two IRTs. Overall, this AUC comparison
indicated that and should provide the most optimal results when used for fever screening.

Facial temperatures measured by IRTs are typically at least 1-2 °C lower than 34. Therefore, it is
necessary to either calibrate to or nd a suitable cut-off temperature for each IRT during fever
screening. For consistency with prior IRT studies18,20, we used the latter method. Our results above (Figure 6,
Table 4) were based on de ning fever as > 37.5˚C, from which an optimal cut-off temperature can be
obtained for each IRT ( rst row in Table 5, Table 6 and Table 7). We also calculated the optimal cut-off
temperature under diagnostic thresholds of 37.8 and 38.0 ˚C.

According to our results, and provided the best approaches for fever detection and did not
exhibit signi cant differences in performance. However, the approach that most closely adheres to the
recommendations in TR 13154 is 1. Therefore, we used all three temperatures in evaluating the
optimal Se and Sp for different diagnostic thresholds in Table 5, Table 6 and Table 7. Cut-off
temperatures were calculated to optimize Se and Sp simultaneously38.

 Table 5 Optimal IRT cut-off temperatures and related Se/Sp values for Tmax under different Tref thresholds

 Oral thermometer IRT-1 IRT-2
 diagnostic Actual febrile # IRT cut-off temperature (°C) Se Sp Actual febrile # IRT cut-off temperature (°C) Se Sp
 thresholds (°C)
 37.5 47 36.19 0.85 0.94 47 36.11 0.94 0.89
 37.8 30 36.28 0.93 0.94 30 36.38 0.93 0.95
 38.0 19 36.29 1.00 0.93 19 36.87 1.00 0.98

 Page 10/25
Table 6 Optimal IRT cut-off temperatures and related Se/Sp values for TCEmax under different Tref thresholds

 Oral thermometer IRT-1 IRT-2
 diagnostic Actual febrile # IRT cut-off temperature (°C) Se Sp Actual febrile # IRT cut-off temperature (°C) Se Sp
 thresholds (°C)
 37.5 47 35.96 0.89 0.87 47 36.11 0.87 0.92
 37.8 30 36.05 0.93 0.90 30 36.25 0.93 0.95
 38.0 19 36.28 1.00 0.95 19 36.58 1.00 0.97

 Table 7 Optimal IRT cut-off temperatures and related Se/Sp values for TCmax1 under different Tref thresholds

 Oral thermometer IRT-1 IRT-2
 diagnostic Actual febrile # IRT cut-off temperature (°C) Se Sp Actual febrile # IRT cut-off temperature (°C) Se Sp
 thresholds (°C)
 37.5 47 35.22 0.85 0.79 47 35.37 0.83 0.88
 37.8 30 35.32 0.80 0.84 30 35.41 0.87 0.87
 38.0 19 35.76 0.84 0.96 19 35.94 0.89 0.97

These results further illustrate how diagnostic performance decreased from to to 1
. The Se/Sp values for and are similar, which re ects the extent of overlap in their ROC
curves (Figure 6) and minimal AUC differences (Table 4). Performance was good for 1, yet
signi cantly lower than for and . While discrimination of febrile subjects was superior for a
cut-off threshold of 38 °C, impressive outcomes were also obtained for lower grade fever thresholds at 37.5
°C and 37.8 °C. The trend of increasing Se/Sp with diagnostic threshold may be due to a larger difference
between the temperature of febrile subjects and the normal temperature value where most of the subjects
were; a normal temperature with some error is less likely to reach 38 °C.

3.4 Blackbody compensation

Temperature compensation using a validated blackbody (BB) was recommended by IEC TR 13154 to
improve IRT system stability. To quantify the impact of this compensation, correlation coe cients between
the facial temperatures and (Table 8) and the AUC values based on a diagnostic threshold of 37.5 °C
(Table 9) were calculated without BB compensation. Comparison of Table 2 with Table 8 show that the
values increased for all facial temperatures measured by both IRTs. The increases for 1, ,
 and are 7%, 13%, 13% and 12% for IRT-1 and 5%, 4%, 6% and 5% for IRT-2. Comparison of
Table 3 with Table 9 show that the AUC values also increased for all facial temperatures. The increases for
 1, , and are 2%, 3%, 4% and 4% for IRT-1 and 2%, 1%, 3% and 3% for IRT-2.

 Table 8 Pearson correlation coefficients (r values) between facial temperatures and Tref (no BB compensation)

 Forehead Inner canthi Mouth Face
 ̅ ̅ ̅ 1 2

IRT- 0.44 0.41 0.47 0.46 0.42 0.50 0.55 0.57 0.57 0.60 0.60 0.64 0.65 0.66 0.67 0.59 0.70
1
IRT- 0.45 0.38 0.48 0.45 0.39 0.52 0.60 0.51 0.48 0.53 0.56 0.67 0.66 0.69 0.71 0.58 0.75
2

 Page 11/25
Table 9 AUC values from the ROC curves of different facial temperatures (no BB compensation)
 Forehead Inner canthi Mouth Face
 ̅ ̅ ̅ 1 2

IRT- 0.79 0.78 0.80 0.78 0.77 0.80 0.83 0.87 0.85 0.87 0.87 0.91 0.89 0.91 0.91 0.88 0.92
1
IRT- 0.81 0.79 0.81 0.78 0.78 0.84 0.87 0.89 0.85 0.88 0.90 0.93 0.91 0.93 0.93 0.86 0.94
2

4. Discussion
In an extensive clinical study, we have evaluated the use of IRTs under standardized conditions and
collected a wide range of data on facial temperatures and their correlation to oral measurements. These
data have yielded valuable insights into IRT-based temperature estimation and fever detection capabilities
and the factors that impact system performance.

4.1 Thermographic screening accuracy and standardization

This study was largely based on two international consensus documents described above – IEC 80601-2-59
and ISO/TR 1315423,24. The guidance provided by these publications helped ensure that the devices used in
this research had a high level of image quality and that the acquisition methods – including instructions to
subjects – were optimized to enable accurate measurements. The optimal approaches identi ed in our
study produced results that were equal to or better than most prior relevant works in terms of absolute
agreement with, and correlation to, reference measurements, as well as discrimination of febrile subjects.

Our ndings showed that the differences between and temperatures of different facial regions were in
the ranges of 1.6-2.8 °C for the forehead region, 1.4-2.4 °C for the inner canthi regions, 1.7-1.8 °C for the
mouth region and 1.2-1.3 °C for the maximum face temperature. The magnitude of these results is smaller
than results from Nguyen et al. who showed differences in the range of 2.1-8.7 °C between and facial
maximum temperature by three IRTs17; similarly Chan et al. showed forehead temperatures differences of
3.0 °C and 3.9 °C for febrile and non-febrile subjects, respectively18. Our results also showed strong
correlations between IRT-measured temperatures ( ) and , with both IRTs producing r values as
high as the 0.75-0.80 range. These values are much higher than several prior studies that found r values
between IRT and oral temperatures of no greater than 0.452,17,39. Scatter plots of vs. provided in
prior studies, such as Chan et al.18, also do not show the strong linear trends seen in our and
data (Figure 5). It is likely that this improvement in correlation is due to control methods that help to reduce
measurement variability, including stability correction with a blackbody, reduction of confounding
environmental factors, multi-frame averaging, and the use of canthi regions in thermal images.

Strong temperature correlations enabled discrimination between febrile and afebrile subjects to a high
degree of accuracy. For a low-grade fever diagnostic threshold of 37.5 °C, data produced an AUC
values of 0.95-0.97 and Se/Sp values in the 0.85-0.95 range. For a diagnostic threshold of 37.8 C, Se/Sp
values increased to 0.93-0.95. These results for relatively low-grade fever detection, as well as ndings at
higher diagnostic thresholds shown in Table 5, compare favorably with the literature. In a study of airport
 Page 12/25
travelers, Priest et al. found an AUC of 0.71 (Se/Sp = 0.86/0.71) for a fever threshold of 37.5 °C using full-
face maximum temperatures20. Nishiura et al. estimated that the AUC values were 0.79 and 0.75 for
threshold temperatures of 37.5°C and 38.0 °C2. Nguyen et al. compared IRT performance for fever screening
using images of the face and neck, with 37.8 °C as the fever threshold 17. In this study, AUC values of 0.96
and 0.92 were found for two IRTs, yet the corresponding r values of 0.43 and 0.42 do not appear su cient
for high accuracy measurements. Hewlett et al. obtained AUC values of 0.86 and 0.90 for fever thresholds
of 37.8°C and 38°C, but did not report r values or results for 37.5 °C19. These comparisons provide
substantial evidence that an approach based largely on adherence to recently published standards has the
potential to advance IRT-based fever screening capability.

4.2 Comparison of facial temperatures

The 17 facial temperatures extracted from each subject’s thermal image can be categorized by facial region
(forehead, canthi, mouth, entire face) or by measurement location selection method ( xed-location vs.
maximum value of a de ned region). Analyzing our extensive clinical testing results provided insight into
key trends and potential approaches for optimizing IRT-based fever screening.

IRT system performance was highly dependent on measurement location, with the forehead producing
lower accuracy than canthi regions. Temperatures determined from ve xed locations on the forehead
( , , , and ) had relatively low correlations (r < 0.50) with and larger pairwise
differences. Fixed locations in the canthi region showed moderately strong correlations (r values of 0.51 to
0.63) with and their pairwise differences from were also relatively small. Similarly, the
maximum-value data for canthi regions showed better performance than the forehead or mouth regions.
This result aligns with a prior comparison of IRT-based eye and forehead measurements43. In our study,
maximum-value of the entire face ( ) provided better performance than the forehead ( ) in
terms of correlation and fever detection; this nding is consistent with a prior study that compared
maximum temperatures from the full face and forehead (r values of 0.43 and 0.36, respectively)18.
Differences in performance between the forehead and inner canthi are likely due to perfusion of the canthi
from the internal carotid (ophthalmic) artery, proximity to large vessels and relatively thin skin32, whereas
the forehead is more diffusely perfused and susceptible to convective and evaporative cooling43,44. These
 ndings may shed light on the poor sensitivity values found in some NCIT studies14.

Overall, the maximum value in a region showed better diagnostic performance and correlation with
than the value at a xed location within this region, with greatest values and AUC values for ,
followed by and then . Prior studies have also found that maximum-values approaches
tended to provide greater performance18. and yielded similar values and statistically
equivalent AUC values, as well as signi cantly higher AUC values than . Interestingly, Figure 5
shows that unlike the relatively tight cluster of normal-range data points ( = 36.4-37.4 oC), data for
 1 exhibits a tail extending to lower IRT-measured values than other datasets. This feature is also
present in the few scatter plots that have been published from clinical IRT data18,43. Additionally, we found

 Page 13/25
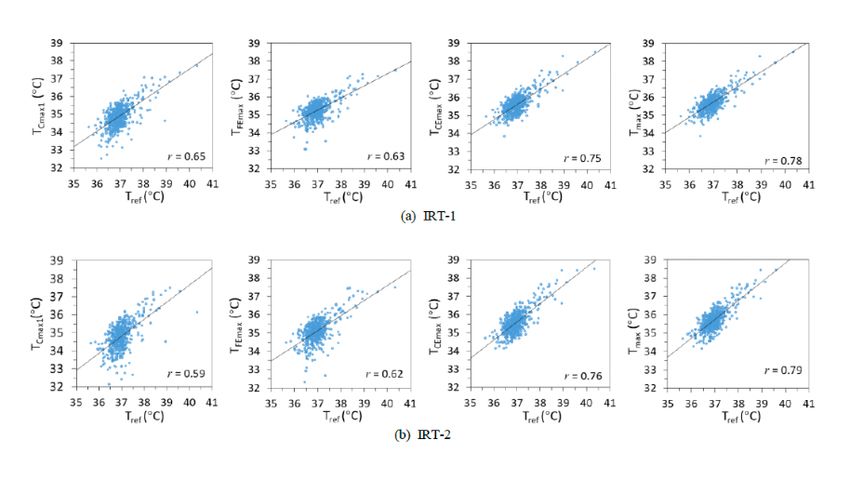
that individual hairs on the forehead degraded accuracy. The improved performance observed for maximum
region temperatures may be due in part to subject-to-subject variations in facial anatomy and physiology
that cause unpredictable nonuniformity in spatial temperature distribution. Taking the maximum
temperature of a region affords greater robustness to such variations.

As noted above, approaches involving the inner canthi or maximum-temperature locations provided higher
levels of performance. Therefore, it is not surprising that – which involves both of these features –
provided one of the best options of the 17 temperatures tested. The nding that provided slightly
better performance than is a more unexpected result, because it was not advocated in IEC TR
13154 as a “robust measurement site”, as the inner canthi were. However, this approach has been used in a
number of prior studies17,18,20 likely due to its combination of simplicity and effectiveness. These prior
studies achieved relatively high Se/Sp values (0.7-0.9) using this approach. In part, this effectiveness stems
from the fact that the inner canthi are a key thermal feature in full face images, as discussed in the
following section. In spite of these bene ts, there may be unresolved challenges related to the use of ,
such as confounding physiological factors like sinusitis that impact temperature distributions24.

4.3 Distribution of thermal maxima in full face images

In order to better understand the results obtained with , we evaluated the distribution of locations
where maximum temperatures occurred over 3252 thermal images collected by the two IRTs from the rst
round of measurements. The locations of thermal maxima in full facial images are summarized in Figure 7
and Table 10. According to Table 10, thermal maxima most commonly appeared (59.5%) in the inner canthi
region, followed by oral (21.7%), forehead (8.8%), nasal (4.1%) and temporal (3.6%) regions. The
predominance of inner canthi maxima is expected given what is known regarding perfusion in this region. A
relatively large fraction of maxima occurred in the oral region, likely due to perfusion from the facial artery
which is closer to the external carotid artery than the vessels that perfuse most facial regions. The forehead
maximum were typically along the hairline, likely due to the thermal insulation effect of hair. Some thermal
maxima appeared in the temporal region, likely due to the super cial temporal arteries. It was unexpected to
 nd maxima in the nasal/nostril region (bottom); whether these are due to some pathology such as
sinusitis24,45 or perhaps exhalation of warm air is not currently known.

 Table 10 Spatial distribution of facial temperature maxima

 Region Number %
 Inner canthi 645 59.5
 Oral (closed) 235 21.7
 Forehead (hairline) 95 8.8
 Nasal 44 4.1
 Temporal 39 3.6
 Neck 17 1.6
 Other 9 0.8

4.4 Quality of a thermographic screening system

 Page 14/25
The IEC 80601-2-59 standard23 de nes a screening thermograph (ST) as a system composed of an IRT and
an external temperature reference source (usually a blackbody with known temperature and emissivity), and
in some cases, a computer and software for data acquisition, processing and storage. Therefore, most
results in this paper, except for the data in Section 3.4, are technically not results of two thermal cameras,
IRT-1 and IRT-2, rather, two fever screening systems, (IRT-1 + BB) and (IRT-2 + BB). We have evaluated these
two systems in our previous work 28 and found that their uniformity, stability, drift, minimum resolvable
temperature difference, and laboratory accuracy all satis ed the standard requirements.

The use of a blackbody for temperature compensation had a moderate impact on IRT screening ability. In
our prior study28, such compensation vastly improved the stability of IRT-2, and enabled the system to meet
IEC 80601- 2-59 performance speci cations. Except to measure and compensate for long-term drift, the use
of 3-frame averaging in the current study may have improved stability to the point where the blackbody was
no longer critical. If no frame averaging is used, the use of a blackbody would likely be more critical for fever
detection. Additionally, the current study was executed in an environment with relatively stable ambient
temperature; it is likely that in a less controlled screening location with larger, more rapid thermal
 uctuations, blackbody compensation would be more important.

While inherent IRT instrumentation quality is critical, performance also depends on effective
implementation. The use of control methods such as an absorbing background, multiple frame imaging,
and thermally stable, forward-facing subjects. Given that many of these confounding factors have been
addressed in our study, the results presented here likely indicate a best-case performance level. As control
methods we have implemented are removed – which may be necessary in certain real-world screening
situations – it is likely that performance will degrade. The degree to which removal of any speci c control
will impact results is beyond the scope of the current study but may be important for predicting real-world
performance.

4.5 Fever screening during an epidemic

The primary purpose of this study was to facilitate the implementation of IRT systems and practices that
enable optimal measurement accuracy and highly effective fever screening during epidemics. However,
achieving effective screening can be a complex process, as many factors need to be addressed beyond the
physics, instrumentation and acquisition procedures. While our results showed that some facial
temperatures had good discrimination abilities with high AUC values, some previous literature claimed that
thermography was not highly effective for fever screening during disease outbreaks1,2,46,47. This may have
been due to device instability7,11,32,34,48, inappropriate temperature reading locations, nonstandard
calibration and environmental controls28.

The frequency at which fever presents as a symptom is another impediment to successful screening. In the
current COVID-19 outbreak, many of those infected are largely asymptomatic and only 73% have exhibited a
fever 3; in 2009, only half of H1N1 outbreak cases had temperatures of ≥37.8 °C8; and a 2011 study
indicated that none of the 30 subjects identi ed as being u-infected had a temperature of 37.8 °C or
greater, and only two had a temperature of 37.5 °C20. Therefore, while IRT-based screening can detect
 Page 15/25
individuals with elevated temperature, it is not a viable stand-alone tool for screening for individuals
infected with speci c diseases49. It may play an adjunct role along with other screening evaluations. Since
fever is only one common symptom of infectious disease, an effective screening process should include
evaluation of a range of symptoms3,7,8. The future development of an integrative screening system may
include thermography along with optical imaging approaches for evaluation of vital signs such as heart and
respiration rate as well as other physiological parameters8.

Given that and provided the best performance, it is worth considering issues that might
in uence the decision to implement one approach or the other. Acquiring a full-face region for calculation
of would likely be easier to accomplish and performed more reliably than determining via
auxiliary visible light imaging and computationally-intensive techniques for co-registration of inner canthi
regions. This may be particularly important in a high throughput situation where delays due to computer
processing or image co- registration errors could become highly inconvenient. However, implementing an
approach that blindly determines the maximum temperature from a full-face thermal image may increase
the need to identify confounding pathological/physiological conditions such as sinusitis24,45,50. To
accomplish this task rapidly and effectively may require signi cant screener training, although automated
approaches (e.g., deep learning algorithms) could also be developed to augment or replace manual
assessments.

Another practical challenge involves the identi cation of an appropriate reference temperature diagnostic
threshold, given the diversity of values that have been implemented. The Centers for Disease Control and
Prevention (CDC) has recommended the use of 38°C51, whereas prior human subject studies have been
based on 37.5 ºC7,39,40, 37.6 °C52, 37.7 °C32,48, 37.8 °C17,19,20, and 38 °C35. Different thresholds have been
used for different outbreaks, such as ≥ 38ºC for SARS 1 and 37.7°C for adults and 37.9 °C for children in an
H1N1 study8. The literature indicates that as the threshold temperature decreases, diagnostic accuracy
typically degrades. Uncertainty in normal body temperatures – which can be in uenced by gender, age,
physical exertion and other factors – can further increase error in screening tasks15,35,39,53. Additionally, a
recent study indicates that normal body temperature has decreased on average since the establishment of
the 37 °C threshold 150 years ago54. In spite of these obstacles, our results indicated that IRT systems are
capable of detecting low-grade fever (37.5 °C) in subjects, which could mean that early-stage infections and
those producing only moderate symptoms could be more readily identi ed. The signi cance of this ability
is demonstrated by the fact that of the subjects with values over 37.5 °C in our study, 60% would not
have exceeded the CDC recommended diagnostic threshold of 38 °C.

Even if a suitable diagnostic threshold for fever based on body temperature can be de ned, determining the
IRT cut-off temperature for fever screening requires a variety of considerations. While we calculated optimal
cut-off temperature to optimize both Se and Sp, this may not represent an optimal value for real-world use.
For a severe disease, lower cut-off values may be needed to minimize false negatives in primary screening.
Given the typically low prevalence of diseased individuals in a screening population, the false positive rate
in primary screening will be high (and thus the positive predictive value low). On the other hand, it may also

 Page 16/25
be important to balance the burden on the population being screened (e.g., travel delays) and screening
personnel (e.g., workload, fatigue, cost to health agencies)17,39.

5. Conclusions
Overall, our clinical study results support the conclusion that adherence to international consensus
guidelines regarding IRT system speci cations and implementation contributes to optimization of
measurement accuracy and detection of febrile individuals. These guidelines include environmental
controls as well as subject preparations and acclimation prior to measurements. Two additional ndings
were made: rst, targeted measurement of a small inner canthi area may be unnecessary, with full face
maximum temperatures providing the best performance followed closely by the maximum of a wider inner
canthi region. Second, while temperature compensation with a high- quality blackbody can improve IRT
system performance, the impact was modest on our highly controlled setup, which incorporated multi-frame
averaging. Our ndings also indicated that forehead temperatures provide generally inferior estimation of
oral temperature relative to the inner canthi. The optimal approaches identi ed here achieved correlation
coe cients of ~0.75, as well as AUC values of ~0.95 for detection of low-grade (37.5 °C) fever. This
capacity may facilitate detection of a wider range of disease presentations than a less accurate method
would allow. Future work will involve further analysis of our clinical study results to address the impact of
confounding factors relating to inter-subject and environmental variability.

Declarations
Acknowledgments

This research was funded by the U.S. Food and Drug Administration’s Medical Countermeasures Initiative
(MCMi) Regulatory Science Program (Fund# 16ECDRH407). The authors gratefully acknowledge Dr. Stacey
Sullivan, who evaluated the oral thermometer and prepared the operation manual; Ms. Jean Rinaldi, who
helped to prepare the clinical study protocol and recruitment documents; the University Health Center of the
University of Maryland at College Park for their outstanding collaboration with the research team; Peter Tan,
Monica Chu, Peter Chin, Pooneh Azadikhah, Oluwatobi Fagbohun, Shira Winston, Jacqueline Dempsey,
Muzammil Quadir, Madison Varvaris and Raqel Pryor for their assistance with data collection; and Drs. Zane
Arp, Daniel X. Hammer, William C. Vogt and Jessica Lamb for editorial contributions to this manuscript.

Author Contributions

Q.W., T.J.P, and J.C. conceptualized the project. Q.W. obtained IRB approval and led the whole project. D.M.
provided advices and space for the clinical study. P.G. led the clinical data collection. Y.Z. analyzed the data,
with the help from M.C. Y.Z., Q.W, and T.J.P. wrote the initial draft of this manuscript. All authors edited and
reviewed the manuscript.

Disclaimer

 Page 17/25
The mention of commercial products, their sources, or their use in connection with material reported herein
is not to be construed as either an actual or implied endorsement of such products by the Department of
Health and Human Services. This paper only represents the authors’ opinion, not FDA
recommendations/policy. The authors declare that they have no competing interests.

Referenecs
 1. Chiu, W. et al. Infrared thermography to mass-screen suspected SARS patients with fever. Asia-Pac. J.
 Public Health 17, 26-28 (2005).
 2. Nishiura, H. & Kamiya, K. Fever screening during the in uenza (H1N1-2009) pandemic at Narita
 International Airport, Japan. BMC Infect. Dis. 11, 111 (2011).
 3. Shi, H. et al. Radiological ndings from 81 patients with COVID-19 pneumonia in Wuhan, China: a
 descriptive study. Lancet Infect. Dis. (2020).
 4. Yang, X. et al. Clinical course and outcomes of critically ill patients with SARS-CoV-2 pneumonia in
 Wuhan, China: a single-centered, retrospective, observational study. Lancet Respir. Med. (2020).
 5. Goeijenbier, M., Van Kampen, J., Reusken, C., Koopmans, M. & Van Gorp, E. Ebola virus disease: a review
 on epidemiology, symptoms, treatment and pathogenesis. J. Med. 72, 442-448 (2014).
 6. Huang, C. et al. Clinical features of patients infected with 2019 novel coronavirus in Wuhan, China. The
 Lancet 395, 497-506 (2020).

 7. Liu, C.-C., Chang, R.-E. & Chang, W.-C. Limitations of forehead infrared body temperature detection for
 fever screening for severe acute respiratory syndrome. Control Hosp. Epidemiol. 25, 1109-1111 (2004).
 8. Ng, E. Y. K. Thermal imager as fever identi cation tool for infectious diseases outbreak. in Medical
 Infrared Imaging: Principles and Practices (eds Mary Diakides, Joseph D. Bronzino, & Donald R.
 Peterson) Ch. 24, 1– 19 (CRC Press, 2013).

 9. Chiappini, E. et al. Performance of non‐ contact infrared thermometer for detecting febrile children in
 hospital and ambulatory settings. Clin. Nursing 20, 1311-1318 (2011).
10. Teran, C. et al. Clinical accuracy of a non‐ contact infrared skin thermometer in paediatric practice.
 Child Care Health Dev. 38, 471-476 (2011).

11. Ng, E. Y. K. & Acharya, R. U. Remote-sensing infrared thermography. IEEE Eng. Med. Biol. Mag. 28, 76-83
 (2009).
12. Usamentiaga, R. et al. Infrared thermography for temperature measurement and non-destructive testing.
 Sensors14, 12305-12348 (2014).

13. American Society for Testing and Materials. ASTM E1965-98: Standard Speci cation for Infrared
 Thermometers for Intermittent Determination of Patient Temperature. (2016).
14. Bitar, D., Goubar, A. & Desenclos, J. International travels and fever screening during epidemics: a
 literature review on the effectiveness and potential use of non-contact infrared thermometers. Euro
 Surveill. 14, 19115 (2009).
 Page 18/25
15. Selent, M. U. et al. Mass screening for fever in children: a comparison of 3 infrared thermal
 detectionPediatr. Emerg. Care 29, 305-313 (2013).

16. Tay, , Low, Y., Zhao, X., Cook, A. & Lee, V. Comparison of Infrared Thermal Detection Systems for mass
 fever screening in a tropical healthcare setting. Public Health 129, 1471-1478 (2015).
17. Nguyen, A. V. et al. Comparison of 3 infrared thermal detection systems and self-report for mass
 fever Emerging Infect. Dis. 16, 1710-1717 (2010).

18. Chan, , Lo, J. L., Kumana, C. R. & Cheung, B. M. Utility of infrared thermography for screening febrile
 subjects. Hong Kong Med. J. 19, 109-115 (2013).
19. Hewlett, A. L., Kalil, A. C., Strum, R. A., Zeger, W. G. & Smith, P. W. Evaluation of an infrared thermal
 detection system for fever recognition during the H1N1 in uenza pandemic. Control Hosp. Epidemiol.
 32, 504-506 (2011).
20. Priest, C., Duncan, A. R., Jennings, L. C. & Baker, M. G. Thermal Image Scanning for In uenza Border
 Screening: Results of an Airport Screening Study. PLoS One 6, e14490 (2011).
21. Cho, K. S. & Yoon, J. Fever screening and detection of febrile arrivals at an international airport in Korea:
 association among self-reported fever, infrared thermal camera scanning, and tympanic temperature.
 Health 36, 4 (2014).
22. Mouchtouri, V. A. et al. Exit and entry screening practices for infectious diseases among travelers at
 points of entry: looking for evidence on public health impact. J. Env. Res. Public Health 16, 4638 (2019).
23. International Electrotechnical Commission & International Organization for Standardization. IEC 80601-
 2-59: Medical electrical equipment - Part 2-59: Particular requirements for the basic safety and essential
 performance of screening thermographs for human febrile temperature screening. (2017).
24. International Organization for Standardization. ISO/TR 13154: Medical electrical equipment —
 Deployment, implementation and operational guidelines for identifying febrile humans using a
 screening thermograph. (2017).
25. Holshue, M. L. et al. First case of 2019 novel coronavirus in the United States. New Engl. J. Med. (2020).
26. Woelfel, et al. Clinical presentation and virological assessment of hospitalized cases of coronavirus
 disease 2019 in a travel-associated transmission cluster. medRxiv (2020).
27. Geneva, I. I., Cuzzo, B., Fazili, T. & Javaid, W. Normal body temperature: a systematic review. Open
 Forum Infect. Dis. 6, ofz032 (2019).
28. Ghassemi, P., Pfefer, T. J., Casamento, J. P., Simpson, R. & Wang, Q. Best practices for standardized
 performance testing of infrared thermographs intended for fever screening. PLoS One 13, e0203302
 (2018).
29. Mairiaux, P., Sagot, J. & Candas, V. Oral temperature as an index of core temperature during heat Eur. J.
 Appl. Physiol. Occup. Physiol. 50, 331-341 (1983).

30. Ng, D. K., Chan, C.-H., Chow, P.-Y. & Kwok, K.-L. Infrared ear thermometry. J. Gen. Pract. 54, 869-869
 (2004).

 Page 19/25
31. Mercer, J. B. & Ring, E. F. J. Fever screening and infrared thermal imaging: concerns and guidelines. Int.
 19, 67-69 (2009).
32. Ng, E. Y. K., Muljo, W. & Wong, B. S. Study of facial skin and aural temperature. IEEE Eng. Med. Biol. 25,
 68-74 (2006).

33. Sun, , Matsui, T., Kirimoto, T., Yao, Y. & Abe, S. Applications of infrared thermography for noncontact and
 noninvasive mass screening of febrile international travelers at airport quarantine stations. in
 Application of Infrared to Biomedical Sciences (eds E.Y.K. Ng & M. Etehadtavakol) 347-358 (Springer,
 2017).
34. Chan, L. S., Cheung, G. T., Lauder, I. J. & Kumana, C. R. Screening for fever by remote‐ sensing infrared
 thermographic camera. Travel Med. 11, 273-279 (2004).
35. Ng, D. K., Chan, C. H., Lee, R. S. & Leung, L. C. Non-contact infrared thermometry temperature
 measurement for screening fever in children. Trop. Paediatr. 25, 267-275 (2005).
36. Steketee, J. Spectral emissivity of skin and pericardium. Med. Biol. 18, 686 (1973).

37. Chenna, Y. N. D., Ghassemi, P., Pfefer, T. J., Casamento, J. & Wang, Q. Free-form deformation approach
 for registration of visible and infrared facial images in fever screening. Sensors 18, 125 (2018).
38. Kumar, R. & Indrayan, A. Receiver operating characteristic (ROC) curve for medical researchers.
 Indian 48, 277-287 (2011).

39. Cheung, B., Chan, L., Lauder, I. & Kumana, C. Detection of body temperature with infrared thermography:
 accuracy in detection of fever. Hong Kong Med. J. 18, 31-34 (2012).
40. World Health WHO informal consultation on fever management in peripheral health care settings: a
 global review of evidence and practice. (2013).
41. Youden, W. J. Index for rating diagnostic tests. Cancer 3, 32-35 (1950).
42. Mendt, S. et al. Circadian rhythms in bed rest: monitoring core body temperature via heat- ux approach
 is superior to skin surface temperature. Int. 34, 666-676 (2017).
43. Ng, E. Y. K., Kaw, G. J. L. & Chang, W. M. Analysis of IR thermal imager for mass blind fever Microvasc.
 Res. 68, 104-109 (2004).

44. Ring, F. J. & Ng, E. Y. K. Infrared thermal imaging standards for human fever detection. in Medical
 infrared imaging: principles and practices (eds Mary Diakides, Joseph D Bronzino, & Donald R
 Peterson) Ch. 22, 1-5 (CRC press, 2012).
45. Mans eld, C. D., Attas, E. M. & Gall, R. M. Evaluation of static thermal and near-infrared hyperspectral
 imaging for the diagnosis of acute maxillary rhinosinusitis. Otolaryngol. 34, 99-108 (2005).
46. Perkins, M. D. & Kessel, M. What Ebola tells us about outbreak diagnostic readiness. Biotechnol. 33, 464
 (2015).
47. Mabey, D., Flasche, S. & Edmunds, W. J. Airport screening for Ebola. The BMJ 349, g6202 (2014).
48. Ng, E. Y. K. Is thermal scanner losing its bite in mass screening of fever due to SARS? Phys. 32, 93-97
 (2005).

 Page 20/25
You can also read