Objective characterization of bruise evolution using photothermal depth profiling and Monte Carlo modeling
←
→
Page content transcription
If your browser does not render page correctly, please read the page content below
Objective characterization of bruise
                 evolution using photothermal depth
                 profiling and Monte Carlo modeling

                 Luka Vidovič
                 Matija Milanič
                 Boris Majaron

Downloaded From: https://www.spiedigitallibrary.org/journals/Journal-of-Biomedical-Optics on 10 Sep 2021
Terms of Use: https://www.spiedigitallibrary.org/terms-of-use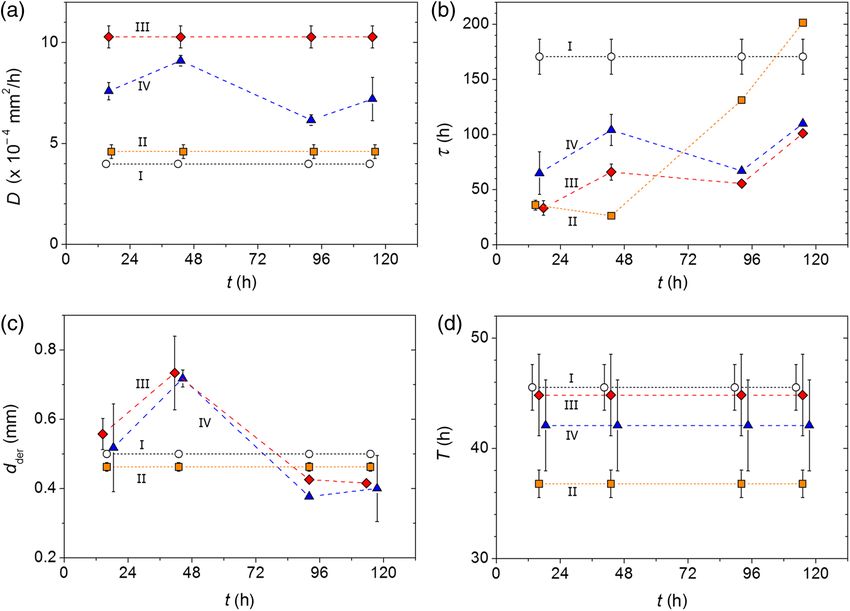
Journal of Biomedical Optics 20(1), 017001 (January 2015)

                Objective characterization of bruise evolution
                using photothermal depth profiling and
                Monte Carlo modeling
                Luka Vidovič,* Matija Milanič, and Boris Majaron
                Jožef Stefan Institute, Jamova 39, 1000 Ljubljana, Slovenia

                              Abstract. Pulsed photothermal radiometry (PPTR) allows noninvasive determination of laser-induced temper-
                              ature depth profiles in optically scattering layered structures. The obtained profiles provide information on spatial
                              distribution of selected chromophores such as melanin and hemoglobin in human skin. We apply the described
                              approach to study time evolution of incidental bruises (hematomas) in human subjects. By combining numerical
                              simulations of laser energy deposition in bruised skin with objective fitting of the predicted and measured PPTR
                              signals, we can quantitatively characterize the key processes involved in bruise evolution (i.e., hemoglobin mass
                              diffusion and biochemical decomposition). Simultaneous analysis of PPTR signals obtained at various times
                              post injury provides an insight into the variations of these parameters during the bruise healing process.
                              The presented methodology and results advance our understanding of the bruise evolution and represent
                              an important step toward development of an objective technique for age determination of traumatic bruises
                              in forensic medicine. © 2015 Society of Photo-Optical Instrumentation Engineers (SPIE) [DOI: 10.1117/1.JBO.20.1.017001]
                              Keywords: temperature depth profiling; pulsed photothermal radiometry; hemoglobin mass diffusion; objective fitting.
                              Paper 140429PRR received Jul. 4, 2014; accepted for publication Dec. 1, 2014; published online Jan. 2, 2015.

                1    Introduction                                                                  temperature depth profiles immediately after laser exposure
                Forensic examiners are often asked to assess the age of traumatic                  can be reconstructed.8 This provides valuable information on
                bruises, which may result from an accident or physical abuse.                      depth distribution and concentrations of selected absorbers, as
                The current protocol involves visual inspection of the bruise and                  was recently demonstrated in various applications in vivo.9–11
                                                                                                       In parallel with providing basic characterization of the
                relies on differences between the absorption spectra of the intact
                                                                                                   affected site, PPTR profiling also allows quantitative assessment
                skin, extravasated hemoglobin, and the products of its sub-
                                                                                                   of the hemoglobin dynamics and thus represents a complemen-
                sequent biochemical decomposition. However, the perceived
                                                                                                   tary approach to DRS for analysis of bruise evolution. As
                color of the bruise may vary strongly with the subject’s age,
                                                                                                   we describe in present report, this is achieved by combining
                natural skin tone, ambient lighting, and so on. Consequently,
                                                                                                   PPTR measurements in human subjects with numerical simula-
                the present approach—in addition to requiring the involvement
                                                                                                   tions of light transport and energy deposition in bruised skin.
                of a highly trained expert—produces bruise age estimates that
                                                                                                   The high sensitivity of such an approach to parameters of the
                are subjective and of limited accuracy.1–3
                                                                                                   analytical bruise evolution model was demonstrated in our pre-
                    Objective analysis of bruises by measurements of diffuse
                                                                                                   liminary tests, where temperature profiles reconstructed from
                reflectance spectra (DRS) in the visible spectral range was
                                                                                                   experimental PPTR signals were compared with those obtained
                recently proposed as an approach to overcome the above limi-
                                                                                                   from simulated ones.12,13 The results indicated that the hemoglo-
                tations.4–6 A simple mathematical model of the processes gov-
                                                                                                   bin diffusivity in skin is significantly lower than the values
                erning the bruise evolution was introduced, i.e., mass diffusion
                                                                                                   assessed earlier from studies based on DRS. This warranted fur-
                and biochemical transformations of the extravasated hemoglo-
                                                                                                   ther development and application of our approach in order to
                bin.6 However, the inverse analysis of the DRS from test                           improve our knowledge of the bruise evolution processes.
                subjects, aiming to assess the (assumingly universal) model                            Reconstruction of laser-induced temperature profiles from
                parameters, requires knowledge of the lesion geometry (i.e.,                       PPTR signals represents a severely ill-posed inverse problem.
                the epidermal thickness and depth of vascular injury), which                       This leads to inevitable loss of accuracy and uniqueness in
                was unavailable. Thus, a presumed depth distribution of relevant                   the iteratively obtained solutions, especially in the presence of
                chromophores was used, which may have contributed to the                           experimental noise. However, our recent analysis indicated that
                fact that the obtained parameter values were rather scattered                      this effect does not reflect in the considerable uncertainties of
                and varied between different reports.6,7 (An account of addi-                      the assessed values for key bruise evolution parameters.14
                tional limitations of the used approaches is left for Sec. 4.)                         Nevertheless, we apply here a more streamlined methodol-
                    Pulsed photothermal radiometry (PPTR) presents a viable                        ogy, where simulated PPTR signals are fitted directly to the
                technique to assess the missing information. It is based on                        experimentally obtained signals. This approach avoids the above
                measurements of transient change of mid-infrared (IR) emission                     controversy by eliminating the reconstructions of either
                upon pulsed laser irradiation. From such radiometric signals,                      depth profile. At the same time, it significantly reduces the

                *Address all correspondence to: Luka Vidovič, E-mail: luka.vidovic@ijs.si         0091-3286/2015/$25.00 © 2015 SPIE

                Journal of Biomedical Optics                                                 017001-1                                     January 2015   •   Vol. 20(1)

Downloaded From: https://www.spiedigitallibrary.org/journals/Journal-of-Biomedical-Optics on 10 Sep 2021
Terms of Use: https://www.spiedigitallibrary.org/terms-of-use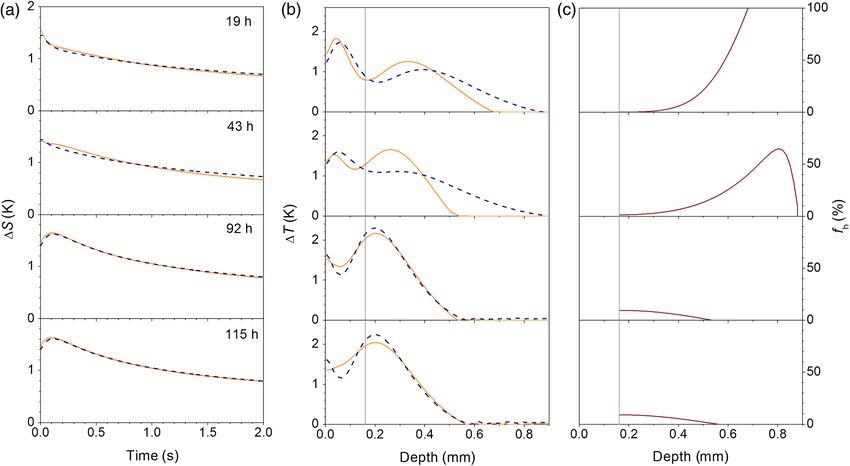
Vidovič, Milanič, and Majaron: Objective characterization of bruise evolution. . .

                computational complexity. This allows us to introduce objective                    The convection of hemoglobin due to pressure gradients is
                multivariate fitting to extract reliable values of the relevant skin               also neglected since its contribution is believed to be small.6
                characteristics and parameters of the bruise evolution model.                          The blood reservoir is assumed to form instantaneously at the
                    Furthermore, we also introduce simultaneous fitting of multi-                  time of injury. In our version of the model, the hemoglobin
                ple PPTR signals obtained at various times after incidental                        source function is box-like with the amplitude fixed at 100
                injury. This enables even more accurate and reliable assessment                    vol% and a variable duration T. The latter controls the amount
                of the bruise evolution parameters as compared with analysis of                    of extravasated blood and thus accounts for the severity of
                individual PPTR signals. At the same time, this approach pro-                      a specific injury. Because the epidermis is impenetrable to
                vides a unique insight into temporal variations of these param-                    hemoglobin, a zero-flux boundary condition is applied at the
                eters over the course of bruise resolution.                                        ED junction (depth depi ).
                                                                                                       An example of a bruise evolution with time is presented in
                                                                                                   Fig. 2, indicating the characteristic variation of color from the
                2     Methodology                                                                  initial reddish hue to darker, blue/indigo tones, and ultimately to
                                                                                                   green/yellow/brown discoloration.
                2.1     Mathematical Model of Bruise Evolution
                Bruising is initiated by the rupture of one or more blood vessels,                 2.2     Pulsed Photothermal Depth Profiling
                which results in the rapid formation of a subcutaneous blood
                pool. The subsequent evolution of the bruise is governed by                        PPTR involves time-resolved measurements of mid-IR emission
                mass diffusion of extravasated hemoglobin toward the skin                          following pulsed laser irradiation of the sample. From the radio-
                surface. The inflammatory response of the tissue initiates the                     metric signal transient, ΔSðtÞ, the laser-induced temperature
                biochemical transformation of hemoglobin into biliverdin and                       depth profile, ΔTðz; t ¼ 0Þ, can be obtained by solving the
                bilirubin. At the same time, bruise products are being removed                     integral equation
                through the lymphatic system. The process is depicted in Fig. 1.                              Z   ∞
                The epidermal thickness is denoted by depi, while dder marks                       ΔSðtÞ ¼            Kðz; tÞΔTðz; 0Þ:                                   (2)
                the depth location of the blood pool formation measured from                                   z¼0
                the epidermal–dermal (ED) junction.
                    In a laterally homogenous part of the bruise, the time                             The underlying details and functional form of the kernel
                evolution of the hemoglobin volume fraction, fh ðz; tÞ, can be                     function Kðz; tÞ were presented earlier.8 The theory was later
                modeled using the one-dimensional (1-D) diffusion equation:6                       augmented to account for the strong variation of the tissue
                                                                                                   absorption coefficient within the acquisition spectral band.15–17
                 ∂f h            f                                                                     By representing the PPTR signal and laser-induced temper-
                      ¼ D∇2 f h − h :                                                   (1)
                  ∂t              τ                                                                ature profile as vectors S and T, respectively, they become
                                                                                                   related by a matrix equation,
                    Here, D denotes the hemoglobin mass diffusivity (in units of
                mm2 ∕h) and τ is the characteristic time of its decomposition                      S ¼ KT;        K i;j ¼ Kðzj ; ti ÞΔz:                                 (3)
                due to lymphatic system drainage and biochemical transforma-
                tion to biliverdin in the heme oxygenase process. Biliverdin is,                      Due to the defect rank of the kernel matrix K, solving Eq. (3)
                in turn, converted to bilirubin in the process of biliverdin                       for the initial temperature profile T presents a severely ill-posed
                reductase.6 Spectral properties of these compounds account for                     inverse problem.8 A unique solution does not exist in general
                the green/yellow hue of the bruise several days after injury.                      and the most probable result is commonly obtained by iterative
                However, because a green laser (λ ¼ 532 nm) is used in our                         minimization of the residual norm squared, kS − KTk2 . Our
                PPTR setup, their contribution to the induced temperature                          custom reconstruction code involves the projected v-method
                rise will be negligible. The dynamics of bilirubin generation
                and decomposition can thus be omitted from our analysis. (A
                quantitative verification of this claim is provided in Sec. 4.)

                Fig. 1 Schematics of geometry and processes involved in the bruise                 Fig. 2 Photographs of a bruise on the arm of a 27-year-old man (vol-
                evolution model (adapted from Ref. 6).                                             unteer 15_AK) at various times after incidental injury (see the labels).

                Journal of Biomedical Optics                                              017001-2                                             January 2015    •   Vol. 20(1)

Downloaded From: https://www.spiedigitallibrary.org/journals/Journal-of-Biomedical-Optics on 10 Sep 2021
Terms of Use: https://www.spiedigitallibrary.org/terms-of-use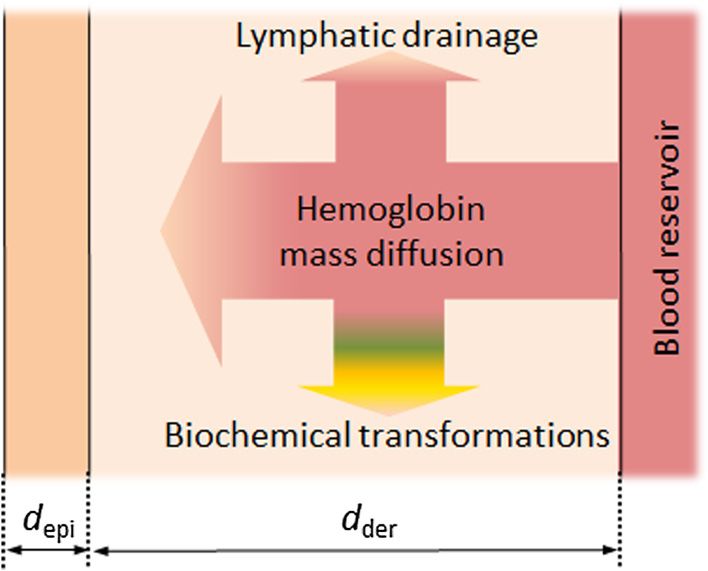
Vidovič, Milanič, and Majaron: Objective characterization of bruise evolution. . .

                with a non-negativity constraint.17 The accuracy and robustness                    correlate such a concentration profile with the PPTR data, we
                of the process were further improved by nonuniform binning of                      simulate laser energy deposition in bruised skin using the
                the PPTR signals.18                                                                1-D multilayer weighted-photon Monte Carlo modeling of pho-
                                                                                                   ton transport in multi-layered tissue (MCML) technique.21
                2.3     Experimental Setup and Procedure                                               Our optical skin model is composed of an epidermal layer
                                                                                                   and 50 layers within the dermis to account for the hemoglobin
                The study protocol was approved by the Medical Ethics                              depth distribution f h ðz; tÞ. The bottom layer is semi-infinite and
                Committee of the Republic of Slovenia. The study involves                          starts at the depth where the blood reservoir is formed (dder ).
                healthy volunteers with fair skin (Fitzpatrick types I–II), 20                     Optical properties are computed separately for each layer.
                to 60 years of age, with fresh bruises resulting from sports-                          The absorption coefficient of the epidermal layer, μa;epi , is
                related accidents or similar minor injuries with a known time                      calculated using the well-known equations22
                of occurrence.
                    In each subject, PPTR measurements were performed two
                to six times within 2 weeks after the injury. The same measure-                    μa;epi ¼ f mel μa;mel þ ð1 − f mel Þ μa;base ;                          (4)
                ment sites on the bruise and nearby healthy skin were used for
                the entire measurement sequence. Prior to measurement, the                                                               −3.33
                superficial layer of dehydrated skin cells was removed by                                                             λ
                tape stripping. The site was cleaned with medical-grade ethanol,                   μa;mel ¼ 6.6 × 1010 mm−1                        ;                       (5)
                                                                                                                                     nm
                rehydrated using physiological solution, and air dried.
                    All test sites were irradiated with single 1-ms pulses at
                532 nm, emitted from a medical-grade laser (DualisVP, Fotona,
                                                                                                                           −1                 −1             λ − 154 nm
                Ljubljana, Slovenia). The applied wavelength is absorbed well                      μa;base ¼ 0.0244 mm          þ 8.53 mm              exp −             ;
                by epidermal melanin and intravascular as well as extravasated                                                                                 66.2 nm
                hemoglobin within the dermis. At a spot size of ∼5 mm, the                                                                                             (6)
                radiant exposure was around 0.5 J∕cm2 . Note that for the
                involved skin types and comparable irradiation conditions,
                                                                                                   where μa;mel represents the melanin absorption and μa;base is
                the threshold for skin injury is around 7 to 10 J∕cm2 ,19,20 so
                                                                                                   the baseline absorption in bloodless skin. The melanin volume
                our subjects did not incur any discomfort or adverse effects.
                                                                                                   fraction, f mel , is assumed to be constant throughout the
                    Mid-IR emission from the tissue surface was recorded within
                                                                                                   epidermis.
                the acquisition spectral band of a fast IR camera (λ ¼ 3.5 to
                                                                                                       Absorption in the dermis involves contributions from nor-
                5.1 μm; FLIR SC7500) over a period of 5 s at a rate of 1000
                                                                                                   mally present absorbers and additional hemoglobin extravasated
                frames per second. PPTR signals ΔSðtÞ were produced by lat-
                                                                                                   upon the injury. For the intravascular present hemoglobin, we
                eral averaging of the data over a subwindow corresponding to
                an area of 1.5×1.5 mm2 on the skin surface. The manufacturer                       assume a hematocrit of 41% and oxygen saturation level
                provided calibration system (Hypercal™) was used for non-                          Sbl ¼ 80%. The absorption of blood is calculated as a linear
                linear conversion of the signal amplitudes to radiometric tem-                     combination of the values for oxygenated and deoxygenated
                perature values.                                                                   whole blood.23 We also take into account the optical screening
                                                                                                   within the vessels using the customary correction factor and
                                                                                                   average vessel size distribution.24,25 By combining the obtained
                2.4     Simulation of Pulsed Photothermal Radiometry
                                                                                                   effective blood absorption coefficient, μbl , with the baseline
                        Measurements
                                                                                                   absorption (μa;base ), we derive the absorption coefficient for
                Our simulation begins by computing the hemoglobin depth dis-                       intact dermis.
                tribution f h ðz; tÞ at the selected time point, using Eq. (1) and                     For each dermal sublayer, we must consider also the contri-
                the assumed model parameter values [Fig. 3(a)]. In order to                        bution of extravasated hemoglobin:

                                       Fig. 3 Illustration of the three steps in our simulation: (a) Hemoglobin depth distributions from Eq. (1);
                                       (b) temperature profiles obtained by numerical simulation of laser energy deposition in pulsed photother-
                                       mal radiometry (PPTR) measurement; and (c) the resulting radiometric signals calculated using Eq. (3).
                                       The simulations at times 36 h (solid lines), 72 h (dashed line), and 120 h (short dashed line) after
                                       injury are plotted. The parameter values used in this example are d epi ¼ 0.1 mm, f mel ¼ 2%, f bl ¼ 2%,
                                       d der ¼ 0.9 mm, D¼ 0.0015 mm2 ∕h, τh ¼ 72 h, and T ¼ 24 h.

                Journal of Biomedical Optics                                              017001-3                                             January 2015      •   Vol. 20(1)

Downloaded From: https://www.spiedigitallibrary.org/journals/Journal-of-Biomedical-Optics on 10 Sep 2021
Terms of Use: https://www.spiedigitallibrary.org/terms-of-use
Vidovič, Milanič, and Majaron: Objective characterization of bruise evolution. . .

                μa;i ¼ f bl μbl þ ð1 − f bl Þμa;base þ f i μh :                         (7)        detailed physical model and a carefully selected inversion algo-
                                                                                                   rithm, one can often extract valuable information from PPTR
                    Here, f bl and f i are the fractional volumes of intravascular                 signals which appear very similar to one another.11,29–31
                hemoglobin and extravasated hemoglobin concentration in the
                specific dermal sublayer, respectively. Oxygen saturation of the
                                                                                                   2.5      Fitting of Measured Data
                latter is believed to be lower than for intravascular hemoglobin
                due to the altered homeostatic environment. Thus, we apply an                      The experimentally obtained PPTR signals are matched with
                oxygenation level of Sh ¼ 40%.                                                     simulated signals by objective multidimensional fitting using
                    The reduced scattering coefficient for epidermis and dermis                    the nonlinear least-squares method (function lsqnonlin in
                is calculated as                                                                   MATLAB Optimization Toolbox by Mathworks, USA). The ini-
                 0              0 þ ð1 − f Þμ 0
                                                                                                   tial 2 s of the transient PPTR signal, which corresponds to 2000
                μs;derm ¼ f bl μs;bl      bl s;base ;                                   (8)        uniformly distributed data points, are used in the fitting process.
                                                                                                   As already pointed out above, this approach eliminates the
                          0                                                     0
                where μs;base   represents the baseline value for skin and μs;bl                   reconstruction of either depth profile with several beneficial
                marks the value for whole blood.26 The reduced scattering                          consequences.
                coefficient for epidermis thus equals μs;base 0  . The epidermal                       In the first step of our analysis, we fit the simulated PPTR
                and dermal layers are assigned the same refractive index value,                    signals to those measured on intact skin. In our numerical
                n ¼ 1.4.                                                                           model, healthy skin is represented by two homogeneous layers
                    By also considering the thermal properties of the involved                     representing the epidermis and semi-infinite dermis. The
                tissues, the simulated energy deposition profiles can be con-                      best match is sought by varying the epidermal thickness depi ,
                verted into the corresponding temperature profiles [Fig. 3(b)].17                  epidermal melanin content f mel , and blood content in normal
                Temporal changes of the latter are evidently not as pronounced                     dermis f bl .
                as the variations of the hemoglobin profile in Fig. 3(a). This                         In the subsequent analysis of bruised skin, the parameter val-
                reflects the baseline contribution to optical absorption by normal                 ues assessed from the nearby healthy site are used as constants.
                dermis (containing 2% of vascular blood) and the complex                           The difference between the PPTR signals measured in the bruise
                dependence of light fluence at any given depth on both absorp-                     and healthy skin is attributed exclusively to the presence of
                tion and scattering properties of the shallower and even deeper                    extravasated hemoglobin. In the fitting process, we thus vary
                skin layers.                                                                       the bruise evolution parameters, i.e., hemoglobin mass diffusiv-
                    From these data, the corresponding PPTR signals are easily                     ity D, decomposition time τ, dermal thickness dder , and source
                predicted using Eq. (3). The results [Fig. 3(c)] essentially re-                   duration T, to obtain the optimal match between the simulated
                present the time evolution of temperature in the superficial                       and measured PPTR signals.
                part of the skin, convolved with a function accounting for partial                     The information on the parameter values of the presented
                absorption of the IR emission contributions from subsurface tis-                   bruise evolution model in literature is limited and somewhat
                sue layers.8,15 The observed similarity between the initial signal                 controversial. Randeberg et al.6 used a hemoglobin mass diffu-
                jumps (from the value of 0, corresponding to the tissue baseline                   sivity of D ¼ 0.01 mm2 ∕h based on the earlier reported diffu-
                temperature) thus follows directly from the fact that the initial                  sivity of myoglobin in skeletal muscles and observed agreement
                temperature rise within the epidermis (due to melanin absorp-                      of their model predictions with experimental data. In a sub-
                tion) is only marginally affected by the dynamics of extravasated                  sequent study, Stam et al.,7 who also incorporated lateral diffu-
                hemoglobin deeper inside the skin [see Fig. 3(b)].                                 sion of chromophores in the bruise, reported a significantly
                    Similarly, the subsequent shape of the PPTR signals in                         lower optimal value, D ¼ 0.0015 mm2 ∕h.
                Fig. 3(c) is dominated by thermal relaxation of the epidermis,                         Similarly, the hemoglobin decomposition times, as assessed
                which is again very similar for all three presented examples.                      by matching the model predictions with measurements in vivo,
                Contributions from heat diffusing toward the skin surface                          were reported in a range of 72 to 120 h.6 However, considerably
                from deeper heated regions are superimposed onto such back-                        shorter decomposition times (τ ¼ 6 to 12 h) were observed for
                grounds due to linearity of Eqs. (2) and (3).27 Owing to the                       some bruises with a distinct whitish central region.6
                diffusive nature of heat transport, however, the amplitudes of                         In both studies referenced above,6,7 the depth of blood pool
                individual signal contributions inevitably decrease (nearly                        formation was assumed to match the dermal thickness.
                inversely proportional) with the absorber’s depth and also                         Moreover, as the latter value was also not available for a par-
                become increasingly similar to one another (see, e.g., Fig. 3                      ticular person and anatomic location, average anatomical values
                in Milanič et al.17). More specifically, higher spatial frequency                 were applied in their analyses. On the other hand, both groups
                components of the initial temperature profile have a lesser effect                 acknowledged the strong influence of the depth of blood spill
                on the resulting PPTR signal, and their contribution is progres-                   on the spatial distribution of extravasated hemoglobin and
                sively reduced with increasing depth. Both findings follow                         consequently the evolution of the bruise color (and DRS).6,7
                rigorously from the singular value decomposition of the kernel                     Accordingly, they pointed out the importance of having such
                matrix K, which is a mathematical theory beyond the scope of                       information provided by an independent measurement on an
                the present manuscript.8,28                                                        individual patient basis.
                    Based on the same theory, the related inverse problem—i.e.,
                assessment of the laser-induced temperature profile from PPTR
                signals—is characterized as severely ill-posed. In practical
                                                                                                   3       Results
                applications, this leads to the inherent nonuniqueness of the                      3.1      Healthy Skin
                solutions and an inevitable loss of accuracy, which is accentu-
                ated at larger depths and lower signal-to-noise ratios.8,17,18                     Relevant characteristics of intact skin are assessed from PPTR
                Nevertheless, by controlling the latter, applying a sufficiently                   measurements on a test site near the bruise as described above.

                Journal of Biomedical Optics                                              017001-4                                          January 2015   •   Vol. 20(1)

Downloaded From: https://www.spiedigitallibrary.org/journals/Journal-of-Biomedical-Optics on 10 Sep 2021
Terms of Use: https://www.spiedigitallibrary.org/terms-of-use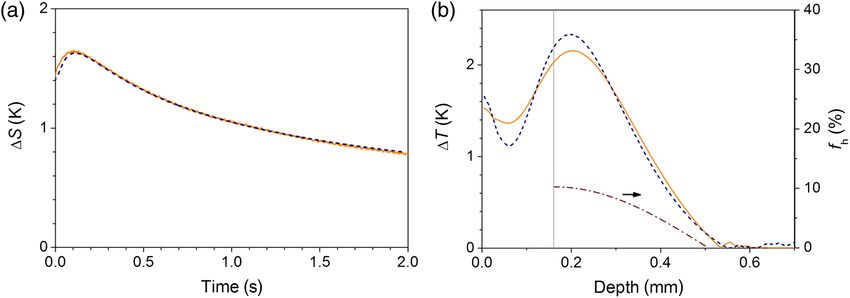
Vidovič, Milanič, and Majaron: Objective characterization of bruise evolution. . .

                The obtained information, specific to the particular person and                    Table 1 Skin model parameters for the best-fitting simulated pulsed
                anatomic location, is used in the subsequent analysis of the                       photothermal radiometry (PPTR) signal in healthy skin [see Fig. 4(a)].
                bruise.                                                                            The values are complemented with confidence intervals. The num-
                    The result for a bruise located on the arm of a 27-year-old                    bers in parenthesis mark the ratios of the latter to the former.
                subject (15_AK; see Fig. 2) is presented in Fig. 4(a). An excel-
                lent match was obtained between the measured and simulated                         Parameter                                            Fitted value
                PPTR signals (solid and dashed lines, respectively). The
                corresponding model parameters for healthy skin are listed in                      d epi (mm)                                       0.161  0.001 (0.006)
                Table 1, complemented with the algorithm-provided confidence
                intervals. The numbers in parentheses are the ratios of the latter                 f mel (%)                                        1.100  0.001 (0.001)
                and the former and serve as rough estimates of the relative                        f bl (%)                                          2.41  0.01 (0.004)
                errors.
                    The matrix of correlations between the obtained skin param-
                eter values is presented in Table 2. For example, the value of depi
                is very strongly and negatively correlated with both f mel and f bl .              Table 2 Matrix of correlations between the three healthy skin param-
                This means that, e.g., a small increase of the epidermal thickness                 eters listed in Table 1.
                can be largely compensated by a slightly smaller (relative)
                reduction of the melanin and/or blood volume fractions to pro-                                         d epi                  fs                       f bl
                duce similar PPTR signals. The correlation between f mel and f bl
                is also rather strong but positive. At higher melanin content,                     d epi                 1                  −0.86                    −0.91
                the energy transmitted into dermis is reduced, but a similar
                temperature rise can still be obtained by increasing the blood                     f mel              −0.86                    1                      0.62
                volume fraction.
                                                                                                   f bl               −0.91                  0.62                      1
                    As a visual representation of the implied structure and
                chromophore distribution in the healthy skin site, we present
                in Fig. 4(b) the temperature depth profiles as reconstructed
                from the measured and simulated PPTR signals in Fig. 4(a).                         The corresponding model parameter values are listed in Table 3.
                The prominent subsurface temperature peak results from                             Figure 5(b) presents the laser-induced temperature depth pro-
                absorption of laser light in the epidermal melanin. Its width                      files as reconstructed from the signals in Fig. 5(a). The some-
                and amplitude are indicative of the epidermal thickness and                        what erratic behavior of both solutions below z ¼ 0.55 mm
                melanin concentration, respectively. The smaller temperature                       reflects the loss of accuracy with depth, inherent to PPTR
                rise in deeper layers is primarily due to absorption in intravas-                  depth profiling and primarily due to the ill-posedness of the
                cular hemoglobin.                                                                  involved inverse problem accentuated by experimental noise
                                                                                                   and rounding errors. The corresponding depth profile of extrava-
                                                                                                   sated hemoglobin, f h ðzÞ, calculated using Eq. (1), is also plotted
                3.2     Bruised Skin
                                                                                                   for illustration (dash-dotted line).
                We proceed to analysis of PPTR signals acquired from the inci-                         The matrix of correlations between the four bruise model
                dental bruise (see Fig. 2). The measurements were performed at                     parameters is presented in Table 4. All parameters are strongly
                16, 43, 92, and 115 h after the injury. The individual character-                  correlated as evidenced by the fact that the absolute values of all
                istics of skin as assessed from the nearby healthy site (Table 1)                  matrix elements exceed 0.5. The strongest (negative) correlation
                are applied here as constants. Only the four parameters of the                     is indicated between τ and T. At this particular time point and
                bruise evolution model are varied to obtain the best match                         bruise structure, the effect of prolonged source duration T on
                between the measured and simulated PPTR signals.                                   the amount and distribution of extravasated hemoglobin could
                    Figure 5(a) shows the measured and best-fitting simulated                      thus be approximately compensated, e.g., by a suitably reduced
                PPTR signal in a fully developed bruise, 92 h after the injury.                    value of τ.

                                       Fig. 4 (a) Comparison of PPTR signal measured in healthy skin (solid line) and best-fitting simulated
                                       signal (dashed line). (b) The corresponding reconstructed temperature depth profiles. The vertical line
                                       indicates the epidermal–dermal (ED) junction.

                Journal of Biomedical Optics                                              017001-5                                            January 2015    •   Vol. 20(1)

Downloaded From: https://www.spiedigitallibrary.org/journals/Journal-of-Biomedical-Optics on 10 Sep 2021
Terms of Use: https://www.spiedigitallibrary.org/terms-of-use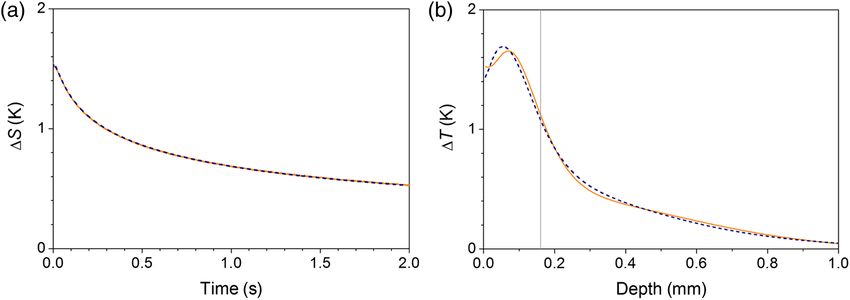
Vidovič, Milanič, and Majaron: Objective characterization of bruise evolution. . .

                                        Fig. 5 (a) PPTR signal measured in bruised skin 92 hours after the injury (solid line) and best-fitting
                                        simulated signal (dashed line). The corresponding model parameters are listed in Table 3. (b) The cor-
                                        responding reconstructed temperature profiles and hemoglobin depth distribution f h ðzÞ (dash-dotted
                                        line). The vertical line indicates the ED junction.

                Table 3 Bruise model parameters as assessed from PPTR measure-
                                                                                                    evolution. The three parameters of intact skin, determined
                ment 92 h after injury [see Fig. 5(a)]. The values are complemented                 separately from the measurement at a healthy site (Table 1),
                with confidence intervals, and the numbers in parentheses mark the                  are again used as constants.
                ratios of the latter to the former.                                                     In our first approach, we thus vary the parameters of the
                                                                                                    bruise evolution model (D, dder , τ, and T) to obtain the best
                                                                                                    overall match between the simulated and measured PPTR sig-
                Parameter                                                    Fitted value
                                                                                                    nals at all four time points (approach I). The resulting parameter
                D (×10−4 mm2 ∕h)                                          7.4  0.2 (0.03)          values are presented in Fig. 6 (open circles). The hemoglobin
                                                                                                    diffusivity (D ¼ 4.0 × mm2 ∕h) is considerably lower than
                τ (h)                                                     87  2 (0.02)             the value obtained from a single PPTR signal (Table 3). The
                                                                                                    other parameters have also changed in turn, in accordance
                d der (mm)                                                0.35  0.01 (0.03)
                                                                                                    with the correlations seen in Table 4. For example, the lower
                T (sh)                                                    38  1 (0.03)             value of D results in a lesser amount of extravasated hemoglobin
                                                                                                    diffusing from the blood pool into the dermis. However, a sim-
                                                                                                    ilar hemoglobin concentration can be obtained at delayed time
                                                                                                    points by prolonging the decomposition time (to τ ¼ 171 h ver-
                Table 4 Matrix of correlations between the bruise evolution param-                  sus the earlier 87 h). Similarly, the blood pool persists somewhat
                eters listed in Table 3.
                                                                                                    longer (T ¼ 46 h) and is located slightly deeper inside the
                                                                                                    skin (dder ¼ 0.5 mm).
                                  D                 τ               d der                 T             These changes likely primarily result from the ill-posedness
                                                                                                    of the attempted inverse analysis (reflected in strong correlations
                D                 1              −0.57              0.59               0.56         between the assessed parameters), combined with relatively
                                                                                                    high-noise levels in the measured PPTR signals. On the other
                τ               −0.57               1              −0.72              −0.99
                                                                                                    hand, they might also be indicative of a certain variability of
                d der           0.59             −0.72                1                0.63         the parameter values over the course of the bruise healing proc-
                                                                                                    ess. To evaluate this hypothesis, we test the following several
                T               0.56             −0.99              0.63                  1         alternative approaches to the PPTR signal analysis.
                                                                                                        First, we allow the decomposition time τ to assume indepen-
                                                                                                    dent values at each time point, while the remaining model
                3.3      Simultaneous Fitting of Multiple Pulsed                                    parameters are varied jointly, like before, to obtain the best
                         Photothermal Radiometry Measurements                                       match with all measured PPTR signals (approach II, see
                                                                                                    Table 5). The resulting values of D and dder (Fig. 6, orange
                Our models of skin structure and bruise evolution produce                           squares; column II in Table 6) are fairly similar to those assessed
                simulated PPTR signals which can be fitted very closely to                          with the previous approach (column I). Meanwhile, the hemo-
                the measured ones, both in healthy and in bruised skins, and                        globin decomposition time exhibits a considerable variation
                the obtained parameters’ values appear to be assessed with                          over time, increasing from τ ∼ 30 h at the first two time points
                tight confidence margins. However, due to strong correlations                       to over 202 h at 5 days post injury [Fig. 6(b)]. Such an effect is
                between individual parameters, the indicated confidence inter-                      physiologically plausible, because the tissue inflammation
                vals do not reflect the actual accuracy of the reported                             response, driving the decomposition and removal of extrava-
                values. Other combinations of parameter values may yield                            sated hemoglobin, would have subsided over time.
                a similarly good match with the measured signal.                                        The notion that the above effect is significant is supported by
                   In order to achieve a more robust assessment of the bruise                       the analysis of the quality of the fits. As evidenced by the
                model parameters, we have implemented simultaneous fitting                          residual norms presented in Fig. 7, approach II results in con-
                of multiple PPTR signals obtained at various stages of bruise                       siderably lower residual values (orange columns) as compared

                Journal of Biomedical Optics                                                  017001-6                                       January 2015   •   Vol. 20(1)

Downloaded From: https://www.spiedigitallibrary.org/journals/Journal-of-Biomedical-Optics on 10 Sep 2021
Terms of Use: https://www.spiedigitallibrary.org/terms-of-use
Vidovič, Milanič, and Majaron: Objective characterization of bruise evolution. . .
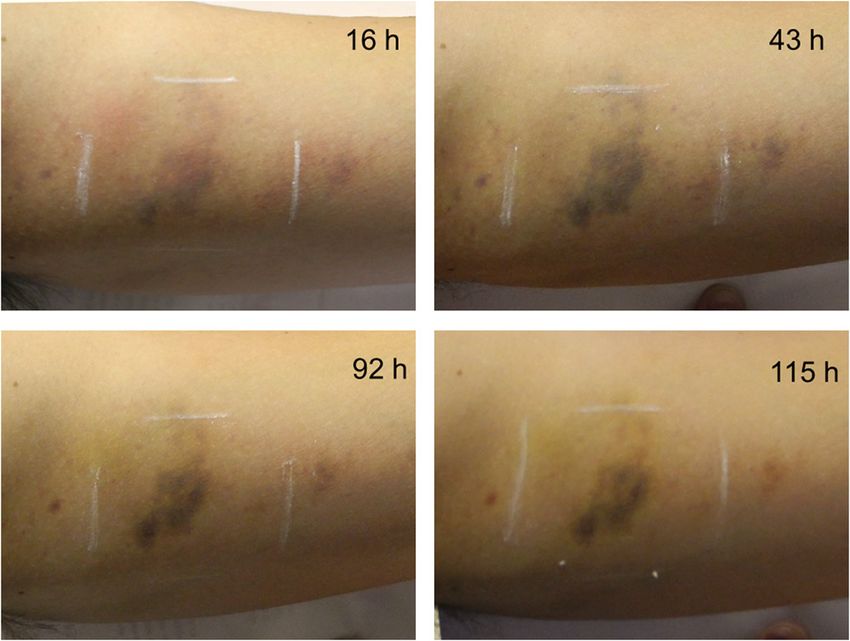
Fig. 6 (a)-(d) The values of four bruise evolution parameters obtained by fitting simulated PPTR signals
to those measured in a bruise at different times after injury tby using different fitting approaches: I (black
circles), II (orange squares), III (red diamonds), and IV (blue triangles). See the text for explanation. The
bars represent the algorithm-provided confidence intervals. A small lateral offset is applied where nec-
essary to prevent the overlap between neighboring symbols.
with approach I (white). Moreover, this is valid not only overall
but also separately for each time point, which strongly suggests Table 6 Bruise evolution parameters as assessed from PPTR
that τ does vary during the bruise healing process. This should measurements at different times after injury using the four fitting
thus be accounted for in the analysis of PPTR signals, which approaches (marked I–IV).
will then likely yield more accurate estimates for the remaining
model parameters, too. Approach # I II III IV
Encouraged by the above experience, we present next an
even more ambitious analysis, where dder is also allowed to D 4.0 0.1 4.6 0.3 10.3 0.5 7.6 0.4
vary independently, in addition to τ (approach III). The addi- (×10−4 mm2 ∕h)
9.1 0.2
tional decrease of the residual norms at each time point indicates
that introducing the additional degrees of freedom in the 6.2 0.2
analysis was justified (Fig. 7, red columns). The obtained
parameter values are presented in Fig. 6 (red diamonds) and 7.2 1.1
Table 6 (column III). Despite the rather large confidence
intervals, the indicated increase of dder at the first two time τ (h) 171 16 36 4 33 7 65 19
points appears convincing [Fig. 6(c)]. The weighted average
26 1 66 7 104 14
(dder ¼ 0.44 mm) closely resembles the constant value assessed
131 4 56 1 67 1
Table 5 Summary of the fitting approaches (denoted I–IV) applied in 202 4 101 1 110 2
our analysis, indicating the model parameters whose values are
assumed to stay constant over the course of bruise development.
d der (mm) 0.50 0.01 0.46 0.01 0.56 0.04 0.52 0.13
0.73 0.11 0.72 0.03
I D, τ, d der , T
0.43 0.01 0.38 0.01
II D, d der , T
0.42 0.01 0.40 0.10
III D, T
IV T T (h) 46 2 37 1 45 4 42 4
Journal of Biomedical Optics 017001-7 January 2015 • Vol. 20(1)
Downloaded From: https://www.spiedigitallibrary.org/journals/Journal-of-Biomedical-Optics on 10 Sep 2021
Terms of Use: https://www.spiedigitallibrary.org/terms-of-useVidovič, Milanič, and Majaron: Objective characterization of bruise evolution. . .
IV in Table 6). The obtained values of D lie between the (con-
stant) values assessed using the approaches II and III. Their time
evolution exhibits a pattern very similar to that seen for dder
[Figs. 6(a) and 6(c)]—a somewhat elevated value at the first
time point and a further increase at t ¼ 43 h, if the last two val-
ues are taken as the reference. However, the overall residual
norm has not dropped significantly in comparison with approach
III (Fig. 7).
The source duration T is an inherent property of each specific
bruise in our model, reflecting the amount of blood extrava-
sated upon the initial injury. Consequently, the same value of
T must be used to describe all PPTR measurements in the time
sequence.
Figure 8(a) presents the entire time sequence of measured
(solid lines) and best-matching simulated PPTR signals (dashed
Fig. 7 Comparison of the residual norms for different fitting approaches: line) obtained using fitting approach IV. The laser-induced tem-
I (white), II (orange), III (red), and IV (blue). The contributions from perature profiles reconstructed from these signals are plotted in
each PPTR signal and their average values are presented.
Fig. 8(b). The corresponding profiles of extravasated hemoglo-
bin, f h ðz; tÞ are presented in Fig. 8(c).
with the previous approach. The variability of τ is now markedly 4 Discussion
smaller than that seen in approach II [Fig. 6(b)]. This suggests In our experience, PPTR depth profiling is a very suitable tech-
that the latter might have been a result of overcompensation; i.e., nique for quantitative analysis of the bruise healing process. By
an attempt of the algorithm to account for variations of two or combining the analytical model of bruise evolution with Monte
more model parameters by varying only τ. Meanwhile, the value Carlo simulations of pulsed laser energy deposition, PPTR sig-
of D ¼ 10.3 × mm2 ∕h is now considerably higher than assessed nals measured in volunteers with incidental injuries could be
with the former approaches [Fig. 6(a)]. successfully replicated [Figs. 4(a), 5(a), and 8(a)]. By applying
In the last fitting approach, τ, dder , and D are all allowed to an objective multivariate fitting algorithm, we could thus extract
vary independently at each time point (approach IV). The result- relevant quantitative information on the structure and composi-
ing values of τ and dder assume very similar values and trends as tion of intact skin (i.e., epidermal thickness, blood, and melanin
seen in the previous approach (blue triangles in Fig. 6; column concentrations) as well as key processes governing the bruise
Fig. 8 (a) PPTR signals measured in the bruise at different times after injury (solid lines; see the labels)
and best-fitting simulated signals (dashed lines). (b) Laser-induced temperature profiles as reconstructed
from the PPTR signals in (a). (c) The corresponding extravasated hemoglobin depth distribution calcu-
lated using Eq. (1). The vertical line indicates the ED junction.
Journal of Biomedical Optics 017001-8 January 2015 • Vol. 20(1)
Downloaded From: https://www.spiedigitallibrary.org/journals/Journal-of-Biomedical-Optics on 10 Sep 2021
Terms of Use: https://www.spiedigitallibrary.org/terms-of-useVidovič, Milanič, and Majaron: Objective characterization of bruise evolution. . .
evolution, e.g., hemoglobin mass diffusion and biochemical Our last fitting approach IV, where D was also allowed to
decomposition. vary over time, resulted in a similar overall residual norm
However, despite the above and the small confidence mar- value as the approach III (Fig. 7). Moreover, the resulting values
gins indicated for the assessed parameter values (Tables 1 of τ and dder and their trends are very similar between the two
and 3), strong correlations between the model parameters approaches [Figs. 6(b) and 6(c)]. The assessed values of D fall
(Tables 2 and 4) limit the accuracy of the assessed values. In between the values assessed using the approaches II and III
other words, similarly good matches could be also obtained [Fig. 6(a)].
with other combinations of the parameter values, with minute Based on the above, we consider this approach as potentially
uncontrolled effects (such as experimental noise or deficiencies informative, while admittedly also somewhat speculative. We
of our simplified models) dictating which combination is find it particularly intriguing that the assessed time evolution
reported as optimal in any given example. of D is very similar to that of dder [blue triangles in Figs. 6(a)
Simultaneous fitting of multiple PPTR signals, measured at and 6(c), respectively]. If the last two time points are used as a
various times after the injury, is a viable approach for more reference (assumingly representing a lesion where the inflam-
robust assessment of the bruise model parameters. When all mation and edema have already subsided), then both variables
the parameters were considered to be constant with time (i.e., exhibit a somewhat elevated value at the first time point and a
our fitting approach I), the assessed values for D, τ, and dder further increase toward t ¼ 43 h. Such a correlation could be
(Table 6, column I) were significantly different from those attributed to the fact that the dermal swelling indicates an excess
obtained from analysis of a single PPTR signal (Table 3). of extracellular fluid. This should decrease the density of the
The rationale behind this approach is that each model parameter collagen/elastin matrix, thus enabling faster diffusion of the rel-
will have the strongest influence on the simulated PPTR signals atively large hemoglobin molecules.
at different stages of bruise evolution.13 For example, the values The obtained values of hemoglobin diffusivity are in the
of D and dder will mostly affect the hemoglobin profile f h ðzÞ at range of D ¼ 6 to 9 × 10⁻⁴ mm2 ∕h (approach IV), or 4 to 10 ×
earlier times, while the values of τ and T will have a stronger 10−4 mm2 ∕h if approaches I–III are taken into account. All
effect at later stages of the bruise evolution. these values are considerably lower than the last reported
In addition, by allowing selected parameters to assume inde- value, 15 × 10−4 mm2 ∕h.7 We attribute this discrepancy to
pendent values at each time point, we were able to provide an the fundamental advantage of our experimental approach,
insight into potential variations of these parameters over the which assesses directly the depth distribution of extravasated
course of the bruise healing process. We have implemented hemoglobin combined with simultaneous analysis of measure-
and tested several versions of such a simultaneous fitting, rang- ments at several time points after injury.
ing from the most robust (approach II; only τ can vary with time) In comparison, the DRS, used in the former studies of bruise
to the most ambitious with 13 free parameters (approach IV; D, dynamics, has several disadvantages.6,7 First, DRS lacks intrin-
τ, and dder can all vary independently between the four time sic sensitivity to chromophore depth, as the light scattered at
points). all tissue layers is lumped together in the recorded spectra.
As evidenced by our analysis of the residual norms (Fig. 7), Consequently, inverse analysis of DRS requires accurate knowl-
the introduction of varying τ (approach II) followed by dder edge of the lesion geometry, which was lacking (and thus
(approach III), each yielded a significant improvement of the assumed) in the discussed studies.
match between the simulated and measured PPTR signals at Second, their analyses were based on analytical solutions for
all time points as compared with the approach with constant diffuse approximation (DA) of light transport in the tissue,
parameters (approach I). At the same time, the confidence inter- derived earlier for structures with two or three optically homo-
vals of the assessed values do not increase excessively and typ- geneous layers.32,33 Clearly, representing the analytically pre-
ically remain smaller than the differences between the parameter dicted hemoglobin profile f h ðzÞ with a two-step function (as
values at various time points (Fig. 6, Table 6). Both observations the first layer must be assigned to the epidermis) is a very
strongly suggest that the indicated trends are likely significant. crude approximation, which all but prevents extraction of its
Moreover, we believe that these trends are plausible from the specifics in the attempted inverse analysis. Third, the DA is
point of view of bruise physiology. Specifically, the trend of valid only for scattering-dominated tissues. This assumption
increasing τ [Fig. 6(b)] means a decreasing rate of hemoglobin can be challenged in a bruise, containing unusually large con-
degradation and lymphatic removal as the inflammatory tissue centrations of strongly absorbing hemoglobin. Finally, the DA is
response, triggered by extravasation of blood, is gradually sub- known to be invalid near the irradiated tissue boundaries, which
siding. As mentioned earlier in this text, the trend indicated by makes its direct application in analysis of DRS controversial.
the approach II (orange squares) is most likely exaggerated. But As demonstrated in a recent report, the fitting of simulated
this is not particularly problematic because solutions III and IV, DRS spectra from human skin with the DA solutions produces
which also yield significantly lower residual norms, indicate a significant systematic errors in the extracted parameter values.34
much more gradual increase of τ. The latter is also more plau- Due to these limitations, we believe that the bruise model
sible when considering that the assessed values of τ represent the parameters extracted from the DRS measurements in the men-
respective effective values which are valid for the entire time tioned studies are quite inaccurate and potentially burdened with
interval from the injury to the PPTR measurement. significant systematic errors.
The indicated initial increase of dder [Fig. 6(c)] and its sub- In this study, we set the oxygenation level of extravasated
sequent relaxation to a lower (assumingly normal) value can be hemoglobin to Sh ¼ 40%. This corresponds to the range of oxy-
interpreted as swelling (edema) of the injured site. This is a genation values reported by Randeberg et al.6 Our initial tests
common result of trauma and typically lasts for a couple of confirmed that using the value of 80%, the same as for intravas-
days. As the dermal layer expands, the blood source is (math- cular hemoglobin, yielded inferior results (i.e., higher residual
ematically speaking) temporarily pushed to a deeper location. norms when fitting the experimental PPTR data). Using Sh ¼ 0
Journal of Biomedical Optics 017001-9 January 2015 • Vol. 20(1)
Downloaded From: https://www.spiedigitallibrary.org/journals/Journal-of-Biomedical-Optics on 10 Sep 2021
Terms of Use: https://www.spiedigitallibrary.org/terms-of-useVidovič, Milanič, and Majaron: Objective characterization of bruise evolution. . .
also produced results that were just slightly worse than with with respect to the subject’s age, gender, location of the bruise,
Sh ¼ 40%. and so on. Obtaining such information would represent an
The omission of bilirubin dynamics from our analysis is important step toward future development of a technique for
based on its very low absorption coefficient at the 532-nm wave- objective determination of age in traumatic bruises.
length used in our PPTR setup (μa ¼ 0.27 mm−1 ) as compared
with the values for oxy- and deoxy-hemoglobin (20.8 and
14.8 mm−1 , respectively).23,35 We have verified the validity of 5 Conclusions
this approach by including the corresponding dynamical equa- Photothermal temperature profiling combined with Monte Carlo
tion and characteristic times for bilirubin generation and decom- modeling provides valuable information on the depth distribu-
position as provided in literature.6 For the example analyzed in tion of extravasated hemoglobin in bruised skin. This approach
present study, we can thus assess that the maximal bilirubin allows in vivo assessment of the hemoglobin mass diffusion,
concentration is reached at the location of blood spill (i.e., decomposition rate, and dermal thickness in bruised skin.
0.9 mm below the skin surface), 53 h postinjury. At that point, Simultaneous fitting of a time series of PPTR signals improves
the bilirubin contribution to skin absorption is only 0.08 mm−1. the fitting stability and results in lower confidence intervals of
This value is dwarfed by the contribution of extravasated hemo- the determined parameters as compared with the fitting of indi-
globin at the same time point, 1.92 mm−1 . vidual signals. The obtained results indicate plausible variations
The relative contribution of bilirubin to light absorption at in the inflammatory response, dermal thickness (attributed to
532 nm may be larger at later stages of bruise development edema), and possibly the hemoglobin mass diffusivity over
when most of extravasated hemoglobin has been removed. the course of the bruise healing process.
However, its absolute contribution will be lower than the
value given above, while even the baseline absorption of the
Acknowledgments
dermis (containing 2.4% of intravascular blood) at the same
wavelength amounts to 0.38 mm−1 . Our analysis (for the skin This work was supported by The Slovenian Research Agency
and bruise parameters as assessed in present study) thus shows through Grants P1-0192 and PR-04360. The authors thank
that the maximal contribution of bilirubin to radiometric signals Fotona D.D. (Ljubljana, Slovenia) for lending us the laser sys-
at the involved time points reaches, at most, 0.008 K, which is tem for use in this study.
far below the noise level in our measurements.
In present report, we also present the temperature depth pro- References
files reconstructed from measured and simulated PPTR signals
in order to obtain a visual representation of the predicted 1. N. E. I. Langlois, “The science behind the quest to determine the age of
bruises—a review of the English language literature,” Forensic Sci.
chromophore distribution inside the bruised skin. Note, how- Med. Pathol. 3(4), 241–251 (2007).
ever, that the iterative reconstruction process is intrinsically 2. S. Maguire, “Can you age bruises accurately in children? A systematic
prone to a certain loss of accuracy and uniqueness, which review,” Arch. Dis. Child. 90(2), 187–189 (2005).
may vary with the level of experimental noise (absent in our 3. T. Stephenson and Y. Bialas, “Estimation of the age of bruising,” Arch.
simulations), complexity of the target structure, and so on. Dis. Child. 74(1), 53–55 (1996).
These issues were bypassed in the present analysis by directly 4. M. Bohnert, R. Baumgartner, and S. Pollak, “Spectrophotometric evalu-
ation of the colour of intra-and subcutaneous bruises,” Int. J. Leg. Med.
fitting the measured PPTR signals rather than using recon- 113(6), 343–348 (2000).
structed temperature profiles. 5. V. K. Hughes, “The practical application of reflectance spectrophotom-
In addition, the simplicity of our skin model, especially the etry for the demonstration of haemoglobin and its degradation in
assumption of homogeneously distributed epidermal melanin, bruises,” J. Clin. Pathol. 57(4), 355–359 (2004).
contributes to the observed differences between the profiles 6. L. L. Randeberg et al., “A novel approach to age determination of
traumatic injuries by reflectance spectroscopy,” Lasers Surg. Med.
obtained from measured versus simulated signals. These are,
38(4), 277–289 (2006).
however, mostly limited to the superficial skin layers and are 7. B. Stam et al., “3D finite compartment modeling of formation and heal-
thus not detrimental for our analysis of the hemoglobin dynam- ing of bruises may identify methods for age determination of bruises,”
ics in the bruise. In a follow-up study, we are testing slightly Med. Biol. Eng. Comput. 48(9), 911–921 (2010).
more complex skin models, so far with encouraging provisional 8. T. E. Milner et al., “Depth profiling of laser-heated chromophores in
results. biological tissues by pulsed photothermal radiometry,” J. Opt. Soc.
Am. A 12(7), 1479–1488 (1995).
We would also like to comment on the high-residual 9. B. Majaron et al., “Prediction of the maximal safe laser radiant exposure
norm values observed in the presented example for PPTR meas- on an individual patient basis based on photothermal temperature profil-
urement at t ¼ 43 h, regardless of the fitting approach (I–IV; ing in human skin,” Lasers Surg. Med. 43(S23), 916–917 (2011).
Fig. 7). Note that this time point is very close to the assessed 10. M. Milanič and B. Majaron, “Pulsed photothermal depth profiling of
source duration T. We hypothesize that the box-like blood tattoos undergoing laser removal treatment,” Proc. SPIE 8207,
source function results in particularly unrealistic predictions 82070G (2012).
11. M. Milanič and B. Majaron, “Energy deposition profile in human skin
at such times. Because the same effect also occurred in other upon irradiation with a 1,342 nm Nd:YAP laser,” Lasers Surg. Med.
subjects, we are currently exploring more realistic blood source 45(1), 8–14 (2013).
functions and the first results are very promising. 12. L. Vidovič et al., “Characterization of the bruise healing process using
In our continuation of the presented work, we plan to test the pulsed photothermal radiometry,” Proc. SPIE 8801, 880104 (2013).
robustness of our analysis, in particular the fitting approaches III 13. L. Vidovič, M. Milanič, and B. Majaron, “Assessment of hemoglobin
dynamics in traumatic bruises using temperature depth profiling,” Proc.
and IV, and the indicated temporal variations of the bruise model
SPIE 9032, 903202 (2013).
parameters D, τ, and dder . Within the limits of our current pro- 14. L. Vidovič, M. Milanič, and B. Majaron, “Quantitative analysis of
tocol, which allows for 30 analyzed cases, we will also check for hemodynamics in bruised skin using photothermal depth profiling,”
any differentiation in the assessed parameter values and trends Int. J. Thermophys. (2014)..
Journal of Biomedical Optics 017001-10 January 2015 • Vol. 20(1)
Downloaded From: https://www.spiedigitallibrary.org/journals/Journal-of-Biomedical-Optics on 10 Sep 2021
Terms of Use: https://www.spiedigitallibrary.org/terms-of-useVidovič, Milanič, and Majaron: Objective characterization of bruise evolution. . .
15. B. Majaron et al., “Spectral variation of the infrared absorption coeffi- 29. S. A. Prahl et al., “Determination of optical properties of turbid media
cient in pulsed photothermal profiling of biological samples,” Phys. using pulsed photothermal radiometry,” Phys. Med. Biol. 37(6), 1203–
Med. Biol. 47(11), 1929 (2002). 1217 (1992).
16. B. Majaron and M. Milanič, “Re-evaluation of pulsed photothermal 30. R. M. S. Bindra, R. E. Imhof, and G. M. Eccleston, “In-vivo opto-
radiometric profiling in samples with spectrally varied infrared absorp- thermal measurement of epidermal thickness,” J. Phys. IV 4(C7), 7,
tion coefficient,” Phys. Med. Biol. 52(4), 1089 (2007). 445–448 (1994).
17. M. Milanič, I. Serša, and B. Majaron, “A spectrally composite 31. J. G. Laufer et al., “Photothermal determination of optical coefficients of
reconstruction approach for improved resolution of pulsed photothermal tissue phantoms using an optical fibre probe,” Phys. Med. Biol. 46(10),
temperature profiling in water-based samples,” Phys. Med. Biol. 54(9), 2515 (2001).
2829–2844 (2009). 32. L. O. Svaasand et al., “Tissue parameters determining the visual appear-
18. M. Milanič and B. Majaron, “Comparison of binning approaches for ance of normal skin and port-wine stains,” Lasers Med. Sci. 10(1),
pulsed photothermal temperature profiling,” Proc. SPIE 7371, 73710O 55–65 (1995).
(2009). 33. T. Spott and L. O. Svaasand, “Collimated light sources in the diffusion
19. C. Clark et al., “Treatment of superficial cutaneous vascular lesions: approximation,” Appl. Opt. 39(34), 6453–6465 (2000).
experience with the KTP 532 nm laser,” Lasers Med. Sci. 19(1), 1–5 34. P. Naglič et al., “Combining the diffusion approximation and Monte
(2004). Carlo modeling in analysis of diffuse reflectance spectra from human
20. W. K. Woo, Z. F. Jasim, and J. M. Handley, “Evaluating the efficacy of skin,” Proc. SPIE 8926, 89260U (2014).
treatment of resistant portwine stains with variable-pulse 595-nm pulsed 35. H. Du et al., “PhotochemCAD: a computer-aided design and research
dye and 532-nm Nd:YAG lasers,” Dermatol. Surg. 30(30(2 Pt 1)), 158– tool in photochemistry,” Photochem. Photobiol. 68(2), 141–142 (1998).
162 (2004).
21. L. Wang, S. L. Jacques, and L. Zheng, “MCML—Monte Carlo model- Luka Vidovič received his BS degree in physics from the University
ing of light transport in multi-layered tissues,” Comput. Methods of Ljubljana in 2011. He is employed as a junior research assistant at
Programs Biomed. 47(2), 131–146 (1995). Jožef Stefan Institute and is currently pursuing his PhD degree in
22. S. L. Jaques, “Skin optic,” http://omlc.ogi.edu/news/jan98/skinoptics physics. His research efforts focus on applications of pulsed
.html (2 February 2014). photothermal radiometry and more recently also diffuse reflectance
23. W. G. Zijlstra, A. Buursma, and O. W. van Assendelft, Visible and Near spectroscopy for quantitative characterization of human skin and
Infrared Absorption Spectra of Human and Animal Haemoglobin: cutaneous malformations.
Determination and Application, VSP, Utrecht (2000). Matija Milanič received his PhD degree in physics from the University
24. E. J. Fiskerstrand et al., “Laser treatment of port wine stains: therapeutic of Ljubljana in 2008. Since 2003, he has been working as a researcher
outcome in relation to morphological parameters,” Br. J. Dermatol. at Jozef Stefan Institute, Slovenia. Currently, he is employed as
134(6), 1039–1043 (1996). a postdoctoral researcher at IET, NTNU, Norway. The principal
25. B. Choi, B. Majaron, and J. S. Nelson, “Computational model to focus of his research is on the interaction of light with biomedical tis-
evaluate port wine stain depth profiling using pulsed photothermal sues, including photothermal radiometry, spectroscopy imaging, and
radiometry,” J. Biomed. Opt. 9(2), 299–307 (2004). numerical simulations.
26. T. Spott et al., “Application of optical diffusion theory to transcutaneous
Boris Majaron is a senior staff member at Jožef Stefan Institute in
bilirubinometry,” Proc. SPIE 3195, 234–245 (1998). Ljubljana, Slovenia. After having obtained his PhD degree in physics
27. T. E. Milner et al., “Depth determination of chromophores in human from the University of Ljubljana in 1993, his research interests shifted
skin by pulsed photothermal radiometry,” Appl. Opt. 35(19), 3379– gradually from laser physics and spectroscopy of solid-state laser
3385 (1996) materials to biomedical optics, specifically laser ablation and charac-
28. P. C. Hansen, Rank-Deficient and Discrete Ill-Posed Problems: terization of biological tissues using pulsed photothermal radiometry
Numerical Aspects of Linear Inversion, Society for Industrial and and diffuse reflectance spectroscopy. He is a member of the editorial
Applied Mathematics, Philadelphia (1998). board for Lasers in Surgery and Medicine.
Journal of Biomedical Optics 017001-11 January 2015 • Vol. 20(1)
Downloaded From: https://www.spiedigitallibrary.org/journals/Journal-of-Biomedical-Optics on 10 Sep 2021
Terms of Use: https://www.spiedigitallibrary.org/terms-of-useYou can also read