Find My Sloths: Automated Comparative Analysis of How Real Enterprise Computers Keep Up with the Software Update Races
←
→
Page content transcription
If your browser does not render page correctly, please read the page content below
Find My Sloths: Automated Comparative
          Analysis of How Real Enterprise
       Computers Keep Up with the Software
                   Update Races

      Omid Setayeshfar1 , Junghwan “John” Rhee2(B) , Chung Hwan Kim3 ,
                             and Kyu Hyung Lee1
                    1
                      University of Georgia, Athens, GA 30605, USA
                                {omid.s,kyuhlee}@uga.edu
             2
                 University of Central Oklahoma, Edmond, OK 73034, USA
                                     jrhee2@uco.edu
             3
                 University of Texas at Dallas, Richardson, TX 75080, USA
                                  chungkim@utdallas.edu

       Abstract. A software update is a critical but complicated part of soft-
       ware security. Its delay poses risks due to vulnerabilities and defects of
       software. Despite the high demand to shorten the update lag and keep
       the software up-to-date, software updates involve factors such as human
       behavior, program configurations, and system policies, adding variety
       in the updates of software. Investigating these factors in a real envi-
       ronment poses significant challenges such as the knowledge of software
       release schedules from the software vendors and the deployment times
       of programs in each user’s machine. Obtaining software release plans
       requires information from vendors which is not typically available to pub-
       lic. On the users’ side, tracking each software’s exact update installation
       is required to determine the accurate update delay. Currently, a scalable
       and systematic approach is missing to analyze these two sides’ views
       of a comprehensive set of software. We performed a long term system-
       wide study of update behavior for all software running in an enterprise
       by translating the operating system logs from enterprise machines into
       graphs of binary executable updates showing their complex, and individ-
       ualized updates in the environment. Our comparative analysis locates
       risky machines and software with belated or dormant updates falling
       behind others within an enterprise without relying on any third-party
       or domain knowledge, providing new observations and opportunities for
       improvement of software updates. Our evaluation analyzes real data from
       113,675 unique programs used by 774 computers over 3 years.

1    Introduction

Updating software in general and applying software patches in a more specific
sense is a very crucial part of maintaining an ecosystem of computers safe [6];
although regular updates alone do not guarantee complete safety, falling behind
c Springer Nature Switzerland AG 2021
L. Bilge et al. (Eds.): DIMVA 2021, LNCS 12756, pp. 215–236, 2021.
https://doi.org/10.1007/978-3-030-80825-9_11
216 O. Setayeshfar et al.
for sure poses security risks [46]. Research has shown a security patch might take
months to create once a vulnerability is found; it even can come after the public
disclosure of the vulnerability [25], and even after the vulnerability is publicly
disclosed, many users may still use older versions. These delays open the chance
for attackers to exploit those vulnerabilities; For large enterprises, such risks may
lead to a significant financial loss, and a negative impact on their reputation [43].
In the recent Equifax breach case, the personal information of 143 million
Americans were stolen [7], and the attacker exploited a known vulnerability,
whose patch was available a few months before the incident. It could have been
prevented if the software was updated in time. Another study [45] shows that
more than 99% of exploited vulnerabilities were used by attackers more than
one year after the vulnerabilities were publicly disclosed (e.g., CVE [15]). The
WannaCry ransomware also shows how missed or delayed security updates can
affect enterprises, as well as individuals [6].
Having all the users keep all the programs on their computer up to date at all
times is ideal, but as shown in our probe as well as [18,25], we are very far from
it in the real world; even in cases where an update is installed with minimal user
involvement [18]. Numerous attempts have been made to quantify how up to
date a computer is, mainly by focusing on a small set of programs [49].
The software update is a complicated process that involves multiple parties
and decision factors to occur such as the availability of the machine or the
connection to deliver the software update (e.g., a computer isolated with an
air-gap is not updated), the system-wide policy to control update behavior in
an enterprise, and each machine’s or software’s configuration (e.g., a user can
stop updater due to its annoyance of notifications). We summarize the currently
unsolved challenges to understand this problem as follows.
(1) First, understanding when each software’s update is created and released is
important by setting the reference on the sender’s side to determine how long
the update takes or it has been delayed in each client machine (i.e., on the
receiver’s side). This is a real challenge due to the lack of standard channels.
Several prior works [20,27,48] utilized this information by a connection to cer-
tain software companies [18,20]. Other works used a third party vendor, which
attempts to collect this information using binaries’ properties. This method
typically relies on the user (or software vendors) submission of the binary
executable, and thus it might not provide such information for less popular
or homebrew software. Our study of a large group of 774 machines shows that
only 14.2% of installed software information is available on National Software
Reference Library (NSRL) [4] and 75.3% on VirusTotal [47]. There is no sys-
tematic way to obtain this information for a comprehensive set of software
for general usage.
(2) Second, knowing exactly when the released software has landed in a machine
is a piece of crucial information to evaluate the update process of a program in
each machine. Software vendors (e.g., Google) may estimate the deployment
statistics if they use update management software that reports the instal-
lation timestamps or by the usage of the software (e.g., Google Chrome) ifFind My Sloths: Automated Comparative Analysis 217
it uses network and reports its version on usage. However, many programs
do not have such mechanisms implemented to evaluate the update processes.
They may not use dedicated update management software relying on users
to download and execute the installation package program manually. Also,
programs may not use the network or do not use telemetry functions. Given
numerous software programs being used in an enterprise, we observe many
programs in the shadow without automated well-designed update manage-
ment. Their updates solely depend on each user’s alertness or the enterprise
administration to initiate checks and updates. A systematic method to track
the update occurrences for a comprehensive list (ideally all ) of software is
highly desired but missing.
(3) After all, there is no standard on how each software should be updated.
Therefore, software vendors perform updates with their own ways and own
schedules as we show in Sect. 3.2. Also, there are multiple reasons why soft-
ware is incapable of updating features; legacy software (designed without
updates), the programs made by a limited resource (e.g., small vendors or
indie software), and the terminated or outdated programs support. All these
symptoms illustrate the demand for a systematic study on how our current
software is doing with updates and guidelines suggested regarding how each
software should be managed and how an update management software should
be designed.
In this work, we attempt to fill these gaps by creating a systematic approach
to measure the update behavior of a comprehensive set of programs from all
machines in an enterprise starting with individual records and summing up to
show the overall patterns. This work solves the aforementioned challenges by
automatically estimating (1) the release time of software and (2) the landing
time of the software with a fine granularity of individual programs and individual
machines in an enterprise. From these data, we could estimate how much behind
the latest version each software in each machine is without relying on domain
knowledge of developers’ channels or third-party information specialized with
software analysis. We take (3) multiple observations out of the real data from a
real enterprise environment and provide suggestions on what would be desired
properties of an update management software. Also, we deep dive on the sloths,
that we refer to the individual software and machine behind their peers in the
progress of updates inside the enterprise environment. We attempt to measure
their risk in terms of the delay based on our inferred software versions that are
available for all programs in our observation.
To achieve these goals, we develop FMS1 , a tool that autonomously ana-
lyzes update patterns from the collected data, detects outdated programs and
machines, and produces timely notifications to administrators. Our evaluations
show FMS can infer version orders with 85% accuracy. Using FMS, we have iden-
tified more than 14,690 outdated programs from 774 computers and 2,705 more
programs engaged in risky behaviors.
1
FMS is an acronym of Find My Sloths, which refer to enterprise applications showing
undesirable delayed update behavior.218 O. Setayeshfar et al.
We make the following unique contributions in the analysis of software update
behaviors in a real enterprise environment.
– Systematic study of software update behavior based on real-world enterprise
data; Covering a total of 113,675 programs in multiple platforms observed in
an enterprise with 248 people. This result brings new observations of real-
world factors in software updates.
– We propose a method to estimate software release time and update delay with
only data collected inside the enterprise, without relying on software vendors’
release notes or 3rd party (e.g., VirusTotal, NSRL). We enable the estimation
of these information for all observed software to determine the update delay
of all programs. We found the first appearance of software in a fairly large
group of 774 machines can approximate software release time. We present the
closeness of these two data in Sect. 3.3.
– Our approach estimates the update delay of an individual binary executable
by subtracting the release time from the landing time of software update
being tracked 24/7. This needs to be done individually for each software in
each machine so that we can determine the delay of individual instances of
software updates. It is enabled by tracking operating system (OS) events (e.g.,
system calls, Windows API) that access and execute each binary executable
in all machines. This data enables a drill-down approach to determine the
sloth in multiple layers: starting from the machine with a large update delay,
we can nail down the identification of the slowest software in that machine
with our fine grained individualized monitoring.
2 Observations on Enterprise Software Deployment
This research collects binary executable update records from 774 PCs and servers
in an enterprise with 248 employees. This section summarizes observations from
the data we collected over three years between Feb. 2017 and Feb. 2020.
Observation 1: (Complexity of Update Transitions) Software update
state transitions are more complex at the client sides than the developers’
views. N versions of program binary distributions can cause up to N 2 possible
transitions depending on the availability and activation of updates.
Implications: Even though developers release a linear sequence of binaries,
extra non-linear transitions appear in the software update graph that defy the
versioning sequences of development due to diverse situations at the client side.
After a particular version of the software is installed, the next installed ver-
sion varies depending on various factors such as the updater configuration of a
particular machine, the machine’s availability, connectivity, and the enterprise’s
policy. When there is a gap between the installed version and the new version
to be installed, some software allow a direct transition of a version to another
version (e.g., 1.0 to 3.0) while some other software go through the applicationsFind My Sloths: Automated Comparative Analysis 219
of all intermediate versions (e.g., 1.0–2.0–3.0). We have analyzed these behaviors
of software in our observation in Sect. 4.
Observation 2: (Unusual Update Transitions) Rollbacks or regressions
are not uncommon.
Implications: Counter-intuitive transitions such as rolling back to older ver-
sions may occur in multiple software and machines due to various situations
at the client side like compatibility and functionalities.
We have observed multiple software from major vendors such as Adobe Flash
and Mozilla Firefox frequently show unusual transitions. We have analyzed this
observation of counter-intuitive transitions in Sect. 4.
Observation 3: (Various Update Deployment Time) Updates released
get installed at clients after various delays from less than 10 minutes to several
years.
Implications: In software updates, clients’ roles are as important as the devel-
opers’ release schedule because their configuration and choices decide whether
and when updates get installed.
We have performed fine-grained analysis on these software delays running in
an enterprise, individually measuring the delay of an individual software program
in each machine. This result is presented in Sect. 4.
Observation 4: (Various Support Period of Software Update) Depend-
ing on products and vendors, we observe that the updates could be provided
from no update in years to 1441 updates in three years. On average, we observe
6.4 updates for each product in our environment.
Implications: Users should be aware of the risk of end-of-support software.
We have analyzed this observation in Sect. 4. Software gets updates from
developers, but its degree highly varies depending on the vendor and products.
Large software vendors tend to have more extended support (presumably due to
their resources). Adobe Acrobat and Microsoft Office 2010 have been supported
for 11 and 9.5 years so far, respectively. Software without support poses a serious
risk as vulnerabilities are discovered over time.
Observation 5: (A Long Term Software Usage) Some software gets used
for a long time. Multiple programs are used as an outdated version even after
when the update support is no longer provided.
Implications: Like any commodity, the software is used as far as it can per-
form its function. However, unlike hardware commodity, software gets vulner-
abilities and becomes riskier to operate over time. Combined with the fourth
observation, the software usage after the terminated support poses a high risk.
We have analyzed this usage period of software in Sects. 4 and 6.1.220 O. Setayeshfar et al.
3 Design of Find My Sloths
In this section, we present FMS’s design, which automatically tracks and analyzes
software update patterns in a real enterprise environment. FMS is composed of
three main components: (1) Automated tracking of software binary information,
(2) Software update inference, and (3) Software risk analysis.
3.1 Automated Tracking of Software Binary Information
Package management systems provide automated installation, upgrade, config-
uration, and removal of computer programs. There exist various package man-
agement systems such as Linux Advanced Package Tool [1], RPM Package Man-
ager [38], zypper [42], portage [19], yum [8], pacman [44], Home Brew [2], MacOS
App Store [12], and Microsoft Store [32], that can possibly eliminate the user’s
effort towards manual installs and updates.
However, prior study shows the limitations of update managers [27]. Although
convenient to use, they do not provide full coverage of programs used on an
everyday machine, nor do they guarantee the timely installation of updates,
mainly due to inconveniences caused for the user during and after the update
process. In addition, there exist software types that package managers cannot
support, such as direct drop-in of a binary without an installer, custom installers
that do not work with package managers, programs’ self-updates, downloads of
related binaries or libraries, and local compilation of programs.
In this work, we do not aim to provide yet another automated updated sys-
tem, but we develop an automated and unified method to monitor software
updates by leveraging OS event monitoring techniques. OS event monitoring
techniques have been widely used for security analysis [9,24] or software execu-
tion diagnosis (e.g., fault diagnosis, debugging, root cause analysis) [11,16]. Our
monitoring agents utilize the OS event monitoring systems, which are currently
available in mainstream operating systems. In Microsoft Windows systems, we
use Event Tracing for Windows (ETW) [29]. We use the Auditd system [3] for
Linux operating systems. Specifically, we monitor the events regarding process
execution and file modification to binary executables (e.g., executable and library
files). The following table summarizes the events that we use.
Platform Operating system events
Windows (ETW) WinExec, WriteFile, WriteFileEx, WriteFileGather
Linux (Audit) execve, write, writev, pwrite, pwritev, pwrite64
We install the OS event tracking system (we call them monitoring agents) in
hosts, including servers, desktops, and laptops, in the organization. Our agents
cover various OSes and their versions—over 30 kinds—including Windows (e.g.,
Windows 7, 10) and Linux (e.g., Ubuntu, Redhat, CentOS) in our prototype.Find My Sloths: Automated Comparative Analysis 221
Other operating systems such as MacOS can be also supported by our system
by utilizing their OS event function. Once the events are collected, the rest of
the process is agnostic to the operating system itself. Tracking these OS events
provides the history of execution and modification (e.g., update, patch) of all
software binaries on a computer in a heterogeneous manner.
Fig. 1. Architecture of Find My Sloths (FMS).
The tracking system streams the collected events to the backend server as
shown in Fig. 1. These events are stored in a database, which we use to analyze
the data. Next, we explain how we use this information to infer software updates.
3.2 Software Update Inference with Binary Update Lineage Graph
Lineage Graph Generation. To track the binary update information for each
software installed, we develop a lineage tracking algorithm that analyzes OS
events collected by our tracking module. We identify file write events applied
into binary executables and construct a binary update graph for each executable
files. A file path for an executable file, which is executed, becomes a candidate
for an update check. Whenever we observe a file write event applied this file
candidate, this event is inferred as an update of the program.
Specifically, we first generate a graph to represent the lineage of binary
updates, G(V, E) where V is a set of vertices which represent the information of
program binaries, including both execution history and metadata. We call this
graph a Lineage Graph. We use a SHA256 hash of the binary, S, as the identifier
of each vertex. E is a set of directed edges where each edge shows how a binary
has been updated as U (Sold → Snew ). Each edge contains a timestamp of the
update as well as the identifier of the computer that it was observed on.
Interestingly, we have observed unusual binary modification patterns in some
applications, including Mozilla Firefox. To support the update without com-
pletely terminating the application, Firefox partially updates the image, reloads
it in a running process, and updates the next portion of the image. It generates
many bogus vertices and edges in the graph. To avoid this, we defined a time
threshold, and if the sequence of binary updates happens within the threshold,
we merge them in the graph and only keep the first image information. In this
work, we use 99.9 percentile of the time between updates, 180 s, as an empirical
threshold.222 O. Setayeshfar et al.
Algorithm 1. Graph Creation
Input: oldSig, newSig, comInfo, path
V = [], E = []
for each item in dataList do
u = null, v = null
if (oldSig ∈ V ) then
u = V .getItem(oldSig)
add comInfo and path to u
else
u = new N ode(oldSig); V .add(u)
if (newSig ∈ V ) then
v = V .getItem(newSig)
add comInfo and path to v
else
v = new N ode(newSig); V .add(v)
if ((u, v) = e ∈ E) then
add comInfo and date to e
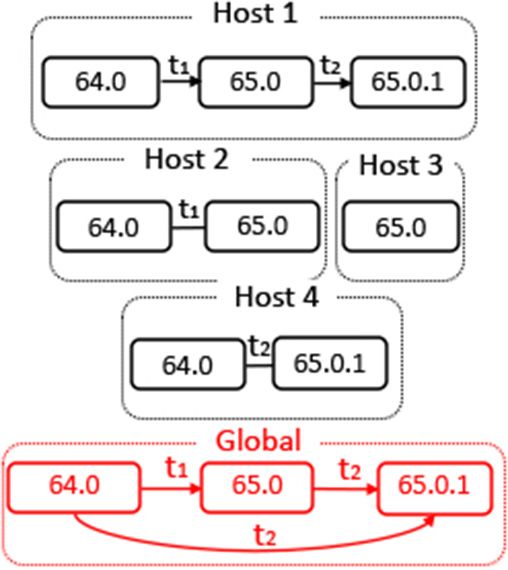
Fig. 2. Simplified graph from Mozilla
else Firefox demonstrates how we construct
E.add (new Edge(u, v)) a global view of update patterns.
Global Lineage Graphs as an Enterprise Level Update Summary. We
then generate the graphs for all hosts in the central server to create a collective
graph and comparatively measure the risk factors for each host. We use a binary
signature, S, to identify the same binary in different hosts and construct a global
update graph for each application to visualize binary update patterns across
hosts. It allows us to have a bird’s eye view of how each program is updated,
and similarities and differences of update patterns across hosts. Algorithm 1
presents how we construct global graphs.
Figure 2 demonstrates a simplified example of how we construct a global view
of update patterns. In this scenario, we have four hosts that have the execution
or modification history of a particular application. The application has three
distinct binary signatures, the version 64.0 (S64.0 )2 , S65.0 , and S65.0.1 . Host 1
has execution and update history where the binary has updated at t1 from
S64.0 to S65.0 and updated to S65.0.1 at timestamp t2 . The binary in Host 2 has
updated to v65.0 at t1 but never updated to S65.0.1 . Host 3 only has an execution
history of S65.0 , and Host 4 does not have any sign of S65.0 , but the binary has
directly updated from S64.0 to S65.0.1 at t2 . Note that this is simplified graphs to
demonstrate, but original nodes contain metadata and execution history (e.g.,
timestamps when the binary has executed).
We collect graphs from each host and construct a global graph aggregating
update patterns from all hosts. The global graph shows how the binary has
updated, who have out-dated binary executables, and how frequently out-dated
binaries have executed (we elide an execution history). We discuss how we mea-
sure the risk factors for each host using the global view in the next section.
Tracking Binary and Library Update. We detect updates based on over-
writing of the binary files. These can be either by a write event or an execution
2
This version number 64.0 is presented only for an illustration purpose. A lineage
graph is constructed using binary hashes and their appearance orders without using
the software’s specific version numbers, which may not always available or accurate.Find My Sloths: Automated Comparative Analysis 223
event which shows a new signature for the executable image. Note that not every
program update changes the main executable. It is possible to update library
files while the main executable stays unchanged. Most Windows applications
developed by .NET framework update the manifest in the main executable even
if the update is only applied to a library file [30,31], and thus FMS can detect it.
However, if the update is solely through the dynamic library without updating
the manifest, or main program FMS cannot detect it, and we leave it as our
future work. We further discuss this issue in Sect. 9.
Table 1. NSRL Program and Version Coverage. Latest versions available for four
popular programs as of the date of the writing and their corresponding records in the
latest NSRL [4] release (RDS Version 2.71 - Dec. 2020) showing NSRL release is not
up-to-date for several actively developed software programs.
Program name Latest NSRL versions Program name Latest NSRL versions
Mozilla FireFox 73.0 72.0, 68.0, 61.0.1 Acrobat Reader DC 21.001.20138 N/A
Google Chrome 80.0 76.0, 49.0, 47.0 Sublime 3.2.2 N/A
Limited Reference Services. We have considered using reference libraries for
software such as National Software Reference Library (NSRL) [4] or VirusTotal
File Search [47] that can retrieve information of application by a hash value.
They often provide known-vulnerabilities (e.g., CVE [15]) and it can be directly
used for the risk prediction. Table 1 shows version information for 4 popular
programs in NSRL. As shown, these references can be used with some main-
stream applications, however, they often fail to provide information on less-
known applications or free software distributed via source code.Also the fact that
less popular programs have less disclosed vulnerabilities [5] does not mean they
are more secure and they still should be monitored. We submitted all executable
files installed in our enterprise to NSRL and VirusTotal database, and we found
that only 14.2% of installed binary information is provided by NSRL and 75.3%
of binary information is available in VirusTotal.
3.3 Software Risk Inference
In order to estimate the risk each computer or software imposes on the enterprise
environment, the state of software on individual computers, as well as, the overall
enterprise status as a whole have to be quantified with a score; we introduce a
metric based on the delay in update time, that is defined as the estimated delay
of the installation time behind the latest version in its software distribution.
FMS monitors the process and file events and creates lineage graphs as intro-
duced in Sect. 3.2. From the data stream, we catch new updates as they emerges.
These updates are correlated and aggregated over all the enterprise to construct
the global update graph of a program. To give the administrators a better per-
spective, we also provide them with information on how common each program224 O. Setayeshfar et al.
is in the enterprise and the update patterns for that particular program. Here is
how FMS estimates the risk caused by the software update delay.
Inferred Versions. Relying on software vendor’s release schedules or third-
party services’ information does not scale to cover the majority of software.
Therefore, our approach determines the risk estimated by only using the mea-
sured metrics in our environment. In this scheme, the versions are determined
by temporal appearance order of signatures relative to the prior edge nodes in
an enterprise. We found that the statistical data collected from 774 machines
approximate the actual order of versions with 85% accuracy. We calculate accu-
racy by counting the number of versions found in the correct order by FMS as
compared to their respective compilation timestamp in a test set of programs
related to 16,273 updates chosen randomly from Windows binary files.
Let us define a program p has a set of its signatures Vp = {Sp,v,m } where
v is a version and m is a host index in an organization. Among multiple signa-
tures observed, we can find the one leading the version transitions that appear
most recently compared to other versions and transitioned from one or more
edge nodes of the graph. We call this version the head v̂, and its signature is
represented as Sp,v̂,m where m is the host having this version. This signature
is determined from the graph structure.
Estimated Release Time, Head Arrival Time, and Arrival Time of
Updates. To estimate the update delay, we need to determine three types of
timestamps. The first one is the release time, r(Sp,v,m ), when the software vendor
begins to distribute a new version of the software. This information is hard to
obtain with comprehensive coverage of the majority of software. We estimate
this information with the first appearance time of a signature, Sp,v,m , in an
enterprise. The second metric is the deployment time of the latest estimated
version, d(Sp,v̂,m ), that is the installation time of the most desirable version
where the function d(s) gives the installation time of a signature s. This is
determined after the head signature is found from the topology of the graph.
The third timestamp is the actual installation time, d(Sp,v,m ), that is a specific
time stamp when the software binary signature, Sp,v,m is installed. Its absolute
installation time since the release is d(Sp,v,m ) − r(Sp,v,m ).
Update Delay Metric. The update delay of software p of the current version
v in a machine m behind the head v̂ is defined as the following formula.
Dp,v,m = |d(Sp,v̂,m ) − d(Sp,v,m )|
This value measures a relative delay compared to the installation of the latest
version within an enterprise. Since this is calculated only by using our measure-
ments, we can generate this risk score without any domain knowledge require-
ment, such as the release date and time, which is only available by developers.
Such wide applicability to all programs is a unique strength of our approach.
We present interesting comparative statistics showing how each software in a
particular machine is doing compared to all other software instances within an
organization in Sect. 4. To this end, FMS generates a daily report that outlinesFind My Sloths: Automated Comparative Analysis 225
Fig. 3. Histogram over the number of Fig. 4. Number of unique software prod-
computers for each unique program ucts and unique versions observed for each
appearing. vendor, each dot represents one vendor.
the state of the risk across the enterprise and the list of machines that contain
outdated programs with detailed risk information.
4 Characteristics of Software Updates
Data Set. We collect binary access history (i.e., execution and modification
history) from a Fortune 500 Tech company. The company has 248 full-time
employees in multiple divisions, including research and technological develop-
ment (RTD), maintenance, financial, and human resources. We have installed our
binary monitoring module (Sect. 3.1) on 774 computers comprising 591 Microsoft
Windows and 183 Linux machines to monitor binary execution and modifications
over three years. In total, we observed 113,675 unique programs with an average
of 305 observed on a computer and a total of 40,971 updates.
Binary Distribution. To better characterize the distribution of programs on
computers, Fig. 3 shows a histogram for the number of unique programs in each
computer. There is an average of 305 programs executed on each computer in
the period of our observation.
Figure 4 shows the number of binary executables published by different pub-
lishers. We leverage the metadata from the Windows binaries to identify the
publisher for each binary. We only count images that contain publisher infor-
mation. This shows the imbalance between popular companies and companies
with less popularity in our sample enterprise. This figure shows a sample of the
meta information shown on the system’s user interface. It also shows how diverse
vendors are and how each one’s dominance differs from the other. In this graph
Microsoft followed by Adobe and Google have the highest number of programs.
Binary Updates. We have observed 40,971 updates of binary executables
from 774 Windows and Linux computers we monitored during this study. These
updates collectively introduced 11,948 new binaries to the enterprise. Updates
once released are not always installed within the same period on all computers,
Fig. 5 shows how each update is installed on different computers.226 O. Setayeshfar et al. Fig. 5. CDF for the time over which each update has been applied to different com- puters. Multiple products are shown along with the overall list. Fig. 6. Percentage of in-order and out-of-order updates for 5 different products. The number in the parentheses shows the number of updates. Update Order Patterns. We call any update that does not follow the release order an out of order update, e.g., going from 1.0 to 3.0, skipping a known inter- mediate version 2.0. Furthermore, as mentioned in Sect. 2, there are a noticeable amount of downgrades observed in our dataset as well. We consider them risky behavior. Although they might have happened for reasons like a downgrade after a feature has been removed from the new version or user’s choice, they could pose a risk to the enterprise. Figure 6 shows how common these out of order updates and downgrades are among some well known products. The programs in this figure observe a total of 55 downgrades. They took programs to versions with 19.7 CVEs on average at the time of downgrade. Product Lifecycle. We study the lifecycle of programs in our observation period by their compilation timestamps which show how spread the versions we have observed are. Figure 7 characterizes each program’s behaviors in terms of the number of days in which we have observed updates and the number of unique versions we have observed in our data collection. The highlighted nodes represent (0) Microsoft Malware Protection, (1–3) executable binaries included in Microsoft Windows Operating System.
Find My Sloths: Automated Comparative Analysis          227

Fig. 7. The length of support and released versions. Highlighted nodes represent: 0)
Microsoft Malware Protection, 1–3) Executable binaries included in Microsoft Windows
Operating System.

   Another part of the lifecycle is the delivery of the product to users. We
observe the delay between the programs’ installations and their releases in our
dataset varies significantly by vendor and product. Figure 8 shows some famous
vendors and their delivery performance. For example, Google has a short delay
updating 89% of installations within 18 days while Mozilla has a long deployment
time where some versions got installed after several months. This may have to
do with the popularity of the software.

Fig. 8. CDF of days between compilation and our first observation for different vendors
(left). Distance between compilation and signing date with our (middle) and Virus-
Total’s (right) first observation. Plots have been capped at 2000 days for readability.

Update Propagation. Updates are not installed on all computers at the same
speed. The speed at which the update is installed across computers in the net-
work depends on multiple factors such as the application, the user, configura-
tions, and the vendor’s delivery method. Figure 5 shows how the updates of four
programs are installed compare to the overall distribution. We can see ‘Microsoft
Malware Protection’ updates are distributed faster on the computers compared
to ‘Mozilla Firefox’. The vertical bars of each color represents the time when the
maximum is reached.

5    Evaluation of Software Update Risk
This section presents the estimated risk determined by the delay in updates
compared to peers in an enterprise environment. Figure 9 presents the estimated
software update risk in our environment with three scopes from the broad view
across all hosts (top) to the programs in a specific machine (bottom two).
228    O. Setayeshfar et al.

Fig. 9. Risk analysis on computers (top) shows average delays (dots) and the short
horizontal bars show the maximum delay for each computer. Expanded views show
how programs on a computer stand against the enterprise distribution (numbers show
total computers the program has been observed on). Plots marked by 1,2 show the
details of computers marked with corresponding numbers on the top plot.

Enterprise-Level View. The top figure in Fig. 9 shows the risk scores esti-
mated for all host machines, which show an aggregated risk score for each
machine. This view highlights the uniqueness of our approach making the risk
score available for all observed machines because our approach is agnostic to
OS and programs. Each vertical bar (I) shows the maximum and minimum risk
scores as the top and bottom marks and the average risk score of all software
within each machine as a dot in the middle. We can observe many machines
have one or more highly risky programs indicated by the maximum value far
away from the average, which serves a comparable score across peers. We placed
a blue box to show where the averages of most machines stay. We select one
sample standing out with high risk shown as a higher average (noted with the
red 1 sign), and another sample of a lower risk score which stays together with
peers within a blue box (noted with the red 2 sign). We provide drill-down views
of these two machines with a comparison next. These two particular machines
are chosen to illustrate a contrast with a comparable set of programs.
Machine-Level View. The next two figures in Fig. 9 present the views of par-
ticular hosts regarding all software programs running in them. Again, this high-
lights our unique view of a comprehensive coverage of all programs’ risk scores
Find My Sloths: Automated Comparative Analysis       229

Fig. 10. Software update management of Google Chrome browser updating 75 Google
Chrome versions over the period of 35 months. The top plot shows the version tran-
sitions via the deployment of each version of Chrome with respect to the number of
computers. The bottom plot shows the number of CVEs discovered for each version.

because we do not rely on developers’ or third-party’s program metadata (e.g.,
reputation) to determine the risk score. Each bar represents the update status of
one software in all machines. The total number of machines having this software
executed is written on top of the bar. Each machine has a score of delay showing
how much its version is behind the head (the latest version in an enterprise).
First, the average of all delays is calculated. The number of machines having
the delay shorter than the average is shown as an empty bar, and the machine
having the delay longer than the average is shown as a bar with the hatches. The
red horizontal lines indicate where this machine is among multiple peers. The
first graph (note 1) in the middle indicates multiple red lines are placed inside
the hatch bars meaning that such software has its version more than the average
delay among peers. For instance, multiple programs such as Adobe Flash player,
AMD External Events, Microsoft Edge, Microsoft Outlook, and .NET framework
show high risks. Administrators can use this view to spot vulnerable software.
The second graph (note 2) in comparison shows most software programs are
up-to-date by having the red horizontal lines at the bottom.

6     Case Study
This section presents an instance of desirable software management and an unde-
sirable example of a software product. These examples show how different ven-
dors’ software management policies are, highlighting what needs to be done.

6.1   An Example of a Desirable Software Management
In Sects. 4 and 5, we presented our observation on numerous shortcomings in
how vendors design the software distribution policies and actions to protect
their customers. We present Google Chrome as a desirable example with the
speedy delivery of software ensuring that most of the computers are updated to
the latest version in the shortest time.
   Figure 10 illustrates how 75 different versions of Google Chrome have been
updated. The top figure shows the deployment of each version over time. While
230     O. Setayeshfar et al.

several versions have lingered around over the maximum period of 10 months,
a package was replaced by a next version after less than a day in the minimum
case and after 26 days on average.
    The bottom figure shows the number of CVEs accumulated for each version
over time. For this case study, we manually collect reported CVEs between April
2017 and April 2019 for Google Chrome and cross-match them with versions we
observed in our dataset. The total number of CVEs grows to more than five
hundred for version 52.0. This data illustrates that the only solution to operate
software safely is to update it with the version whose vulnerabilities are not yet
discovered for the time being (although it would end up with a similar situation
as the prior version). While more and more vulnerabilities have been disclosed,
we can observe Google has been proactively producing new versions that replaced
most of the vulnerable installations promptly.

6.2   An Example Undesirable Software Management
An opposite situation happens in another software called Viber. Viber is a com-
munication app that has a desktop version. Unlike the previous case, this soft-
ware vendor does not follow up with the management of software. In fact, this
software is not shipped with its own updater. Therefore, a user will need to down-
load and install the updated version by herself manually. This is a very ineffective
way to manage software because of multiple reasons. First, most users are not
likely to check new versions of software (e.g., by visiting the software website,
etc.) with concerns about vulnerabilities. Second, even though the users may
become aware of a new version (e.g., registration and a newsletter), they may
not be capable of downloading a newer version and installing it.
    We observe Viber installed on 4 machines, and they have been consistently
executed during our observation period. Of these installations, only one machine
was updated twice until Jan 2018, which leaves the machine out-dated for more
than 2 years in which the application has been used regularly. During this time,
2 CVE have been disclosed that directly affected Viber Desktop and 4 more that
indirectly affect the Viber platform.
    Some vendors seem to improve behaviors with time, as shown in Fig. 11
for instance, Skype begins with versions not being updated and some versions
lingering on for a long time in 2017, but in 2019 turns to a desirable update
behavior where a majority of computers receive their updates in time. On the
other hand, however, Firefox, also shown in Fig. 11 maintains bad update habits
to the extent where in no time more than 10 of our sampled machines have
the same version installed. Microsoft Edge has the worst performance among
observed browsers. Edge versions maintain their dominant presence for more
than 10 months and we observe major activity from them on these machines.

7     Lessons Learned and Our Suggestions
This section summarizes what we learned from observations and analysis of the
real-world enterprise data, and we made a few suggestions for better security.
Find My Sloths: Automated Comparative Analysis 231
Fig. 11. Version history for Mozilla Firefox, Microsoft Skype, and Microsoft Edge from
top to bottom respectively.
Minimizing Update Deployment Time. One important issue in updates is
deployment time. In the end-to-end point of view, collective effort is necessary to
minimize the deployment time by multiple parties including developers, system
administrators, and end users.
Reliable Update Transitions. Given N versions (sn ∈ S = {s1 , ..., sN }), N 2
transition patterns may occur depending on current and next versions. When
there is a gap, a direct transition to the latest can ease deployment regarding
compatibility and time in subsequent updates if the update is stand-alone. If it
has to be incremental, developers should thoroughly test every transition.
Software Downgrading. We have observed a considerable number of version
downgrading in our data set. This is also in line with findings of [27] that users
partially steer away from updates due to the issues with compatibility or features.
Automated, Enforced, Silent Delivery. We observe the effectiveness of silent
delivery that the user has no interaction with the download and installation of
the update. Google Chrome shows a successful practice of silent delivery.
Retirement Plan and the End of Support Notice. Proper announcement
and communication of product support (e.g., a good example is the Ubuntu’s
LTS plan) is important to know the software’s managed period. We believe that
an automated method to query a program’s lifespan would help the user avoid
end-of-support programs.
8 Related Work
Risk Prediction and Vulnerability Assessment. RiskTeller [13] creates
computer profiles based on file appearances and the general use of the machine
and predicts each machine’s risk based on its installed software and the usage
history. RiskTeller uses external information, including VirusTotal and CVSS232 O. Setayeshfar et al.
Table 2. Comparison of FMS and related work. Cov∀: Applicable to all programs, No
D.K.: No third-party domain knowledge (e.g., VirusTotal, Symantec) required, Appli-
cability: the data can be generated from an enterprise and the method is applicable.
Name Prediction Cov∀ No D.K Data period Applicability
RiskTeller [13] Machine risk ✗ 1 year ✗ (Symantec data)
Xiao et al. [49] Vul. exploitation ✗ ✗ 1.5 years ✗ (Botnet, patches)
Sharif et al. [39] Security incident ✗ ✗ 3 months ✗ (Cellular provider)
Ovelgönne et al. [35] Infection ✗ ✗ 8 months ✗ (Symantec data)
Tiresias [40] Security event ✗ ✗ 27 days ✗ (Symantec data)
ASSERT [34] Intrusion ✗ Test data ✗ (Test data)
Liu et al. [26] Security incident ✗ 2 years ✗ (Network data sets)
Kang et al. [22] Malware infection ✗ ✗ 640 days ✗ (Symantec WINE)
RiskWriter [10] Security posture ✗ ✗ 1 year ✗ (Symantec data)
Find My Sloths Vul. program risk 3 years (General OS log)
score [15], to enable an accurate prediction. Other studies infer the risk of a
computer (or mobile device) by using user behaviors of web sessions [39], dis-
tribution of binary files on the computer, the user’s mobility between different
ISPs [35], modeling the security-related decision-making process of users [37],
and permission and internal activities of Android applications [41,50].
RiskWriter [10] and Liu et al. [26] measure the risk for an enterprise based
on its externally measurable metrics such as DNS misconfigurations. Kang et al.
[22] predict malware infection epidemics based on antivirus software telemetry
information. Another direction of risk prediction [34,40] is to predict future
security incidents based on the history of the past security-related events.
Kotzias et al. [23] studies patching landscape for the enterprise; however, the
set of programs they tracks is limited to 124 well-known server and host programs
for which they obtain hash and version information for the main executable.
Nappa et al. [33], also studied effects of patching, threats of multiple installations
of a software and the shared libraries from 10 popular programs at scale.
Unlike previous studies (Table 2), we infer update delay using only data col-
lected inside the enterprise, without relying on external information, such as
software vendors’ release notes, third party metadata of software, or known vul-
nerabilities.
Update Development. There exist works that focus on the development side
of updates that study how well developers respond to the needs for updates,
including security vulnerability disclosure [25]; or the response speed of develop-
ers to new requirements of ever-changing platforms. Code change analysis [28],
commit message analysis [28,36], vulnerability disclosure analysis [36,49], and
versioning analysis [14] techniques have been used in these studies.
Update Deployment. Software development companies often have their solu-
tions to deploy updates and patches effectively and promptly. For instance,
Microsoft’s On-Premises Update Server provides a unified interface, and it triesFind My Sloths: Automated Comparative Analysis 233 to minimize the network traffic by caching the update [20]. Google applies silent and automatic updates [17] to their products, including the Google Chrome web- browser. There exist studies [27,48] that evaluate the effectiveness of software update deployment models. They use a mix of user studies and monitoring a small set of programs to find the challenges stopping an effective update pro- cess. A recent study [21] identifies design flaws or malicious installations in the automated software deployment systems. 9 Discussion and Future Work This section discusses the limitations of our work and possible improvements. Reasons Behind Update Behaviors. In this study, we focus on identifying software update behaviors and estimating risk; however, understanding why a certain update behavior happens is a remaining challenge beyond our scope. For instance, we detect software downgrade or rollback from the lineage graph, but the reason why that decision has been made is unknown. In the future, we will conduct a comprehensive user study and a deep analysis of update management platforms to understand the reasons behind unusual update behaviors. Grouping Updates Installed in Varied Paths. The current version of FMS detects an update of software individually based on the path where the update is installed. However, we rarely observe software that installs the update in a separate path while keeping the previous versions of the binary. It then modifies a symbolic link file to point the binary to execute. Currently, we may not correctly detect such update behaviors. We plan to implement a merging mechanism to automatically find updates in separate paths to address this limitation. Updates By Library Modification. The current FMS cannot detect updates that only modify the library but not the main executable. We plan to improve FMS’s monitoring module to enable tracking library import information at run- time. Then we will track all updates to those library files. Leveraging Security Information. We plan to optionally incorporate stan- dardized security information, such as code signing, to further enhance the risk estimation in FMS for certain programs whose metadata are available. 10 Conclusion Software lifecycle management is a complex and costly process that needs the dedication of a software vendor. When it is not properly done, we find that it directly leads to risk for every software as vulnerabilities are discovered over time. We propose an automated approach to analyze the entire software updates in an organization comprehensively achieved by utilizing only observed metrics instead of relying on developers’ or third-party software release information and metadata. Our evaluations shed light on the current industry practices on how they manage software due to high coverage of update risk assessment on total
234     O. Setayeshfar et al.

113,675 programs’ 40,971 updates in 774 machines used by real people daily.
We organized our comprehensive evaluations on the current software updates
practices, which suggest a list of desired design decisions on update management
software to operate software securely.

Acknowledgment. We thank the anonymous reviewers and our shepherd, Juan
Caballero, for their helpful feedback. This material is supported, in part, by the
National Science Foundation, under grant No. OAC-1909856 and SaTC-1909856. Any
opinions, findings, and conclusions, or recommendations expressed in this material are
those of the authors and do not necessarily reflect the views of the NSF.

References
 1. APT (Advanced Package Tool). https://ubuntu.com/server/docs/package-manage-
    ment. Accessed 14 May 2021
 2. Homebrew. https://brew.sh/. Accessed 14 May 2021
 3. Linux Audit. https://people.redhat.com/sgrubb/audit/. Accessed 14 May 2021
 4. National Software Reference Library. https://www.nist.gov/software-quality-
    group/national-software-reference-library-nsrl. Accessed 14 May 2021
 5. Top 50 Vendors by Total Number of “Distinct” Vulnerabilities. https://www.
    cvedetails.com/top-50-vendors.php. Accessed 14 May 2021
 6. What Are Security Patches and Why Are They Important? https://www.
    idtheftcenter.org/Cybersecurity/what-are-security-patches-and-why-are-they-
    important.html. Accessed 20 May 2018
 7. Why Software Updates Are So Important. https://securingtomorrow.mcafee.
    com/consumer/consumer-threat-notices/software-updates-important/. Accessed
    14 May 2021
 8. Yum. http://yum.baseurl.org/. Accessed 14 May 2021
 9. Abu Odeh, M., Adkins, C., Setayeshfar, O., Doshi, P., Lee, K.H.: A novel AI-based
    methodology for identifying cyber attacks in honey pots. In: IAAI (2021)
10. Aditya, K., Grzonkowski, S., Le-Khac, N.A.: Riskwriter: predicting cyber risk of
    an enterprise. In: ICISSP (2018)
11. Ahmad, A., Saad, M., Bassiouni, M., Mohaisen, A.: Towards blockchain-driven,
    secure and transparent audit logs. CoRR (2018)
12. Apple: iTunes store. https://itunes.apple.com/us/. Accessed 14 Nov 2018
13. Bilge, L., Han, Y., Dell’Amico, M.: Riskteller: predicting the risk of cyber incidents.
    In: CCS (2017)
14. Corley, C.S., Kraft, N.A., Etzkorn, L.H., Lukins, S.K.: Recovering traceability links
    between source code and fixed bugs via patch analysis. In: TEFSE (2011)
15. Corporation, T.M.: Common vulnerabilities and exposures (cve).       R   https://cve.
    mitre.org/. Accessed 13 June 2019
16. Du, M., Li, F., Zheng, G., Srikumar, V.: DeepLog: anomaly detection and diagnosis
    from system logs through deep learning. In: CCS (2017)
17. Duebendorfer, T., Frei, S.: Web browser security update effectiveness. In: CRITIS
    (2009)
18. Duebendorfer, T., Frei, S.: Why silent updates boost security. TIK (2009)
19. Gentoo Foundation, I.: Portage. https://wiki.gentoo.org/wiki/Handbook:X86/
    Working/Portage. Accessed 14 May 2021
Find My Sloths: Automated Comparative Analysis 235
20. Gkantsidis, C., Karagiannis, T., VojnoviC, M.: Planet scale software updates. In:
CCR (2006)
21. Han, X., et al.: SIGL: securing software installations through deep graph learning.
arXiv (2020)
22. Kang, C., Park, N., Prakash, B.A., Serra, E., Subrahmanian, V.: Ensemble models
for data-driven prediction of malware infections. In: WSDM (2016)
23. Kotzias, P., Bilge, L., Vervier, P.A., Caballero, J.: Mind your own business: a
longitudinal study of threats and vulnerabilities in enterprises (2019)
24. Lee, K.H., Zhang, X., Xu, D.: High accuracy attack provenance via binary-based
execution partition. In: NDSS (2013)
25. Li, F., Paxson, V.: A large-scale empirical study of security patches. In: CCS (2017)
26. Liu, Y., et al.: Cloudy with a chance of breach: forecasting cyber security incidents.
In: USENIX Security (2015)
27. Mathur, A., Engel, J., Sobti, S., Chang, V., Chetty, M.: “They keep coming back
like zombies”: improving software updating interfaces. In: SOUPS (2016)
28. Meneely, A., Srinivasan, H., Musa, A., Tejeda, A.R., Mokary, M., Spates, B.: When
a patch goes bad: exploring the properties of vulnerability-contributing commits.
In: ESEM (2013)
29. Microsoft: About Event Tracing. https://docs.microsoft.com/en-us/windows/
win32/etw/about-event-tracing. Accessed 14 May 2021
30. Microsoft: Assemblies in .NET. https://docs.microsoft.com/en-us/dotnet/stand-
ard/assembly/#assembly-manifest. Accessed 14 May 2021
31. Microsoft: Assembly Manifest. https://docs.microsoft.com/en-us/dotnet/stand-
ard/assembly/manifest. Accessed 14 May 2021
32. Microsoft: Microsoft Store. https://www.microsoft.com/en-us/store/b/home.
Accessed 14 May 2021
33. Nappa, A., Johnson, R., Bilge, L., Caballero, J., Dumitras, T.: The attack of the
clones: a study of the impact of shared code on vulnerability patching. In: S&P
(2015)
34. Okutan, A., Yang, S.J.: ASSERT: attack synthesis and separation with entropy
redistribution towards predictive cyber defense. Cybersecurity 2, 1–8 (2019)
35. Ovelgönne, M., Dumitraş, T., Prakash, B.A., Subrahmanian, V., Wang, B.: Under-
standing the relationship between human behavior and susceptibility to cyber
attacks: a data-driven approach. TIST 8, 1–25 (2017)
36. Perl, H., et al.: VCCfinder: finding potential vulnerabilities in open-source projects
to assist code audits. In: CCS (2015)
37. Redmiles, E.M., Mazurek, M.L., Dickerson, J.P.: Dancing pigs or externalities?:
measuring the rationality of security decisions. In: EC (2018)
38. RPM: RPM package manager. https://rpm.org/. Accessed 14 May 2021
39. Sharif, M., Urakawa, J., Christin, N., Kubota, A., Yamada, A.: Predicting impend-
ing exposure to malicious content from user behavior. In: CCS (2018)
40. Shen, Y., Mariconti, E., Vervier, P.A., Stringhini, G.: Tiresias: predicting security
events through deep learning. In: CCS (2018)
41. Shrivastava, G., Kumar, P.: SensDroid: analysis for malicious activity risk of
android application. MTA 78(24), 35713–35731 (2019)
42. SUSE: Zypper. https://en.opensuse.org/Portal:Zypper. Accessed 14 May 2021
43. Symantec: Internet security threat report 2017. https://www.symantec.com/
content/dam/symantec/docs/reports/gistr22-government-report.pdf
44. Team, P.D.: Pacman. https://www.archlinux.org/pacman/. Accessed 14 May 2021236 O. Setayeshfar et al.
45. Verizon: 2015 data breach investigations report. https://iapp.org/media/pdf/
resource center/Verizon data-breach-investigation-report-2015.pdf. Accessed 14
May 2021
46. Verizon: 2017 data breach investigations report. https://www.ictsecuritymagazine.
com/wp-content/uploads/2017-Data-Breach-Investigations-Report.pdf. Accessed
14 May 2021
47. VirusTotal. https://www.virustotal.com. Accessed 14 May 2021
48. Wash, R., Rader, E., Vaniea, K., Rizor, M.: Out of the loop: how automated
software updates cause unintended security consequences. In: SOUPS (2014)
49. Xiao, C., Sarabi, A., Liu, Y., Li, B., Liu, M., Dumitras, T.: From patching delays
to infection symptoms: using risk profiles for an early discovery of vulnerabilities
exploited in the wild. In: USENIX Security (2018)
50. Xiao, J., Chen, S., He, Q., Feng, Z., Xue, X.: An android application risk evalua-
tion framework based on minimum permission set identification. JSS 163, 110533
(2020)You can also read