Belief updating in bipolar disorder predicts time of recurrence - eLife
←
→
Page content transcription
If your browser does not render page correctly, please read the page content below
RESEARCH ARTICLE

                                    Belief updating in bipolar disorder
                                    predicts time of recurrence
                                    Paolo Ossola1*, Neil Garrett2, Tali Sharot3, Carlo Marchesi1
                                    1
                                     Psychiatry Unit, Department of Medicine and Surgery, Università di Parma, Parma,
                                    Italy; 2Department of Experimental Psychology, University of Oxford, Oxford,
                                    United Kingdom; 3Affective Brain Lab, Department of Experimental Psychology,
                                    University College London, London, United Kingdom

                                    Abstract Bipolar disorder is a chronic relapsing condition in which mood episodes are
                                    interspersed with periods of wellbeing (euthymia). Shorter periods of euthymia are associated with
                                    poorer functioning, so it is crucial to identify predictors of relapse to facilitate treatment. Here, we
                                    test the hypothesis that specific valence-dependent learning patterns emerge prior to the clinical
                                    manifestation of a relapse, predicting its timing. The ability to update beliefs in response to
                                    positive and negative information was quantified in bipolar patients during euthymia, who were
                                    then monitored for 5 years. We found that reduced tendency to update beliefs in response to
                                    positive relative to negative information predicted earlier relapse. Less updating in response to
                                    positive information may generate pessimistic beliefs, which in turn can lead to more severe
                                    prodromal symptoms (e.g. sleep disturbance, irritability etc.). The results suggest that measuring
                                    valence-dependent belief updating could facilitate risk prediction in bipolar disorder.

                                    Introduction
                                    Bipolar disorder is estimated to affect approximately 3% of the general population
                                    (American Psychiatric Association, 2013). The disorder is characterized by successive periods of
*For correspondence:                elation (mania) and depression interspersed with periods of euthymia, an asymptomatic phase in
paolo.ossola@unipr.it               which patients are in clinical remission (Grande et al., 2016). Shorter periods of euthymia between
                                    relapses are associated with poorer functioning, increased odds of suicidality, disability, unemploy-
Competing interests: The
                                    ment, and hospitalization (Peters et al., 2016). A major research goal is thus to identify predictors
authors declare that no
                                    of upcoming relapse in order to facilitate timely treatment (Harrison et al., 2016). Yet, predicting
competing interests exist.
                                    relapse using existing clinical diagnostic tools or demographic information has proven largely inef-
Funding: See page 14                fective in bipolar disorder (Bukh et al., 2016; de Dios et al., 2012; Vieta et al., 2018).
Received: 13 May 2020                   Here, we test the hypothesis that prior to the clinical manifestation of a relapse patients exhibit a
Accepted: 23 October 2020           specific learning pattern from self-relevant information, which makes them more vulnerable to
Published: 10 November 2020         relapse. In particular, it has been shown that healthy individuals tend to update their beliefs to a
                                    greater extent in response to unexpected positive information (e.g. learning that the likelihood of
Reviewing editor: Shelly B
Flagel, University of Michigan,
                                    receiving a job offer is greater than expected) than negative information (e.g. learning it is lower
United States                       than expected; Kappes et al., 2020; Kuzmanovic et al., 2016; Ma et al., 2016; Moutsiana et al.,
                                    2015; Sharot et al., 2011). Such asymmetry in valence-dependent belief updating leads to optimis-
   Copyright Ossola et al. This
                                    tic beliefs (Sharot et al., 2011). This is because a person who takes in positive information to a
article is distributed under the
                                    greater extent than negative information from their experiences in the world, uses such information
terms of the Creative Commons
Attribution License, which          to update their beliefs, which eventually leads to more positive expectations.
permits unrestricted use and            In contrast, individuals with depression do not show a positivity bias in learning (Garrett et al.,
redistribution provided that the    2014; Korn et al., 2014). These patients update their beliefs less in response to positive information
original author and source are      (Korn et al., 2014) and more in response to negative information (Garrett et al., 2014), leading to
credited.                           pessimistic views that may exacerbate symptoms.

Ossola et al. eLife 2020;9:e58891. DOI: https://doi.org/10.7554/eLife.58891                                                           1 of 17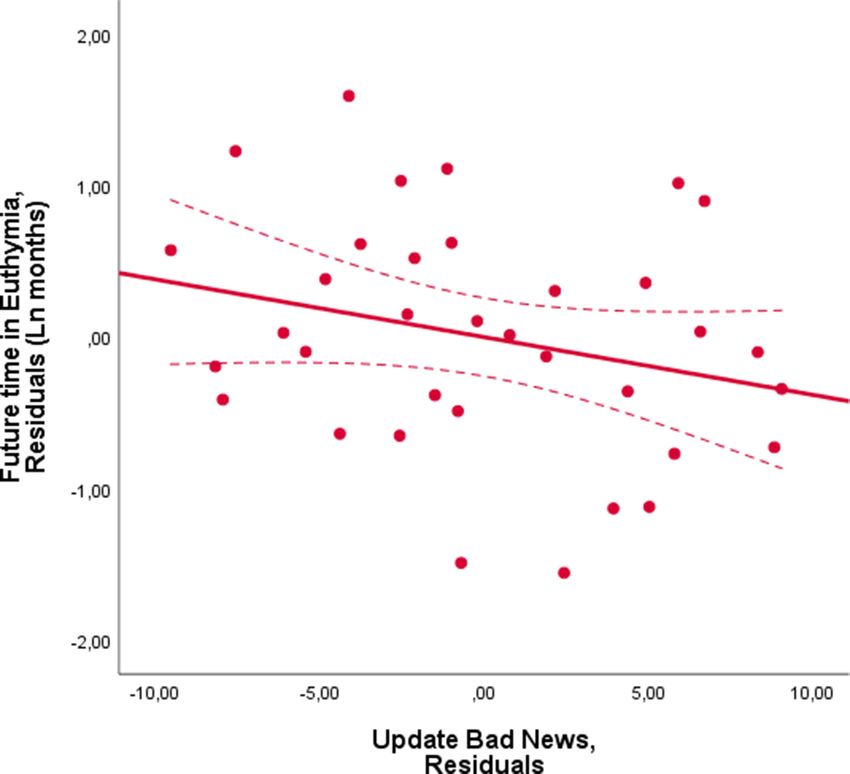
Research article                                                                                                       Neuroscience

                                        However, it is unknown whether a lack of positivity bias in learning precedes symptoms of affec-
                                    tive disorders. If it does, then measuring learning biases could facilitate early diagnosis. Indeed,
                                    there is theoretical basis to believe that reduced learning from positive information and/or enhanced
                                    learning from negative information will occur before a relapse. In particular, a reduction in learning
                                    from positive information (or enhancement in response to negative information) will cause individuals
                                    to take in less desirable information from the world around them (or more undesirable information),
                                    which over time will tip beliefs toward a pessimistic direction. Once a patient generates a negative
                                    set of beliefs, deleterious symptoms may appear such as negative mood, sleep disturbance, suicidal
                                    thoughts etc.
                                        Testing this possibility on Bipolar patients is especially compelling for three reasons. First, bipolar
                                    patients tend to relapse frequently, with a mean distance between episodes of 18 months on aver-
                                    age (Radua et al., 2017). If we were to examine how patients update their beliefs during euthymia
                                    to predict how soon they would relapse, within only a few years most patients would have likely
                                    relapsed, which would allow us to test the reliability of those predictions. Second, whilst traditional
                                    diagnostic tools that measure symptom severity has proven useful in predicting relapse in unipolar
                                    depression (Dinga et al., 2018), these are largely ineffective in bipolar disorder (Bukh et al., 2016;
                                    de Dios et al., 2012). Third, by examining bipolar patients we could test whether valence-depen-
                                    dent belief updating predicts episodes of both polarities (that is mania and depression) differently
                                    or in the same manner. On one hand, the one-dimensional model suggests that mania and depres-
                                    sion lie on opposite ends of the same mood spectrum. Hence manic or depressive symptoms arise
                                    only in the absence of the other (Bonsall et al., 2015; Bonsall et al., 2012; Chang and Chou, 2018;
                                    Daugherty et al., 2009; Eldar et al., 2018; Eldar et al., 2016; Eldar and Niv, 2015; Mason et al.,
                                    2017; Nana, 2009; Steinacher and Wright, 2013). We may thus expect that positivity bias in belief
                                    updating would predict manic episodes and vice versa for depressive episodes. Other models, how-
                                    ever, conceptualize mania and depression as independent dimensions (Bystritsky et al., 2012;
                                    Cochran et al., 2018; Goldbeter, 2013; Goldbeter, 2011; Hadaeghi et al., 2015; Huber et al.,
                                    2000; Lopez, 2008). According to these models, perturbations can trigger episodes of either polar-
                                    ity. The degree to which patients update beliefs in response to positive and negative information
                                    may reflect such perturbations (or perhaps even cause them) predicting relapse of both polarities
                                    similarly.
                                        To test whether a valence-dependent bias in belief updating, or the lack thereof, precedes
                                    relapse of bipolar episodes, we tested patients with bipolar disorder on the belief update task
                                    (Sharot et al., 2011) while they were in the euthymic stage. The patients were then followed up for
                                    5 years and their time of relapse was recorded.

                                    Results
                                    Belief update task
                                    Forty-five patients diagnosed with bipolar disorder (see Supplementary file 1 for patients’ demo-
                                    graphics and characteristics) performed the belief update task while in the euthymic phase (Figure 1).
                                    Nine patients dropped out of the study before 5 years elapsed. The rest - 36 patients - were moni-
                                    tored for symptoms approximately every 2 months for the following 5 years. The task allows quantifi-
                                    cation of belief change in response to information that is better or worse than expected. The task
                                    and analysis employed here have been used numerous times before (Chowdhury et al., 2014;
                                    Garrett et al., 2018; Garrett et al., 2014; Garrett and Sharot, 2016; Garrett and Sharot, 2014;
                                    Kappes et al., 2018; Korn et al., 2014; Kuzmanovic et al., 2016; Kuzmanovic et al., 2014;
                                    Moutsiana et al., 2013; Moutsiana et al., 2015; Sharot et al., 2012b; Sharot et al., 2012a;
                                    Sharot et al., 2011). Participants were presented with 40 adverse life events (e.g. robbery, card
                                    fraud) and asked to estimate how likely the event was to happen to them in the future (this is
                                    referred to as the first estimate). They were then presented with the base rate of the event in a
                                    demographically similar population (this is referred to as information). For each trial, an estimation
                                    error term was calculated as the difference between the probability presented (information) and par-
                                    ticipants’ first estimate on that trial. In a second session, participants were asked again to provide
                                    estimates of their likelihood of encountering the same events (this is referred to as second estimate).
                                    Trials were divided into those in which participants received good news (i.e. the probability

Ossola et al. eLife 2020;9:e58891. DOI: https://doi.org/10.7554/eLife.58891                                                             2 of 17
Research article Neuroscience
Figure 1. Belief update task. In the first session (top row), on each trial, participants were presented with a short description of an adverse life event
and asked to estimate how likely this event was to occur to them in the future. They were then presented with the probability of that event occurring to
someone from the same age, location, and socio-economic background as them. After completing 40 such trials they then completed the second
session (bottom row). This was the same as the first except that the average probability of the event to occur was not presented. Shown are examples
of trials for which the participant’s estimate was higher or lower than the statistical information provided leading to receipt of (a) good news and (b)
bad news, respectively. Update is calculated as the difference between participants estimates in the two sessions (i.e. pre- and post-information). The
blue and red boxes are here to illustrated good and bad news, and did not appear in the actual experiment.
presented of encountering an aversive event was lower than the subject’s first estimate of their own
probability; see Figure 1a) or bad news (i.e. the probability presented was higher than the subject’s
first estimate of their own probability; see Figure 1b). While information can be better or worse than
expected, all stimuli are negative life events. Thus, comparison is never between positive and nega-
tive stimuli, but between information that is better (thus subjectively positive) or worse (thus subjec-
tively negative) than expected. Different methods of dividing trials in this task has shown to yield
similar results (Garrett and Sharot, 2014), thus we used the original task design here.
Participants change in beliefs for each trial is referred to as the update and is calculated for good
news trials as the difference in participants’ first estimate and second estimates (i.e. pre- and post-
information), whereas for bad news trials as the difference between the participants’ second esti-
mate and first estimate. Thus, in both cases, positive numbers indicate a move toward the
information.
For each subject, we then separately calculated the average update for good news and bad news
trials. The difference between the two types of trials is the ‘Update Bias’, an explicit measure of
valence-dependent belief updating. Positive update bias scores indicate greater updating in
response to good news relative to bad news (this is an optimistic update bias) whilst negative scores
indicate the reverse (a pessimistic update bias).
At the end of the task, participants were asked to provide the actual probability previously pre-
sented for each event. Memory errors were calculated as the absolute difference between the prob-
ability previously presented and the participants’ recollection of that statistic. Participants also
provided a number of ratings for each event on a likert scale according to: past experience,
Ossola et al. eLife 2020;9:e58891. DOI: https://doi.org/10.7554/eLife.58891 3 of 17Research article Neuroscience
familiarity, negativity, vividness and emotional arousal (we call these ‘subjective ratings’, see
Materials and methods).
The question we address here is whether the magnitude of the bias in belief updating (Update
Bias) is associated with the patients’ prognosis. Patients were followed up for 5 years after they com-
pleted the update bias task and we logged their episode recurrence during this period. This enabled
us to calculate the duration of time spent in euthymia for each participant from when they com-
pleted the task in a euthymic phase until their next episode (‘future time in euthymia’). We then
examined if the future time in euthymia was predicted by their update bias score.
Belief update bias is associated with future duration of euthymia
We found an association between the update bias and future time in euthymia with a larger positive
update bias related to longer time in euthymia. In particular, we implemented the linear regression
with future time in euthymia as the dependent measure and update bias (our main measure of inter-
est) as the independent measure. We also added (1) prior beliefs (mean first estimate) and the differ-
ence between good news trials and bad news trials on the following measures to control for
possible confounds: (2) estimation errors (3) memory error (4) number of trials (5-6) reaction times at
the first and second estimate and (7-11) all subjective ratings (that is ratings on familiarity, prior
experience, vividness, emotional arousal and negativity) (see Materials and methods). The analysis
revealed a significant effect of belief update bias (Beta = 0.589, p=0.004, bootstrapping on 10,000
samples, 95% CI = 0.122–1.129) with a larger bias predictive of greater future time in euthymia (Fig-
ure 2, Supplementary file 2a). To test whether this effect may have been attributed to multicolli-
nearity within the model, we calculated the Variance Inflation Factor (VIF) of the update bias. This
revealed a low VIF (=1.93), which indicates that the variable does not display collinearity with the
other variables in the model. Lower first estimation (optimistic priors) was also associated with longer
future time in euthymia (Beta = 2.74, p=0.003) along with the difference in the number of good
and bad news trials (Beta = 2.02, p=0.003).
To further test the robustness of the effect we used the ‘model averaging’ approach (Freckle-
ton, 2011). This approach involves first running every single combination of models given the inde-
pendent variables. For example, running a model only with two of the variables, only three, only four
and so on. Each time with a different combination of independent variables. Our original model
included 13 variables, thus this involved running 4095 nested models. Then the betas of each vari-
able are averaged across all models, weighting them on the model’s BIC (Bayesian Information Crite-
rion) (Freckleton, 2011). This exercise revealed a significant effect of update bias in explaining time
in euthymia (weighted estimates = 0.47, 95% CI = 0.34, 0.60). Moreover, the eight best fitting mod-
els (out of 4095), according to the lowest BIC score, all included the update bias.
To test whether the update bias predicted future time in euthymia differently for manic and
depressive episodes, we added to the linear regression above the polarity of the next episode and
its interaction with the update bias as predictors. Neither the next polarity (Beta = 0.242; p=0.233)
nor the interaction were significant predictors (Beta = 0.72, p=0.803), while the update bias
remained a significant predictor (Beta = 0.490; p=0.052). This suggests that the update bias does
not predict future time in euthymia differently based on the polarity of the future episode.
Finally, we examined if the update bias predicts time in euthymia while only controlling for varia-
bles for which significant differences exists between good news trials and bad news trials, as those
differences may introduce noise that can obscure the effects of update bias if not controlled for. To
identify these variables, we tested with paired sample t-test if any of the variables in Model 1
showed significant differences between good and bad news trials. This revealed significant effects
for each subjective rating: past experience, familiarity, vividness, arousal, vividness and negativity
(vividness t(34) = 3.96, pResearch article Neuroscience
Figure 2. Larger update bias is associated with longer future time in euthymia. Larger optimistic update bias at test is associated with future time in
euthymia. The X-axis represents the residuals in predicting the update bias from all the independent variables included in the model as a control.
These are the subjects’ prior beliefs represented by their mean first estimate and the difference between good news trials and bad news trials on
estimation errors, memory error, number of trials, reaction times at the first and second estimates and all the subjective ratings. The Y-axis represents
the residuals from predicting time in euthymia (logarithmic transformed to account for skewedness) from the same independent variables, that is the
full model without the Update Bias. The dotted lines represent 95% confidence intervals.
do not remain significant in the original model once controlling for other task variables whilst the
update bias does.
Future time in euthymia is associated with greater updating in response to
good news and less updating in response to bad news
Thus far, we have shown that patients with a greater, more optimistic, update bias experienced
euthymia for longer, whilst those with a smaller bias relapsed faster. Since the update bias is a differ-
ence score (the difference between updating beliefs in response to good and bad news), the associ-
ation could be due to a variation in belief updating in response to good news, bad news or both. To
Ossola et al. eLife 2020;9:e58891. DOI: https://doi.org/10.7554/eLife.58891 5 of 17Research article Neuroscience
that end, we ran two separate linear regressions predicting future time in euthymia. These were
exactly as described above except that in one (Model 1a), update in response to good news was an
independent variable in place of update bias. In the other (Model 1b), update in response to bad
news was the independent variable in place of update bias. We found that longer future time in
euthymia was associated with greater updating from good news (Model 1a: good news
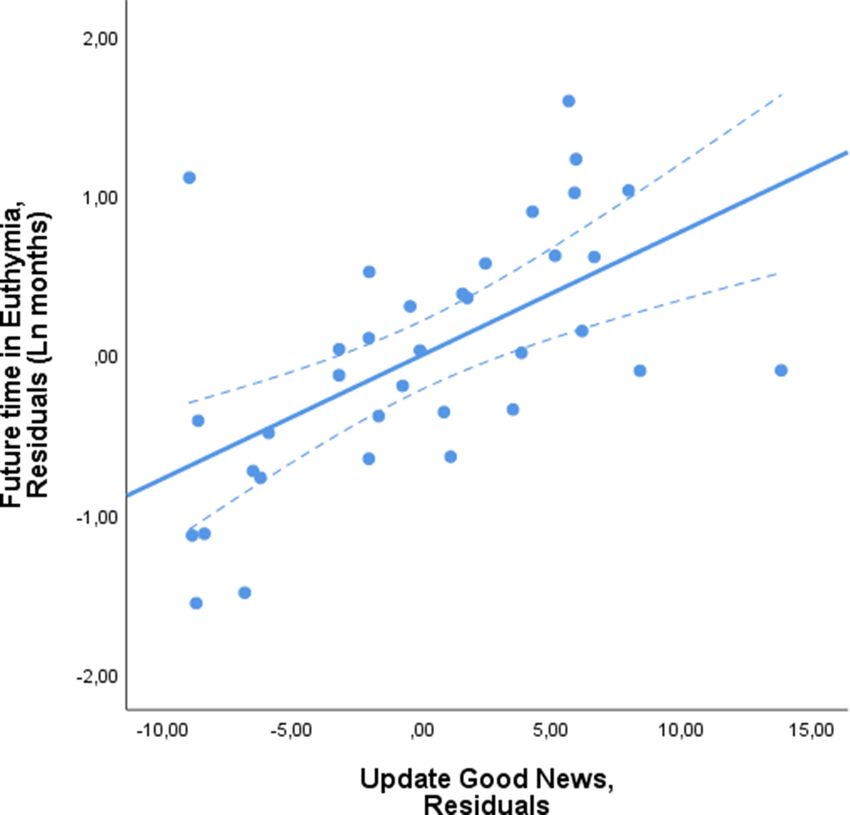
Figure 3. Future time in euthymia is related to greater belief updating in response to good news. Future time in euthymia was positively related to
updating in response to good news. The X-axis represents the residuals in predicting the Update in response to good news from all the independent
variables included in the model as a control. These are the subjects’ prior beliefs represented by their mean first estimate and the difference between
good news trials and bad news trials on estimation errors, memory error, number of trials, reaction times at the first and second estimate and all the
subjective ratings. The Y-axis represents the residuals from predicting time in euthymia (logarithmic transformed to account for skewedness) from the
same independent variables. The dotted lines represent 95% confidence intervals.
Ossola et al. eLife 2020;9:e58891. DOI: https://doi.org/10.7554/eLife.58891 6 of 17Research article Neuroscience
Beta = 0.570, p=0.002, VIF = 1.673, Figure 3, Supplementary file 2b). Updating from bad news
(Model 1b) showed a non-significant association in the opposite direction (Beta = 0.276, p=0.219,
VIF = 2.038, Figure 4, Supplementary file 2c). When including both update for good news and bad
news in the same linear regression, update for good news was again significantly associated with
future time in euthymia (Beta = 0.543, p=0.004, VIF = 1.721) whilst update from bad news was not
(Beta = 0.175; p=0.354, VIF = 2.097).
Figure 4. Future time in euthymia is related to smaller belief updating in response to bad news. Future time in euthymia showed a negative, non-
significant, association with updating in response to bad news. The X-axis represents the residuals in predicting the Update score in response to bad
news from all the independent variables included in the model as a control. These are the subjects’ prior beliefs represented by their mean first
estimate and the difference between good news trials and bad news trials on estimation errors, memory error, number of trials, reaction times at the
first and second estimate and all the subjective ratings. The Y-axis represents the residuals from predicting time in euthymia (logarithmic transformed to
account for skewedness) from the same independent variables. The dotted lines represent 95% confidence intervals.
Ossola et al. eLife 2020;9:e58891. DOI: https://doi.org/10.7554/eLife.58891 7 of 17Research article Neuroscience
Update bias is associated with future time in euthymia beyond all other
clinical indicators
To examine if traditional clinical indicators also predicted future time in euthymia, we ran the same
linear regression again (including all task controls as described above), but this time we included clin-
ical and demographic variables. Specifically: age, education, gender, bipolar type (I or II), being on
mood stabilizers (lithium, anticonvulsants), antipsychotics, antidepressants, history of psychotic
symptoms, duration of illness and Beck Depression Inventory scores (Altamura et al., 2015;
Lähteenvuo et al., 2018; Radua et al., 2017; Tundo et al., 2018).
Update Bias was again strongly related to future time spent in euthymia (Beta = 0.741, p=0.001).
The VIF score again indicated no multicollinearity between update bias and the other variables
(VIF = 2.87). Indeed, among all the independent variables included in Model 2, Update Bias was cor-
related only with the difference in memory errors between good and bad news (Supplementary file
3). Taking away that variable from the model did not change the results in Model 2 (Beta = 0.680,
p=0.001) or Model 1 (Beta = 0.544, p=0.002). The only other variable that was associated with future
time in euthymia was whether the patients were taking antidepressants such that taking antidepres-
sants was associated with a shorter time in euthymia (Beta = 0.429; p=0.040). No other clinical pre-
dictors were significant (Supplementary file 2d).
The update bias has been shown to be related to trait optimism (Sharot et al., 2011). We thus
examined if trait optimism (measured via the standard LOT-R questionnaire, Scheier et al., 1994)
was also related to time in euthymia. To that end, we added the LOT-R to Model 2 and found that
while the update bias was still related to time in euthymia (Beta = 0.740; p=0.001) LOT-R was not
(Beta = 0.208, p=0.148). This suggests that trait optimism is not a predictor of relapse while update
bias is.
As the update bias is a predictor of future time in euthymia, one may wonder whether it is also
related to number of past episodes. To test this, we examined the correlation between the two and
found no association (r = -.107; p=0.53). Moreover, adding this variable into Model 2 did not change
the results (Beta relating update bias to future time in euthymia = 0.717, p=0.005).
The above results indicate that the relationship between update bias and future time in euthymia
cannot be accounted for by demographics, clinical indicators of illness course or personality traits.
Moreover, as we always control for task variables, the effect cannot be explained by attention or
memory of the information received (as these are controlled for by adding memory in the linear
regression), or by how familiar or experienced participants were with the stimuli presented (as rat-
ings of these were included in the linear regression), nor by how negative they found the stimuli to
be (again, these ratings were included).
Leave-one-out validation
Next, we tested the predictive validity of the above model using leave one out analysis in which the
abovementioned linear regression was ran on all the data save for one participant which was held
out from the analysis. We then used the regression betas to predict relapse of the left-out partici-
pant. This process was repeated so that each participants’ time to relapse was estimated from
model parameters generated without using that participant to fit the data. Participants actual time
to relapse (data) and their predicted time to relapse (estimation) were then correlated and also com-
pared using a paired sample t-test. This analysis indicates whether the update bias is a good predic-
tor of future time in euthymia.
We found a strong correlation between the predicted future time in euthymia from our model
(estimate) and the actual future time spent in euthymia (data) (r = 0.522, p=0.001). The means of the
two sets of values were not significantly different from one another (t(34) = 0.178, p=0.859). Run-
ning the Leave one out cross-validation analysis using Model 2 but taking out the update bias vari-
able showed that the predicted values and actual values were not correlated (r = 0.129; p=0.459)
and model’s fit (SSE, sum of squared errors) was better for the model including the Update Bias
(SSE = 61.80) than the one that did not (SSE = 97.10). This suggests that the update bias is a crucial
variable in a model predicting future time in euthymia.
As Model 2 includes all clinical variables, we wanted to examine whether predictive validity would
remain high in a model in which only the task variables were included (that is, the update bias and
all task related controls) and was blind to demographics and clinical variables. This leave one out
Ossola et al. eLife 2020;9:e58891. DOI: https://doi.org/10.7554/eLife.58891 8 of 17Research article Neuroscience
analysis again showed a significant correlation between predicted future time in euthymia (estimate)
and actual future time in euthymia (data) (r = 0.454, p=0.006) with no difference between the means
of the two sets of values (t(34) = 0.127; p=0.898).
Overall, our results suggest that a greater update bias predicts a longer time in euthymia. This
held true even when controlling for clinical variables.
Discussion
Our findings show that the extent to which bipolar patients updated their beliefs in response to pos-
itive information, relative to negative information, was predictive of when they would relapse. In par-
ticular, euthymic patients who updated their beliefs to a greater extent in response to positive
information were more likely to remain in euthymia for a longer duration. In other words, biased
processing of information in a manner that supports positive outlook was linked to a more favorable
course of bipolar illness.
These results are important from a clinical perspective due to the difficulty in predicting the
course of bipolar disorder (Vieta et al., 2018). Maintenance treatment in bipolar disorder relies on
mood stabilizers and psychological programs aimed at increasing treatment compliance, educating
the patients and identifying prodromal sub-syndromic symptoms, which provide clues for an upcom-
ing episode (Oud et al., 2016; Scott et al., 2007). Despite their efficacy, these approaches are
highly dependent on the physician’s ability to identify and promptly treat symptoms as they arise, to
reduce the likelihood of full-blown episodes. Being able to predict a relapse could inform patients
and clinicians to step up vigilance to recognize prodromal symptoms and intervene where necessary.
The way patients update beliefs could be introduced in the future as a risk prediction tool for bipolar
disorder.
Importantly, our results demonstrate that the absence of an optimistic update bias precedes the
clinical manifestation of relapse. This finding is important for understanding the relationship between
valence-dependent learning and mood. While a relationship between mood and valence-dependent
learning has been previously demonstrated in depressed patients (Garrett et al., 2014; Korn et al.,
2014), it has been unclear whether a change in mood likely trigger changes in learning or whether
changes in learning likely trigger changes in mood. While our data is correlational, the temporal
order of events in our study support the latter possibility. That is, we speculate that a reduction in
learning in response to positive information relative to negative information over time, lead to a less
optimistic perspective, which eventually provides a fruitful ground for clinical affective symptoms to
manifest.
It is interesting that a reduction of a positivity bias in belief updating was predictive of both
depressive and manic episodes. The results are consistent with multistable models that suggest that
environmental or inner perturbation such as stressors could trigger either episode onset
(Cochran et al., 2018; Cochran et al., 2017). The update bias may be an indicator of the existence
of such stressors and their associated prodromal symptoms. While mood symptoms of full-blown
episode are different for depression and mania, both polarities are preceded by many of the same
subsyndromal a-specific symptoms. These symptoms, known as prodromes, represent the main ther-
apeutic target when treating recurrences (Vieta et al., 2018) and include sleep disturbances, irrita-
bility, and mood instability (Andrade-González et al., 2020). It is thus possible that a pessimistic
view triggers these common subsyndromal symptoms.
We emphasize that our task carefully controls for an individuals perception of how likely they are
to experience the aversive events by including their first estimate of these likelihoods in the model.
We also control for how often participants had experienced these events in the past and how famil-
iar they are with the events from others experiencing them. Thus, it is unlikely that the relationship
between the update bias and future time in euthymia can be explained by some measure of ‘disad-
vantage setting’ of the patients. Indeed, the association between the update bias and time in euthy-
mia was not explained by differences in memory, attention, experience with the negative life events
used as stimuli, the perceived negativity of those stimuli, familiarity with the stimuli, or patients’ ini-
tial predictions of how likely they were to experience the events in the future, as all those were con-
trolled for in our analysis. The association remained strong also when clinical measures,
demographics, and other questionnaires were controlled for, such as number of past episodes and
trait optimism. Interestingly, no clinical measures were able to predict future time in euthymia,
Ossola et al. eLife 2020;9:e58891. DOI: https://doi.org/10.7554/eLife.58891 9 of 17Research article Neuroscience
except for antidepressant medication (Hooshmand et al., 2019). Other medication, such as mood
stabilizers, did not predict time in euthymia. However, because most of the participants (83.3%)
were on mood stabilizers, it is impossible to reliably determine if indeed such medication is associ-
ated with time in euthymia and whether taking these medications affects the relationship between
task performance and time in euthymia. We also note that the sample size, although in line with the
a-priori power analysis, is relatively small for assessing those models with a large number of variables
and future studies with a larger sample will be helpful to verify the robustness of the current results.
The fact that general measures of cognitive ability such as memory errors and overall update did
not predict time in euthymia suggests that the effect is valence-specific and cannot be explained by
a general cognitive impairment, as this would have been better captured by overall update rather
than the difference in update between good news and bad news trials. However, it is possible that
other valence-dependent measures of learning, such as ones that can be quantified in a reinforce-
ment learning task (Lefebvre et al., 2017), may be good predictors of future time of euthymia. This
remains to be tested in future studies.
In sum, we found that greater belief updating in response to positive information was predictive
of how long euthymic bipolar patients will remain in euthymia. This finding could be informative for
developing tools for patient assessment. Future studies should examine whether the same measure
is predictive of the reoccurrence of other clinical disorders, most notably depression. Moreover, it
would be informative to test at-risk patients to examine if the update bias can be used as a tool for
early diagnosis of affective disorders.
Materials and methods
Participants
Patients were recruited at the Psychiatric University Clinic of Parma, a public community-based men-
tal health service, from the 31st of January 2013 to the 26th of November 2014. A psychiatrist (PO)
evaluated patients using a suitably structured socio-demographic interview to collect anamnestic
and data concerning therapy and illness course.
Sample size was based on a previous study (Korn et al., 2014), which found a negative correla-
tion between the Update Bias and BDI scores of r = 0.50 (pResearch article Neuroscience
Phobias and Personality Disorders were not considered because they are outside the study’s aim; (6)
Did not reveal substance abuse/dependence or addictive disorder in the previous three months; (7)
Did not show cognitive impairment, defined as score of less than 25 on the Mini Mental State Exami-
nation (Folstein et al., 1975).
Behavioral task
Behavioral task was adapted from our past study (Sharot et al., 2011). This task has been used
numerous times in the literature (Chowdhury et al., 2014; Garrett et al., 2018; Garrett et al.,
2014; Garrett and Sharot, 2016; Garrett and Sharot, 2014; Kappes et al., 2018; Korn et al.,
2014; Kuzmanovic et al., 2016; Kuzmanovic et al., 2014; Ma et al., 2016; Moutsiana et al., 2015;
Moutsiana et al., 2013; Sharot et al., 2012b; Sharot et al., 2012a; Sharot et al., 2011).
Stimuli
Forty short descriptions of negative life events (for example: domestic burglary, card fraud) were
presented in a random order. The original English stimuli (Sharot et al., 2011) were translated into
Italian by a native Italian speaker with English as a second language and approved by the author
according to a back-translation model. Very rare or very common events were not included; all event
probabilities lay between 10% and 70%. To ensure that the range of possible overestimation was
equal to the range of possible underestimation, participants were told that the range of probabilities
lay between 3% and 77% and were only permitted to enter estimates within this range. Participants
were randomly assigned one of three possible lists of stimuli (each list comprised a different set of
40 stimuli).
Paradigm
All subjects completed a practice session of three trials before beginning the main experiment. On
each trial, one of the 40 adverse life events were presented for 4 s. Participants were asked to esti-
mate how likely the event was to happen to them in the future. Participants had up to 6 s to
respond. If participants had already experienced an event, they were instructed to estimate the like-
lihood of that event happening to them again in the future. If the participant failed to respond, that
trial was excluded from all subsequent analyses (mean trials with missing response = 4.73, s.
d. = 4.03). Following presentation of a fixation cross, participants were presented with the probabil-
ity of an event occurring in a demographically similar population for 2 s followed by a fixation cross.
In a second session, immediately after the first, participants were asked again to provide estimates
of their likelihood of encountering the same events so that we could assess how they updated their
estimate in response to the information presented. Probabilities of the events occurring were not
provided in this second session (Figure 1). After the task participants completed the Beck Depres-
sion Inventory (BDI-II) (Beck et al., 1996) and the Revised Life Orientation Test (LOT-R) to evaluate
patients’ trait optimism (Scheier et al., 1994).
Memory control
To control for memory effects, participants were asked at the end of the experiment to provide the
actual probability previously presented for each event. Memory errors were calculated as the abso-
lute difference between the probability previously presented and the participants’ recollection of
that statistic:
Memory Error ¼ jProbability Presented Recollection of Probability Presentedj
Other controls
Following previous studies papers adopting the same task in clinically depressed participants
(Garrett et al., 2014; Korn et al., 2014) after completing the task, participants also rated all stimuli
on familiarity [for the question ‘‘Regardless if this event has happened to you before, how familiar
do you feel it is to you from TV, friends, movies, and so on?’’ the responses ranged from 1 (not at all
familiar) to 6 (very familiar)], prior experience [for the question ‘‘Has this event happened to you
before?’’ the responses ranged from 1 (never) to 6 (very often)], vividness [for the question ‘How viv-
idly could you imagine this event?’ (1, not at all vivid, to 6, very vividly)], emotional arousal [for the
question ‘When you imagine this event, how emotionally arousing do you find the image in your
Ossola et al. eLife 2020;9:e58891. DOI: https://doi.org/10.7554/eLife.58891 11 of 17Research article Neuroscience
mind?’ (1, not at all arousing, to 6, very arousing)] and negativity [for the question ‘‘How negative
would this event be for you?’’ the responses ranged from 1 (not negative at all) to 6 (very negative)].
One subject interrupted the experiment during the last part when memory and other control vari-
ables were being registered resulting in missing values for these parameters.
Statistical analysis
Trials were partitioned into either ‘good news’ or ‘bad news’ according to participants’ first esti-
mates. A trial was defined as good news when the probability presented was lower than the first
estimate of their own probability (Figure 1a). Similarly, when the probability presented was higher,
the trial was classified as bad news (Figure 1b). Trials for which first estimates were equal to the
information provided were excluded from subsequent analyses, as these could not be categorized
into either condition.
Update was calculated for each trial such that positive updates indicated a change towards the
probability presented and negative updates a change away from the probability presented:
Update ðGoodNewsÞ ¼ First Estimate Second Estimate
Update ðBad NewsÞ ¼ Second Estimate First Estimate
We then computed the average update for good and bad news separately for each participant,
as done previously (Chowdhury et al., 2014; Garrett et al., 2018; Garrett et al., 2014;
Garrett and Sharot, 2014; Kappes et al., 2018; Korn et al., 2014; Kuzmanovic et al., 2016;
Kuzmanovic et al., 2014; Moutsiana et al., 2015; Moutsiana et al., 2013; Sharot et al., 2012a;
Sharot et al., 2012b; Sharot et al., 2011). A participant’s update bias was then computed as the
signed difference between these two scores:
Update Bias ¼ Average Update ðGood NewsÞ Average Update ðBad NewsÞ
A score of 0 indicates no bias in updating in either direction; positive scores indicate an optimistic
bias in updating such that participants change their beliefs to a greater degree for good news rela-
tive to bad news. Negative scores indicate a pessimistic bias in updating such that participants
change their beliefs to a greater degree for bad news relative to good news.
This bias can be seen both when trials are classified according to the participants’ estimate of
base rate or self-risk (Garrett and Sharot, 2014; Kuzmanovic et al., 2014). Similarly, this bias is not
affected by the estimate being either the likelihood of the event happening or not happening to
them (Garrett et al., 2014; Garrett and Sharot, 2014; Sharot et al., 2011). Hence, here we use the
classic approach in which we elicited the estimation of an event happening to them.
We also computed the differences between good and bad trials on all the other task related vari-
ables, that were included as covariates in all the following models.
DðXÞ ¼ Average Xgood news Average Xbad news
This deltas resulted in a set of new variables named D estimation error, D memory errors, D num-
ber of trials, D reaction times at the first and second estimate, D familiarity, D prior experience, D viv-
idness, D emotional arousal and D negativity.
Future time in euthymia
For each subject, we calculated the time in months they spent in euthymia following task completion
until the onset of the next episode up to 5 years. For those who did not relapse during the follow-
up, time in euthymia was set to 60 months (n = 6).
Bipolar disorder is a recurrent disorder with a mean distance between episodes of approximately
1.5 years with half of the patients relapsing in the following year (Radua et al., 2017). As future time
in euthymia was not normally distributed (Skewness = 1.362; Kolmogorov-Smirnov normality
test = 0.301, p0.05).
Ossola et al. eLife 2020;9:e58891. DOI: https://doi.org/10.7554/eLife.58891 12 of 17Research article Neuroscience
Update bias and future time in euthymia
We conducted a linear regression with future time in euthymia as the dependent variable and
update bias as our predictor of interest. To control for possible confounds, we also added as inde-
pendent variables the mean first estimate and the difference between good news trials and bad
news trials on the following measures: estimation errors, memory error, number of trials, reaction
times at the first and second estimate and the subjective ratings on familiarity, prior experience, viv-
idness, emotional arousal and negativity. We also ran this regression with bootstrapping in SPSS
(10,000 runs with replacement).
Model 1
Log (Future time in euthymia)=b0 + b1* update bias + b2* mean first estimate + b3* D estimation
error + b4* D memory errors + b5* D number of trials + b6* RT first estimate + b7* RT second esti-
mate + b8* D familiarity +b9* prior experience +b10* D vividness + b11*D emotional arousal + b12*
D negativity + error.
D (delta) refers to the difference in each parameter between good and bad news trials.
The same linear regression was run two more times substituting the update bias with the update
in response to good news and the update in response to bad news. To visualize the effect of each of
these (see Figures 2, 3 and 4), we generated scatterplots of the residuals of the dependent variable
(logarithmic transformation of the future time in euthymia in months to account for skewness) and of
the independent variable of interest (update bias, update from good news, update from bad news
respectively), this accounts for the other control variables.
Because it is possible that the update bias predicts future time in euthymia differently for manic
and depressive episodes, we added to the linear regression above the polarity of the next episode
and its interaction with the update bias as predictors. Six subjects did not relapse during the follow-
up period, hence this multiple linear regression was run on 30 subjects only. For this analysis, next
episode polarity was coded as 1 for depressive episodes and one for manic episodes.
To test the strength of this model, we ran model averaging (Freckleton, 2011). Model averaging
tests whether the effect of the update bias was contingent on entering a specific set of variables in
the model (Fletcher, 2018). This approach involves running every single combination of models
given the independent variables. For example, a multiple linear regression with three predictors (a,
b, c) will results in seven different models: three with one predictor each (a, b, and c), three with the
possible combination of two predictors (a + b, a + c, and b + c) and one full model with the three
predictors (a + b + c). The betas of each predictor are then averaged across all models, weighting
them on the model’s BIC (Bayesian Information Criterion). Moreover, the nested models can be
ordered according their BIC score, where a lower BIC corresponds to a better fit. This allows to eval-
uate which independent variables are most relevant for the full model.
Because difference between good news trials and bad news trials in task-related variables and
subjective ratings might introduce noise when evaluating the association between the update bias
and the time in euthymia we controlled for those in a multiple linear regression. To identify these
variables, we tested if any of the variables included in Model 1 showed significant differences
between good and bad news trials using a paired sample t-test (e.g. compared memory error scores
for good news versus memory error scores for bad news, vividness ratings for good news versus bad
news, and so on for all variables in Model 1). We then ran a linear regression with future time in
euthymia as the dependent measure and update bias (our main measure of interest) as the indepen-
dent measure controlling only for the measures that returned a significant results from the above set
of tests.
To control for all demographic and clinical variables, we then ran a second linear regression with
the following controls: age, education, gender, bipolar type (I or II), in-range plasmatic dosage of
mood stabilizer (lithium, valproate, lamotrigine and carbamazepine), antipsychotics or antidepres-
sant prescription, history of psychotic symptoms, duration of illness, and the BDI-II scores.
Model 2
Log (Future time in euthymia)=b0 + b1* update bias + b2* mean first estimate + b3* D estimation
error + b4* D memory errors + b5* D number of trials + b6* RT first estimate + b7* RT second esti-
mate + b8* D familiarity + b9* prior experience + b10* D vividness + b11* D emotional arousal +
Ossola et al. eLife 2020;9:e58891. DOI: https://doi.org/10.7554/eLife.58891 13 of 17Research article Neuroscience
b12* D negativity + b13* age + b14* years of education + b15* gender + b16* bipolar type + b17*
depressive symptoms at BDI-II + b18* mood stabilizers + b19* antidepressants + b20* antipsy-
chotics + b21* lithium + b22* history of psychotic symptoms + b23* duration of illness + error.
D (delta) refers to the difference in each parameter between good and bad news trials; gender
coded as 0 = male, 1 = female; mood stabilizers, antidepressants, antipsychotics, lithium and history
of psychotic symptoms coded as 0 = no, 1 = yes.
To test for multicollinearity, using the SPSS collinearity diagnostics we calculated the Variance
Inflation Factor (VIF) for our variable of interest. The VIF quantifies the amount of multicollinearity in
a set of regression variables. It is equal to the ratio of the overall model variance to the variance of a
model that includes only that single independent variable. A high VIF indicates that the independent
variable is highly collinear with the other variables in the model. A low VIF (less than 4) indicated it is
not.
Leave-one-out validation
Next, we tested the robustness of the Model 2 using leave one out cross validation. Model 2 was
rerun on all data except for one subject. The regression betas are then used to predict the relapse
of that left out participant. This process was repeated for each participant so that the leave-one-out
reiteration resulted in two values for time in euthymia for each subject: the actual time in euthymia
(data) and the predicted value (estimate). We then ran a Pearson correlation between the two values
as well as compared them using a t-test.
Finally, we performed the same leave one out analysis as above but this time without including
the Update Bias. A non-significant correlation between the actual and predicted values of this new
model without the update bias would suggest a key-role of our variable of interest in predicting
time in euthymia.
Additional information
Funding
Funder Grant reference number Author
Ministry of Education, Univer- D.R.LXXXIII-887-21/05/2014 Paolo Ossola
sity and Research
Wellcome Trust Senior Research Fellowship Tali Sharot
214268/Z/18/Z
Sir Henry Wellcome Postdoc- 209108/Z/17/Z Neil Garrett
toral Fellowship
The funders had no role in study design, data collection and interpretation, or the
decision to submit the work for publication.
Author contributions
Paolo Ossola, Conceptualization, Resources, Data curation, Formal analysis, Investigation, Methodol-
ogy, Writing - original draft, Project administration; Neil Garrett, Conceptualization, Data curation,
Software, Formal analysis, Methodology, Writing - review and editing; Tali Sharot, Conceptualiza-
tion, Supervision, Validation, Methodology, Writing - original draft, Writing - review and editing;
Carlo Marchesi, Conceptualization, Resources, Data curation, Supervision, Funding acquisition,
Methodology, Project administration, Writing - review and editing
Author ORCIDs
Paolo Ossola https://orcid.org/0000-0002-0644-3158
Tali Sharot http://orcid.org/0000-0002-8384-6292
Ethics
Human subjects: All participants gave informed consent prior to testing. The local ethics committee
(Comitato Etico per Parma) approved the study protocol (protocol number 45411 approved the 7th
of December 2012) and the study has been conducted in accordance with the Helsinki Declaration.
Ossola et al. eLife 2020;9:e58891. DOI: https://doi.org/10.7554/eLife.58891 14 of 17Research article Neuroscience
Decision letter and Author response
Decision letter https://doi.org/10.7554/eLife.58891.sa1
Author response https://doi.org/10.7554/eLife.58891.sa2
Additional files
Supplementary files
. Supplementary file 1. Sample descriptive (a) and task-related variables (b).
.Supplementary file 2. Regression coefficients for Model 1 when the predictor of interest are the
update bias (a), update from good news (b) and update from bad news (c), and for Model 2 (d).
. Supplementary file 3. Correlations among the independent variables included in the Models.
. Transparent reporting form
Data availability
All data generated and analysed during this study are included in the manuscript and supporting
files. Specifically the complete dataset is available on Mendeley Data.
The following dataset was generated:
Database and
Author(s) Year Dataset title Dataset URL Identifier
Ossola P 2020 Belief Updating in Euthymic Bipolar https://doi.org/10.17632/ Mendeley Data, 10.
Disorder crp8k3dgj5.2 17632/crp8k3dgj5.2
References
Altamura AC, Buoli M, Caldiroli A, Caron L, Cumerlato Melter C, Dobrea C, Cigliobianco M, Zanelli Quarantini F.
2015. Misdiagnosis, duration of untreated illness (DUI) and outcome in bipolar patients with psychotic
symptoms: a naturalistic study. Journal of Affective Disorders 182:70–75. DOI: https://doi.org/10.1016/j.jad.
2015.04.024, PMID: 25978716
American Psychiatric Association. 2013. Diagnostic and Statistical Manual of Mental Disorders (DSM-5)
Washington, DC, United States:: American Psychiatric Association.
Andrade-González N, Álvarez-Cadenas L, Saiz-Ruiz J, Lahera G. 2020. Initial and relapse prodromes in adult
patients with episodes of bipolar disorder: a systematic review. European Psychiatry 63:e12. DOI: https://doi.
org/10.1192/j.eurpsy.2019.18, PMID: 32093795
Beck AT, Steer RA, Brown GK. 1996. Beck depression inventory-II. APA PsycTests 78:490–498. DOI: https://doi.
org/10.1037/t00742-000
Bonsall MB, Wallace-Hadrill SMA, Geddes JR, Goodwin GM, Holmes EA. 2012. Nonlinear time-series
approaches in characterizing mood stability and mood instability in bipolar disorder. Proceedings of the Royal
Society B: Biological Sciences 279:916–924. DOI: https://doi.org/10.1098/rspb.2011.1246
Bonsall MB, Geddes JR, Goodwin GM, Holmes EA. 2015. Bipolar disorder dynamics: affective instabilities,
relaxation oscillations and noise. Journal of the Royal Society Interface 12:20150670. DOI: https://doi.org/10.
1098/rsif.2015.0670
Bukh JD, Andersen PK, Kessing LV. 2016. Rates and predictors of remission, recurrence and conversion to
bipolar disorder after the first lifetime episode of depression–a prospective 5-year follow-up study.
Psychological Medicine 46:1151–1161. DOI: https://doi.org/10.1017/S0033291715002676, PMID: 26743873
Bystritsky A, Nierenberg AA, Feusner JD, Rabinovich M. 2012. Computational non-linear dynamical psychiatry: a
new methodological paradigm for diagnosis and course of illness. Journal of Psychiatric Research 46:428–435.
DOI: https://doi.org/10.1016/j.jpsychires.2011.10.013, PMID: 22261550
Chang S-S, Chou T. 2018. A dynamical bifurcation model of bipolar disorder based on learned expectation and
asymmetry in mood sensitivity. Computational Psychiatry 2:205–222. DOI: https://doi.org/10.1162/cpsy_a_
00021
Chowdhury R, Sharot T, Wolfe T, Düzel E, Dolan RJ. 2014. Optimistic update Bias increases in older age.
Psychological Medicine 44:2003–2012. DOI: https://doi.org/10.1017/S0033291713002602, PMID: 24180676
Cochran AL, Schultz A, McInnis MG, Forger DB. 2017. A Comparison of Mathematical Models of Mood in
Bipolar Disorder, In: Computational Neurology and Psychiatry. Springer. DOI: https://doi.org/10.1007/978-3-
319-49959-8_11
Cochran AL, Schultz A, McInnis MG, Forger DB. 2018. Testing frameworks for personalizing bipolar disorder.
Translational Psychiatry 8:4. DOI: https://doi.org/10.1038/s41398-017-0084-4, PMID: 29391394
Ossola et al. eLife 2020;9:e58891. DOI: https://doi.org/10.7554/eLife.58891 15 of 17Research article Neuroscience
Daugherty D, Roque-Urrea T, Urrea-Roque J, Troyer J, Wirkus S, Porter MA. 2009. Mathematical models of
bipolar disorder. Communications in Nonlinear Science and Numerical Simulation 14:2897–2908. DOI: https://
doi.org/10.1016/j.cnsns.2008.10.027
de Dios C, González-Pinto A, Montes JM, Goikolea JM, Saiz-Ruiz J, Prieto E, Vieta E. 2012. Predictors of
recurrence in bipolar disorders in Spain (PREBIS study data). Journal of Affective Disorders 141:406–414.
DOI: https://doi.org/10.1016/j.jad.2012.03.009, PMID: 22608052
Dinga R, Marquand AF, Veltman DJ, Beekman ATF, Schoevers RA, van Hemert AM, Penninx B, Schmaal L. 2018.
Predicting the naturalistic course of depression from a wide range of clinical, psychological, and biological
data: a machine learning approach. Translational Psychiatry 8:241. DOI: https://doi.org/10.1038/s41398-018-
0289-1, PMID: 30397196
Eldar E, Rutledge RB, Dolan RJ, Niv Y. 2016. Mood as representation of momentum. Trends in Cognitive
Sciences 20:15–24. DOI: https://doi.org/10.1016/j.tics.2015.07.010, PMID: 26545853
Eldar E, Roth C, Dayan P, Dolan RJ. 2018. Decodability of reward learning signals predicts mood fluctuations.
Current Biology 28:1433–1439. DOI: https://doi.org/10.1016/j.cub.2018.03.038, PMID: 29706512
Eldar E, Niv Y. 2015. Interaction between emotional state and learning underlies mood instability. Nature
Communications 6:6149. DOI: https://doi.org/10.1038/ncomms7149, PMID: 25608088
Faul F, Erdfelder E, Lang AG, Buchner A. 2007. G*power 3: a flexible statistical power analysis program for the
social, behavioral, and biomedical sciences. Behavior Research Methods 39:175–191. DOI: https://doi.org/10.
3758/BF03193146, PMID: 17695343
First MB, Spitzer RL, Gibbon M, Williams JBW. 2002. Structured Clinical Interview for DSM-IV-TR Axis I
Disorders, Patient Edition (SCID-I/P), New York: Biometrics Research: Psychiatric Institute.
Fletcher D. 2018. Why Model Averaging?, In: Model Averaging. Springer. DOI: https://doi.org/10.1007/978-3-
662-58541-2_1
Folstein MF, Folstein SE, McHugh PR. 1975. "Mini-mental state". A practical method for grading the cognitive
state of patients for the clinician. Journal of Psychiatric Research 12:189–198. DOI: https://doi.org/10.1016/
0022-3956(75)90026-6, PMID: 1202204
Freckleton RP. 2011. Dealing with collinearity in behavioural and ecological data: model averaging and the
problems of measurement error. Behavioral Ecology and Sociobiology 65:91–101. DOI: https://doi.org/10.
1007/s00265-010-1045-6
Garrett N, Sharot T, Faulkner P, Korn CW, Roiser JP, Dolan RJ. 2014. Losing the rose tinted glasses: neural
substrates of unbiased belief updating in depression. Frontiers in Human Neuroscience 8:639. DOI: https://doi.
org/10.3389/fnhum.2014.00639, PMID: 25221492
Garrett N, González-Garzón AM, Foulkes L, Levita L, Sharot T. 2018. Updating beliefs under perceived threat.
The Journal of Neuroscience 38:7901–7911. DOI: https://doi.org/10.1523/JNEUROSCI.0716-18.2018,
PMID: 30082420
Garrett N, Sharot T. 2014. How robust is the optimistic update Bias for estimating self-risk and population base
rates? PLOS ONE 9:e98848. DOI: https://doi.org/10.1371/journal.pone.0098848, PMID: 24914643
Garrett N, Sharot T. 2016. Optimistic update Bias holds firm: three tests of robustness following shah et al.
Consciousness and Cognition 50:12–22. DOI: https://doi.org/10.1016/j.concog.2016.10.013, PMID: 27836628
Goldbeter A. 2011. A model for the dynamics of bipolar disorders. Progress in Biophysics and Molecular Biology
105:119–127. DOI: https://doi.org/10.1016/j.pbiomolbio.2010.11.007, PMID: 21115030
Goldbeter A. 2013. Origin of Cyclicity in Bipolar Disorders: A Computational Approach. Pharmacopsychiatry 46:
S44–S52 . DOI: https://doi.org/10.1055/s-0033-1341502
Grande I, Berk M, Birmaher B, Vieta E. 2016. Bipolar disorder. The Lancet 387:1561–1572. DOI: https://doi.org/
10.1016/S0140-6736(15)00241-X
Hadaeghi F, Hashemi Golpayegani MR, Murray G. 2015. Towards a complex system understanding of bipolar
disorder: a map based model of a complex winnerless competition. Journal of Theoretical Biology 376:74–81.
DOI: https://doi.org/10.1016/j.jtbi.2015.02.020, PMID: 25728789
Harrison PJ, Cipriani A, Harmer CJ, Nobre AC, Saunders K, Goodwin GM, Geddes JR. 2016. Innovative
approaches to bipolar disorder and its treatment. Annals of the New York Academy of Sciences 1366:76–89.
DOI: https://doi.org/10.1111/nyas.13048, PMID: 27111134
Hooshmand F, Do D, Shah S, Gershon A, Park DY, Yuen LD, Dell’Osso B, Wang PW, Miller S, Ketter TA. 2019.
Antidepressants have complex associations with longitudinal depressive burden in bipolar disorder. Journal of
Affective Disorders 246:836–842. DOI: https://doi.org/10.1016/j.jad.2018.12.074, PMID: 30795488
Huber MT, Krieg J-C, Braun HA, Pei X, Neiman A, Moss F. 2000. Noisy precursors of bifurcations in a
neurodynamical model for disease states of mood disorders. Neurocomputing 32-33:823–831. DOI: https://
doi.org/10.1016/S0925-2312(00)00250-2
Kappes A, Faber NS, Kahane G, Savulescu J, Crockett MJ. 2018. Concern for others leads to vicarious optimism.
Psychological Science 29:379–389. DOI: https://doi.org/10.1177/0956797617737129, PMID: 29381448
Kappes A, Harvey AH, Lohrenz T, Montague PR, Sharot T. 2020. Confirmation bias in the utilization of others’
opinion strength. Nature Neuroscience 23:130–137 . DOI: https://doi.org/10.1038/s41593-019-0549-2
Korn CW, Sharot T, Walter H, Heekeren HR, Dolan RJ. 2014. Depression is related to an absence of optimistically
biased belief updating about future life events. Psychological Medicine 44:579–592 . DOI: https://doi.org/10.
1017/S0033291713001074
Kuzmanovic B, Jefferson A, Vogeley K. 2014. Self-specific optimism Bias in belief updating is associated with
high trait optimism. Journal of Behavioral Decision Making 293:281–293. DOI: https://doi.org/10.1002/bdm.
1849
Ossola et al. eLife 2020;9:e58891. DOI: https://doi.org/10.7554/eLife.58891 16 of 17You can also read