Article - American Meteorological ...
←
→
Page content transcription
If your browser does not render page correctly, please read the page content below
Article
The Global Land Surface Satellite (GLASS)
Product Suite
Shunlin Liang, Jie Cheng, Kun Jia, Bo Jiang, Qiang Liu, Zhiqiang Xiao,
Yunjun Yao, Wenping Yuan, Xiaotong Zhang, Xiang Zhao, and Ji Zhou

                                ABSTRACT: The Global Land Surface Satellite (GLASS) product suite currently contains 12 products,
                                including leaf area index, fraction of absorbed photosynthetically active radiation, fraction of
                                green vegetation coverage, gross primary production, broadband albedo, broadband longwave
                                emissivity, downward shortwave radiation and photosynthetically active radiation, land surface
                                temperature, downward and upwelling thermal radiation, all-wave net radiation, and evapotrans-
                                piration. These products are generated from the Advanced Very High Resolution Radiometer and
                                Moderate Resolution Imaging Spectroradiometer satellite data. Their unique features include
                                long-term temporal coverage (many from 1981 to the present), high spatial resolutions of the
                                surface radiation products (1 km and 0.05°), spatial continuities without missing pixels, and high
                                quality and accuracy based on extensive validation using in situ measurements and intercompari-
                                sons with other existing satellite products. Moreover, the GLASS products are based on robust
                                algorithms that have been published in peer-reviewed literature. Herein, we provide an overview
                                of the algorithm development, product characteristics, and some preliminary applications of
                                these products. We also describe the next steps, such as improving the existing GLASS products,
                                generating more climate data records (CDRs), broadening product dissemination, and fostering
                                their wider utilization. The GLASS products are freely available to the public.

                                KEYWORDS: Atmosphere-land interaction; Carbon cycle; Energy budget/balance; Radiative fluxes;
                                Remote sensing; Satellite observations

https://doi.org/10.1175/BAMS-D-18-0341.1
Corresponding author: Shunlin Liang, sliang@umd.edu
In final form 9 September 2020
©2021 American Meteorological Society
For information regarding reuse of this content and general copyright information, consult the AMS Copyright Policy.

                AMERICAN METEOROLOGICAL SOCIETY
                                                                                                                   Unauthenticated     021    E323
                                                                                                                      F E B R UA RY| 2Downloaded 04/05/21 05:52 AM UTC
AFFILIATIONS: Liang—Department of Geographical Sciences, University of Maryland, College Park,
College Park, Maryland; Cheng,* Jia,* Jiang,* Xiao,* Yao,* Zhang,* and Zhao*—State Key Laboratory
of Remote Sensing Science, and Beijing Engineering Research Center for Global Land Remote Sensing
Products, and Institute of Remote Sensing Science and Engineering, Faculty of Geographical Sciences,
Beijing Normal University, Beijing, China; Liu*—State Key Laboratory of Remote Sensing Science, and
Beijing Engineering Research Center for Global Land Remote Sensing Products, and College of Global
Change and Earth System Science, Beijing Normal University, Beijing, China; Yuan*—School of Atmo-
spheric Sciences, Sun Yat-sen University, Guangzhou, Guangdong, China; Zhou*—School of Resources
and Environment, Center for Information Geoscience, University of Electronic Science and Technology
of China, Chengdu, China
* Joint second coauthors, equally contributed to this paper.
T
he world is currently confronted with historically unprecedented environmental
challenges, particularly those related to climate change. To better understand, monitor,
and predict those changes, researchers need access to high-quality satellite products of
different bio- and geophysical variables. Though several international space agencies produce
high-level land products from different satellite observations, a major limitation of these
products is their short temporal coverages, due to the fact that they are usually generated
from observations made by a specific satellite sensor that has a limited life span. The remote
sensing community has started to use the satellite data to generate climate data records (CDRs)
of the essential climate variables (ECVs) defined by the Global Climate Observing System
(GCOS; GCOS 2016), where CDRs are defined as time series of measurements with sufficient
length, consistency, and continuity to determine climate variability and changes [National
Research Council (NRC); NRC 2004]. However, not many land CDRs are currently available
to the public, and more efforts to produce these land CDRs are critically needed.
Production of the Global Land Surface Satellite (GLASS) product suite began in 2009 with
five initial products (Liang et al. 2013a,b), and continued development has led to more than
a dozen products with improved accuracies and qualities over previous versions of the same
products as well as other comparable products. Currently, 12 of these products are officially
released. The GLASS products are primarily based on NASA’s Advanced Very High Resolu-
tion Radiometer (AVHRR) long-term data record (LTDR) (https://ltdr.modaps.eosdis.nasa.gov) and
Moderate Resolution Imaging Spectroradiometer (MODIS) data, in conjunction with other
satellite data and ancillary information.
The characteristics of the 12 GLASS products (version 4), several of which correspond to
ECVs, are outlined in Table 1. Compared to other existing satellite products, the GLASS prod-
ucts have several unique features: 1) the new products are not available from other sources
(e.g., longwave broadband emissivity from both AVHRR and MODIS; downward longwave
radiation from MODIS); 2) long-term time series data (many products span from 1981 to the
present); 3) high spatial resolutions of the surface radiation products (1 km or 0.05°), which
are much finer than other commonly used products (≥100 km), such as the gridded Clouds
and the Earth’s Radiant Energy System (CERES) products (1°) and the Global Energy and Water
Exchanges (GEWEX) surface radiation budget (SRB) products (280 km); 4) spatial continu-
ities with no data gaps; and 5) higher accuracies and temporal consistencies based on direct
validation using in situ measurements and product intercomparisons.
Algorithm development is critical for generating satellite products. The algorithms for the
current version of the GLASS products are provided in each of the following sections, and
additional details regarding comparisons with other algorithms can be found in a recent book
(Liang and Wang 2019).
AMERICAN METEOROLOGICAL SOCIETY
Unauthenticated 021 E324
F E B R UA RY| 2Downloaded 04/05/21 05:52 AM UTCTable 1. Characteristics of the GLASS products (version 4). Products 1, 2, 7, 8, 9 and 11 correspond to the essential climate
variables (ECV). Both shortwave net radiation, which can be calculated by products 2 and 5, and longwave net radiation,
which can be calculated by products 3, 7 and 8, are also ECVs.
No. Product Temporal range Temporal resolution Spatial resolution
1 Leaf area index 1981–2018 8 days 0.05° from AVHRR, 500 m from MODIS
2 Broadband albedo 1981–2018 8 days 0.05° from AVHRR, 1 km from MODIS
3 Broadband emissivity 1981–2018 8 days 0.05° from AVHRR, 1 km from MODIS
4 Photosynthetically active radiation 2000–2018 Daily 0.05°
5 Downward shortwave radiation 2000–2018 Daytime/daily 0.05°
6 Downward longwave radiation 2000–2018 Instantaneous 1 km
7 All-wave net radiation 2000–2018 Daily 0.05°
8 Land surface temperature 1981–2000 Instantaneous 0.05°
9 Fraction absorbed photosynthetically active radiation 1981–2018 8 days 0.05° from AVHRR, 500 m from MODIS
10 Fractional vegetation cover 1981–2018 8 days 0.05° from AVHRR, 500 m from MODIS
11 Evapotranspiration 1981–2018 8 days 0.05° from AVHRR, 1 km from MODIS
12 Gross primary production 1981–2018 8 days 0.05° from AVHRR, 500 m from MODIS
The GLASS products have recently been used for different applications. To facilitate more
extensive utilization of these products by the broader community, this paper provides an
overview of the GLASS products’ characteristics, inversion algorithms, validation results and
some preliminary applications. Ongoing activities focused on expanding and enhancing the
GLASS products are also described.
Algorithm development, product characteristics, and applications
LAI. Conceptually, there are both true leaf area index (LAI) and effective LAI. True
LAI is defined as half of the total green leaf area per unit of horizontal ground surface
area, while the effective LAI is the true LAI multiplied by the clumping index that
quantifies the level of foliage grouping within distinct canopy structures relative to a
random distribution (He et al. 2012). True LAI has been widely used by most models
(Myneni et al. 2002).
The GLASS LAI product represents the true LAI that is generated using general regression
neural networks (GRNNs) that are trained using the integrated satellite LAI time series and
the MODIS surface reflectance data (Xiao et al. 2014) or the AVHRR surface reflectance data
(Xiao et al. 2016c). The LAI time series integrates the MODIS (Myneni et al. 2002) and the Carbon
Cycle and Change in Land Observational Products from an Ensemble of Satellites (CYCLOPES)
(Baret et al. 2007) LAI products. Unlike existing neural network methods that use only satellite
data acquired at a specific time to retrieve the LAI, the GLASS LAI algorithm uses preprocessed
reflectance data from an entire year to train the GRNNs and to estimate the 1-yr LAI profile
for each pixel since it is advantageous to use a surface reflectance time series rather than an
individual reflectance value. Furthermore, the surface reflectance data from atmospheric cor-
rection are frequently contaminated by clouds, so preprocessing the surface reflectance data
is an essential step in eliminating the impacts of this “noise.” Different algorithms have been
developed to generate temporally continuous and smoothed surface reflectance time series
(Tang et al. 2013; Xiao et al. 2015a, 2017b). Our experiences reveal that effective preprocessing
techniques need to be employed to produce a high-quality LAI product.
Compared to other long-term LAI products, the GLASS LAI product has been shown to
have higher quality and accuracy (Xiao et al. 2017a). Independent direct validation has
also demonstrated that the GLASS LAI product exhibits the best accuracy, with R2 = 0.70
and root-mean-square error (RMSE) = 0.96 globally and R2 = 0.94 and RMSE = 0.61 over
AMERICAN METEOROLOGICAL SOCIETY
Unauthenticated 021 E325
F E B R UA RY| 2Downloaded 04/05/21 05:52 AM UTCChina (X. L. Li et al. 2018). Another independent validation study also showed that the
GLASS LAI product has the lowest uncertainty, followed by GEOV1 (the first version of
Geoland2 satellite products) and MODIS for all the biome types tested (Xu et al. 2018).
The high quality of the GLASS LAI product is characterized by its spatial and temporal
continuity (no gaps or missing values), temporal stability, and representation of vegeta-
tion phenology.
Additionally the GLASS LAI products have been utilized to estimate other variables from
satellite data, such as calculating the fraction of absorbed photosynthetically active radia-
tion (FAPAR) (Xiao et al. 2016b, 2015b), fraction of vegetation coverage (Xiao et al. 2016a),
broadband emissivity (BBE) over vegetated surfaces (Cheng et al. 2016; Meng et al. 2017),
gross primary production (GPP) (Liu et al. 2018; Liu et al. 2015; Tian et al. 2017) and evapo-
transpiration (ET) (Sun et al. 2016; Tian et al. 2015), mapping wall-to-wall vegetation height
in China (Huang et al. 2017), generating regional phenology (R. Wang et al. 2017), detecting
forest disturbances (J. Wang et al. 2017), and characterizing the ecosystem dynamics within a
watershed that has complex topography (Liu et al. 2017). A recently developed remote sensing
data assimilation framework has also used the GLASS LAI product to simultaneously estimate
a group of atmospheric and land surface parameters (Ma et al. 2017a,b, 2018; Shi et al. 2016,
2017; Xiao et al. 2015c).
The GLASS LAI products have also been used to drive various process-oriented models,
such as the Lund–Potsdam–Jena dynamic global vegetation model (LPJ-DGVM), to achieve
a better agreement between the estimated and observed GPP (Ma et al. 2017). A hydrological
model used to determine the hydrological responses to reforestation has also utilized these
LAI products (Liu et al. 2016).
The LAI products have also been used to evaluate land surface models (Bao et al. 2014;
Druel et al. 2017; Guimberteau et al. 2018; Tesemma et al. 2015) and Earth system models
(Huang et al. 2016), investigate vegetation–atmosphere interactions in order to evaluate the
response of vegetation to the changing environment (Jiapaer et al. 2015), detect greening
trends at different spatial scales (R. Q. Li et al. 2018; Piao et al. 2015; Z. Zhu et al. 2016),
among others (Wang et al. 2018; Yu et al. 2018). The LAI products have also been assimilated
into land surface models (Zhao et al. 2016).
FAPAR. FAPAR is a key biophysical variable that is directly related to the photosynthetic ac-
tivity of plants, and is an indicator of the presence and productivity of living vegetation, as
well as the intensity of the terrestrial carbon sink.
Instead of estimating the FAPAR directly from satellite data, the GLASS FAPAR products
are derived from the GLASS LAI products and other auxiliary information (Xiao et al. 2015b).
This method calculates the FAPAR values based mainly on the photosynthetically active ra-
diation (PAR) transmittance of the entire canopy. An advantage of this approach is to ensure
physical consistency between the LAI and FAPAR products. The GLASS FAPAR products
represent the values at 1030 local time, which are close approximations of daily average
FAPAR (Fensholt et al. 2004).
The long-term GLASS FAPAR product from the AVHRR was compared with two similar
products: the National Centers for Environmental Information (NCEI) and the third-generation
Global Inventory Monitoring and Modeling System (GIMMS3g) AVHRR FAPAR products. The
GLASS product exhibits better quality and accuracy (Xiao et al. 2018).
The GLASS FAPAR products have been used in many studies. For example, H. Zhu et al. (2016)
and L. Wang et al. (2017) demonstrated that substantial improvements in estimating the tower
GPP were achieved by substituting the GLASS FAPAR product for the MODIS FAPAR product,
especially for croplands. Hu et al. (2018) also incorporated the GLASS FAPAR product into
their GPP calculations.
AMERICAN METEOROLOGICAL SOCIETY
Unauthenticated 021 E326
F E B R UA RY| 2Downloaded 04/05/21 05:52 AM UTCFVC. Fractional vegetation cover (FVC) generally refers to the fraction of green vegeta-
tion as seen from the nadir of the total statistical area. FVC is an important parameter
for describing land surface vegetation conditions required by many land surface models,
weather prediction models, regional and global climate models, hydrological models,
and global change studies.
Multiple global FVC products have been generated from different satellite datasets; however,
many require improvements in accuracy. For example, the GEOV1 FVC product is generally
accurate (Camacho et al. 2013), but validation using data from an agricultural region indicates
an overestimate of up to 0.2 (Mu et al. 2015).
The GLASS FVC product is based on machine learning methods that use training samples
generated from globally distributed high-spatial-resolution satellite data (Jia et al. 2019).
Initially, the GLASS FVC product algorithm for MODIS data were based on the GRNNs method
(Jia et al. 2015). After comparing four machine learning methods, including back-propagation
neural networks (BPNNs), GRNNs, support vector regression (SVR), and multivariate adaptive
regression splines (MARS), the MARS method was chosen to produce the global FVC product
from MODIS data. This was due to its high computational efficiency and reasonable accuracy
(Yang et al. 2016).
The GLASS AVHRR FVC algorithm was based on the GLASS MODIS FVC product to achieve
temporal consistency. First, 1-yr training samples were extracted globally where AVHRR
reflectance data and the GLASS MODIS FVC product overlapped. The MARS model was
then trained with the training samples and used to estimate the FVC from the preprocessed
AVHRR reflectance data. Finally, the estimated FVC from the AVHRR data were linearly
corrected based on the GLASS MODIS FVC to obtain the AVHRR FVC consistent with the
GLASS MODIS FVC.
The GLASS FVC product has been evaluated by both direct validation and product inter-
comparisons (Jia et al. 2019). Based on 44 reference datasets from the Validation of Land
European Remote Sensing Instruments (VALERI) sites with various land-cover types, the
RMSE of the GLASS FVC from the MODIS data is 0.157, which is comparable to that of the
GEOV1 FVC product (RMSE = 0.166). The coefficient of determination (R2) of the GLASS MODIS
FVC is 0.809, which is larger than that of the GEOV1 FVC product (R2 = 0.775). The GLASS
AVHRR FVC product also has validation results (R2 = 0.834, RMSE = 0.145) that are slightly
superior to those of the GEOV1 FVC product from AVHRR data (R2 = 0.799, RMSE = 0.174).
A direct validation of the GLASS FVC product in an agricultural region based on a time series
of field FVC measurements indicated that the performance of the GLASS FVC product
(R2 = 0.86, RMSE = 0.087) was better than the performance of the GEOV1 FVC product (R2 = 0.71,
RMSE = 0.193) using the same reference data (K. Jia et al. 2018). Other validation experiments
have been conducted using estimates from high-resolution satellite data and ground measure-
ments (K. Jia et al. 2018, 2016).
DSR. Surface downward shortwave radiation (DSR) is an essential component of the total
energy exchanged between the atmosphere and the surface and is required by most land
surface hydrological and ecological models. The earlier GLASS DSR product was based on an
improved lookup table (LUT) method using multiple polar-orbiting and geostationary satel-
lite datasets (Zhang et al. 2014). However, it was too time consuming to generate a long-term
global DSR product using this method. To overcome this difficulty, the current GLASS DSR
product is instead generated from the MODIS top-of-atmosphere (TOA) reflectance based on
a direct-estimation method (Zhang et al. 2019).
The GLASS DSR product has a 0.05° spatial resolution and a daily temporal resolution.
Validated by ground measurements collected at 525 stations from 2003 to 2015 around the
AMERICAN METEOROLOGICAL SOCIETY
Unauthenticated 021 E327
F E B R UA RY| 2Downloaded 04/05/21 05:52 AM UTCworld, the GLASS monthly DSR has an overall bias of 1.24 W m−2 and an RMSE of 21.16 W m−2.
Moreover, the global land annual mean of the DSR was 184.8 W m−2, with a standard devia-
tion of 0.8 W m−2 over a 13-yr (2003–15) period.
Downward PAR. PAR is defined as the visible part (400–700 nm) of the DSR. It is an essential
parameter in ecological modeling that controls the exchange of water vapor and carbon dioxide
between vegetation and the atmosphere and is used to estimate global terrestrial vegetation
productivity.
Currently, most global radiation products do not have a PAR component, so many users
have to calculate PAR by multiplying the DSR by an empirical conversion constant of approxi-
mately 0.5 (Liang et al. 2006). The GLASS PAR product was previously produced using the
LUT method (Liang et al. 2013b; Zhang et al. 2014). The current version of the PAR product
is obtained from the GLASS DSR multiplied by a spatially and temporally variable conver-
sion factor determined from the GEWEX-SRB V3.0 radiative flux products, in which DSR and
PAR are provided separately. The accuracy of this method is comparable to that of the previ-
ous version of the product. Cai et al. (2014) demonstrated that the GLASS PAR product can
produce better estimations of terrestrial GPP over China by comparing it with several other
incident radiation products.
Broadband albedo. Land surface albedo describes the ratio of the upward to downward
flux of solar radiation at the surface and is an important indicator of global environmen-
tal changes, such as urbanization, deforestation/afforestation, and Arctic sea ice retreat
(Dickinson 1983).
Unlike the MODIS albedo products, which are based on inversions of the bidirectional
reflectance distribution function (BRDF) model parameters, the GLASS albedo products are
based on the direct-estimation method and represent surface albedo under general clear-sky
atmospheric conditions. The GLASS albedo algorithm consists of two steps. The first step
adopts the direct-estimation algorithm (Qu et al. 2014) to derive the intermediate albedo
products, and the second step adopts the spatiotemporal filtering algorithm (N. Liu et al. 2013)
to generate a smoothed and gap-free product.
The version 3 GLASS albedo product was released in 2012 (Q. Liu et al. 2013; Peng et al.
2015). The version 4 (V4) GLASS albedo products released in 2019 have been updated with
regard to several aspects. In addition to
the shortwave (SW) albedo, the products
include visible (VIS) and near-infrared
(NIR) albedo values. The snow/ice BRDF
model has been updated (Qu et al. 2016),
and a water surface BRDF model has been
adopted for the ocean surface as well as for
mixed pixels of water/sea ice (Feng et al.
2016). As a result, the quality and accuracy
of the GLASS albedo products over ocean
and sea ice areas have been improved (Qu
et al. 2016; Feng et al. 2016).
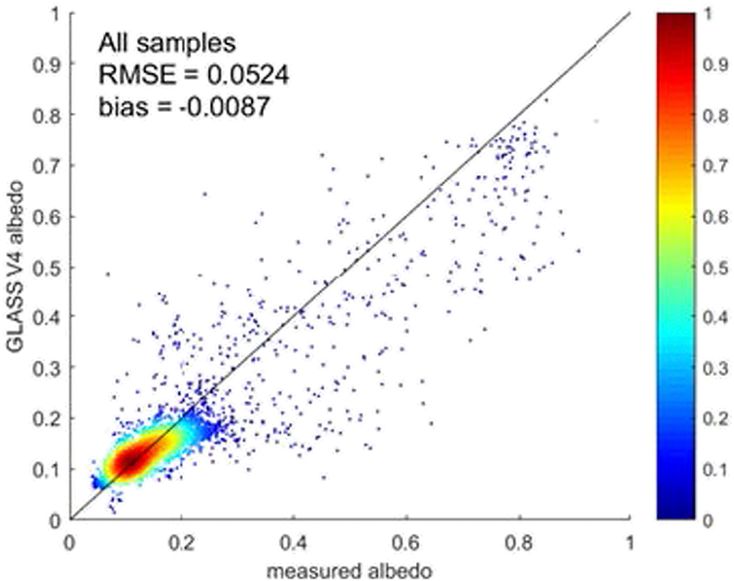
The V4 GLASS shortwave albedo products
were validated by tower-based observations
from 53 spatially homogeneous global sites
(Fig. 1). These measurements are part of the
LaThuile Opened dataset from FLUXNET Fig. 1. Validation of the V4 GLASS shortwave albedo product
(Baldocchi et al. 2001). The RMSE was 0.052 (6,035 samples from the FLUXNET LaThuile Opened dataset).
AMERICAN METEOROLOGICAL SOCIETY
Unauthenticated 021 E328
F E B R UA RY| 2Downloaded 04/05/21 05:52 AM UTCfor all matched samples. After screening out all the cloudy pixels, the RMSE was reduced to
0.037.
Since it is difficult to obtain ground measurements to directly validate visible and near-IR
albedo, we compared these products with the MODIS (C6 MCD43A3) product. They are con-
sistent over snow-free pixels, with RMSE values of 0.018 and 0.022, respectively. However,
larger discrepancies were observed over snow/ice pixels, partially due to their differences in
spatial resolution.
The GLASS albedo products have been used by many studies. For example, they have
been used to calculate surface ET (Carter and Liang 2019), to determine radiative forcing
due to land surface changes (Chen et al. 2016a,b, 2015; Hu et al. 2016, 2015; Li et al. 2015;
Zhang and Liang 2014, 2018), and to evaluate environmental changes (Chen et al. 2017;
He et al. 2014, 2013).
LST. Land surface temperature (LST) is a key parameter in many land processes. Thermal-
infrared (TIR) remote sensing provides direct observation of thermal emission from the
land surface, enabling the estimation of LST under clear-sky conditions. Numerous algo-
rithms have been proposed, but a long-term global high-resolution LST satellite product
has yet to be found, especially for data collected prior to the year 2000.
The GLASS LST product was recently released (Zhou et al. 2019; Ma et al. 2020) and
differs from most of the current satellite LST products. The GLASS LST product is based on
a multialgorithm ensemble approach, which combines nine split-window algorithms with
the Bayesian model averaging (BMA) model. In the first phase, the GLASS LST product
was produced for four discrete years with a spatial resolution of 0.05° for 1983 and 1993
and a spatial resolution of 1 km for 2003 and 2013. In the second phase, the product was
expanded to cover 1981–2000 with a spatial resolution of 0.05°. In addition, the BMA
model was replaced by a random forest based ensemble approach (Ma et al. 2020). The
current GLASS LST product has also been corrected for the orbit drift effect.
The GLASS LST products have been validated by in situ LST measurements. In the pre-
liminary validation stage (Zhou et al. 2019), the AVHRR LST product had an RMSE of 2.89
K when validated with measurements from the Barrow, Alaska (now known as Utqiaġvik),
site of the Baseline Surface Radiation Network (BSRN) (Driemel et al. 2018). For the MODIS
LST product, validation with measurements from six grassland/cropland Surface Radiation
Budget Network (SURFRAD) sites indicated that the mean RMSE values are 1.82–2.15 K at
night for Terra/Aqua MODIS in 2003 and 2013. This accuracy is similar to that of the official
MODIS LST product. In the validation stage, the AVHRR LST product was validated with
historical in situ measurements from the SURFRAD data collected between 1995 and 2000,
with a mean bias error (MBE) of 0.21 K and a range from –1.59 to 2.71 K (site dependent),
and a standard deviation (STD) of 2.48 K with a range of 2.26–2.76 K (site dependent); and
water data from the National Data Buoy Center (NDBC) collected between 1981 and 2000
that has an MBE of 0.11 K with a range from –0.01 to 0.26 K and a STD of 0.80 K with a
range of 0.77–0.85 K.
A parallel effort has been undertaken to generate another GLASS AVHRR LST product
from 1981 to 2000 using a generalized split-window algorithm (Liu et al. 2019). The major
difference from the LST product described above is a further orbit drift correction that
normalizes the estimated LST to the same local time based on the diurnal temperature
cycle model and the Bayesian optimization algorithm. The validation results based on
measurements from six SURFRAD sites produced RMSEs from 2.2 to 4.1 K and MBEs from
–0.4 to 2.0 K.
Broadband emissivity. Surface thermal-infrared BBE is a key variable for calculating the
AMERICAN METEOROLOGICAL SOCIETY
Unauthenticated 021 E329
F E B R UA RY| 2Downloaded 04/05/21 05:52 AM UTCsurface radiation budget, which is critical for addressing a variety of scientific and applied
issues that are related to climate trends, weather prediction, hydrologic models, and biogeo-
physical models (Kustas et al. 2018; Liang et al. 2019; Wild et al. 2014). Jin and Liang (2006)
demonstrated that incorporating a satellite-derived BBE product can significantly improve
simulations with a coupled land surface and atmospheric model (National Center for Atmo-
spheric Research Community Atmosphere Model + Community Land Model, version 2).
The GLASS BBE products represent the broadband emissivity between 8 and 13.5 μm, which
is the optimal spectral range for calculating longwave net radiation (Cheng et al. 2013). For
the GLASS MODIS BBE product, land surfaces were classified into water, snow or ice, bare soil,
vegetated surfaces, and transition zone, and their BBEs were calculated separately. The BBE
of bare soil is estimated using the MODIS spectral reflective albedos (Cheng and Liang 2014),
which are based on their linear relationship with the Advanced Spaceborne Thermal Emission
and Reflection Radiometer (ASTER) spectral thermal emissivities that are converted to
broadband emissivity. The vegetation BBE is calculated based on the leaf BBE, soil BBE, and
LAI from a radiative transfer model (Cheng et al. 2016).
The GLASS AVHRR BBE product is generated from a similar algorithm, except that the
AVHRR surface visible and near-infrared reflectances were used to replace the MODIS spectral
albedos (Cheng and Liang 2013).
The GLASS BBE product was validated with field measurements of northern China from
2006 to 2011 (Dong et al. 2013). The differences over bare soils were within 0.02. The differ-
ences between the GLASS BBE derived from the MODIS data and measurements over fully
vegetated surfaces were less than 0.005 (Cheng et al. 2016). Using ground measurements
collected from six sites in the desert regions of North America in 2008, the mean BBE differ-
ence was 0.016 (Cheng and Liang 2014). Since no ground measurements were available to
validate the GLASS AVHRR BBE before 2000, we checked the consistency between the 1-km
MODIS BBE and the 0.05° AVHRR BBE products after 2000. The absolute value of mean dif-
ference and the RMSE were both less than 0.001. We also compared the GLASS BBE with the
North American ASTER Land Surface Emissivity Database (Cheng et al. 2014) and found good
agreement in both the summer and winter seasons.
The GLASS BBE products have been used to estimate evaporation (W. Yang et al. 2020) and
ET (Ma et al. 2019), compare with the retrievals of a new inversion algorithm as a reference
value (Ma et al. 2018), and to study climate impacts due to the widespread deployment of
utility-scale solar energy installations (Li et al. 2017).
Longwave downward and upward radiation. The surface radiation budget is dominated
by longwave radiation at night and in polar regions for most of the year. To estimate
instantaneous clear-sky longwave upwelling (LWUP) and downward (LWDN) radiation
from the MODIS data, we developed a hybrid model for LWUP (Cheng and Liang 2016)
and for LWDN (Cheng et al. 2017a). For cloudy-sky conditions, we estimated the LWDN
using the single layer cloud model (Forman and Margulis 2009) with inputs from the
MODIS cloud product. The cloudy-sky LWUP was calculated from the GLASS BBE product
and LST extracted from MODIS cloud product MOD06/MYD06.
For thermal radiation before 2000, we used the parameterization schemes to calculate
clear-sky LWDN from reanalysis data (Cheng et al. 2019, 2020; Guo et al. 2019) and used the
GLASS LST and BBE products to calculate LWUP.
Validation of the clear-sky GLASS MODIS products used three ground measurements from
six networks at 141 globally distributed sites and showed that the bias and RMSE were –3.77
and 26.94 W m−2, respectively, for LWDN, and –4.33 and 18.15 W m−2, respectively, for LWUP.
The bias and RMSE of the calculated longwave net radiation (LWNT) were 0.70 and 26.7 W
m−2, respectively, which are much better than those of other products (Zeng et al. 2020).
AMERICAN METEOROLOGICAL SOCIETY
Unauthenticated 021 E330
F E B R UA RY| 2Downloaded 04/05/21 05:52 AM UTCAll-wave net radiation. The all-wave surface net radiation (Rn) is the sum of the down-
ward and upward fluxes of the shortwave (0.3–4 μm) and longwave (4–100 μm) spectra.
The GLASS Rn product is produced based on its relationship with solar radiation and other
meteorological information. After exploring linear regression models (Jiang et al. 2015) and
multiple machine learning methods (Jiang et al. 2014), the MARS and random forest (RF)
algorithms were selected to produce the GLASS daytime (Jiang et al. 2019) and daily Rn
products. The DSR, normalized difference vegetation index (NDVI), and albedo from the
GLASS products and meteorological values from the Modern-Era Retrospective Analysis
for Research and Applications, version 2 (MERRA-2), reanalysis data (Gelaro et al. 2017)
are the primary inputs.
The GLASS daytime and daily Rn products were validated with in situ measurements from
more than 140 global sites. Comparisons were also made with CERES and two reanalysis
products: the Japanese 55-year Reanalysis (JRA-55) and the European Centre for Medium-
Range Weather Forecasts (ECMWF) interim reanalysis (ERA-Interim). The results in Table 2
show that the two satellite products (GLASS and CERES) are more accurate than the reanalysis
datasets, and the GLASS Rn product exhibits the smallest RMSE and MBE on both daytime
and daily scales.
Table 2. Validation results of four daytime/daily Rn products against in situ measurements (36,733 samples).
Daily (n = 36,733) Daytime (n = 52,176)
R2 RMSE (W m−2) MBE (W m−2) R2 RMSE (W m−2) MBE (W m−2)
GLASS 0.82 28.99 −2.73 0.80 52.93 5.56
CERES_SYN1deg Ed3A 0.72 36.01 3.53 0.82 55.25 23.92
JRA-55 0.64 45.54 2.22 0.62 79.70 25.75
ERA-Interim 0.54 51.67 −5.96 0.64 74.18 20.86
We also calculated the average net radiation over land surfaces for the past decade. The
GLASS net radiation product shows a similar temporal trend to the two reanalysis products,
while the CERES product has a trend of opposite sign due to changes in the versions of input
data (A. Jia et al. 2018).
ET. ET is a key variable linked to energy, water, and carbon exchange among the terrestrial
biosphere, hydrosphere, and atmosphere. The GLASS ET product algorithm is based on the
multimodel ensemble approach (Yao et al. 2014) and, in particular, the BMA method, which
merges five process-based ET estimates, such as the MODIS ET product algorithm (MOD16)
(Mu et al. 2011), the revised remote sensing–based Penman–Monteith ET algorithm (RRS-
PM) (Yuan et al. 2010), the Priestley–Taylor-based ET algorithm (PT-JPL) (Fisher et al. 2008),
modified satellite-based Priestley–Taylor ET algorithm (MS-PT) (Yao et al. 2013), and the
semiempirical Penman ET algorithm of the University of Maryland (UMD-SEMI) (Wang et al.
2010).
The validation of the GLASS ET product used ground measurements from 240 eddy
covariance flux tower sites and illustrated that the GLASS ET product using the BMA method
enhances the latent heat flux (LE) estimates, with a smaller RMSE (35.3 W m−2) and a larger
average R2 (0.75) than the MODIS ET product (RMSE = 45.3 W m−2, R2 = 0.62) using the in-
dividual algorithms driven by the tower-specific and MERRA-2 meteorological data. Addi-
tionally, L. Song et al. (2018) compared five major satellite ET products over the Heihe River
basin in China and found that the GLASS ET product was more accurate than the individual
model calculations.
AMERICAN METEOROLOGICAL SOCIETY
Unauthenticated 021 E331
F E B R UA RY| 2Downloaded 04/05/21 05:52 AM UTCGPP. Vegetation GPP refers to the rate at which green plants in the ecosystem produce or-
ganic matter by assimilating carbon dioxide using solar energy through photosynthesis. The
GLASS GPP algorithm originates from the Eddy Covariance–Light Use Efficiency (EC-LUE)
model (Yuan et al. 2007). The original EC-LUE model is driven by only four variables: NDVI,
PAR, air temperature, and the Bowen ratio of sensible to latent heat flux. The later version of
the EC-LUE model substitutes the ratio of ET to net radiation for the Bowen ratio, and revises
the remote sensing Penman–Monteith (RS-PM) model to quantify ET (Yuan et al. 2010). To
accurately indicate the long-term changes in GPP, the GLASS GPP product uses the latest
version of the EC-LUE model that integrates the impacts of several environmental variables:
atmospheric CO2 concentrations, direct and diffuse radiation fluxes, and atmospheric water
vapor pressure deficit (VPD) (Yuan et al. 2019).
The EC-LUE model has been validated throughout North America, Europe and East
Asia using measurements from eddy covariance towers (Li et al. 2013; Yuan et al. 2014,
2010, 2007). The validations show that the EC-LUE model can successfully reproduce
the spatial and temporal variabilities of GPP over various ecosystem types.
Several model comparisons also indicate the superior performance of the EC-LUE
model over other LUE models. Previous studies compared the EC-LUE model and the
MODIS GPP products based on measurements from eddy covariance towers in south-
eastern China and found that the EC-LUE model performed better than the MODIS algo-
rithms (Xu et al. 2013). A recent study compared eight satellite-based GPP models over
various major grassland ecosystem types and found that the EC-LUE model had the best
performance (W. Jia et al. 2018). Evaluation at 85 eddy covariance towers, distributed
globally, demonstrated that the GLASS GPP product is able to represent interannual
variations and long-term trends because it integrates important environmental variables
(Zheng et al. 2020).
The GLASS GPP product has been widely used to examine the spatial and temporal varia-
tions in GPP (Han et al. 2015; Hu et al. 2018; Ma et al. 2015; Wang et al. 2015; Xu et al. 2013).
For example, Yuan et al. (2019) used the GLASS GPP product to investigate the impacts of
atmospheric VPD on global terrestrial GPP and found persistent widespread decreases in
GPP after the late 1990s due to increases in VPD, which offset the positive CO2 fertiliza-
tion effect. In addition, the GLASS GPP algorithm has been used to develop and improve
other GPP models (Kanniah et al. 2009; Pasquato et al. 2015; Restrepo-Coupe et al. 2013;
Verma et al. 2015).
Production and distributions
The GLASS product production system, which includes high-performance computing
capabilities, is located at Beijing Normal University (Zhao et al. 2013). The system includes
processing, management and data service modules and currently stores more than 3 PB of data.
The HDF-EOS file format is used to store the GLASS products. In addition, we use the JPG
format to display product thumbnails and the XML format to store product metadata. All
of the products are provided in the sinusoidal map projection for the MODIS data at 500-m
or 1-km spatial resolution, and in the geographic latitude/longitude map projection for the
AVHRR data at a 0.05° spatial resolution. All products are also aggregated and distributed at
0.05° or coarser resolution.
The GLASS products can be downloaded from the following websites: www.glass.umd.edu
and www.geodata.cn/thematicView/GLASS.html. The first website is in English, and the second
one is mainly in Chinese.
Next steps
We continue to improve the GLASS products in the following ways:
AMERICAN METEOROLOGICAL SOCIETY
Unauthenticated 021 E332
F E B R UA RY| 2Downloaded 04/05/21 05:52 AM UTC1) Enhancing the spatial resolutions of the current products. Several products (e.g., short-
wave albedo, LAI, and FVC) will ultimately have a spatial resolution of 250 m since 2000.
A parallel project is being undertaken to generate some of these products, as well as new
products, at a 30-m resolution, which are denoted as high-resolution GLASS (Hi-GLASS)
products.
2) Improving the accuracy and quality of the current products by using advanced machine
learning algorithms and more satellite data sources (e.g., European and Chinese satellite
data).
3) Expanding the number of products. Efforts are being made to generate more land, atmo-
spheric and oceanic climate data records (CDRs) from different satellite observations. Many
algorithms for generating these products have been developed, including those for top-
of-atmosphere (TOA) shortwave albedo (Z. Song et al. 2018; Wang and Liang 2016, 2017),
ocean shortwave albedo (Feng et al. 2016; Qu et al. 2016) and longwave emissivity (Cheng
et al. 2017b), land surface NDVI (Xiao et al. 2015a, 2017b), fractional snow cover (Chen
et al. 2018), surface air temperature (Rao et al. 2019), and forest above-ground biomass
(L. Yang et al. 2020). Some of these products correspond to ECVs and are available upon
request.
4) Broadening dissemination of the GLASS products. In addition to giving more presentations
at conferences, workshops and summer schools, we are improving the web user interface
for effective and efficient data downloading and are distributing GLASS product informa-
tion to global users through the Global Earth Observation System of Systems (GEOSS) data
portal (https://www.geoportal.org/).
5) Fostering greater utilization of the GLASS products. We are developing collaborations
between the GLASS product team and other research projects and have planned the first
GLASS user conference for the summer of 2021.
Acknowledgments. This work was partially supported by the Chinese Grand Research Program
on Climate Change and Response through Grant 2016YFA0600103 and the National Earth System
Science Data Center, National Science & Technology Infrastructure of China (http://www.geodata.cn).
Many colleagues and graduate students have contributed to the development of the GLASS products.
We thank the anonymous reviewers for their valuable comments and suggestions that have greatly
improved the presentation of this paper.
AMERICAN METEOROLOGICAL SOCIETY
Unauthenticated 021 E333
F E B R UA RY| 2Downloaded 04/05/21 05:52 AM UTCReferences
Baldocchi, D., and Coauthors, 2001: FLUXNET: A new tool to study the temporal —, X. Cheng, S. Liang, R. Niclòs, A. Nie, and Q. Liu, 2017b: A lookup table-based
and spatial variability of ecosystem-scale carbon dioxide, water vapor, and method for estimating sea surface hemispherical broadband emissivity values
energy flux densities. Bull. Amer. Meteor. Soc., 82, 2415–2434, https://doi. (8–13.5 mm). Remote Sens., 9, 245, https://doi.org/10.3390/RS9030245.
org/10.1175/1520-0477(2001)0822.3.CO;2. —, F. Yang, and Y. Guo, 2019: A comparative study of bulk parameterization
Bao, Y., and Coauthors, 2014: Evaluation of CMIP5 Earth system models in repro- schemes for estimating cloudy-sky surface downward longwave radiation.
ducing leaf area index and vegetation cover over the Tibetan Plateau. J. Meteor. Remote Sens., 11, 528, https://doi.org/10.3390/rs11050528.
Res., 28, 1041–1060, https://doi.org/10.1007/s13351-014-4023-5. —, S. Liang, and J. Shi, 2020: Impact of air temperature inversion on the clear-
Baret, F., and Coauthors, 2007: LAI, FAPAR and fCOVER CYCLOPES global products sky surface downward longwave radiation estimation. IEEE Trans. Geosci.
derived from VEGETATION. Part I: Principles of the algorithm. Remote Sens. Remote Sens., 58, 4796–4802, https://doi.org/10.1109/TGRS.2020.2967432.
Environ., 110, 275–286, https://doi.org/10.1016/j.rse.2007.02.018. Dickinson, R. E., 1983: Land surface processes and climate-surface albedos and
Cai, W., and Coauthors, 2014: Improved estimations of gross primary production energy balance. Advances in Geophysics, Vol. 25, Academic Press, 305–353,
using satellite-derived photosynthetically active radiation. J. Geophys. Res. https://doi.org/10.1016/S0065-2687(08)60176-4.
Biogeosci., 119, 2013JG002456, https://doi.org/10.1002/2013JG002456. Dong, L., J. Hu, S. Tang, and M. Min, 2013: Field validation of GLASS land surface
Camacho, F., J. Cemicharo, R. Lacaze, F. Baret, and M. Weiss, 2013: GEOV1: LAI, broadband emissivity database using pseudo-invariant sand dune sites in
FAPAR essential climate variables and fCOVER global time series capitalizing north of China. Int. J. Digital Earth, 6, 96–112, https://doi.org/10.1080/175
over existing products. Part II: Validation and intercomparison with reference 38947.2013.822573.
products. Remote Sens. Environ., 137, 310–329, https://doi.org/10.1016/j. Driemel, A., and Coauthors, 2018: Baseline Surface Radiation Network (BSRN):
rse.2013.02.030. Structure and data description (1992-2017). Earth Syst. Sci. Data, 10, 1491–
Carter, C., and S. Liang, 2019: Evaluation of ten machine learning methods for 1501, https://doi.org/10.5194/essd-10-1491-2018.
estimating terrestrial evapotranspiration from remote sensing. Int. J. Appl. Druel, A., and Coauthors, 2017: Towards a more detailed representation of high-
Earth Obs. Geoinf., 78, 86–92, https://doi.org/10.1016/j.jag.2019.01.020. latitude vegetation in the global land surface model ORCHIDEE (ORC-HL-
Chen, X., S. Liang, Y. Cao, T. He, and D. Wang, 2015: Observed contrast changes VEGv1. 0). Geosci. Model Dev., 10, 4693–4722, https://doi.org/10.5194/gmd-
in snow cover phenology in northern middle and high latitudes from 2001– 10-4693-2017.
2014. Sci. Rep., 5, 16820, https://doi.org/10.1038/srep16820. Feng, Y., Q. Liu, Y. Qu, and S. Liang, 2016: Estimation of the ocean water albedo
—, —, and —, 2016a: Satellite observed changes in the Northern Hemi- from remote sensing and meteorological reanalysis data. IEEE Trans. Geosci.
sphere snow cover phenology and the associated radiative forcing and feed- Remote Sens., 54, 850–868, https://doi.org/10.1109/TGRS.2015.2468054.
back between 1982 and 2013. Environ. Res. Lett., 11, 084002, https://doi. Fensholt, R., I. Sandholt, and M. S. Rasmussen, 2004: Evaluation of MODIS LAI,
org/10.1088/1748-9326/11/8/084002. fAPAR and the relation between fAPAR and NDVI in a semi-arid environment
—, —, —, and T. He, 2016b: Distribution, attribution, and radiative forc- using in situ measurements. Remote Sens. Environ., 91, 490–507, https://doi.
ing of snow cover changes over China from 1982 to 2013. Climatic Change, org/10.1016/j.rse.2004.04.009.
137, 363–377, https://doi.org/10.1007/s10584-016-1688-z. Fisher, J. B., K. P. Tu, and D. D. Baldocchi, 2008: Global estimates of the land-
—, —, and —, 2017: Sensitivity of summer drying to spring snow-albedo atmosphere water flux based on monthly AVHRR and ISLSCP-II data, vali-
feedback throughout the Northern Hemisphere from satellite observations. dated at 16 FLUXNET sites. Remote Sens. Environ., 112, 901–919, https://doi.
IEEE Geosci. Remote Sens. Lett., 14, 2345–2349, https://doi.org/10.1109/ org/10.1016/j.rse.2007.06.025.
LGRS.2017.2764543. Forman, B., and S. Margulis, 2009: High-resolution satellite-based cloud-coupled
—, D. Long, S. Liang, L. He, C. Zeng, X. Hao, and Y. Hong, 2018: Developing estimates of total downwelling surface radiation for hydrologic modelling
a composite daily snow cover extent record over the Tibetan Plateau from applications. Hydrol. Earth Syst. Sci., 13, 969–986, https://doi.org/10.5194/
1981 to 2016 using multisource data. Remote Sens. Environ., 215, 284–299, hess-13-969-2009.
https://doi.org/10.1016/j.rse.2018.06.021. GCOS, 2016: The Global Observing System for Climate: Implementation needs.
Cheng, J., and S. Liang, 2013: Estimating global land surface broadband thermal- GCOS Rep. GCOS-200, 342 pp.
infrared emissivity using Advanced Very High Resolution Radiometer optical Gelaro, R., and Coauthors, 2017: The Modern-Era Retrospective Analysis for Re-
data. Int. J. Digital Earth, 6, 34–49, https://doi.org/10.1080/17538947.2013. search and Applications, version 2 (MERRA-2). J. Climate, 30, 5419–5454,
783129. https://doi.org/10.1175/JCLI-D-16-0758.1.
—, and —, 2014: Estimating the broadband longwave emissivity of global Guimberteau, M., and Coauthors, 2018: ORCHIDEE-MICT (v8. 4.1), a land surface
bare soil from the MODIS shortwave albedo product. J. Geophys. Res. Atmos., model for the high latitudes: Model description and validation. Geosci. Model
119, 614–634, https://doi.org/10.1002/2013JD020689. Dev., 11, 121–163, https://doi.org/10.5194/gmd-11-121-2018.
—, and —, 2016: Global estimates for high-spatial-resolution clear-sky land Guo, Y., J. Cheng, and S. Liang, 2019: Comprehensive assessment of parameteriza-
surface upwelling longwave radiation from MODIS data. IEEE Trans. Geosci. tion methods for estimating clear-sky surface downward longwave radiation.
Remote Sens., 54, 4115–4129, https://doi.org/10.1109/TGRS.2016.2537650. Theor. Appl. Climatol., 135, 1045–1058, https://doi.org/10.1007/S00704-018-
—, —, Y. Yao, and X. Zhang, 2013: Estimating the optimal broadband emissiv- 2423-7.
ity spectral range for calculating surface longwave net radiation. IEEE Geosci. Han, F., and Coauthors, 2015: Effects of climate change on phenology and
Remote Sens. Lett., 10, 401–405, https://doi.org/10.1109/LGRS.2012.2206367. primary productivity in the desert steppe of Inner Mongolia. J. Arid Land,
—, —, —, B. Ren, L. Shi, and H. Liu, 2014: A comparative study of three 7, 251–263, https://doi.org/10.1007/s40333-014-0042-4.
land surface broadband emissivity datasets from satellite data. Remote He, L., J. M. Chen, J. Pisek, C. B. Schaaf, and A. H. Strahler, 2012: Global clumping
Sens., 6, 111–134, https://doi.org/10.3390/rs6010111. index map derived from the MODIS BRDF product. Remote Sens. Environ.,
—, —, W. Verhoef, L. Shi, and Q. Liu, 2016: Estimating the hemispherical 119, 118–130, https://doi.org/10.1016/j.rse.2011.12.008.
broadband longwave emissivity of global vegetated surfaces using a radia- He, T., S. Liang, Y. Yu, Q. Liu, and F. Gao, 2013: Greenland surface albedo changes
tive transfer model. IEEE Trans. Geosci. Remote Sens., 54, 905–917, https:// 1981-2012 from satellite observations. Environ. Res. Lett., 8, 044043, https://
doi.org/10.1109/TGRS.2015.2469535. doi.org/10.1088/1748-9326/8/4/044043.
—, —, and W. Wang, 2017a: Surface downward longwave radiation. Earth’s En- —, —, and D.-X. Song, 2014: Analysis of global land surface albedo cli-
ergy Budget, S. Liang, Ed., Vol. 5, Comprehensive Remote Sensing, Elsevier, 196–216. matology and spatial-temporal variation during 1981–2010 from multiple
AMERICAN METEOROLOGICAL SOCIETY
Unauthenticated 021 E334
F E B R UA RY| 2Downloaded 04/05/21 05:52 AM UTCsatellite products. J. Geophys. Res. Atmos., 119, 10 281–10 298, https:// Kustas, W. P., and Coauthors, 2018: The Grape Remote Sensing Atmospheric Pro-
doi.org/10.1002/2014JD021667. file and Evapotranspiration Experiment. Bull. Amer. Meteor. Soc., 99, 1791–
Hu, L., W. Fan, H. Ren, S. Liu, Y. Cui, and P. Zhao, 2018: Spatiotemporal dynam- 1812, https://doi.org/10.1175/BAMS-D-16-0244.1.
ics in vegetation GPP over the Great Khingan mountains using GLASS prod- Li, R. Q., Y. H. Gao, D. L. Chen, Y. X. Zhang, and S. S. Li, 2018: Contrasting vegetation
ucts from 1982 to 2015. Remote Sens., 10, 488, https://doi.org/10.3390/ changes in dry and humid regions of the Tibetan Plateau over recent decades.
rs10030488. Sci. Cold Arid Reg., 10, 482–492, www.scar.ac.cn/EN/Y2018/V10/I6/482.
Hu, Y., M. Hou, G. Jia, X. Zhang, R. Xu, and Y. He, 2015: Comparison of three Li, S., J. Weigand, and S. Ganguly, 2017: The potential for climate impacts from
different methods to identify fractional urban signals for improving climate widespread deployment of utility-scale solar energy installations: An envi-
modelling. Int. J. Remote Sens., 36, 3274–3292, https://doi.org/10.1080/ ronmental remote sensing perspective. J Remote Sensing GIS, 6, 51963947,
01431161.2015.1042593. https://doi.org/10.4172/2469-4134.1000190.
—, G. Jia, C. Pohl, X. Zhang, and J. van Genderen, 2016: Assessing surface Li, X., and Coauthors, 2013: Estimation of gross primary production over the
albedo change and its induced radiation budget under rapid urbanization terrestrial ecosystems in China. Ecol. Modell., 261–262, 80–92, https://doi.
with Landsat and GLASS data. Theor. Appl. Climatol., 123, 711–722, https:// org/10.1016/j.ecolmodel.2013.03.024.
doi.org/10.1007/s00704-015-1385-2. Li, X. L., H. Lu, L. Yu, and K. Yang, 2018: Comparison of the spatial characteristics
Huang, H., C. Liu, X. Wang, G. S. Biging, Y. Chen, J. Yang, and P. Gong, 2017: Map- of four remotely sensed leaf area index products over China: Direct valida-
ping vegetation heights in China using slope correction ICESat data, SRTM, tion and relative uncertainties. Remote Sens., 10, 26, https://doi.org/10.3390/
MODIS-derived and climate data. ISPRS J. Photogramm. Remote Sens., 129, RS10010148.
189–199, https://doi.org/10.1016/j.isprsjprs.2017.04.020. Li, Y., M. Zhao, S. Motesharrei, Q. Mu, E. Kalnay, and S. Li, 2015: Local cooling and
Huang, Y., S. Gerber, T. Huang, and J. W. Lichstein, 2016: Evaluating the drought warming effects of forests based on satellite observations. Nat. Commun., 6,
response of CMIP5 models using global gross primary productivity, leaf area, 6603, https://doi.org/10.1038/ncomms7603.
precipitation, and soil moisture data. Global Biogeochem. Cycles, 30, 1827– Liang, S., and J. Wang, 2019: Advanced Remote Sensing: Terrestrial Information
1846, https://doi.org/10.1002/2016GB005480. Extraction and Applications. 2nd ed. Elsevier, 985 pp.
Jia, A., S. Liang, B. Jiang, X. Zhang, and G. Wang, 2018: Comprehensive assessment —, T. Zheng, R. Liu, H. Fang, S. C. Tsay, and S. Running, 2006: Mapping incident
of global surface net radiation products and uncertainty analysis. J. Geophys. photosynthetically active radiation (PAR) from MODIS data. J. Geophys. Res.
Res. Atmos., 123, 1970–1989, https://doi.org/10.1002/2017JD027903. Atmos., 111, D15208, https://doi.org/10.11029/12005JD006730.
Jia, K., and Coauthors, 2015: Global land surface fractional vegetation cover —, X. Zhang, Z. Xiao, J. Cheng, Q. Liu, and X. Zhao, 2013a: Global Land Surface
estimation using general regression neural networks from MODIS surface Satellite (GLASS) Products: Algorithms, Validation and Analysis. Springer,
reflectance. IEEE Trans. Geosci. Remote Sens., 53, 4787–4796, https://doi. 171 pp.
org/10.1109/TGRS.2015.2409563. —, and Coauthors, 2013b: A long-term Global Land Surface Satellite (GLASS)
—, and Coauthors, 2016: Fractional vegetation cover estimation algorithm for dataset for environmental studies. Int. J. Digital Earth, 6, 5–33, https://doi.org
Chinese GF-1 wide field view data. Remote Sens. Environ., 177, 184–191, /10.1080/17538947.2013.805262.
https://doi.org/10.1016/j.rse.2016.02.019. —, D. Wang, T. He, and Y. Yu, 2019: Remote sensing of Earth’s energy budget:
—, S. L. Liang, X. Q. Wei, Y. J. Yao, L. Q. Yang, X. T. Zhang, and D. Y. Liu, 2018: Vali- Synthesis and review. Int. J. Digital Earth, 12, 737–780, https://doi.org/10.10
dation of Global Land Surface Satellite (GLASS) fractional vegetation cover 80/17538947.2019.1597189.
product from MODIS data in an agricultural region. Remote Sens. Lett., 9, Liu, N., Q. Liu, L. Wang, S. Liang, J. Wen, Y. Qu, and S. Liu, 2013: A statistics-based
847–856, https://doi.org/10.1080/2150704X.2018.1484958. temporal filter algorithm to map spatiotemporally continuous shortwave al-
—, and Coauthors, 2019: Long-term Global Land Surface Satellite (GLASS) bedo from MODIS data. Hydrol. Earth Syst. Sci., 17, 2121–2129, https://doi.
fractional vegetation cover product derived from MODIS and AVHRR data. org/10.5194/hess-17-2121-2013.
IEEE J. Sel. Top. Appl. Earth Obs. Remote Sens., 12, 508–518, https://doi. Liu, P., L. Hao, C. Pan, D. Zhou, Y. Liu, and G. Sun, 2017: Combined effects of
org/10.1109/JSTARS.2018.2854293. climate and land management on watershed vegetation dynamics in an
Jia, W., M. Liu, D. Wang, H. He, P. Shi, Y. Li, and Y. Wang, 2018: Uncertainty in simu- arid environment. Sci. Total Environ., 589, 73–88, https://doi.org/10.1016/
lating regional gross primary productivity from satellite-based models over j.scitotenv.2017.02.210.
northern China grassland. Ecol. Indic., 88, 134–143, https://doi.org/10.1016/j. Liu, Q., L. Wang, Y. Qu, N. Liu, S. Liu, H. Tang, and S. Liang, 2013: Preliminary evalu-
ecolind.2018.01.028. ation of the long-term GLASS albedo product. Int. J. Digital Earth, 6, 69–95,
Jiang, B., Y. Zhang, S. Liang, X. Zhang, and Z. Xiao, 2014: Surface daytime net ra- https://doi.org/10.1080/17538947.2013.804601.
diation estimation using artificial neural networks. Remote Sens., 6, 11 031– Liu, W., and Coauthors, 2016: Hydrological recovery in two large forested wa-
11 050, https://doi.org/10.3390/rs61111031. tersheds of southeastern China: The importance of watershed properties in
—, and Coauthors, 2015: Empirical estimation of daytime net radiation from determining hydrological responses to reforestation. Hydrol. Earth Syst. Sci.,
shortwave radiation and ancillary information. Agric. For. Meteor., 211–212, 20, 4747–4756, https://doi.org/10.5194/hess-20-4747-2016.
23–36, https://doi.org/10.1016/j.agrformet.2015.05.003. Liu, X., B.-H. Tang, G. Yan, Z.-L. Li, and S. Liang, 2019: Retrieval of global orbit
—, and Coauthors, 2019: Validation of the surface daytime net radiation prod- drift corrected land surface temperature from long-term AVHRR data. Remote
uct from version 4.0 GLASS product suite. IEEE Geosci. Remote Sens. Lett., 16, Sens., 11, 2843, https://doi.org/10.3390/rs11232843.
509–513, https://doi.org/10.1109/LGRS.2018.2877625. Liu, Y. B., and Coauthors, 2018: Satellite-derived LAI products exhibit large dis-
Jiapaer, G., S. Liang, Q. X. Yi, and J. P. Liu, 2015: Vegetation dynamics and respons- crepancies and can lead to substantial uncertainty in simulated carbon and
es to recent climate change in Xinjiang using leaf area index as an indicator. water fluxes. Remote Sens. Environ., 206, 174–188, https://doi.org/10.1016/j.
Ecol. Indic., 58, 64–76, https://doi.org/10.1016/j.ecolind.2015.05.036. rse.2017.12.024.
Jin, M., and S. Liang, 2006: Improve land surface emissivity parameter for land Liu, Z., Q. Shao, and J. Liu, 2015: The performances of MODIS-GPP and-ET prod-
surface models using global remote sensing observations. J. Climate, 19, ucts in China and their sensitivity to input data (FPAR/LAI). Remote Sens., 7,
2867–2881, https://doi.org/10.1175/JCLI3720.1. 135–152, https://doi.org/10.3390/rs70100135.
Kanniah, K. D., J. Beringer, L. B. Hutley, N. J. Tapper, and X. Zhu, 2009: Evaluation Ma, H., Q. Liu, S. Liang, and Z. Xiao, 2017a: Simultaneous estimation of leaf area
of collections 4 and 5 of the MODIS gross primary productivity product and al- index, fraction of absorbed photosynthetically active radiation and surface
gorithm improvement at a tropical savanna site in northern Australia. Remote albedo from multiple-satellite data. IEEE Trans. Geosci. Remote Sens., 55,
Sens. Environ., 113, 1808–1822, https://doi.org/10.1016/j.rse.2009.04.013. 4334–4354, https://doi.org/10.1109/TGRS.2017.2691542.
AMERICAN METEOROLOGICAL SOCIETY
Unauthenticated 021 E335
F E B R UA RY| 2Downloaded 04/05/21 05:52 AM UTCYou can also read