De Novo assembly of the goldfish (Carassius auratus) genome and the evolution of genes after whole genome duplication - bioRxiv
←
→
Page content transcription
If your browser does not render page correctly, please read the page content below
bioRxiv preprint first posted online Jul. 20, 2018; doi: http://dx.doi.org/10.1101/373431. The copyright holder for this preprint
(which was not peer-reviewed) is the author/funder. This article is a US Government work. It is not subject to copyright under 17
                                 USC 105 and is also made available for use under a CC0 license.

     De Novo assembly of the goldfish (Carassius auratus) genome and
     the evolution of genes after whole genome duplication
     Zelin Chen1*, Yoshihiro Omori2*, Sergey Koren3, Takuya Shirokiya4, Takuo Kuroda4,
     Atsushi Miyamoto4, Hironori Wada5,6, Asao Fujiyama7, Atsushi Toyoda7,8, Suiyuan
     Zhang3, Tyra G. Wolfsberg3, Koichi Kawakami5, Adam M. Phillippy3, NISC Comparative
     Sequencing Program9, James C. Mullikin9,10, and Shawn M. Burgess1^

     1 Translational and Functional Genomics Branch, National Human Genome Research Institute,
     Bethesda MD, USA
     2 Laboratory for Molecular and Developmental Biology, Institute for Protein Research, Osaka
     University, Suita, Osaka, Japan
     3 Computational and Statistical Genomics Branch, National Human Genome Research Institute,
     Bethesda MD, USA
     4 Yatomi Station, Aichi Fisheries Research Institute, Yatomi, Aichi, Japan
     5 Division of Molecular and Developmental Biology, National Institute of Genetics, Mishima,
     Shizuoka, Japan
     6 Present address: College of Liberal Arts and Sciences, Kitasato University, Sagamihara,
     Kanagawa, Japan
     7 Advanced Genomics Center, National Institute of Genetics, Mishima, Shizuoka, Japan
     8 Center for Information Biology, National Institute of Genetics, Mishima, Shizuoka, Japan
     9 NIH Intramural Sequencing Center, National Human Genome Research Institute, Bethesda MD,
     USA
     10 Cancer Genetics and Comparative Genomics Branch, National Human Genome Research
     Institute, Bethesda MD, USA

     *Authors contributed equally
     ^Corresponding author: burgess@mail.nih.gov

     Summary
            For over a thousand years throughout Asia, the common goldfish (Carassius
     auratus) was raised for both food and as an ornamental pet. Selective breeding over more
     than 500 years has created a wide array of body and pigmentation variation particularly
     valued by ornamental fish enthusiasts. As a very close relative of the common carp
     (Cyprinus carpio), goldfish shares the recent genome duplication that occurred
     approximately 14-16 million years ago (mya) in their common ancestor. The combination
     of centuries of breeding and a wide array of interesting body morphologies is an exciting
     opportunity to link genotype to phenotype as well as understanding the dynamics of
     genome evolution and speciation. Here we generated a high-quality draft sequence of a
     “Wakin” goldfish using 71X PacBio long-reads. We identified 70,324 coding genes and
     more than 11,000 non-coding transcripts. We found that the two sub-genomes in goldfish
     retained extensive synteny and collinearity between goldfish and zebrafish. However,
     “ohnologous” genes were lost quickly after the carp whole-genome duplication, and the
     expression of 30% of the retained duplicated gene diverged significantly across seven
     tissues sampled. Loss of sequence identity and/or exons determined the divergence of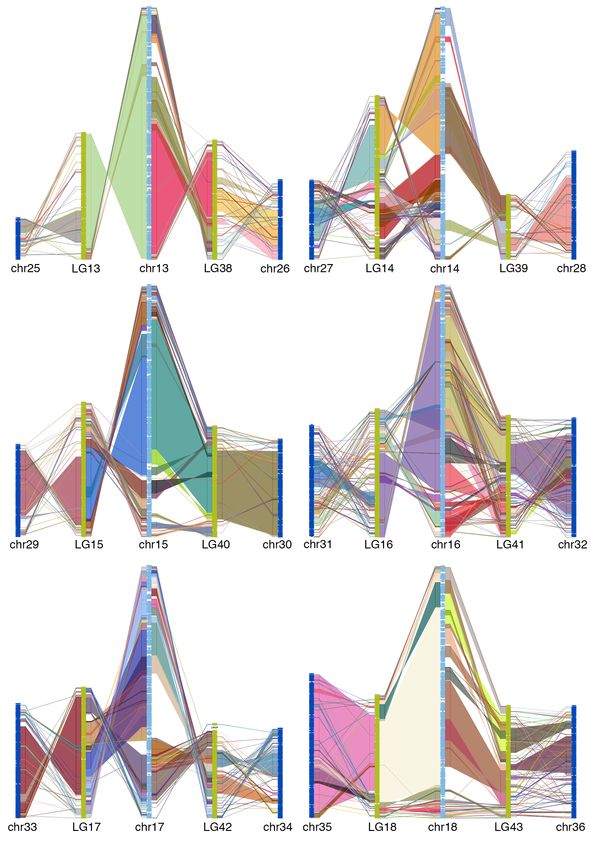
bioRxiv preprint first posted online Jul. 20, 2018; doi: http://dx.doi.org/10.1101/373431. The copyright holder for this preprint
(which was not peer-reviewed) is the author/funder. This article is a US Government work. It is not subject to copyright under 17
                                 USC 105 and is also made available for use under a CC0 license.

     the expression across all tissues, while loss of conserved, non-coding elements
     determined expression variance between different tissues. This draft assembly also
     provides an important resource for comparative genomics with the very commonly used
     zebrafish model (Danio rerio), and for understanding the underlying genetic causes of
     goldfish variants.

     Introduction
             The best estimate based on mitochondrial DNA analysis from domesticated and
     wild-caught goldfish is that domesticated goldfish were derived from fish in southern Asia,
     possibly from the lower Yangtze River 1. More than one thousand years of ornamental
     breeding history has generated more than 300 goldfish variants in body shape, fin
     configuration, eye style and coloration 2, which makes goldfish and excellent genetic
     model system for understanding the evolution of body shape 2. In addition, goldfish have
     long been used in research to study a wide array of biological processes such as
     pigmentation 3,4, disease and environment 5,6, behavior 7, physiology 8, neurobiology 9,10,
     reproduction and growth 11, and neuroendocrine signaling 12.
             Like the closely related common carp, goldfish experienced the same whole-
     genome duplication event (WGD) ≈8-12 million years ago (Mya), which is believed to
     have been an allotetraploidy event (i.e. the fusion without chromosome loss of two closely
     related species) 13 (figure 1c). This fusion occurred after divergence from grass carp
     (Ctenopharyngodon idella), but before goldfish diverged from the common carp. This
     event is quite recent compared to other animal WGD events like the one that occurred in
     teleosts (320-350 Mya) 14, in the Salmoniformes like salmon (50-80 Mya) 15, and the
     allotetraploid event of Xenopus laevis (17–18 Mya) 16, and we now have two different
     species that resulted from the same genome duplication event with near-complete
     genome sequences. Thus, comparing how the goldfish genome has diverged from the
     common carp provides an excellent opportunity to study how genomes change during the
     course of speciation. In addition, the relative evolutionary proximity of goldfish and carp
     to the commonly used model organism zebrafish, provides new reference sequences for
     identifying conserved elements involved in gene regulation (conserved non-coding
     elements or CNE’s) 17,18, at sensitivities not available from comparing much more distantly
     related genomes.
             Here we report a contiguous, accurate, and proximate-complete genome
     assembly of a common goldfish line, Wakin, and shed light on how the genome and gene
     expression evolved after the carp WGD. The genome represents an essential resource
     for the study of the greater than 300 goldfish variants and for the understanding of
     genome evolution in related fish species.

     Results

     Genomic assembly and annotation

     The estimated size of the of goldfish genome ranges from 1.6 pg to 2.08 pg according to
     the Animal Genome Size Database 19, similar to that of the common carp (1.8pg). Using
     a Wakin goldfish generated by heat-shock gynogenesis 20 (figure 1a), we generated
     ~16.4M reads (71X coverage) from Pacbio SMRT cells, which were corrected and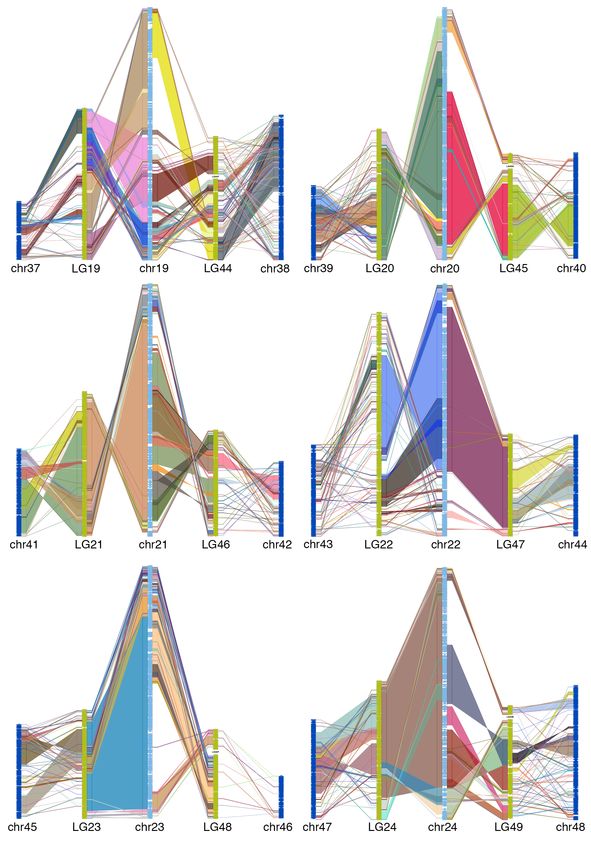
bioRxiv preprint first posted online Jul. 20, 2018; doi: http://dx.doi.org/10.1101/373431. The copyright holder for this preprint
(which was not peer-reviewed) is the author/funder. This article is a US Government work. It is not subject to copyright under 17
                                 USC 105 and is also made available for use under a CC0 license.

     assembled into 9,415 contigs by the Canu assembler. The Canu assembly is ~1,849 Mbp
     with an N50 of 817 kbp. 6,937 contigs (497 Mbp) were of relative read coverage 1%). Goldfish contains more LINEs but fewer SINE and DNA transposons than
     zebrafish (figure 1b and supplemental table 3). A fully implemented UCSC browser of
     carAur01 is available at: https://research.nhgri.nih.gov/goldfish/ (supplemental figure 2).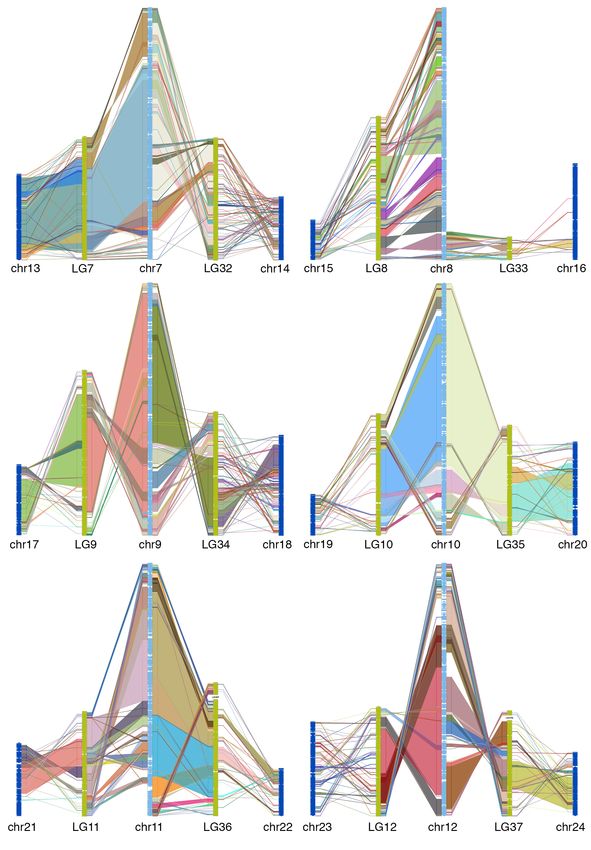
bioRxiv preprint first posted online Jul. 20, 2018; doi: http://dx.doi.org/10.1101/373431. The copyright holder for this preprint
(which was not peer-reviewed) is the author/funder. This article is a US Government work. It is not subject to copyright under 17
                                 USC 105 and is also made available for use under a CC0 license.

     We sequenced and assembled total RNA from seven adult tissues (brain, gill, bone, eye
     heart, skeletal muscle, and fin). Maker identified 80,062 protein coding genes 9,738
     genes were masked because they were duplicated in the heterozygous regions. The final
     assembly, carAur01, contained 70,324 unmasked gene models and 479,594 exons. The
     gene completeness was assessed by Benchmarking Universal Single-Copy Orthologs
     (BUSCO) 28 using the vertebrate core gene sets, resulting in 2,710 complete (90%), 157
     fragmented (5%), and 156 (5%) missing BUSCOs out of 3,023 total BUSCOs (see table
     2 and supplemental table 4). 58% of the BUSCO genes could be found in two complete
     copies. 83.11% to 96.93% of the RNA-seq reads from seven goldfish tissues could be
     mapped to the assembly. These assessments indicated our gene models were of very
     good quality and significantly more complete than that of the published common carp
     assembly. Based on Ensembl alignment evidence, we predicted 11,820 non-coding RNA
     transcripts, include 574 micro RNAs. miRBase hairpin sequence alignment identified
     1,037 microRNA loci.

        Fig 1. (a) The gynogenetic goldfish used for sequencing before sacrifice. (b) Transposable
        elements distribution for goldfish and zebrafish. (c) Distribution of orthologous/ohnologous
        gene pairs by synonymous substitution among four species: zebrafish, grass carp, common
        carp and goldfish. Numbers are a count of the homologous genes shared among zebrafish
        (ZF), common carp(CC) and goldfish (GF). (d) Rate of synonymous base changes (dS) for
        various species comparisons. (e) The phylogenetic tree shows the time of divergence of
        grass carp (GC) from goldfish and common carp (green circle), the whole genome
        duplication (red triangle) and divergence common carp and goldfish (cyan square). Each
        subgenome from the duplication was analyzed separately and are denoted with _1 or _2 for
        both common carp and goldfish. Diversion rates were similar for each subgenome.

     ~50,000 coding gene had a RBH (reciprocal best hit) or second best hit to genes in
     zebrafish, grass carp or common carp. 24,026 genes hit to all three species (figure 1c).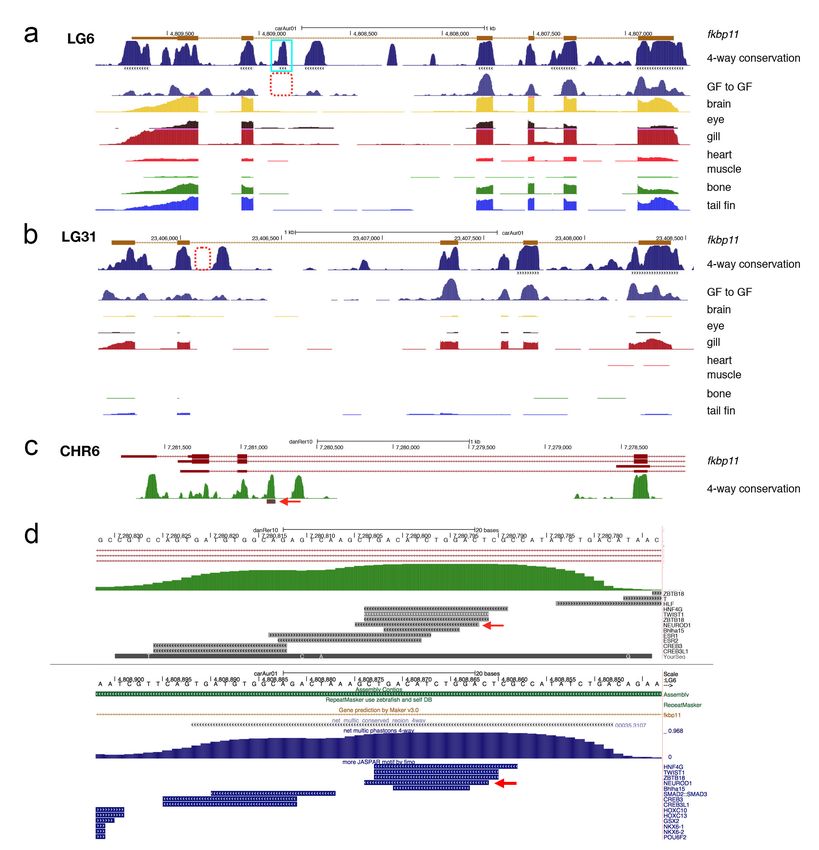
bioRxiv preprint first posted online Jul. 20, 2018; doi: http://dx.doi.org/10.1101/373431. The copyright holder for this preprint
(which was not peer-reviewed) is the author/funder. This article is a US Government work. It is not subject to copyright under 17
USC 105 and is also made available for use under a CC0 license.
The spectrum of synonymous substitutions (dS) between RBH pairs showed peaks at
0.115, 0.205, 0.415 for common carp-goldfish (figure 1d, CC vs. GF), between goldfish
WGD paralogs (figure 1d, GF vs. GF) and zebrafish-goldfish (figure 1d, ZF vs. GF)
comparisons respectively. As expected, this indicated that the whole genome duplication
event happened before the divergence of goldfish and common carp. Based on the ML
phylogenetic tree and using 20.5 mya for the grass carp – common carp divergence point,
we deduced the speciation time for common carp and goldfish was ~11.0 Mya and the
WGD time was ~14.4 Mya (figure 1e), which is consistent with Larhammer and Risinger’s
estimate 29, but slightly longer ago than other more recent publications’ predictions 13,23.
Extensive retention of synteny and collinearity after WGD
Though goldfish diverge from zebrafish ~60 mya, the genome of goldfish retained
extensive collinearity/synteny with that of zebrafish. 97.4% of RBH or second best
ortholog gene pairs between goldfish and zebrafish are located in the 25 synteny triples,
including one zebrafish chromosome and two corresponding goldfish LGs. No large inter-
chromosome translocations were found between the 25 zebrafish chromosomes and the
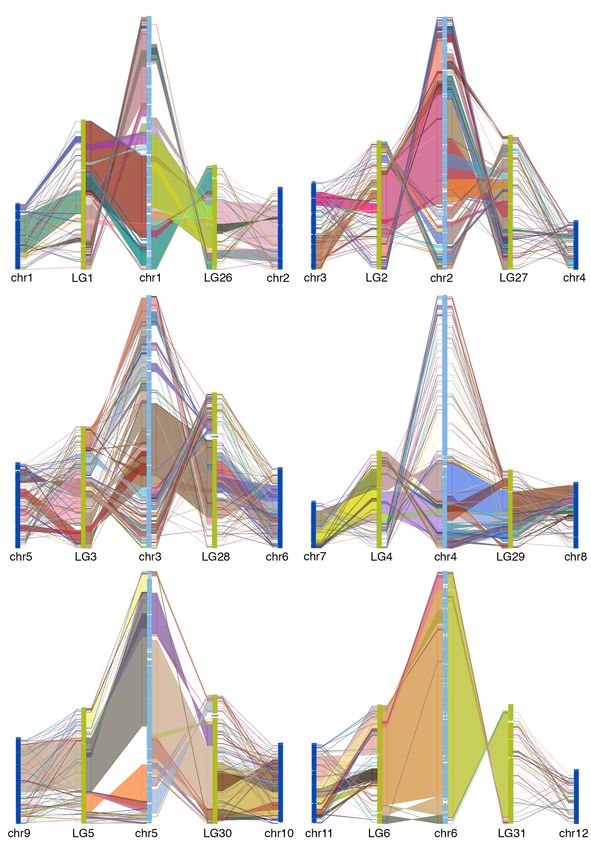
50 goldfish LGs (figure 2). This is consistent with the WGD (allotetraploid) hypothesis 13.
Alignment between zebrafish chromosome and two WGD descended goldfish LGs shows
large collinear block, thought there are large intra-chromosomal rearrangements (figure
3, supplemental figure 7), which indicated that the gene order in goldfish genome
remained stable after divergence from zebrafish.
Only 55.3% of RBH orthologous pairs were located in the 25 LG quadruplets (2 goldfish
paralog LGs and 2 common carp paralog LGs derived from the same WGD ancestral
chromosome), and there are also plenty of inter-chromosomal translocations between the
paralog LGs, suggesting intensive inter-chromosome translocations between common
carp LGs after the WGD, especially after speciation from goldfish (figure 2). Comparisons
between common carp and goldfish orthologous LGs suggested there were some small,
inter-chromosome translocations though they maintained very strong colinearity (figure
3, supplemental figure 7).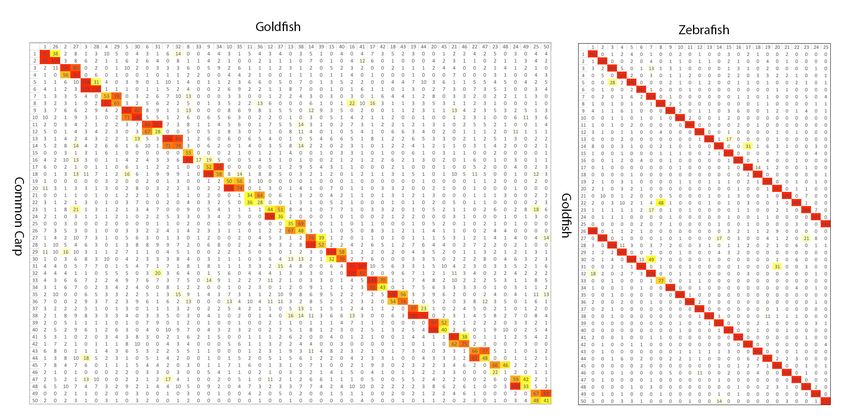
bioRxiv preprint first posted online Jul. 20, 2018; doi: http://dx.doi.org/10.1101/373431. The copyright holder for this preprint
(which was not peer-reviewed) is the author/funder. This article is a US Government work. It is not subject to copyright under 17
                                 USC 105 and is also made available for use under a CC0 license.

        Fig 2. Reciprocal BLAST best gene pair counts for each pair of chromosomes. Left:
        goldfish and common carp. Right: goldfish and zebrafish. Color from yellow to red
        indicates low to high counts. Goldfish to common carp results in 50 bivalents and goldfish
        to zebrafish shows a clear 1:2 relationship.

        Fig 3. Chain alignment along zebrafish chromosome 6 and the two duplicated
        chromosomes from goldfish and common carp. Very large stretches of collinearity are
        readily visible between zebrafish and goldfish as are simple intra-chromosomal
bioRxiv preprint first posted online Jul. 20, 2018; doi: http://dx.doi.org/10.1101/373431. The copyright holder for this preprint
(which was not peer-reviewed) is the author/funder. This article is a US Government work. It is not subject to copyright under 17
                                 USC 105 and is also made available for use under a CC0 license.

        inversions. The more fragmented relationship with common carp (e.g. chr12) may be a
        result of a more fragmented assembly.

     Table 2. Annotations statistics
                          Goldfish                                          Common Carp                      Zebrafish
                                                                                                             (danRer10)
      Assembly Size 1,820,635,051                                           1,713,641,436                    1,371,719,383
      (bp)
      GC content        37.48%                                              36.99%                           36.64%
      Repeats (bp)      721,087,053                                         672,246,354                      745,150,642
                        (39.6%)                                             (39.2%)                          (54.3%)
      Genes             70,324                                              66,999                           32,105
      Genes with GO     49,272                                              -                                18,779
      Exons             556,731                                             547,164                          276,021
      Genes        with 49,272                                              44,845                           24,204
      Interpro
      miRNA             1,037                                               -                                769
      ncRNA             11,820                                              -                                -
      4-way      CNE* 486,767                                               484,139                          237,891
      counts
      4-way CNE bp      95,815,233                                          97,818,440                       44,090,004
      Missing BUSCOs 167                                              N/A   330(used  for
      (of 3,023)                                                      original     BUSCO
                                                                      set)
     * Conserved, Noncoding Elements (i.e. potential enhancers/promoters)

     Evolution after whole genome duplication

     Four available fish genomes in the Cyprinidae family, zebrafish, grass carp, common
     carp, and now goldfish, possess a very useful evolutionary relationship that allows us to
     directly examine the processes of gene nonfunctionalization, subfunctionalization, and
     neofunctionalization 30 over a short time (10~20 My) after WGD. Zebrafish is distantly and
     equally related to all three carps (common ancestor was ~60 mya, roughly similar to a
     human to mouse genomic comparison), such that the conserved sequences from
     zebrafish to carp are limited to exonic sequences and conserved non-coding elements
     (CNEs) 17,18 that are strongly enriched for enhancers and promoters. Common carp and
     goldfish speciated from grass carp ~20 Mya 31, the genome duplication occurred ~14 Mya
     and then goldfish and common carp speciated roughly 11 Mya (figure 1e). This timeline
     allows us to watch as duplicated genes naturally decay from the tetraploid state as was
     done for common carp 32, and the common carp, goldfish separation allows us to watch
     this occur twice in parallel.

     Gene loss

     We should be able to map one grass carp or zebrafish gene to two goldfish or common
     carp ohnologous genes. We identified 17,950 ortholog-paralog gene clusters with at least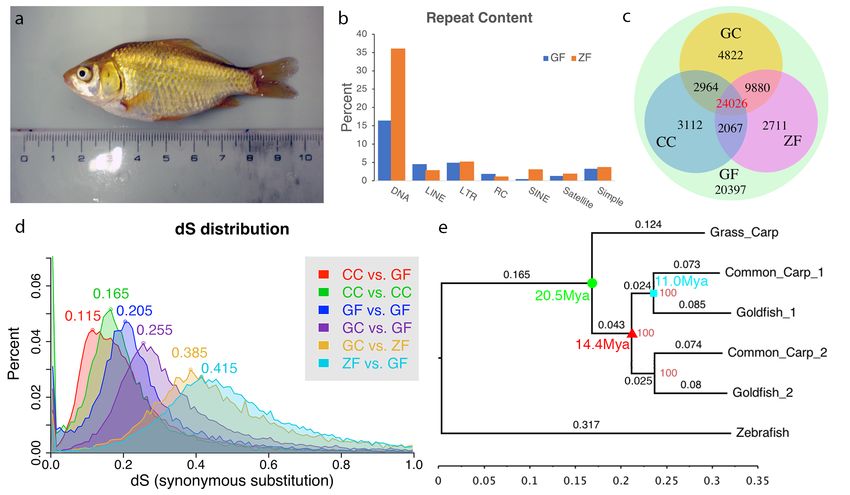
bioRxiv preprint first posted online Jul. 20, 2018; doi: http://dx.doi.org/10.1101/373431. The copyright holder for this preprint
(which was not peer-reviewed) is the author/funder. This article is a US Government work. It is not subject to copyright under 17
                                 USC 105 and is also made available for use under a CC0 license.

     one zebrafish gene in each cluster. There are 15,011 (11,812) clusters with both paralogs
     retained and 2,503 (5,030) singletons in goldfish (common carp). Therefore, 14% of the
     duplicated gene pairs have lost one copy in goldfish while common carp appears to have
     had a higher rate of gene loss (28%) (supplemental figure 8). The higher loss rates in
     common carp may reflect the more fragmented assembly of that genome and not an
     actual increase in gene loss as is suggested through the lower completeness of the
     BUSCO genes in the common carp assembly (Table 2). Additionally, 649 (3.6%) of
     clusters with both ohnologs retained do not express both ohnologs in any of the seven
     tissues, suggesting they may be pseudogenes. In total 18% (1.3% per My) of WGD
     ancestor genes lost function in one ohnolog in goldfish during ~14 My, compared to 45%
     (0.56% per my) loss in salmon during 80 My after the salmon WGD 15 and the
     approximately 10% gene loss that occurred between zebrafish and grass carp over 60
     My, suggesting gene loss rate increased after WGD event, which is supported by the
     observed faster loss (44% in 18 my or 2.4% per My) in X. laevis after the frog allotetraploid
     event 16. We then went on to ask if there were specific classes of genes that were either
     more or less likely than average to be lost. We examined the percentage of genes in a
     GO term category that were lost compared to the total percentage the category
     represented. Oxidoreductase activity, nuclease activity, and methyltransferase activity
     were much more likely than average to be lost, while protein binding and transcription
     factors were retained at a higher than average rate (see supplemental figures 9).

     CNE loss

     We were able to analyze enhancer/promoter loss rates in a four-way comparison using
     CNE loss as the proxy for regulatory function. When we directly compared zebrafish and
     grass carp (using common carp or goldfish as the reference), 15,745 CNEs were not
     shared between them. Assuming they were lost either in zebrafish or grass carp, we
     estimated the lost rate was 131 CNEs per My. Using zebrafish as the reference, 3,611
     CNEs were lost during the 40 My (or 90 CNEs per My) to grass carp. There are 329 CNEs
     (54 CNEs per My) where the two duplicated copies are missing in both goldfish and
     common carp. These are CNE losses that presumably happened after the split from grass
     carp, but before the whole genome duplication. Goldfish and common carp share 4,316
     one-copy CNE losses, presumably all or most of those occurred in the 3 My between the
     genome duplication and speciation events, resulting in a rate of 1,439 per My. In the ~11
     My since the common carp/goldfish split, 16,102 and 28,937 CNE paralog pairs became
     singleton or totally lost in goldfish and common carp respectively, or 1,463 and 2,631
     CNEs per My. (supplemental figure 8). The above scenario indicates an accelerated CNE
     loss after the WGD and the effect persisted after the speciation of goldfish and common
     carp.

     Divergence of gene expression

     It is logical to assume that as a genome goes through the evolutionary process of re-
     diploidization, genes that were once duplicates of each other, will begin to diverge in
     location of expression or in specific function from each other. The goldfish/carp
     duplication event was relatively recent, which make it possible to illuminate how sequence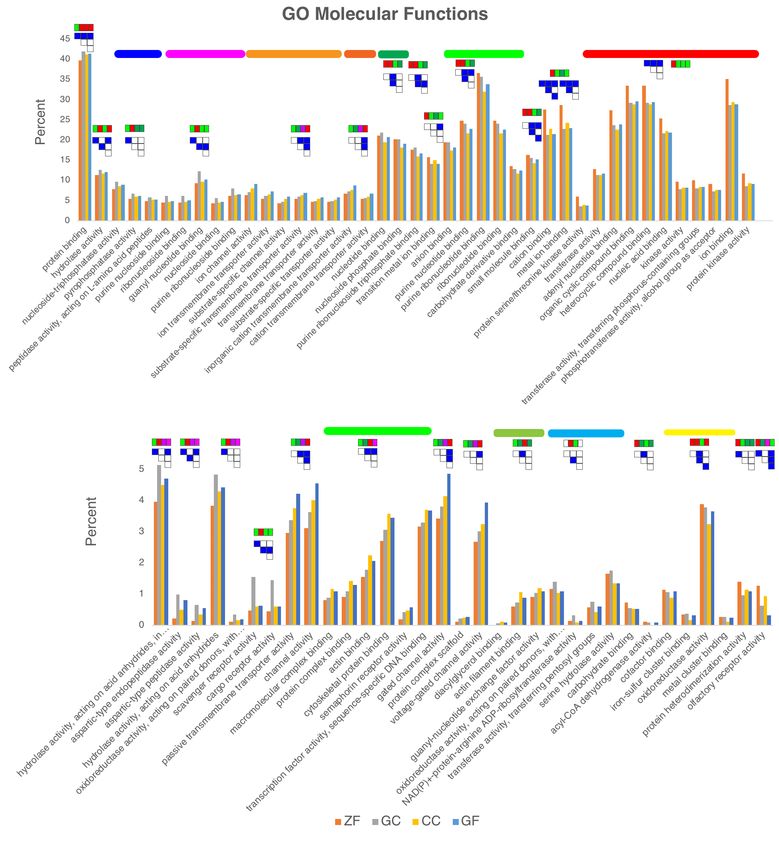
bioRxiv preprint first posted online Jul. 20, 2018; doi: http://dx.doi.org/10.1101/373431. The copyright holder for this preprint
(which was not peer-reviewed) is the author/funder. This article is a US Government work. It is not subject to copyright under 17
                                 USC 105 and is also made available for use under a CC0 license.

     divergence, exon loss, and CNE loss shaped the expression pattern of ohnolog genes in
     the ~14 My after the whole genome duplication. We identified 2,481 co-linear ohnolog
     blocks covering 1,004 Mbp of the carAur01 assembly, including 44,650 protein coding
     genes (6,385 singleton), 14,527 singleton exons and 8,617 singleton CNEs.

     We compared the RNA expression level between 10,399 ohnolog gene pairs (20,798
     genes) in the ohnolog blocks across 7 tissues. 6.2% (649) of these gene pairs contained
     one silenced gene (i.e. TPM=5) (figure
     4a). 1,273 (13%) ohnolog pairs were tissue-specific (i.e. one gene expressed in one
     tissue, while the other gene silenced in the same tissue).

     In order to illuminate which type of mutations contributed most to the divergence of the
     expression between ohnolog gene pairs, we divided these gene pairs into different groups
     according to their cDNA sequence identity, number of exons lost, or number of CNE lost
     and looked for correlations between group assignment and expression divergence. We
     found that in the low sequence identity groups there was greater percentage of diverged
     gene pairs and a lower percentage of diverged gene pairs in the high sequence identity
     groups (figure 4b yellow line), while the trend was reversed for less diverged gene pairs
     (figure 4b blue line), indicating that expression distance increased as the sequence
     identity decreased. There is significant increase in expression distance between the no-
     exon-lost group and the one-exon-lost group (one-sided Fisher exact test p=5.87e-07).
     The more exons were lost, the more the expression diverged (figure 4c). We did not find
     a significant relationship between the number of nearby CNE lost and the expression
     distance or correlation. However, in the ohnolog gene pairs with CNE loss but no exon
     loss, the tissue expression standard deviation decreased in the genes that lost CNEs
     (one-sided Fisher exact test p=0.008), which indicated that the loss of CNE reduced the
     expression variance among different tissues, rather than affecting the expression
     divergence between ohnolog gene pairs. I.e. CNE loss reduced tissue specific expression
     differences (figure 4d, example in supplemental figure 11)33.

     19,500 genes (or 9,750 gene pairs, not include the silenced singletons) were classified
     into 20 clusters according to a plateau in their expression Euclidean distance (figure 4e
     and supplemental figures 12-14). Ohnologs were classified into different clusters in 62.4%
     of gene pairs, which decrease to 46.9% when we classified into 8 clusters (another local
     plateau), suggesting either a rapid expression divergence between ohnolog gene pairs in
     the first ~14My after the WGD event or some significant differences in gene expression
     that existed before the allotetraploid fusion event. Most of shared gene pairs fell within
     two super clusters, clusters 1-9 (figure 4e, blue curve bundles) and clusters 12-20 (figure
     4e, red curve bundles). However, there are 2,508 gene pairs that are not in the same
     cluster within the two different super clusters. We found that there are fewer numbers of
     genes with lost exons or CNEs in the four most highly expressed clusters (10,11,12,15),
     especially in the highest expression cluster 10, in which there are no exon or CNE losses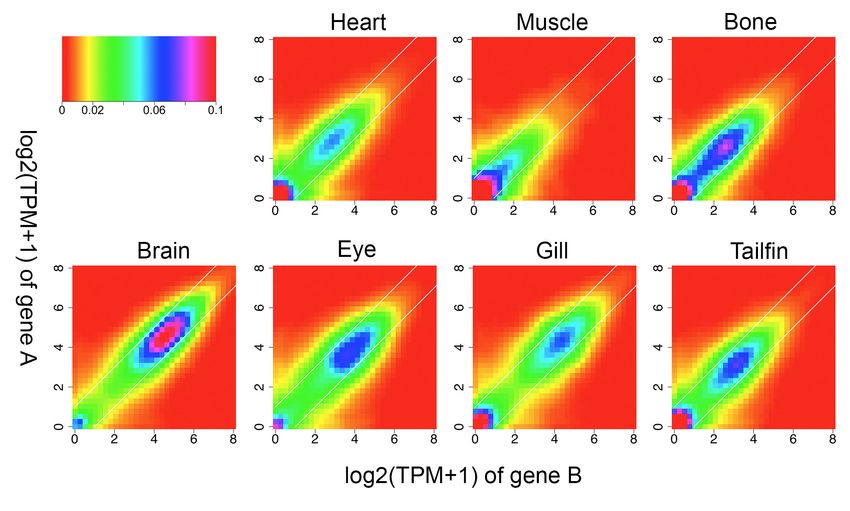
bioRxiv preprint first posted online Jul. 20, 2018; doi: http://dx.doi.org/10.1101/373431. The copyright holder for this preprint
(which was not peer-reviewed) is the author/funder. This article is a US Government work. It is not subject to copyright under 17
                                 USC 105 and is also made available for use under a CC0 license.

     between the pairs. Similar to gene loss, genes that were more likely to maintain
     concordant expression were often involved in cell signaling and gene regulation (signaling
     molecules and transcription factors) (supplemental figure 15).

        Figure 4. (a) Histogram of expression correlation (X-axis) and expression Euclidean
        distance (Y-axis) between WGD ohnolog gene pairs. Each box lists the number of ohnolog
        pairs (X2 for total genes) and the percentage of the total number of pairs this group
        represents. The majority of genes (70.3%) had a correlation of 0.6 or better. (b) expression
        distance distribution in different cDNA identity groups. The more closely related the cDNA
        sequence, the more closely correlated gene expression was. (c) Boxplot of expression
        distance in gene groups with different numbers of lost exons. The more exons lost the less
        related gene expression becomes. Asterisks mark statistically significant differences. (d)
        Boxplot of tissue expression standard deviation in gene groups with different numbers of
        CNEs lost. Similar to exons, loss of CNEs correlates with loss of concordant expression, but
        the effect size is smaller. Asterisks denote significant differences. (e) Gene expression
        clustered into 20 groups for the 19,500 ohnolog genes. Heatmap and the keys indicate the
        value of log2(TPM+1). Left color bar indicates different clusters. Right bars show the number
        and percentage of the gene pairs in the same cluster. Colored links indicate the number of
        gene pairs split between different clusters, only numbers large than 100 were plotted, thicker
        links indicate larger counts.

     Discussion

     Steady improvements in sequencing technology and reductions in cost are improving our
     ability to generate high-quality genomic sequences, even in cases such as the goldfish,
bioRxiv preprint first posted online Jul. 20, 2018; doi: http://dx.doi.org/10.1101/373431. The copyright holder for this preprint
(which was not peer-reviewed) is the author/funder. This article is a US Government work. It is not subject to copyright under 17
USC 105 and is also made available for use under a CC0 license.
where the efforts are complicated by a recent whole genome duplication. Interest in the
goldfish has a long history and goldfish still maintain a special position in both the scientific
and ornamental fish communities. We have generated and made publicly available, a
high-quality, annotated assembly of the goldfish genome. Our genomic assembly and
gene annotations represents an important resource to these communities as they
continue to link phenotypes to genotypes. In addition, the cluster of sequenced genomes
that includes zebrafish, grass carp, common carp, and goldfish are nicely situated in their
evolutionary relationship to provide further insights into the process of re-diploidization
after a whole genome duplication. Comparing loss rates between that of zebrafish to
grass carp and zebrafish to goldfish, despite a lower quality assembly, grass carp shows
half as many gene losses as goldfish consistent with a hypothesis of accelerated gene
copy loss after the whole-genome duplication. However, some functional classes of
genes such as transcription factors were more likely to be preserved in two copies.
Several other features of genome sequence evolution impact how gene pairs diverge in
expression over time. Key factors include divergence of the primary genomic sequence
through base substitution, loss of exons through deletion, and loss of conserved, non-
coding elements, all of which impact gene expression in different ways. This process is
one that has been proposed to be a critical evolutionary phenomenon that drives
vertebrate diversity and the goldfish/carp speciation is a useful case to explore this
evolutionary process.
Acknowledgements
This work was supported by Grant–in-Aid for Scientific Research (C) (16K08583 to Y.O.)
from the Japan Society for the Promotion of Science (JSPS) and NIG Collaborative
Research Program (2016B5) to Y.O. This research is also funded by the Intramural
Research Program of the National Human Genome Research Institute; National Institutes
of Health (S.M.B.: 1ZIAHG000183; J.C.M.: 1ZIBHG000196; and A.M.P.:
1ZIAHG200398).bioRxiv preprint first posted online Jul. 20, 2018; doi: http://dx.doi.org/10.1101/373431. The copyright holder for this preprint
(which was not peer-reviewed) is the author/funder. This article is a US Government work. It is not subject to copyright under 17
USC 105 and is also made available for use under a CC0 license.
Methods
Additional methods and assembly information is included in supplementary materials.
Preparation of genomic DNA and total RNA from goldfish
Gynogenic offspring were generated as previously described with some modifications 20.
The Wakin goldfish eggs were treated with common carp sperm irradiated by UV-light
(8000erg/mm2). After 34 min incubation at 20°C the eggs were subjected to post-
fertilization heat-shock treatment at 40°C for 40 sec. After 1 min incubation at 20°C the
eggs were subjected to second heat-shock treatment at 40°C for 40 sec. After heat-shock
treatment the fertilized eggs were incubated at 20°C. The muscle tissue was dissected
from gynogenic goldfish at 3 months of age, and high molecular weight Genomic DNA
were purified using TissueLyser II (Qiagen) and Blood & Cell Culture DNA Maxi Kit
(Qiagen). The molecular size of genomic DNA at the peak of 40- to 50-kb was confirmed
using Pippin pulse electroporation system (NIPPON genetics). Tissues for RNA-seq were
dissected from Wakin goldfish at two years of age and were stored in RNAlater (Sigma)
at -80°C. Total RNA was purified using TRIzol reagent (Invitrogen) from these tissues. All
procedures were approved by the Animal Experimental Committees of the Institute for
Protein Research at Osaka University, and were performed in compliance with the
institutional guidelines.
Genome Assembly
Genomic DNA from the samples described above were used to perform whole-genome
shotgun sequencing on a PacBio RS II sequencer. ~16.4M Pacbio subreads (~71X) with
peak length of ~8kbp were corrected and assembled into 9,415 contigs using the Canu
assembler and improved the accuracy using Arrow 34. Total length of the assembly is
1,848 Mb and N50 reached 816.8kbp. The longest contig is 12.8Mbp. We remapped all
Pacbio subreads to this assembly and found that 6,607 contigs had read coverage less
than 0.6 with a total length is 596 Mbp. The reason for this appears to be the heatshock
gynogenesis resulted in a meiosis II block creating heterogeneous diploid regions in
approximately 22% our fish genome, as opposed to the expected mitosis I block that
would have been fully homozygous. It is possible the fully homozygous fish in the heat
shocked samples were not viable because of too many potentially harmful mutations in
the background. The homozygous regions had 2,667 contigs (total length ~1,247Mbp)
with read coverage in a range of 0.6 to 1.8. This is consent with results from our Illumina
short-read sequencing which indicated about 1/4 of the genome was heterogeneous. By
summing all contig length normalized by read coverage, we obtained an actual genome
size of at least 1.6Gbp. To remove the alternate alleles from the primary assembly, all
contigs were aligned to one another other using nucmer 35 and 928 contigs fully contained
in other contigs were removed (when relative read coverage was 97% to prevent WGD ohnolog removal) , which was 27.3Mbp in total.
Linkage Group Construction
RNA-seq data from two goldfish parents and their family were download from NCBI
(bioproject:PRJEB12518) 21. All reads were trimmed using Trimmomatic (same
configuring as in Gene Annotation) and aligned to the Canu assembly using Hisat2 36.bioRxiv preprint first posted online Jul. 20, 2018; doi: http://dx.doi.org/10.1101/373431. The copyright holder for this preprint
(which was not peer-reviewed) is the author/funder. This article is a US Government work. It is not subject to copyright under 17
USC 105 and is also made available for use under a CC0 license.
Variant calling was performed via samtools mpileup and bcftools call (parameter ‘-m’) 37.
We identified ~5.6 M variants in total. SNPs without a matching genotype or low read
depth (= 3 markers) were broken at the position where read depth valley and depthwas < 20
and depth was in the < 20% quantile. In total, 16 contigs were broken. Contigs were
placed in each linkage group according to the ordered SNPs using chromonomer. After
manual corrections, 50 long linkage groups were retained and named according their
alignment to the zebrafish genome (e.g. LG1 and LG26 map to zebrafish chr1, LG2 and
LG27 map to zebrafish chr2, etc.).
Conserved Noncoding Element Annotation
All-to-all pairwise genomic alignment was performed using lastz (--gapped --
ambiguous=n --step=10 --strand=both --masking=10 --maxwordcount=500 --
identity=70..100 --format=axt) and axtToChain for four species (goldfish, common carp,
grass carp, zebrafish). Alignments in repeat regions were subtracted and transformed to
maf format, splitting at gaps longer than 30bp (chainToAxt –maxGap=30, then axtToMaf
-score). All the pairwise MAF files were transformed to multiple alignment MAF files using
roast (P=multic). Phylogenetic model were fit for each chromosome, linkage group or
scaffold using phyloFit (--tree '(ZF,(GC,(GF,CC)))' --subst-mod REV --nrate 4), which was
used by phastCons for computing conserve score and regions. The conserved regions
out of exons (of coding or noncoding genes) were defined as conserved noncoding
elements for each of the four species. DNA sequence were also extracted from these
elements.
Data deposition
PacBio raw reads have been deposited in the SRA, Project ID: PRJNA481500. The BioSample
accession is: SAMN09670328. Canu assembly deposited in GenBank under accession number
QPKE00000000.
Data release date Aug 1st, 2018.bioRxiv preprint first posted online Jul. 20, 2018; doi: http://dx.doi.org/10.1101/373431. The copyright holder for this preprint
(which was not peer-reviewed) is the author/funder. This article is a US Government work. It is not subject to copyright under 17
USC 105 and is also made available for use under a CC0 license.
Supplementary Methods and Analysis
Goldfish Genome Homepage
https://research.nhgri.nih.gov/goldfish/
De novo Assembly
Goldfish husbandry
Fertilized goldfish eggs were incubated at 20°C. After 3 to 5 days post-fertilization (dpf),
hatched goldfish larvae were fed brine shrimp (Artemia) twice per day. The water in tanks
for larvae was changed with fresh water incubated at 20°C every week. After 14 dpf,
goldfish were fed pellets once per day. The water in tanks for adult goldfish was changed
with fresh water every month. All procedures using goldfish were approved by the Animal
Experimental Committees of the Institute for Protein Research at Osaka University
(approval ID 29-03-0), and were performed according to the Guidelines for Animal
Experiments of Osaka University.
Genome Assembly
We obtained 16,671,136 reads longer than 1kbp, containing a total of 130 Gb with an
N50 length of 9,889 bases (table 1). All reads were corrected and assembled into 9415
contigs using Canu 34 and consensus accuracy improved using Arrow from the PacBio
software package. Total length of the Canu assembly is 1,848 Mb and N50 reached
816.8kbp, the longest contig was 12.8Mbp. We found that 6,937 contigs (~497Mbp) had
relative read coverage less than 0.6, which may be from the heterogeneous diploid region
of our fish sample, compared to 2,393 contigs (total length ~1347Mbp) with read coverage
in the range of 0.6 to 1.8, most likely from the homologous regions (table 2) This is
consistent with the 25-mer spectrum from our Illumina HiSeq2500 short read sequencing
(figure 1). By summing all contig lengths normalized by read coverage, we determined
the actual haploid genome size was at least 1.6Gbp. Contigs were aligned to self by using
nucmer 38. 928 contigs contained in other contigs with low read coverage were removed,
which was 27.3Mbp in total. All other contigs were retained.
Linkage Group Construction
RNA-seq data from two goldfish parents and their F1 offspring were download from NCBI
(bioproject:PRJEB12518) 21. All reads were trimmed using Trimmomatic 39 (same
configuring as in Gene Annotation) and aligned to the Canu assembly using hisat2 36.
Variant calling was performed via samtools mpileup and bcftools call (parameter ‘-m’) 37.
We obtained ~5.6 M variants in total. SNPs with missing genotype or low read depth (bioRxiv preprint first posted online Jul. 20, 2018; doi: http://dx.doi.org/10.1101/373431. The copyright holder for this preprint
(which was not peer-reviewed) is the author/funder. This article is a US Government work. It is not subject to copyright under 17
USC 105 and is also made available for use under a CC0 license.
We also required two SNPs on the same contig to be separated by at least 10Kbp. 14022
SNPs were kept after filtering and used for constructing genetic maps.
SNPs from the same contigs were grouped and ordered using ‘group’ and ‘seq.order’
from the R package ‘onemap’, with a LOD threshold of 5.5. Contigs with two or more
groups (with each >= 3 markers) were broken at position with read depth valley and depth
< 20 and depth < 20% quantile. In total, 16 contigs were broken. All SNPs were grouped
using ‘group’ in the ‘onemap’ package. SNPs in each group were ordered using
‘seq.order’. Contigs were placed in each linkage group according to the ordered SNPs
using chromonomer. After manual corrections, 50 long linkage groups were retained and
named according their alignment to the zebrafish genome (LG1 and LG26 map to
zebrafish chr1, LG2 and LG27 map to zebrafish chr2, and so on). Several short linkage
groups, which were named according to their zebrafish alignment, were also retained.
This assembly was named ‘carAur01’.
Genome Annotation
Repeat Masking and Gene Structure Annotation
A custom repeat library for goldfish was built using RepeatModeler
(http://www.repeatmasker.org/) based on the Canu assembly. Zebrafish and the custom
repeat library were used to mask the genome by RepeatMasker
(http://www.repeatmasker.org/, performed in MAKER3).
RNA-seq from seven goldfish tissues were performed to aid with gene annotation, include
bone, brain (3 samples), eye, gill (2 samples), heart, muscle and tailfin. RNA libraries
were prepared and sequenced on HiSeq2000 sequencer by NISC. All 2x125 pair-end
reads were trimmed using Trimmomatic (ILLUMINACLIP:adapters/TruSeq3-PE-
2.fa:2:30:10:8:true LEADING:3 SLIDINGWINDOW:20:20 MINLEN:40) and assembled
via Trinity assembler without a genome-guide 40. All assemblies were clustered via CDHIT
(-c 0.95 -aS 0.95 -uS 0.05), as EST evidence for Maker 3.0.
cDNA sequences from the Ensembl database (version 85, 69 species), NCBI vertebrate
RefSeq and common carp (http://www.carpbase.org/gbrowse.php) were used as
alternative RNA evidence. Proteins from the Ensembl database, common carp, and
UniProt database (uniref90) were used as protein evidence. To annotate gene structure,
we performed MAKER 3.0 41 on the Canu assembly with Augustus prediction and the
EST, RNA, protein evidence. Gene structures were lifted over to the carAur01 assembly
using liftover 42,43 or crossmap (https://sourceforge.net/projects/crossmap/files/).
Because our fish was not fully homozygous, we needed to identify those genes in the
heterozygous diploid regions. All cDNA sequences from Maker gene models were aligned
to self by megablast. Alignments with identity ³ 97.5% and coverage of both sequences
³ 70% were kept. Alignments were retained if they satisfied one of the following
restrictions: (1) identity >= 99.5% and the relative coverages of both contigs where thebioRxiv preprint first posted online Jul. 20, 2018; doi: http://dx.doi.org/10.1101/373431. The copyright holder for this preprint
(which was not peer-reviewed) is the author/funder. This article is a US Government work. It is not subject to copyright under 17
USC 105 and is also made available for use under a CC0 license.
two genes were located were less than 0.8, (2) the relative coverage of both contigs was
less than 0.75, (3) the relative read coverage of either contig was less than 0.6. DNA
sequences from all remaining aligned genes were fetched and aligned using lastz and
chained with axtChain. All alignments with matched basepairs covering less than 0.6 of
both genes or with identity less than 95% were discarded. Only the shorter of the two
genes in the retained alignments was masked and not used for following analysis.
MAKER3 generated 81,778 coding gene models, of which 80,062 were liftover’ed to
carAur01, and 9,738 genes were masked as one allele of the heterozygous genes. The
average exon and intron length was ~202bp and ~174bp. The distribution of exon and
intron size is similar to zebrafish, grass carp and common carp (supplemental figure 2).
Non-coding RNA annotation
Non-coding RNA sequences from other species were downloaded from NONCODE 44
(zebrafish and human), RNAcentral 45 and Ensembl ncrna (ver. 85) 46. All sequences were
first aligned to the genome using blastn in the NCBI-BLAST+ package 47 (-evalue 1e-4 –
perc_identity 80). All genomic target regions were fetched and refined using exonerate48
for each query. Exonerate alignments for each query RNA were kept if they satisfied: (1)
score ≥ 0.9 best score for the query; (2) query coverage ≥ 0.6; (3) query identity ≥ 0.7; (4)
non-canonical splice site ≤ 3.
Trinity genome-guided assembly was performed on the RNA-seq data from the seven
tissues. ‘align_and_estimate_abundance.pl’ from the Trinity package was used to
estimate the expression of each transcript. Transcripts with expression lower then 1 TPM
were filtered. All remaining transcripts were aligned to the Canu assembly using the same
BLASTN-exonerate approach except using a higher identity 90%. Exonerate alignments
for each query RNA were kept if they satisfied: (1) score ≥ 0.95 best score for the query;
(2) query coverage ≥ 0.75; (3) query identity ≥ 0.9; (4) non-canonical splice sites ≤ 3. All
Trinity transcripts with no alignment to any MAKER genes or with Trinotate PFam/Spot
annotation were also removed 49. Coding potential of the remaining transcripts were
predicted by using CPC 50. Transcripts with ‘coding’ labels were removed. All the
remaining exonerate results were transformed to GFF3 and merged using ‘cuffcompare’
from cufflinks package.
Hairpin sequences from miRBase were also aligned to the genome using the BLASTN-
exonerate approach. Alignments were retained if they satisfied: (1) score ≥ 0.9 best score
for the query and (2) query coverage >90%, identity >90%.
The genome was scanned against the Rfam database using cmscan from the Infernal
package (version 1.1.1) 51,52. Only hits with bit score ≥ 30 and E-value ≤ 10e-6 were kept.
When dealing with overlapping hits, we kept the hit amongst all overlapping hits that had
the highest bit score.
Conserved Noncoding Elements (CNE) IdentificationbioRxiv preprint first posted online Jul. 20, 2018; doi: http://dx.doi.org/10.1101/373431. The copyright holder for this preprint
(which was not peer-reviewed) is the author/funder. This article is a US Government work. It is not subject to copyright under 17
USC 105 and is also made available for use under a CC0 license.
All-to-all pairwise genomic alignment was performed using lastz (--gapped --
ambiguous=n --step=3 --strand=both --masking=100 --maxwordcount=100 --
identity=70..100 --format=axt) and axtToChain for four species (goldfish, common carp,
grass carp, zebrafish) and transformed to pairwise MAF format and split at gaps longer
than 30bp (chainToAxt –maxGap=30, then axtToMaf -score). All the pairwise MAF files
were transformed to multiple alignment MAF files using roast (P=multic). Phylogenetic
models were fit for each chromosome, linkage group or scaffold using phyloFit (--tree
'(ZF,(GC,(GF,CC)))' --subst-mod REV --nrate 4), which was used by phastCons for
computing conservation scores and most conserved regions. The most conserved
regions out of exons (of coding or noncoding genes) were defined as CNE (conserved
noncoding element). goldfish (or common carp) CNE that overlapped the goldfish-goldfish
(or common carp-common carp) self chain-net alignment regions were retained either as
both WGD copies or as singletons.
Gene Functional Annotation
Interproscan5 53 was used to annotate the Interpro/GO/Pathway function for all protein-
coding genes.
SNV and DIV
2x250 read pairs from a second gynogenic goldfish (GF71, 73X coverage) and a wild-
type goldfish (WTGF, 70X coverage) were aligned to the carAur01 assembly using bwa
mem (bwa mem -t 16 -I 538.,149.3). Most Probable Genotype (MPG)
(https://research.nhgri.nih.gov/software/bam2mpg/index.shtml, https://github.com/nhans
en/bam2mpg) 54 was used to call variants from the bwa mem produced bam files. The
MPG output variant calls were converted to VCF for variants with a minimum Most
Probable Variant (MPV) score of 10 or greater with a MPV-score/read-coverage ≥0.5
Functional Enrichment
Fisher exact tests were performed to identify significantly enriched GO molecular
functions among goldfish, common carp, grass carp and zebrafish. We also performed
the same tests between duplicated retained genes and single-copy-lost genes in goldfish
for each GO terms in the ‘molecular function’ and ‘biological process’ domain (figure 9).
Compared to the other three species, goldfish show enriched function in channel activity
and depressed function in olfactory receptor activity (figure 10).
Evolution Analysis
Ohnolog Gene Clusters
Protein and cDNA sequences of zebrafish (GRCz10) were downloaded from the Ensembl
database. Grass carp sequences were downloaded from Grass Carp Genome Database
(GCGD) 55. Common carp sequences were downloaded from NCBI (GCF_000951615.1).bioRxiv preprint first posted online Jul. 20, 2018; doi: http://dx.doi.org/10.1101/373431. The copyright holder for this preprint
(which was not peer-reviewed) is the author/funder. This article is a US Government work. It is not subject to copyright under 17
USC 105 and is also made available for use under a CC0 license.
We performed all-to-all Blastn on the cDNAs from the four species. Non-overlapping
alignments from the same cDNA pairs were concatenated. We identified synteny blocks
for each pair of species through iteratively merging nearby aligned gene pairs with, at
most, five unaligned genes between them. Alignments were used as an edge to group
genes into clusters with constrained gene numbers for each species according to whether
it was before or after the carp WGD event (zebrafish : grass carp : common carp : goldfish
= 1:1:2:2). Two genes or gene clusters were merged if the number of edge between them
was > 50%N% N& , or > 20%N% N& and there were edges linked between the two genes to
a matching outgroup gene according to the species tree ‘(zebrafish, (grass carp,
(common carp, goldfish) ) )’, where N% and N& were the number of genes in each gene
cluster. The priority for the edge for aggregate genes or gene clusters were edges in
synteny blocks and then ‘reciprocal best hit’ edge. Other edges were used to rescue and
merge some genes into those non-full-size (i.e. 1:1:2:2) clusters.
Phylogenetic Analysis
Proteins from all 1:1:2:2 ohnolog clusters were multiple aligned using MAFFT 56 with ‘--
auto’ option, then transformed to codon alignment using ‘tranalign’ from EMBOSS Suite
57
. Poorly aligned codon regions were eliminated using Gblocks 58. The third position of
all codons was filtered out into separated alignments. All third-codon sequences from the
same chromosomes were concatenated for building phylogenetic trees. ML tree was built
using RAxML 59 with the model GTRGAMMA. Pairwise synonymous substitutions were
computed by using ‘codeml’ from the PALM package (runmode = -2, method = 0) 60.
Divergence time of the carp WGD event was estimated by
20.5*L(WGD)*2/L(grass_carp,carp), where 20.5 is the divergence time of grass carp and
common carp in unit Mya, L(WGD) is the average branch length from WGD event to
goldfish and common carp, L(grass_carp, carp) is the average branch length between
grass_carp and common carp or goldfish. Similar estimation was performed for the
speciation of common carp and goldfish.
Expression Comparison between Retained WGD Gene Pairs
Co-linear blocks were fetched from the goldfish self chain-net alignment. Gap larger
than 20kbp was broken. Blocks shorter than 50kbp were removed. Blocks were
removed if it overlaps other longer blocks. The two sequences in each collinear block
were presumed to be derived from the same sequence before the carp WGD event.
WGD gene pairs were fetched from these collinear blocks for follow-up analysis. Exons
or CNEs that were lost in exactly one sequence from each block were also identified.
The genes that CNE were predicting to regulate were defined as the nearest gene(s) in
5kbp windows on both sides. .
RNA-seq reads from the seven tissues were mapped to the carAur01 assembly using
STAR (default settting and two pass). Expression levels (TPM) were estimated using
RSEM (rsem-calculate-expression --paired-end --forward-prob 0.0 --alignments -p 16 --
seed 987347 --calc-ci --calc-pme --estimate-rspd --time --no-bam-output) and
transformed to logTPM=log2(TPM+1). Euclidean distances or correlation coefficients ofbioRxiv preprint first posted online Jul. 20, 2018; doi: http://dx.doi.org/10.1101/373431. The copyright holder for this preprint
(which was not peer-reviewed) is the author/funder. This article is a US Government work. It is not subject to copyright under 17
USC 105 and is also made available for use under a CC0 license.
the expression between WGD gene pair were calculated in R. 449 gene pairs were
silenced, another 649 gene pairs contained exactly one silenced gene. The remaining
19,500 genes (9,750 gene pairs with both genes expressed) were hierarchically
clustered using the ‘hcluster’ and ‘ward.D2’ method in R, based on the logTPM value
and Euclidean distance. Tissue specific expressed gene pair was defined as gene pair
with TPM>=4 in one gene and TPM94%). Histogram of expression distances for each
group were computed in R using ‘hist’ with bin size 2. In order to illuminate the
relationship between exon loss and expression distance, gene pairs were divided into 4
groups: no exon loss, one exon loss, two exon losses, three or more exon losses. One
sided Wilcoxon rank sum tests were performed for each pair of groups. For CNE lost,
Wilcoxon rank sum test was performed on the expression standard deviation between
genes in the no-CNE-lost group and those in the CNE-lost group, using only gene pairs
with CNE loss but no exon loss.
In order to find out which biological functions were prone to diverging after the WGD, we
performed Wilcoxon rank sum tests on the expression distance between genes inside
the GO terms and genes outside the GO terms. The top 20 and bottom 20 GO terms
with p < 0.1 were plotted in figure 15.bioRxiv preprint first posted online Jul. 20, 2018; doi: http://dx.doi.org/10.1101/373431. The copyright holder for this preprint
(which was not peer-reviewed) is the author/funder. This article is a US Government work. It is not subject to copyright under 17
USC 105 and is also made available for use under a CC0 license.
Software and Databases
Software URL
Trinity https://github.com/trinityrnaseq/trinityrnaseq/wiki
Maker http://www.yandell-lab.org/software/maker.html
CrossMap https://sourceforge.net/projects/crossmap/files/
Canu http://canu.readthedocs.io/en/latest/index.html
NCBI- ftp://ftp.ncbi.nlm.nih.gov/blast/executables/blast+/L
BLAST+ ATEST/
Exonerate https://www.ebi.ac.uk/about/vertebrate-
genomics/software/exonerate
Trinotate https://trinotate.github.io
Infernal http://eddylab.org/infernal
InterProSc ftp://ftp.ebi.ac.uk/pub/software/unix/iprscan/5
an
Bam2mpg https://research.nhgri.nih.gov/software/bam2mpg/in
dex.shtml
GBlocks http://molevol.cmima.csic.es/castresana/Gblocks.ht
ml
RAxML https://sco.h-
its.org/exelixis/web/software/raxml/index.html
PAML http://abacus.gene.ucl.ac.uk/software/paml.html
EMBOSS http://emboss.sourceforge.net/index.html
STAR https://github.com/alexdobin/STAR
RSEM https://deweylab.github.io/RSEM
HISAT2 https://ccb.jhu.edu/software/hisat2/index.shtml
Database URL
Ensembl http://ensembl.org
NONCODE http://www.noncode.org/
RNACentral http://rnacentral.org
PFam http://pfam.xfam.org
Uniprot https://www.ebi.ac.uk/uniprot
RFam http://rfam.xfam.orgbioRxiv preprint first posted online Jul. 20, 2018; doi: http://dx.doi.org/10.1101/373431. The copyright holder for this preprint
(which was not peer-reviewed) is the author/funder. This article is a US Government work. It is not subject to copyright under 17
USC 105 and is also made available for use under a CC0 license.
UCSC genome http://genome.ucsc.edu
browserbioRxiv preprint first posted online Jul. 20, 2018; doi: http://dx.doi.org/10.1101/373431. The copyright holder for this preprint
(which was not peer-reviewed) is the author/funder. This article is a US Government work. It is not subject to copyright under 17
USC 105 and is also made available for use under a CC0 license.
Supplemental data
Supplemental Tables
Supplemental Table 1. Pacbio read statistics
Raw Reads Corrected Reads
Counts 16,671,136 11,884,085
Mean length (bp) 7,800 6,810
Coverage ~71 ~45
Peak length (kbp) ~9.8 ~8.0
Supplemental Table 2. Assembly statistics for different coverage groups
Read Depth Contig Counts bp N50 (bp)
0-0.6 6,937 497,816,144 114,500
0.6-1.8 2,393 1,347,156,259 1,372,944
>1.8 85 4,078,364 -bioRxiv preprint first posted online Jul. 20, 2018; doi: http://dx.doi.org/10.1101/373431. The copyright holder for this preprint
(which was not peer-reviewed) is the author/funder. This article is a US Government work. It is not subject to copyright under 17
USC 105 and is also made available for use under a CC0 license.
Supplemental Table 3. Repeated DNA statistics
Goldfish Common Carp 23 Zebrafish 27
Total base pairs 721,087,053 672,246,354 715,370,858
(39.6%) (39.2%) (52.24%)
DNA transposon 16.38% 17.53% 34.3%
LTR 4.89% 4.35% 5.07%
LINE 4.50% 4.90% 2.83%
SINE 0.47% 0.47% 2.34%
Satellite 1.27% - 1.78%
RC 1.89% - 0.94%
Simple 3.27% - 4.12%
Unknown 6.88% - 0.34%
The breakdown of the various repeat elements presented in goldfish, common carp, and
zebrafish. The percentage of the total genome is indicated in parentheses. The larger
fraction of DNA transposons in zebrafish is responsible for its significantly larger size
compared to the pre-duplication carp or goldfish genomes.
Supplemental Table 4. Core eukaryotic genes using Benchmarking Universal Single-Copy
Orthologs (BUSCO)
Goldfish Common carp Zebrafish
Complete BUSCOs 4,204 3,828 4,384
Complete and single-copy BUSCOs 1,990 1,695 4,145
Complete and duplicated BUSCOs 2,214 2,133 239
Fragmented BUSCOs 257 436 113
Missing BUSCOs 123 320 87
Total BUSCO groups searched 4,584 4,584 4,584
Using the “Benchmarking of Universal Single-Copy Orthologs” Actinopterygii gene set,
we determined the goldfish genome assembly has 97.3% of the BUSCO in at least one
copy (91.7% complete BUSCO genes, 5.6% fragmented, and 2.7% missing) with 48.3%
complete in both copies, compared to the common carp assembly which has 83.5%
complete BUSCO, 9.5% fragmented, 7% missing and 46.5% complete with both gene
pairs represented.bioRxiv preprint first posted online Jul. 20, 2018; doi: http://dx.doi.org/10.1101/373431. The copyright holder for this preprint
(which was not peer-reviewed) is the author/funder. This article is a US Government work. It is not subject to copyright under 17
USC 105 and is also made available for use under a CC0 license.
Supplemental Figures
Supplemental Figure 1. 25-mer occurrence distribution from 2 x 125 bp Illumina
paired-end reads. The two peaks indicate that a fraction of the genome was not
sequenced to the same depth of coverage, i.e. part of the genome (approximately 16%
from The Canu assembly) was at 20X coverage instead of 40X (white arrow vs. red
arrow). The 20X peak was indicative of regions of the genome that were not
homozygous.bioRxiv preprint first posted online Jul. 20, 2018; doi: http://dx.doi.org/10.1101/373431. The copyright holder for this preprint
(which was not peer-reviewed) is the author/funder. This article is a US Government work. It is not subject to copyright under 17
USC 105 and is also made available for use under a CC0 license.
Scale 10 kb carAur01
LG3: 3,230,000 3,235,000 3,240,000 3,245,000 3,250,000 3,255,000
Assembly Contigs
A Assembly
WTgf_SNV
SNV and InDel in goldfish
WTgf_DIV
GF71_SNV
GF71_DIV
Gene prediction by Maker v3.0
stat3
masked heterozygous Gene
cdna alignment from multiple species
ZF_cdna
Xcdna
Interproscan
B Interpro
ncRNA
Noncoding Genes
GO by Interproscan
GO
tRNA by tRNAScan-SE
tRNA
miRNA by miRBase hairpin alignment
miRNA
Rfam by Infernal cmscan (score>=30, EbioRxiv preprint first posted online Jul. 20, 2018; doi: http://dx.doi.org/10.1101/373431. The copyright holder for this preprint
(which was not peer-reviewed) is the author/funder. This article is a US Government work. It is not subject to copyright under 17
USC 105 and is also made available for use under a CC0 license.
Supplemental Figure 3. Distribution of exon and intron lengths. Bottom right panel is
an enlargement of the red box in the bottom left panel. GF: goldfish, CC: common carp,
GC: grass carp, ZF: zebrafish.bioRxiv preprint first posted online Jul. 20, 2018; doi: http://dx.doi.org/10.1101/373431. The copyright holder for this preprint
(which was not peer-reviewed) is the author/funder. This article is a US Government work. It is not subject to copyright under 17
USC 105 and is also made available for use under a CC0 license.
Supplemental Figure 4. Reciprocal best hit (RBH) gene counts between zebrafish and
common carp chromosomes. Red to yellow indicates high to low numbers.You can also read