CD276 is an important player in macrophage recruitment into the tumor and an upstream regulator for PAI
←
→
Page content transcription
If your browser does not render page correctly, please read the page content below
www.nature.com/scientificreports
OPEN CD276 is an important player
in macrophage recruitment
into the tumor and an upstream
regulator for PAI‑1
Sibel Durlanik1*, Katrin Fundel‑Clemens2, Coralie Viollet2, Heinrich J. Huber2,
Martin Lenter3, Kerstin Kitt1 & Stefan Pflanz1
More than 70% of colorectal, prostate, ovarian, pancreatic and breast cancer specimens show
expression of CD276 (B7–H3), a potential immune checkpoint family member. Several studies have
shown that high CD276 expression in cancer cells correlates with a poor clinical prognosis. This has
been associated with the presence of lower tumor infiltrating leukocytes. Among those, tumor-
associated macrophages can comprise up to 50% of the tumor mass and are thought to support
tumor growth through various mechanisms. However, a lack of information on CD276 function and
interaction partner(s) impedes rigorous evaluation of CD276 as a therapeutic target in oncology.
Therefore, we aimed to understand the relevance of CD276 in tumor-macrophage interaction
by employing a 3D spheroid coculture system with human cells. Our data show a role for tumor-
expressed CD276 on the macrophage recruitment into the tumor spheroid, and also in regulation of
the extracellular matrix modulator PAI-1. Furthermore, our experiments focusing on macrophage-
expressed CD276 suggest that the antibody-dependent CD276 engagement triggers predominantly
inhibitory signaling networks in human macrophages.
CD276/B7-H3 is a type I transmembrane protein and, based on the similarity in protein sequence, is considered
as an immune checkpoint member of the B7 family. In mouse, the extracellular portion of CD276 is composed
of two immunoglobulin (IgV–IgC) domains, whereas in human it has four Ig domains of two pairs of IgV–IgC
due to exon d uplication1. Despite being discovered almost 2 decades ago, the interaction partner(s) remains
unknown. The short cytoplasmic tail lacks any known adaptor protein m otif2, leaving the downstream signal-
ing of CD276 unresolved. Initially, the studies mainly focused on modulation of T cell responses by CD276,
yet the reported functions as co-stimulatory and co-inhibitory molecule remain controversial2–5. In addition to
its debated immune modulatory functions, CD276 gained considerable attention in the tumor field. CD276 is
expressed on fi broblasts6, epithelial c ells7, endothelial c ells8 as well as stromal c ells9, and CD276 overexpression
has been detected on a vast variety of solid tumors such as colorectal, breast and lung c ancer10. The large body
of data indicates a strong correlation between CD276 overexpression in tumor and poor patient prognosis10. For
example, in hepatocellular carcinoma, CD276 expression associated with tumor aggressiveness and recurrence
rate11. Nuclear localization of CD276 in colorectal cancer, high CD276 expression in pancreatic cancer and on
tumor-associated endothelial cell in ovarian carcinoma were reported to be a predictive parameter for reduced
survival rate12–14. Its pro-tumorigenic functions so far were associated to tumor growth, glucose and fatty acid
metabolism, cell migration, metastasis, drug and chemotherapy r esistance15–18.
Multiple studies suggest a possible connection between poor clinical prognosis in patients with high CD276
expression on tumor cells and lower tumor infiltrated lymphocytes such as CD8+ T cells, which implies an
immune-modulatory role of CD27619–22. Analysis of tissue sections obtained from colorectal cancer patients indi-
cated a positive correlation between CD276 expression on tumor cells and CD68+ tumor associated macrophages
(TAM) infiltration20. Similarly, in hepatocellular carcinoma, CD276 expression was shown to positively correlate
with infiltrated TAM and the same study indicated a potential role of tumor-expressed CD276 in polarization of
the human monocytic cell line, THP-1 cells, to an anti-inflammatory M2-like p henotype23. Recently, a new study
1
Cancer Immunology and Immune Modulation, Boehringer Ingelheim Pharma GmbH & Co. KG, 88397 Biberach,
Germany. 2Global Computational Biology and Digital Sciences, Boehringer Ingelheim Pharma GmbH &
Co. KG, 88397 Biberach, Germany. 3Drug Discovery Sciences, Boehringer Ingelheim Pharma GmbH & Co. KG,
88397 Biberach, Germany. *email: sdurlanik@gmail.com
Scientific Reports | (2021) 11:14849 | https://doi.org/10.1038/s41598-021-94360-9 1
Vol.:(0123456789)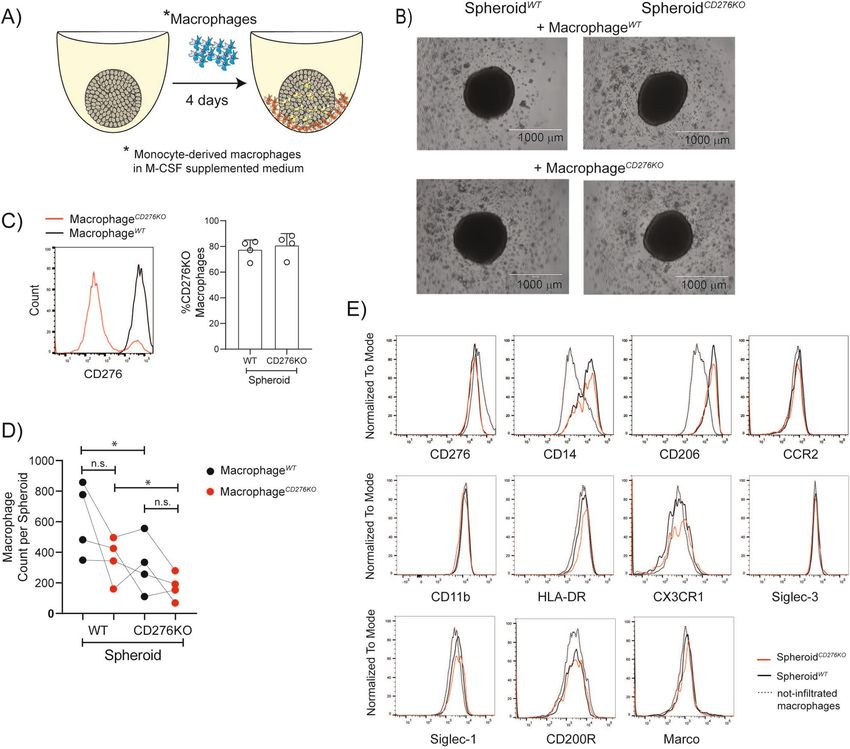
www.nature.com/scientificreports/
challenged this claim by demonstrating that higher CD276 expression on tumor cells positively correlated with
increased number of CD8+ T cell and plasmacytoid dendritic cells (pDCs) in patients suffering from non-small
cell lung cancer (NSCLC)24. Clearly, further studies are necessary to understand the connection between CD276
expression on tumor and tumor-infiltrating lymphocytes.
However, to date there is no systematic study available investigating a possible role of CD276 on tumor in
macrophage infiltration. Therefore, in this study, we aimed to understand whether CD276 modulates macrophage
recruitment in a 3D tumor spheroid with human macrophage coculture system. Our data suggest that tumor-
expressed CD276 contributes to macrophage recruitment in spheroid, possibly by influencing extracellular
matrix (ECM) remodeling. In the absence of CD276 on tumor cells, plasminogen activator inhibitor-1 (PAI-1)
and urokinase plasminogen activator (uPA)—two recognized players in ECM remodeling—are affected, indi-
cating that CD276 could be an upstream regulator for PAI-1 in tumor. In addition to tumor cells, our data also
provide insights in CD276 function on macrophages. CD276 is upregulated during monocyte differentiation
to macrophages, and our data show that the intensity of CD276 expression depends on the cytokine milieu.
Cross-linking of CD276 on macrophages with a specific antibody indicated a potential cis-partnership leading
to phosphorylation of ITIM bearing LAIR-1, PECAM-1, Siglec-3, ILT2, ILT4 and ILT5 accompanied with kinase
phosphorylation such as CREB, HSP27, ERK1/2, RSK1/2/3, c-Jun and STAT3. In conclusion, our data suggest
that tumor-expressed CD276 is involved in regulating the recruitment of tumor-associated macrophages and
provide insights, for the first time, in signaling mediated by CD276 in macrophages.
Material and methods
Cell culture and monocyte differentiation to macrophages. HCT116 colon cancer cells (ATCC,
CCL-247) were propagated and maintained in McCoy’s 5A (Modified) medium (16600082, Gibco) with 10%
FCS supplement.
Monocytes were isolated from frozen PBMCs obtained from either fresh blood donation or Leukopak con-
centrates. All studies on human donor blood were performed in accordance with the guidelines and regulations
of German legislation and the experimental protocol was approved by the ethical committee of the Landesär-
ztekammer Baden-Württemberg (Germany). Anonymized blood donors were healthy volunteers who provided
written informed consent. PBMCs were isolated via density gradient centrifugation using Ficoll-Paque (17-1440-
03, GE Healthcare) and stored in − 160 °C until further use. CD14+CD16− Monocytes from frozen PBMC were
magnetically isolated by using RoboSep according to the company’s protocol (EasySep monocyte isolation kit
19359, STEMCELL technologies). Isolated cells were seeded in 6-well Nunc plates at 1 × 10⁶ cells/ml with UpCell
surface (174901, Thermo Fisher) in serum-free X-VIVO-10 media (BEBP02-055Q, Lonza) and differentiated
to macrophages by incubation for 7 days with 100 ng/ml M-CSF (130-096-489, Miltenyi Biotec) or GM-CSF
(130-093-866, Miltenyi Biotec).
Crispr‑Cas9 gene editing for HCT116 cells and macrophages. Neon Transfection System (MPK1096,
Invitrogen) was utilized to deliver the Cas9 (A36499, Invitrogen)—ribonuclear proteins (RNP) complex includ-
ing guiding RNA against CD276 (A35533-CRISPR806748_SGM, Invitrogen) or scrambled gRNA (A35526, Inv-
itrogen) as control into the cell according to the company’s protocol with following modification.
HCT116 cells were treated with accutase (A6964, Sigma Aldrich) to detach and washed with PBS. For each
transfection, 5 × 10⁴ cells were electroporated with RNP complex (240 ng gRNA + 1.25 µg Cas9) in 10 µl reaction
buffer with following setting on Neon: 1530 V, 20 ms, 1 pulse. After electroporation, cells were seeded in 24-well
culture plate (142475, Thermo Fisher) in McCoy’s 5A (modified) medium with 10% FCS supplement and cultured
for 4 days. CD276 expression on the cell surface was analyzed by flow cytometry.
Monocyte-derived macrophages (MDM) at day 7 were collected, washed with PBS and prepared for electropo-
ration. For each transfection, 2 × 10⁵ cells were electroporated with the RNP complex (240 ng gRNA + 1.25 µg
Cas9) in 10 µl reaction buffer with following setting on Neon: 1650 V, 10 ms, 3 pulse. After electroporation,
cells were rested in X-VIVO-10 medium supplemented with 100 ng/ml M-CSF or GM-CSF for 7 days. CD276
expression was analyzed on day 7 by flow cytometry.
RNA isolation and quality control. HCT116WT and H
CT116CD276KO cells were cultured and maintained
in different culture flasks for further propagation. Five biological replicates were used per group for a total of
10 samples. 1 × 10⁶ cells per sample were collected, centrifuged, washed two times with PBS. After removal of
supernatant completely, cell pellets were immediately frozen at − 80 °C until further use. Total RNA extraction
for Next-Generation Sequencing from cell pellets lysed in RLT plus buffer were performed by using the AllPrep
DNA/RNA Mini Kit (80224, Qiagen) according to the company’s protocol. An on-column DNA digestion was
performed, and the final elution volume was 30 µL.
Total RNA was quantitatively and qualitatively assessed using the fluorescence-based RNA Broad Range
Qubit Kit (Thermo Fisher) and the Standard Sensitivity RNA Analysis DNF-471 Kit on a 48-channel Fragment
Analyzer (Agilent), respectively. Concentrations averaged at 30 ng/µL while RIN were all > 8.5.
Whole transcriptome sequencing. 10 HCT116-derived RNA samples were normalized and 200 ng of
input was used for library construction using the NEBNext Ultra II Directional RNA Library Prep Kit for Illu-
mina (E7760), together with the NEBNext Poly(A) mRNA Magnetic Isolation Module (E7490) upstream and the
NEXNext Multiplex Oligos for Illumina (E7600) downstream (all New England Biolabs). Sequencing libraries
were quantified, normalized, pooled and spiked in with PhiX Control v3 (Illumina). The library pool was subse-
quently clustered with the HiSeq 3000/4000 SR Cluster Kit on a cBot; and sequenced on a HiSeq 4000 Sequenc-
Scientific Reports | (2021) 11:14849 | https://doi.org/10.1038/s41598-021-94360-9 2
Vol:.(1234567890)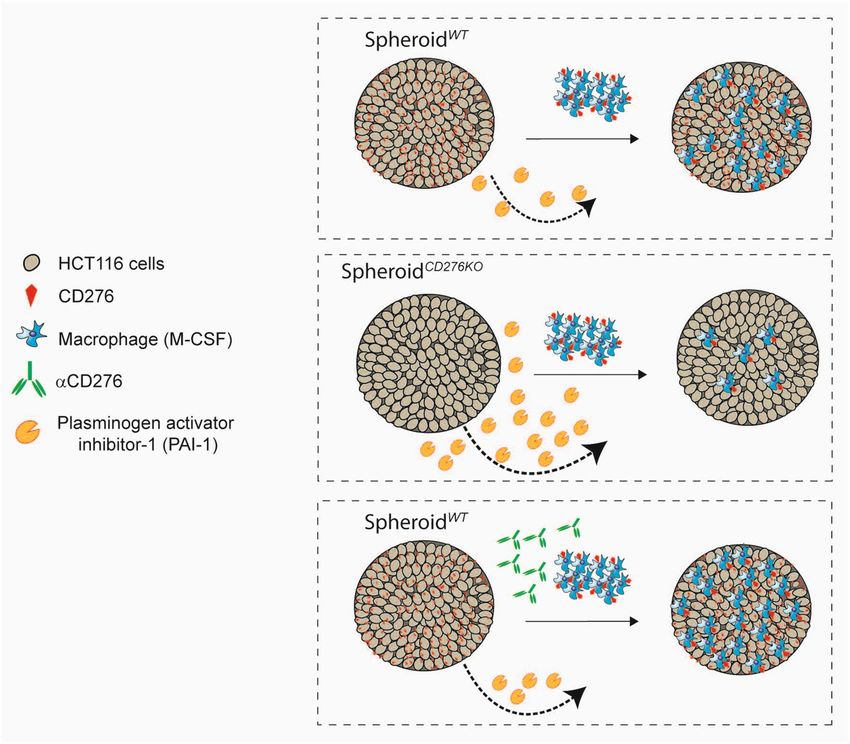
www.nature.com/scientificreports/
ing System (Illumina) with dual index, single read at 50 bp length (Read parameters: Rd1: 51 Rd2: 8, Rd3: 8),
reaching an average depth of 40 million Pass-Filter reads per sample (11.1% CV).
RNA‑seq data analysis. Demultiplexing was performed using bcl2fastq v2.20.0.422 from Illumina.
Sequencing reads from the RNA-seq experiment were processed with a pipeline building upon the implementa-
tion of the ENCODE “Long RNA-seq” pipeline25: filtered reads were mapped against the Homo sapiens (human)
genome hg38/GRCh38 (primary assembly, excluding alternate contigs) using the STAR (v2.5.2b) aligner26
allowing for soft clipping of adapter sequences. For quantification, transcript annotation files from Ensembl
(v86) corresponding to GENCODE 25 were used. Gene expression levels were quantified with the above anno-
tations, using RSEM (v1.3.0)27 and featureCounts (v1.5.1)28. Quality controls were implemented using FastQC
(v0.11.5)29, picardmetrics (v0.2.4)30 and dupRadar (v1.0.0)31 at the respective steps. Finally, differential expres-
sion analysis was performed on the human mapped counts derived from featureCount using limma/voom32,33.
Processed data can be accessed in the NCBI GEO database under the accession code (GSE165610).
Spheroid formation and macrophage coculture. 4000 cells from HCT116WT or HCT116CD276KO were
seeded in 96-well (Ultra-Low Attachment, ULA) plates (7007, Corning) in McCoy’s 5A (Modified) medium
and cultured for 5 days to form spheroid. On day 5, culture medium was replaced with serum-free X-VIVO-10
medium. In parallel, MDMs were collected, washed with PBS and resuspended in X-VIVO-10 medium. 1 × 10⁴
MDMs were distributed per spheroid and cocultured for additional 4 days. At the end of coculture, superna-
tants were collected and stored at − 20 °C until further use. To quantify the viable cells per spheroids, 5–10
spheroids were pooled into one sample for each group and before dissociating the spheroids, a defined number
of negative compensation flow cytometry beads (51-90-900129, BD Bioscience) were added. Afterwards, sphe-
roids were dissociated, and single cell suspensions were processed for surface and intracellular staining. Upon
analysis by flow cytometry, ratio of recorded bead count to the initial bead amount was used to back calculate
viable cells. For the experiments with uPA, recombinant uPA protein (ab167714, Abcam)—2 ng/ml or 20 ng/
ml—was added to the spheroid-MDM coculture on day 5. For the experiments with αCD276 antibody treat-
ment, only HCT116WT spheroids were used and cocultured with MDMs. The antibody treatment experiment
was performed in the presence of 20 µg/ml Fc Block (564765, BD Bioscience), and cells received either 20 µg/ml
αCD276 antibody (ab209895, Abcam) or 20 µg/ml monoclonal rabbit IgG isotype (ab199376, Abcam) for 4 days.
Flow cytometry. Single cell suspension was washed with 0.2% BSA-PBS and directly incubated with Pacific
Orange (P30253, Thermo Fisher) for 10 min on ice to exclude dead cells for the follow-up data analysis. After
live/dead staining, surface staining was carried out with the listed antibodies in the presence of αhFcγ‐receptor
(130-059-901, Miltenyi Biotec) in 0.2% BSA‐PBS for 10 min on ice. After washing, to proceed with intracellular
CD68 staining, cells were fixed and permeabilized with FACS‐Lysing (349292, BD Bioscience) and FACS‐Perm2
Solution (340973, BD Bioscience), respectively, according to the company’s protocol. Cells were analyzed using
the flow cytometer FortessaX20 (BD Bioscience).
Following antibodies with indicated dilutions were used: BD Bioscience; CD14 (564054; 1:100), CD16
(560717; 1:50), CD163 (562643; 1:50), CD206 (550889; 1:50), CD36 (561820; 1:20), CD86 (563412; 1:50), CD68
(564944; 1:200), CD209 (558263; 1:20), CD11b (557960; 1:100), CX3CR1 (565801: 1:50), CD83 (564441; 1:25),
Siglec1 (742995; 1:50); HLA-DR (564516; 1:50). BioLegend; CD200R (329310; 1:100), CCR2 (357204; 1:50),
CD11c (337220; 1:200). Miltenyi Biotec; CD300E (130-101-777; 1:50) and CD276 (130-095-525; 1:100). eBiosci-
ence; Marco (25-5447-42; 1:20).
For the samples in which unconjugated rabbit αhCD276 (ab209895, Abcam) was added to the culture, the
flow cytometric analysis of CD276 surface expression was performed with mouse αhCD276 (130-095-525,
Miltenyi Biotec).
MDM stimulation. MDMs generated for 7 days were collected, washed with 0.2% BSA‐PBS, and resus-
pended in serum-free X-VIVO-10 medium with a cell density of 1 × 10⁶ cells/ml. MDMs were reseeded into
48-well or 24-well Nunc cell culture (UpCell) plates. After 2 h resting, following stimuli were added to the
culture: 20 ng/ml LPS (tlrl-b5lps, InvivoGen) + 50 ng/ml IFNγ (571104, BioLegend); 10 ng/ml IFNα (11100-
1, PBL); 20 ng/ml IL-4 (130-093-922, Miltenyi Biotec) + 20 ng/ml IL-13 (571104, BioLegend); 20 ng/ml IL-10
(571004, BioLegend). 24 h after stimulation, supernatants were collected and stored at − 20 °C until further use.
Soluble protein analysis. To quantify the protein amount in supernatants, following ELISA kits and
arrays were used according to the company’s protocol: PAI-1 ELISA (BMS2033, Thermo Fischer); uPA ELISA
(DUPA00, R&D System); Proteome Profiler Human XL Cytokine Array (ARY022B, R&D System).
WST‑1 assay. Spheroids from H CT116WT and H CT116CD276KO cells were formed as described above and on
day 5, culture medium was exchanged to serum-free X-VIVO-10 medium. From day 6 on, metabolic activity
was assessed using the WST-1 assay kit according to the company’s protocol (Roche, 11644807001). Media was
aspirated and 150 μl of 10% WST-1 solution was added to each well and cells were incubated for 3 h. To measure
the absorbance at wavelength 450 nm, 100 µl from the supernatant was transferred into a 96-well F-bottom plate
and immediately was recorded using microplate reader (EnVision, PerkinElmer).
Phospho‑immunoreceptor and phospho‑kinase arrays. MDMs were generated as described above.
On day 7, cells were collected, washed with 0.2%BSA-PBS and reseeded in 24-well UpCell plates with a density
Scientific Reports | (2021) 11:14849 | https://doi.org/10.1038/s41598-021-94360-9 3
Vol.:(0123456789)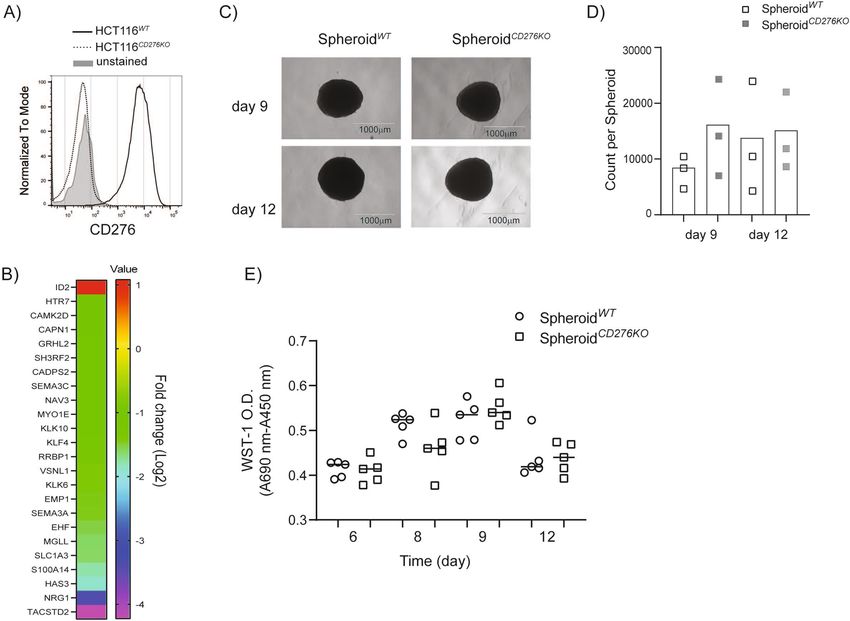
www.nature.com/scientificreports/
of 1–1.5 × 10⁶ in 500–750 µl X-VIVO-10 medium. After 3 h resting, cells were treated with 20 µg/ml Fc Block
(564765, BD Bioscience) for 10 min at 37 °C. Afterwards, cells were stimulated with either 20 µg/ml αCD276
antibody (ab209895, Abcam) or 20 µg/ml monoclonal rabbit IgG isotype (ab199376, Abcam). For Phospho-
Immunoreceptor array (ARY004, R&D System), antibody treatment was for 10 min at 37 °C and 30 min for
Phospho-Kinase Array (ARY003c, R&D System). After incubation, cells were immediately transferred onto ice,
collected and washed 2 times with PBS. Cell lysate preparation was carried out according to the company’s pro-
tocol. To inhibit the proteinase activities, lysis buffers for all samples were supplemented with 1% Halt Protease
Inhibitor Cocktail (EDTA free) (87785, Thermo Fisher). Cell lysates were stored at − 80 °C until further use.
Protein quantification was performed with Pierce BCA Protein Assay (23225, Thermo Fisher) and measurement
was carried out with microplate reader (EnVision, PerkinElmer). Equal amount of cell lysates (between 200 and
250 µg) was used per assay, and membranes were developed with ImageQuant LAS 4000 (GE Healthcare).
Statistical analyses. GraphPad Prism was used to perform statistical analyses. Paired student t test was
used to calculate p values. *p ≤ 0.05; **p ≤ 0.01; ***p ≤ 0.001.
Results
CD276 expression on the HCT116 colorectal cell line is dispensable for tumor spheroid forma‑
tion. HCT116 cells form spheroids in 5 days when cultured in a cell culture plate with ultra-low attachment
(ULA) feature without additional support such as matrigel. HCT116 spheroids are rigid enough for transfer
without disruption and permissive enough for monocytes and macrophages to infiltrate. HCT116 cells naturally
express CD276, therefore we generated H CT116CD276KO cells by employing Crispr-Cas9 gene editing technology.
The loss of CD276 on the cell surface was monitored and H CT116CD276KO cells were sorted by flow cytometry to
generate single cell clones (Fig. 1A). All the experiments were performed with the same single cell clone. Our
next step, global transcriptome analysis revealed that 55 genes were differentially regulated in H CT116CD276KO
WT
cells compared to HCT116 cells. In silico analysis of potential off-targets of the CD276 specific gRNA per-
formed with CrisprOR software34 yielded no possible site for up to two-mismatch and 66 genes if four-mismatch
were allowed. However, none of these overlapped with the gene set found after CD276 deletion (Supplemen-
tary Table S1). Despite being a short list of genes, when analyzed with IPA (Ingenuity pathway analysis), about
25 genes were associated with cell motility and adhesion (Fig. 1B). Although the pathway analysis indicated a
potential role for CD276 in extracellular matrix (ECM), H CT116CD276KO cells as well as H
CT116WT cells formed
comparable round, intact spheroids from 5 to 12 days with no visible distortion (Fig. 1C; Supplementary Fig. 1).
We assessed the cell viability in spheroids by flow cytometry and WST-1 metabolic assay. S pheroidsCD276KO tended
to have a higher percentage of viable cells although the difference was not statistically significant (Fig. 1D), but
according to the WST-1 assay, cell viability in spheroids formed from HCT116CD276KO and HCT116WT cells was
comparable as analyzed with unpaired student t test (Fig. 1E). Therefore, we concluded that lack of CD276
expression on tumor cells has no significant impact on HCT116 cell spheroid formation.
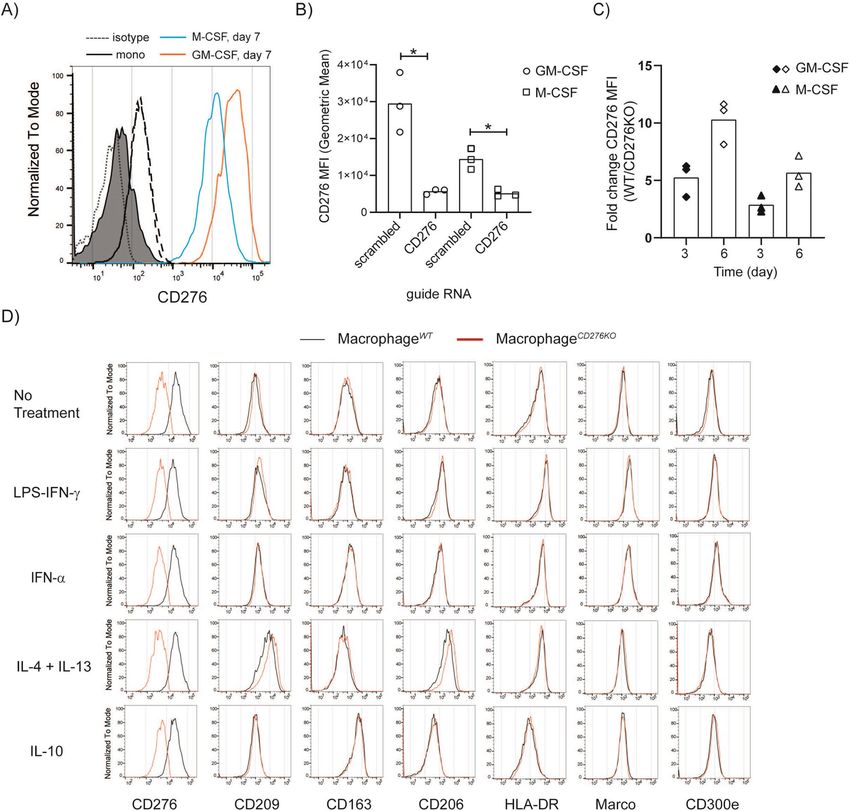
Monocyte to macrophages differentiation induces CD276 upregulation. In addition to tumor
D2764,35. We could confirm that freshly
cells, activated monocytes and macrophages were reported to express C
isolated human monocytes from frozen PBMCs lack CD276 but upregulate it while differentiating to mac-
rophages in vitro when cultured in the presence of GM-CSF or M-CSF (Fig. 2A). In addition to these cytokines,
coculturing with tumor spheroids (inside and outside of the spheroids) or exposing to tumor-conditioned
medium (generated from tumor spheroids) for 7 days, and cell adhesion to the culture plate in the absence of
GM-CSF or M-CSF also induced CD276 upregulation (Supplementary Figs. 2A, B). This indicates that multiple
mechanism could induce CD276 expression on monocyte-derived macrophages.
CD276 expression is dispensable for monocyte‑derived macrophage (MDM) differentiation
and further polarization. In spheroid-monocyte or -macrophage coculture, CD276 signaling comes not
only from tumor but also from MDMs. During the crosstalk between tumor cells and MDMs, exchange of plasma
membrane fragments—Trogocytosis36—might occur and tumor cells might acquire CD276 from MDMs. Hence,
to avoid or minimize any possible surface CD276 exchange, we employed Crispr-Cas9 gene editing technology
to monocytes and MDMs as well. 7 days after gene editing and culturing, maximum gene editing efficiency for
CD276 in monocytes was about 55% (Supplementary Fig. 3A). This indicates that lack of CD276 in monocyte
has no detectable impact on viability or differentiation to macrophages, since CD14, CD16, CD163, CD206 and
CD209 expressions were also comparable in C D276− and C D27+ T cells (Supplementary Fig. 3A). Crispr-Cas9
gene editing efficiency on monocytes for CD276 was not reliable or reproducible between donors. Therefore, for
the following experiments, we focused only on MDMs. 3 days after gene editing, CD276 expression was signifi-
cantly reduced on MDMs treated with CD276 gRNA compared to scrambled gRNA treated cells under M-CSF
and GM-CSF condition and after 6 days the effect was stronger (Fig. 2B&C). CD276WT MDMs and C D276low/KO
MDMs were further activated with LPS + IFNγ, IL-4 + IL-13, IFN-α and IL-10; and surface expression of CD209,
CD163, CD206, HLA-DR, Marco, CD14, CD16, CD11b, CD11c, CD83, CD86, CD36 and CD300e were ana-
lyzed. As in line with literature data, the cytokine stimulation induced changes in the expression of the markers
such as CD163, CD209, CD206, HLR-DR in M-CSF MDMs and in GM-CSF MDMs. However, as depicted in
Fig. 2D and in Supplementary Fig. 3B&C, C D276low/KO and C
D276WT MDMs displayed comparable expression
pattern for the interrogated markers, confirming no gross impact of CD276 on macrophage polarization.
CD276 expression on tumor spheroids is associated with increased macrophages infiltra‑
tion. To coculture with tumor spheroids, we used MDMs that were differentiated in M-CSF supplemented
Scientific Reports | (2021) 11:14849 | https://doi.org/10.1038/s41598-021-94360-9 4
Vol:.(1234567890)www.nature.com/scientificreports/
Figure 1. HCT116CD276KO cells form tumor spheroids similar to H CT116WT cells. (A) CD276 expression on
HCT116WT and HCT116CD276KO cells was analyzed by flow cytometry after Crispr-Cas9 gene editing. (B) The
CT116CD276KO
heat-map shows the differentially regulated genes related to cell adhesion and migration in H
cells compared to HCT116WT cells according to global transcriptome analysis. The bar shows the fold change
CT116CD276KO cells to
(log2) of the ratio from tpm values (transcripts per kilobase million) of genes in H
genes in HCT116CD276WT cells. (C) Tumor spheroids formed from H CT116WT and HCT116CD276KO cells were
monitored up to 12 days for shape. Representative microscope images are from 9-day and 12-day culture. (D)
Quantification of viable tumor cells per spheroid was assessed by flow cytometry. 5–10 spheroids were pooled
into a single sample for each group and before dissociation a defined number of negative compensation flow
cytometry beads were added. Ratio of recorded bead count to the initial bead amount was used to back calculate
viable tumor cells. The graph summarizes data (Mean + SD) from three independent experiments. (E) WST-1
viability assay treatment of spheroids over time. Each dot is one spheroid.
medium, since tumor-associated macrophages are linked to classically defined M2 or anti-inflammatory
macrophages37 that have been found predominantly located in the intratumoral region and tumor invasive front38.
Therefore, for the tumor spheroid cultures, the MDMs differentiated with M-CSF supplemented medium were
viewed as the more relevant subset. As illustrated in Fig. 3A, once tumor spheroids were formed, MDMs were
added and the coculture was maintained for 4 days. Unlike tumor cells, non-infiltrated macrophages attach on
the ULA plates, which allows to collect spheroids selectively. The representative microscopic images of spheroids
with macrophages coculture shows macrophage attachment at the bottom of the wells (Fig. 3B). Additionally, the
detailed gating strategy for the macrophages in the spheroids can be found in Supplementary Fig. 4A. Consist-
ent with previous publications, once macrophages infiltrated into the spheroid, they upregulated the expression
of CD14, CD163 and CD206 compared to the macrophages outside of the spheroid (Supplementary Fig. 4B).
There was also no difference in the shape or the size of these spheroids. As depicted in Fig. 3C, depending on
the donor, the percentage of CD276KO cells among macrophages was minimum 70% and this percentage was
comparable in CD276WT and CD276KO spheroids. To quantify the infiltrated macrophages in the spheroids, we
used the same bead-based technique as described above. Once cells were recorded in flow cytometry, the ratio
of recorded beads to initial amount was used to back calculate the initial CD11b+ cells in the samples. As shown
in Fig. 3D, 1.4 to 4.4-fold more macrophages were recruited into the S pheroidWT compared to S pheroidCD276KO,
independent of CD276 expression on macrophages. In our setting, there was no correlation between the count
of infiltrated macrophages versus percentage of CD276-expressing macrophage. Although less macrophage infil-
trated in the absence of CD276, the macrophages inside the CD276KO and CD276WT spheroids were comparable
Scientific Reports | (2021) 11:14849 | https://doi.org/10.1038/s41598-021-94360-9 5
Vol.:(0123456789)www.nature.com/scientificreports/
Figure 2. Monocyte to macrophage differentiation induces CD276 upregulation, yet lack of CD276 expression
on macrophages shows no impact for further polarization. (A) CD276 expression was analyzed on freshly
isolated monocytes (day 0) and monocyte-derived macrophages (MDMs/Macrophages) cultured for 7 days by
flow cytometry. Black line, filled histogram: Monocytes; red line, open histogram: MDMs cultured in GM-CSF
supplemented medium; blue line, open histogram: MDMs generated in M-CSF supplemented medium; dotted/
dashed lines for day 0/7: isotype control. The histogram shows one representative donor out of four donors.
(B-D) MDMs (M-CSF) were genetically edited with Crispr-Cas9 technique either with scrambled gRNA
(MacrophageWT) as control or CD276-specific gRNA (MacrophageCD276KO). (B) The graph summarizes the
mean fluorescence intensity (MFI, geometric mean) of CD276 on MDMs 3 days after gene editing. Statistical
analysis was done with paired t-test * p < 0.05. (C) CD276 expression on MDMs was compared from day 3 to
day 6 after gene editing by flow cytometry. The graph depicts the ratio of CD276 MFI on M acrophageWT to
MacrophageCD276KO on indicated time points in GM-CSF or M-CSF supplemented condition. (D) 3 days after
gene editing, MDMs (M-CSF) were further treated with indicated stimuli for 24 h and analyzed for indicated
surface markers by flow cytometry. Red line: M acrophagesCD276KO; black line: MacrophagesWT. These histograms
represent one representative donor out of three donors.
Scientific Reports | (2021) 11:14849 | https://doi.org/10.1038/s41598-021-94360-9 6
Vol:.(1234567890)www.nature.com/scientificreports/
Figure 3. In the absence of CD276 on tumor cells, lower number of macrophages infiltrates into spheroids.
Macrophages (MDMs in M-CSF supplemented medium) were genetically edited with Crispr-Cas9 protocol by
CD276 specific gRNA (MacrophageCD276KO). Control cells were treated with scrambled gRNA (MacrophageWT).
Afterwards, cells were rested for 7 days in culture and then cocultured with spheroids for another 4 days.
CD11b+ MDMs inside the spheroids were analyzed by flow cytometry. (A) A schematic representation
of experimental set-up for tumor spheroid culture with macrophages. 5 days after seeding H CT116WT or
CD276KO WT CD276KO
HCT116 cells, M
acrophages or Macrophages were added to the spheroids. 4 days after coculture,
a fraction of macrophages infiltrated into the spheroid (yellow), while some macrophages (orange) remain
attached in the well, outside of the spheroid. (B) Microscopy images show spheroid-macrophage cocultures
for indicated conditions. (C) Histogram displays CD276 expression on M acrophageWT (black line) and
CD276KO
Macrophage (red line) in the spheroids. The graph summarizes the percentage of M acrophageCD276KO
among infiltrated macrophages S pheroidWT and SpheroidCD276KOcoculture from four different donors. (D) The
count of infiltrated MDMs per spheroid is depicted in the graph. Briefly, 10 spheroids were pooled into a single
sample for each group and before dissociation a defined number of negative compensation flow cytometry
beads were added. Ratio of recorded bead count to the initial bead amount was used to back calculate MDMs.
MacrophageWT (black dots); MacrophageCD276KO (red dots). Each dot represents one MDM donor. Statistical
analysis was done with paired t-test; *p < 0.05. n.s. = not-significant E) Histograms display the surface expression
of indicated markers on M acrophageWT inside of SpheroidWT (black line) versus S pheroidCD276KO (red line) in
comparison to not-infiltrated macrophages (dashed line) that were outside of the S pheroidWT. The data represent
one donor from 4 donors MDMs (MacrophageWT).
Scientific Reports | (2021) 11:14849 | https://doi.org/10.1038/s41598-021-94360-9 7
Vol.:(0123456789)www.nature.com/scientificreports/
in the surface expression of CD14, CD206, CCR2, CD11b, HLA-DR, CX3CR1, Siglec-1, Siglec-3, CD200R and
Marco (Fig. 3E and Supplementary Fig. 4C).
In the absence of CD276, PAI‑1 is increased while uPA is decreased. Multiple cytokines and
chemokines are described for monocyte and macrophage recruitment into the tumor such as CCL2 and
CX3CL139. To understand which soluble factor in our system may account for lower macrophage recruitment,
we performed cytokine profile analysis on supernatants collected from spheroid-macrophage coculture. Three
major soluble factors were affected in the absence of CD276 on tumor cells: Dickkopf-related protein 1 (DKK-1),
PAI-1, urokinase-type plasminogen activator receptor (uPAR). Signal for PAI-1 was higher in supernatant from
SpheroidCD276KOcompared to Spheroid WT while the signals for DKK-1 and uPAR were lower (Fig. 4A). DKK-1
is a negative regulator for Wnt signaling, PAI-1 is an inhibitor for uPA that is the ligand for uPAR. PAI-1, uPA
and uPAR are known players in ECM remodeling, cell adhesion and mobility40. Therefore, we decided to further
quantify the PAI-1 and uPA concentration with ELISA. As in the cytokine array, significantly higher amount of
PAI-1 was detected in the supernatant from SpheroidCD276KO samples, while significant reduction in soluble uPA
was observed in the same supernatant (Fig. 4B). The presence or absence of CD276 expression on macrophages
in these samples exhibited no detectable impact on PAI-1 or uPA concentration. Hence, we quantified the PAI-1
and uPA amount in supernatants from spheroids without macrophages. As suspected, spheroids formed from
HCT116CD276KO cells produced threefold more PAI-1 and about 1.5-fold less uPA (Fig. 4C).
To investigate whether increased PAI-1 and as a result reduced uPA is the mechanism behind the reduced
macrophage recruitment in the absence of CD276 on tumor cells, we added exogenous uPA to the spheroid-mac-
rophage coculture (Fig. 4D). The uPA amount detected in spheroid cocultures were in the range of 300–800 pg/
ml, therefore we added maximum 20 ng/ml recombinant uPA. As shown in Fig. 4D, addition of exogenous uPA
could not restore the macrophage infiltration in the C D276KO spheroids. According to PAI-1 quantification,
exogenous uPA addition did not affect the PAI-1 concentration (Supplementary Fig. 6).
We tested a second method—αCD276-based immunotherapy approach—to modulate the macrophage infil-
tration via CD276. Targeting CD276 with an antibody is more clinically relevant, therefore we asked whether
triggering CD276-mediated signaling would lead to opposite outcome. Spheroids formed from H CT116WT cells
were cocultured with macrophages (M-CSF) in the presence of αCD276 antibodies or isotype controls for 4 days.
Based on quantification analysis done by flow cytometry, we detected increased macrophage infiltration upon
αCD276 treatment (Fig. 4E). In parallel, we quantified the PAI-1 concentration in the supernatants, and in 4 out
of 6 samples, up to 20–30% reduction in PAI-1 concentration was observed without statistically being signifi-
cant when tested with student t-test (nonparametric) (Fig. 4F). Of note, αCD276 treatment displayed a selective
effect on macrophages, but not on tumor cells. CD276 expression was selectively reduced on macrophages upon
αCD276 antibody treatment, while tumor cells were not affected (Fig. 4G).
Confirming the role of CD276 in macrophage recruitment as well as in modulation of PAI-1 and uPA in
cancer patients’ samples is essential to validate our data. Hence, we analyzed the colon adenocarcinoma cohort in
The Cancer Genome Atlas (TCGA) and as shown in Supplementary Fig. 7, CD276 expression in tumor positively
correlated with macrophage signature using the Xcell deconvolution method25,41,42.The coexpression analysis of
CD276 and PAI-1 or uPA displays improved positive correlation in tumor samples compared to normal colon
tissue that were obtained from GTEx project. Additionally, we analyzed publicly available single-cell RNAseq
dataset generated from CRC patients’ s amples43. In this data set, CD276 expression is mainly detected in TAM
clusters and displays negative correlation with PAI-1 expression, whereas it is positively correlated to uPA expres-
sion, which supports our observation.
Targeting CD276 on macrophages with a specific antibody induces a distinct immunoreceptor
phosphorylation accompanied with kinase phosphorylation. Selective effect of αCD276 antibody
treatment on macrophages in spheroid coculture raised our interest for CD276-mediated signaling in mac-
rophages. GM-CSF and M-CSF treatment induced CD276 upregulation, where GM-CSF induced significantly
higher CD276 expression (Fig. 5A). Therefore, for the following analysis, we used both types of MDMs generated
in M-SCF or GM-CSF supplemented medium. Despite having a short cytoplasmic tail with no known motif for
any adaptor protein, CD276 was claimed to induce kinase phosphorylation16. If CD276 induces downstream
signaling, this could indicate a cis-acting transmembrane protein partner. Immunoreceptors are among the
main modulators for macrophages, therefore αCD276 treated MDMs were analyzed with Phospho-Immuno-
receptor array (Fig. 5B&C). As shown from two representative donors, αCD276 treatment induced different
immunoreceptor phosphorylation in M-CSF and GM-CSF generated MDMs. While ILT2, ILT4 and ILT5 were
phosphorylated in M-CSF generated MDMs, LAIR-1, PECAM1 and Siglec-3 phosphorylation were dominating
in GM-CSF generated MDMs. The further analysis for kinase phosphorylation upon αCD276 treatment dem-
onstrated very distinctive pattern. Phosphorylation of CREB, HSP27, ERK1/2, c-Jun, STAT3 and RSK1/2/3 were
observed in GM-CSF generated MDMs, almost no kinase phosphorylation in this setting was detected in M-CSF
generated MDMs (Fig. 5D&E).
The detected immunoreceptors, LAIR-1, PECAM1, Siglec-3, ILT2, ILT4 and ILT5 possess ITIM inhibitory
motif and perform inhibitory functions. To understand whether PAI-1 or uPA is the target of CD276 signal-
ing in macrophages too, we activated MDMs in the presence of αCD276 antibody for 24 h with the following
stimuli: LPS + IFNγ; IFNα; IL-4 + IL-13; or IL-10. We quantified PAI-1 and uPA in the supernatant from activated
MDMs. MDM (M-SCF) produced detectable PAI-1 only under LPS + IFNγ condition with no clear impact
from αCD276 antibody treatment (Supplementary Fig. 5). On the other hand, some MDMs (GM-CSF) donors
produced PAI-1 already in unstimulated condition and often LPS + IFNγ stimulation increased the production
Scientific Reports | (2021) 11:14849 | https://doi.org/10.1038/s41598-021-94360-9 8
Vol:.(1234567890)www.nature.com/scientificreports/
Figure 4. In the absence of CD276 on tumor, soluble PAI-1 is increased, while uPA is decreased.
(A&B) Spheroids formed from HCT116WT or HCT116CD276KO were cocultured with MacrophagesWT or
MacrophagesCD276KO (M-CSF) for 4 days and supernatants were collected. (A) Proteome Profiler Cytokine
Arrays from equal volume of supernatants from SpheroidWT or SpheroidCD276KO cocultured with the same
MacrophagesWT are presented here. (B) The graphs summarize the concentration of PAI-1 and uPA in the
supernatants performed with relevant ELISA for indicated samples. (C) Spheroids were cultured without
macrophages for the same period (5 days after initial seeding + 4 days after medium exchange). To collect
enough supernatant, 5 wells from each group were pooled into one sample. PAI-1 and uPA concentrations
were analyzed with ELISA. The data is from three independent experiments. (D-F) Spheroids formed from
HCT116WT or HCT116CD276KO cells were cocultured with macrophages (7 days cultured in M-CSF supplemented
medium, no gene editing) for 4 days. Quantifications for CD11b+ infiltrated macrophages were done by
flow cytometry. 6–10 spheroids from each group were pooled into one sample, and before dissociating the
spheroids, a defined number of beads (negative compensation beads for flow cytometry) was added. The
ratio of recorded bead counts to initial bead amount was used to back calculate MDMs per spheroid. (D)
Spheroids and macrophages were cultured in the absence or presence of recombinant uPA protein with
indicated concentration. Six macrophage donors in total were tested. (E–F) SpheroidWT cocultured with
macrophages were treated with 20 µg/ml αCD276 antibody or isotype control. (E) Graph depicts the count of
infiltrated macrophages per spheroid from six different donors. (F) The graph summarizes the concentration
of PAI-1 in the supernatants from indicated samples (G) CD276 expression on macrophages and tumor cells
treated with αCD276 antibody or isotype controls were analyzed. Histograms represent experiment with one
macrophage donor and tumor cells in the same sample, and the graphs summarize the data from six donors and
corresponding tumor cells. Dotted line indicates isotype treated controls, black line αCD276 antibody treated
samples. Statistical analysis was done with paired t-test; **p < 0.01; ***p < 0.001.
(Fig. 5F). In MDMs (GM-CSF), αCD276 treatment tended to increase the PAI-1 production from 20 to 340%
in four donors out of six donors (Fig. 5F).
Discussion
Tumor-associated macrophages (TAM) compose up to 50% of tumor mass and are often supporters for tumor
growth44. Heterogeneous composition of TAM subsets in the tumor microenvironment (TME) is becoming
increasingly clear. In addition to promoting angiogenesis, tumor cell invasion and motility, TAM can suppress the
Scientific Reports | (2021) 11:14849 | https://doi.org/10.1038/s41598-021-94360-9 9
Vol.:(0123456789)www.nature.com/scientificreports/
Figure 5. Targeting CD276 on macrophages with specific antibodies induces distinct immunoreceptor
phosphorylation accompanied with kinase phosphorylation. (A) Monocytes were cultured either in GM-CSF or
M-CSF supplemented medium for 7 days. CD276 expression on monocyte-derived macrophages (MDMs) was
analyzed by flow cytometry and CD276 MFI values from six paired samples are summarized in the graph. (B-E)
After 7 days culture, MDMs were reseeded for Phospho-Immunoreceptor and Phospho-kinase array. After
3 h resting, MDMs were treated with αCD276 antibody or isotype for 10 min for Phospho-immunoreceptor
array and 30 min for Phospho-Kinase array. Cell lysates were processed for phosphorylation signatures. In total
macrophages from 4–5 donors were tested. Two representative donors are shown for Phospho-Immunoreceptor
arrays: (B) M-CSF MDMs and (C) GM-CSF MDMs. Two representative and matching donors are shown
for Phospho-Kinase arrays: (D) M-CSF MDMs and (E) GM-CSF MDMs. (F) MDMs (GM-CSF) were left
untreated or treated with LPS + IFNγ in the presence of αCD276 antibody or isotype control for 24 h. The graphs
summarize the concentration of PAI-1 in the supernatants. Each dot represents one donor.
anti-tumor T cell responses45. In this matter, CD276 as a member of the B7 family of immune checkpoint proteins
is a good candidate, especially because the tumor express much higher CD276 compared to healthy t issue10. In
addition to tumor cells, CD276 expression on macrophages was shown in non-small-cell lung cancer (NSCLC)
patient samples24 as well as on TAM in in triple-negative breast cancer patient s amples46. However, insufficient
data about the CD276 function is an impediment to evaluate CD276 as a therapeutic target. According to cor-
relation studies, patients with high CD276 expression are reported to have lower tumor infiltrating lymphocytes,
without giving any insight about the underlying mechanism10. In this study, we employed 3D human tumor
spheroids to recapitulate solid tumor structure and cocultured with human macrophages to monitor tumor-mac-
rophage interactions, including macrophage infiltration into the tumor spheroid. Tumor spheroids can contain
regions of proliferating, oxygenated, hypoxic and necrotic cells and thus are a good translational model for the
situation in vivo47. Additionally, and as would be expected, 3D structure influences gene expression, cell motility
and adhesion47,48. Therefore, using tumor spheroids allowed us to interrogate the correlation analysis results in
an in vitro experimental setting with human cells. Our data suggest that CD276 on tumor cells is a significant
contributor for macrophage recruitment. In the absence of CD276 on tumor cells, significantly lower macrophage
infiltration was observed (Fig. 3D). In a previous study conducted in an in vivo mouse model, reduced myeloid-
derived suppressor cells in tumor was reported in CD276KO mice49 that is consistent with our data. According to
the phenotypic analysis of infiltrated macrophages in CD276KO spheroids in comparison to CD276WT spheroids,
the reduction in infiltration is not associated with changes in macrophage polarization markers, although we
cannot rule out possible effects on the metabolic level or other surface markers not-included in our analysis. Of
note, as seen in Supplementary Fig. 4C, CD276KO macrophages inside the CD276WT spheroids display higher MFI
of CD276 compared to their counterparts in C D276KO spheroids, which could be due to tragocytosis as initially
hypothesized. It is also noteworthy to mention, in our spheroid-macrophage coculture experiments, genetic
editing of macrophages to knockout CD276 was not completely successful, and depending on the donor, up to
30% of macrophages still expressed detectable CD276. Despite of no correlation observed between the count of
infiltrated macrophages versus percentage of CD276-expressing macrophages, we still cannot formally rule out
a contribution of CD276+ macrophages to the spheroid recruitment.
Scientific Reports | (2021) 11:14849 | https://doi.org/10.1038/s41598-021-94360-9 10
Vol:.(1234567890)www.nature.com/scientificreports/
Figure 6. Graphical summary of the highlights. CD276 expression on tumor cells is an important player in
macrophage recruitment and an upstream modulator for PAI-1 production in tumor microenvironment.
When we screened for soluble proteins in the supernatant of these cultures, three major soluble factors were
affected: Dkk-1, PAI-1 and uPA. The involvement of Dkk-1, negative regulator for Wnt signaling, in cell adhesion
and migration has been implied but currently in debate regarding its role as PAI-1 m odulator50,51. Therefore, we
focused on uPA and PAI-1. Proteolytic activity of macrophage-produced uPA was demonstrated to be essential
for matrix degradation and adhesion leading to macrophage infiltration in a 3D matrigel experimental s etting52.
However, in our 3D spheroid setting, addition of exogenous uPA neither restored the macrophage recruitment
nor affected the PAI-1 concentration. Moreover, besides uPA, PAI-1 interacts with other proteins including the
low-density lipoprotein receptor-related protein 1 (LRP1), and vitronectin. Indeed, the LRP1-PAI-1 interaction
was proposed to be responsible for macrophage recruitment in an in vivo tumor model54, yet a recent publica-
tion challenged the previous observation by demonstrating that increased PAI-1 in skeletal muscle in aged mice
resulted in delayed macrophage recruitment55. Despite using different models, these contradictory data indicate
the necessity of further investigation to elaborate the involvement of PAI-1 in macrophage mobility. On the
other hand, studies performed in cancer patients have been providing supportive data. A pan-cancer analysis of
coagulome and TME environment across multiple tumor samples highlighted the positive correlation of CD276
to PAI-1 and u PA56. As in line with our data, a role of CD276high TAM in triple-negative breast cancer patients
was attributed to ECM modeling for immune cell infiltration46. However, whether PAI-1 acts as a checkpoint
for macrophages to infiltrate in our setting requires further investigation.
We decided to further investigate CD276 biology by targeting it with specific antibodies. While using one of
the antibodies currently tested in clinical trials would be more clinically relevant, accessing these antibodies are
not easy. Hence, we used commercially available antibodies in our assays and this antibody might have different
features than the ones in clinical trials. Targeting CD276 with specific antibodies in our spheroid-macrophage
coculture resulted in increased macrophage numbers in spheroids, suggesting that CD276 favors in our setting
for tumor-supportive macrophage. In this experiment, one striking result was the selective effect of αCD276
antibody treatment on CD276 expression on macrophages. In the presence of αCD276 antibody, its overall
expression on macrophages was reduced. We ruled out the epitope competition between staining antibody and
treatment antibody, since CD276 staining was not complete demolished, rather a reduction in expression was
observed. Additionally, this shift in expression was only observed on macrophages but not on tumor cells in the
same sample. As a result, we wanted to explore further the impact of targeting CD276 on macrophages. Since
GM-CSF generated MDMs significantly expressed higher CD276, we included these cells as well in the further
experiments.
The cytoplasmic tail of CD276 is short and has no known signaling motif, yet CD276 overexpression on tumor
cells was reported to increase Jak2 and STAT3 p hosphorylation16, therefore we speculated that any induction of
Scientific Reports | (2021) 11:14849 | https://doi.org/10.1038/s41598-021-94360-9 11
Vol.:(0123456789)www.nature.com/scientificreports/
downstream signaling might occur via a cis-partnership and one or more of the immunoreceptors expressed on
macrophages are potential candidates. According to our phospho-immunoreceptor array experiment performed
on macrophages, αCD276 treatment on M-CSF and GM-CSF MDMs induced different patterns of immuno-
receptor phosphorylation. ILT2, ILT4 and ILT5 phosphorylation tend to be stronger in M-CSF MDMs, while
LAIR-1, PECAM-1 and Siglec-3 phosphorylation was only detected in GM-CSF MDMs. All these receptors are
inhibitory receptors, supporting the idea of CD276 being an inhibitory molecule. In both MDM subset varieties,
the phosphorylation of FcγRIIα raised a question about Fc binding of the antibody. All of the experiments were
conducted in Fcγ Receptor blocking conditions, yet still to clarify the unspecific involvement of Fcγ receptors,
THP1WT and THP1CD276KO cells were treated with αCD276 antibody and FcγRIIα phosphorylation was only
detected in THP1WT cells indicating that crosslinking for this antibody is essential for its function (Supplemen-
tary Fig. 8). Our further analysis with kinase phosphorylation confirmed the differential impact of αCD276 on
M-CSF and GM-CSF MDMs. Only in GM-CSF MDMs, αCD276 treatment induced CREB, HSP27, ERK1/2,
RSK1/2/3, STAT3 and c-Jun phosphorylation. According to our tumor data, CD276 could be an upstream regu-
lator for PAI-1. To understand whether this is universal or tumor specific, we stimulated macrophages under
different conditions in the presence of αCD276 and quantified PAI-1 and uPA production. Overall, M-CSF
generated MDMs produced more uPA than GM-CSF generated MDMs whereas the opposite was observed for
PAI-1 production. In M-CSF generated MDMs, neither uPA nor PAI-1 was detectably affected upon αCD276
treatment in any condition. On the other hand, in GM-CSF MDMs, αCD276 treatment tended to increase the
PAI-1 production that could reduce their migration ability in the tissue. The higher potency of αCD276 antibody
treatment on GM-CSF MDMs in comparison to M-CSF MDMs could be due to a difference in expression of
CD276 or the potential cis-partner.
Overall, as summarized in Fig. 6, our study demonstrates a connection between CD276, macrophage recruit-
ment and PAI-1 modulation in tumor, which is an important point to consider while developing αCD276-based
immunotherapies. Additionally, our data suggest for the first time that a potential role of CD276 in initiating
downsignaling in macrophages and we regard these data as a starting point to investigate further the CD276
function on macrophages.
Received: 17 February 2021; Accepted: 7 July 2021
References
1. Ling, V. et al. Duplication of primate and rodent B7–H3 immunoglobulin V- and C-like domains: divergent history of functional
redundancy and exon loss. Genomics 82, 365–377. https://doi.org/10.1016/s0888-7543(03)00126-5 (2003).
2. Chapoval, A. I. et al. B7–H3: a costimulatory molecule for T cell activation and IFN-gamma production. Nat Immunol 2, 269–274.
https://doi.org/10.1038/85339 (2001).
3. Luo, L. et al. B7–H3 enhances tumor immunity in vivo by costimulating rapid clonal expansion of antigen-specific C D8+ cytolytic
T cells. J Immunol 173, 5445–5450. https://doi.org/10.4049/jimmunol.173.9.5445 (2004).
4. Suh, W. K. et al. The B7 family member B7–H3 preferentially down-regulates T helper type 1-mediated immune responses. Nat
Immunol 4, 899–906. https://doi.org/10.1038/ni967 (2003).
5. Leitner, J. et al. B7–H3 is a potent inhibitor of human T-cell activation: no evidence for B7–H3 and TREML2 interaction. Eur J
Immunol 39, 1754–1764. https://doi.org/10.1002/eji.200839028 (2009).
6. Tran, C. N. et al. Interactions of T cells with fibroblast-like synoviocytes: role of the B7 family costimulatory ligand B7–H3. J
Immunol 180, 2989–2998. https://doi.org/10.4049/jimmunol.180.5.2989 (2008).
7. Kim, J. et al. Constitutive and inducible expression of b7 family of ligands by human airway epithelial cells. Am J Respir Cell Mol
Biol 33, 280–289. https://doi.org/10.1165/rcmb.2004-0129OC (2005).
8. Kraan, J. et al. Endothelial CD276 (B7–H3) expression is increased in human malignancies and distinguishes between normal and
tumour-derived circulating endothelial cells. Br J Cancer 111, 149–156. https://doi.org/10.1038/bjc.2014.286 (2014).
9. Xu, L. et al. Stimulation of B7–H3 (CD276) directs the differentiation of human marrow stromal cells to osteoblasts. Immunobiol-
ogy 216, 1311–1317. https://doi.org/10.1016/j.imbio.2011.05.013 (2011).
10. Picarda, E., Ohaegbulam, K. C. & Zang, X. Molecular pathways: targeting B7–H3 (CD276) for human cancer immunotherapy.
Clin Cancer Res 22, 3425–3431. https://doi.org/10.1158/1078-0432.CCR-15-2428 (2016).
11. Sun, T. W. et al. B7–H3 is expressed in human hepatocellular carcinoma and is associated with tumor aggressiveness and postop-
erative recurrence. Cancer Immunol Immunother 61, 2171–2182. https://doi.org/10.1007/s00262-012-1278-5 (2012).
12. Ingebrigtsen, V. A. et al. B7–H3 expression in colorectal cancer: nuclear localization strongly predicts poor outcome in colon
cancer. Int J Cancer 131, 2528–2536. https://doi.org/10.1002/ijc.27566 (2012).
13. Inamura, K. et al. Tumor B7–H3 (CD276) expression and survival in pancreatic cancer. J Clin Med https://doi.org/10.3390/jcm70
70172 (2018).
14. Zang, X. et al. Tumor associated endothelial expression of B7–H3 predicts survival in ovarian carcinomas. Mod Pathol 23, 1104–
1112. https://doi.org/10.1038/modpathol.2010.95 (2010).
15. Chen, Y. W., Tekle, C. & Fodstad, O. The immunoregulatory protein human B7H3 is a tumor-associated antigen that regulates
tumor cell migration and invasion. Curr Cancer Drug Targets 8, 404–413. https://doi.org/10.2174/156800908785133141 (2008).
16. Liu, F., Zhang, T., Zou, S., Jiang, B. & Hua, D. B7H3 promotes cell migration and invasion through the Jak2/Stat3/MMP9 signaling
pathway in colorectal cancer. Mol Med Rep 12, 5455–5460. https://doi.org/10.3892/mmr.2015.4050 (2015).
17. Liu, H. et al. B7–H3 silencing increases paclitaxel sensitivity by abrogating Jak2/Stat3 phosphorylation. Mol Cancer Ther 10,
960–971. https://doi.org/10.1158/1535-7163.MCT-11-0072 (2011).
18. Nunes-Xavier, C. E. et al. Decreased expression of B7–H3 reduces the glycolytic capacity and sensitizes breast cancer cells to AKT/
mTOR inhibitors. Oncotarget 7, 6891–6901. https://doi.org/10.18632/oncotarget.6902 (2016).
19. Brunner, A., Hinterholzer, S., Riss, P., Heinze, G. & Brustmann, H. Immunoexpression of B7–H3 in endometrial cancer: relation
to tumor T-cell infiltration and prognosis. Gynecol Oncol 124, 105–111. https://doi.org/10.1016/j.ygyno.2011.09.012 (2012).
20. Mao, Y. et al. Cancer cell-expressed B7–H3 regulates the differentiation of tumor-associated macrophages in human colorectal
carcinoma. Oncol Lett 14, 6177–6183. https://doi.org/10.3892/ol.2017.6935 (2017).
21. Wang, L. et al. B7–H3 is overexpressed in patients suffering osteosarcoma and associated with tumor aggressiveness and metastasis.
PLoS ONE 8, e70689. https://doi.org/10.1371/journal.pone.0070689 (2013).
Scientific Reports | (2021) 11:14849 | https://doi.org/10.1038/s41598-021-94360-9 12
Vol:.(1234567890)You can also read


