Automated precipitation monitoring with the Thies disdrometer: biases and ways for improvement - AMT
←
→
Page content transcription
If your browser does not render page correctly, please read the page content below
Atmos. Meas. Tech., 13, 4683–4698, 2020
https://doi.org/10.5194/amt-13-4683-2020
© Author(s) 2020. This work is distributed under
the Creative Commons Attribution 4.0 License.

Automated precipitation monitoring with the Thies disdrometer:
biases and ways for improvement
Michael Fehlmann1 , Mario Rohrer1,2 , Annakaisa von Lerber3 , and Markus Stoffel1,4,5
1 Climate Change Impacts and Risks in the Anthropocene (C-CIA), Institute for Environmental Sciences,
University of Geneva, Geneva, Switzerland
2 Meteodat GmbH, Zurich, Switzerland
3 Finnish Meteorological Institute (FMI), Helsinki, Finland
4 Department of Earth Sciences, University of Geneva, Geneva, Switzerland
5 Department F.-A. Forel for Environmental and Aquatic Sciences, University of Geneva, Geneva, Switzerland

Correspondence: Michael Fehlmann (michael.fehlmann@unige.ch)

Received: 2 December 2019 – Discussion started: 23 January 2020
Revised: 22 July 2020 – Accepted: 24 July 2020 – Published: 4 September 2020

Abstract. The intensity and phase of precipitation at the         the OTT pluviometer seems promising as it allows for im-
ground surface can have important implications not only for       provement of snow density estimates, which poses a chal-
meteorological and hydrological situations but also in terms      lenge to all optical precipitation measurements. Finally, we
of hazards and risks. In the field, Thies disdrometers are        show that the Thies disdrometer and the 2DVD agree well
sometimes used to monitor the quantity and nature of pre-         insofar as the distinction between rain and snowfall is con-
cipitation with high temporal resolution and very low main-       cerned, such that an important prerequisite for the proposed
tenance and thus provide valuable information for the man-        correction methods is fulfilled. Uncertainties mainly persist
agement of meteorological and hydrological risks. Here, we        during mixed-phase precipitation or low precipitation inten-
evaluate the Thies disdrometer with respect to precipitation      sities, where the assignment of precipitation phase is tech-
detection, as well as the estimation of precipitation intensity   nically challenging, but less relevant for practical applica-
and phase at a pre-alpine site in Switzerland (1060 m a.s.l.),    tions. We conclude that the Thies disdrometer is suitable not
using a weighing precipitation gauge (OTT pluviometer) and        only to estimate precipitation intensity but also to distinguish
a two-dimensional video disdrometer (2DVD) as a reference.        between rain and snowfall. The Thies disdrometer therefore
We show that the Thies disdrometer is well suited to de-          seems promising for the improvement of precipitation mon-
tect even light precipitation, reaching a hit rate of around      itoring and the nowcasting of discharge in pre-alpine areas,
95 %. However, the instrument tends to systematically un-         where considerable uncertainties with respect to these quan-
derestimate rainfall intensities by 16.5 %, which can be re-      tities are still posing a challenge to decision-making.
lated to a systematic underestimation of the number of rain-
drops with diameters between 0.5 and 3.5 mm. During snow-
fall episodes, a similar underestimation is observed in the
particle size distribution (PSD), which is, however, not re-      1   Introduction
flected in intensity estimates, probably due to a compensa-
tion by snow density assumptions. To improve intensity es-        The intensity and type of precipitation falling on the ground
timates, we test PSD adjustments (to the 2DVD) and direct         surface (e.g., rain, snow, drizzle, or hail) often determines
adjustments of the resulting intensity estimates (to the OTT      the absence or occurrence of subsequent processes. A de-
pluviometer), the latter of which are able to successfully re-    tailed knowledge on the nature and intensity of precipita-
duce the systematic deviations during rainfall in the valida-     tion is therefore decisive in terms of hazards and ensuing
tion period. For snowfall, the combination of the 2DVD and        risks. For example, for the management of traffic roads, it
                                                                  is important to know whether falling snow or mist will likely

Published by Copernicus Publications on behalf of the European Geosciences Union.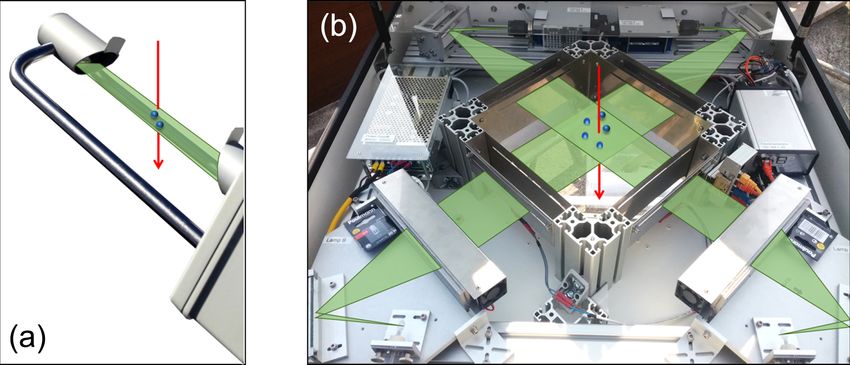
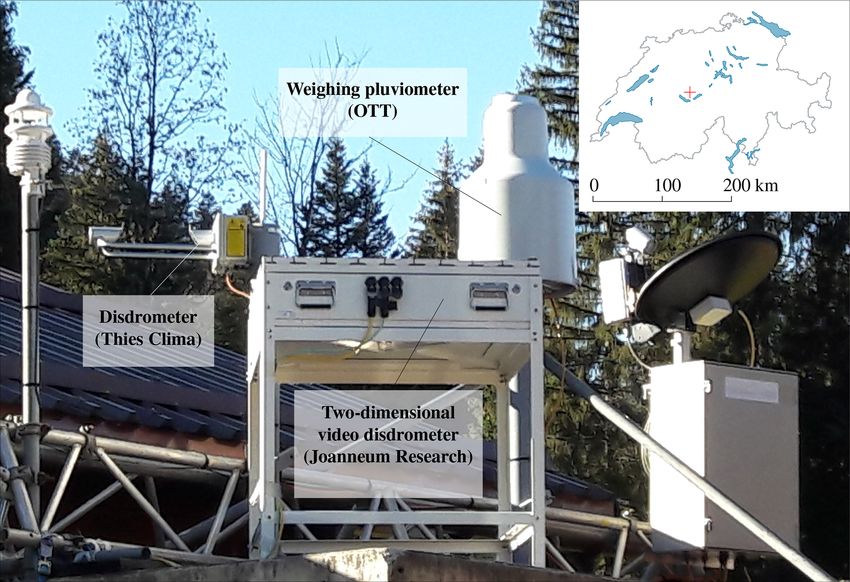
4684                                               M. Fehlmann et al.: Precipitation monitoring with the Thies disdrometer

hamper road conditions or visibility (Toivonen and Kanto-          of 2 years. The 2DVD provides accurate information about
nen, 2001). In this context, Juga et al. (2012) show that very     the volume and velocity of falling hydrometeors and has al-
poor visibility due to intense snowfall, combined with re-         ready been used previously as a reference to correct particle
duced road surface friction, caused a severe flow of accidents     size and velocity (Parsivel) distributions of laser disdrome-
in Helsinki on 17 March 2005. Likewise, the occurrence of          ters during either rainfall (Leinonen et al., 2012; Raupach
freezing rain at the ground surface can lead to the collapse       and Berne, 2015) or snowfall (Battaglia et al., 2010), even if
of trees and power supply lines with potentially catastrophic      the 2DVD seems to underestimate droplets in the lower range
cascading effects, as was experienced during a recent case         of diameters, i.e., below 0.5 mm (Raupach et al., 2019; Thu-
in Slovenia (Kämäräinen et al., 2017; Schauwecker et al.,          rai et al., 2017; Thurai and Bringi, 2018). In this study, we
2019). Last, but not least, both precipitation intensity and its   include both solid and liquid precipitation events and point to
phase (i.e., rain or snowfall) are decisive for runoff formation   differences in resulting correction methods. Furthermore, we
and the occurrence of flash floods in (pre-)alpine catchments      develop a hydrometeor classification algorithm for the 2DVD
(e.g., Fehlmann et al., 2018; Tobin et al., 2012).                 measurements as a basis for the evaluation of precipitation
   To support decision-making and intervention in such situa-      phase estimates. Whereas other studies have developed such
tions, the Thies Clima laser precipitation monitor (in the fol-    algorithms using bulk variables for the classification (e.g.,
lowing referred to as Thies disdrometer) offers the possibility    Grazioli et al., 2014), here we have implemented a particle-
to measure precipitation intensity and type with a high tem-       by-particle classification method allowing to explore result-
poral resolution; the monitor can therefore replace present        ing mixing ratios in the case of mixed-phase precipitation.
weather observations from manned stations to a certain de-            The paper is organized as follows: in Sect. 2, the measure-
gree (Merenti-Välimäki et al., 2001). Due to their low main-       ment devices are presented in more detail and the processing
tenance requirements, disdrometers have been used widely           of the raw data is described. In Sect. 3, biases and proposed
for operational weather monitoring for road or air traffic.        corrections of the Thies disdrometer are presented with re-
More recently, the Thies disdrometer has also been tested          spect to precipitation detection and the monitoring of precip-
with the aim of verifying dual-polarimetric weather radars,        itation intensity and phase. In Sect. 4, results are discussed
and in particular their hydrometeor classification algorithms      and conclusions are drawn with respect to the operational
(Pickering et al., 2019). Aside from the calibration and veri-     monitoring of precipitation with the Thies disdrometer, as
fication of rainfall estimation by radar and satellite, disdrom-   well as potential applications in a hydrological context.
eters are also used for a proper understanding of hydrome-
teorological regimes and soil erosion, pollution wash off in
urban environments, or interactions of rainfall with crop and      2     Data and methods
forest canopies (Angulo-Martínez et al., 2018; Frasson and
Krajewski, 2011; Nanko et al., 2004, 2013). In the future,         2.1    Measurement devices
disdrometers will likely be employed more often for hydro-
logical purposes as well, with the aim of monitoring heavy         The Thies disdrometer is evaluated in this study by us-
precipitation and the ensuing nowcasting of river discharge,       ing a weighing precipitation gauge (OTT pluviometer) and
particularly in mountainous environments where precipita-          a 2DVD as a reference. Measurements have been taken
tion phase estimates are still uncertain (e.g., Unterstrasser      over a duration of 2 years (1 July 2017–30 June 2019).
and Zängl, 2006). However, there are only a few studies            These instruments have been set up at Innereriz, Switzerland
that assess the uncertainties of the Thies disdrometer, mostly     (1060 m a.s.l., Fig. 1) and are described in more detail in the
comparing the instrument to OTT Parsivel disdrometers (e.g.,       following.
Adirosi et al., 2018; Angulo-Martínez et al., 2018; Guyot             The Thies disdrometer is designed to estimate precipita-
et al., 2019; Upton and Brawn, 2008) and (in a few cases) to       tion intensity and different types of precipitation (e.g., driz-
rain gauges (e.g., Lanza and Vuerich, 2012; Lanzinger et al.,      zle, rain, hail, snow, or mixed precipitation). Precipitation
2006). Furthermore, weather radars still suffer from limita-       type and intensity are estimated on the basis of an optical
tions in the detection of convective precipitation or due to the   principle, i.e., by the generation of a laser beam (786 nm)
blocking of the radar signal at lower elevations by mountain       attenuated by falling particles (Fig. 2a). The strength and du-
topography (Besic et al., 2016), therefore rendering reliable      ration of this attenuation allows for an inference of the diam-
ground observations even more important in these areas.            eter and velocity of the falling particles, such that precipita-
   In this study, we evaluate the Thies disdrometer with re-       tion type can be estimated by using empirical relationships
spect to precipitation detection, as well as the monitoring        between these two quantities (e.g., Gunn and Kinzer, 1949).
of precipitation intensity and phase, at a well-instrumented       The exact functioning of this classification algorithm, as well
measuring site in Switzerland (Innereriz, 1060 m a.s.l.). To       as the other equations used, are thereby not reported by the
this end, we have used a weighing precipitation gauge              manufacturer. To derive precipitation intensity from raw par-
(OTT pluviometer) and a two-dimensional video disdrometer          ticle data, several assumptions have to be made that also re-
(2DVD) as reference instruments over a measurement period          gard particle shape and density. Whereas for liquid precipita-

Atmos. Meas. Tech., 13, 4683–4698, 2020                                             https://doi.org/10.5194/amt-13-4683-2020
M. Fehlmann et al.: Precipitation monitoring with the Thies disdrometer                                                            4685

                                                                        tered particles is only very small (on the order of 2 %–3 %)
                                                                        in our case.
                                                                           The 2DVD, developed by Joanneum research, is able to
                                                                        derive more direct and detailed information about individ-
                                                                        ual hydrometeors than the Thies disdrometer. Maintenance
                                                                        requirements for the instrument are not negligible, and it is
                                                                        mainly used in the research context and in combination with
                                                                        radar observations (e.g., Bringi et al., 2015; Gorgucci and
                                                                        Baldini, 2015; Huang et al., 2010, 2015; Thurai et al., 2012).
                                                                        Furthermore, the 2DVD has been used for the correction of
                                                                        laser disdrometers (Raupach and Berne, 2015). As shown
                                                                        in Fig. 2b, falling hydrometeors are detected by two opti-
                                                                        cal cameras from two perspectives, which allows us to de-
                                                                        rive more detailed information about the shape and volume
                                                                        of individual particles, as well as their velocity. Information
Figure 1. Measurement devices located in a pre-alpine area in           about these quantities is reported for each individual particle,
Switzerland (Innereriz, 1060 m a.s.l.). In this study, the Thies dis-   including the exact time of the observation (in ms). Precip-
drometer is evaluated using both the OTT pluviometer as well as a
                                                                        itation type is not (yet) reported by the instrument but can
two-dimensional video disdrometer as a reference during 2 years of
                                                                        be estimated on the basis of the raw particle data. To vali-
measurements.
                                                                        date precipitation type estimates by the Thies disdrometer, a
                                                                        classification algorithm was developed in this study, allow-
                                                                        ing an estimation of the type of each individual hydrometeor
                                                                        (Sect. 2.2).
tion, an oblate shape (Chuang and Beard, 1990) and a density               The OTT pluviometer is designed to automatically deter-
of 1 g cm−3 are assumed, and a spherical shape is considered            mine precipitation intensities and amounts. Unlike tipping
for solid precipitation. The density of a snow particle (rang-          bucket rain gauges, this instrument is based on the weigh-
ing from 5 to 450 g cm−3 ) is estimated, taking its diameter            ing of the precipitation amount in a high-precision load cell.
and velocity and the ambient temperature into account. As               Advantages compared to a tipping bucket rain gauge are par-
the exact relationship used is not reported by the manufac-             ticularly related to the measurement of solid precipitation
turer, a simplified relationship between particle diameter and          amounts, resulting in fewer losses due to the evaporation and
density is derived in this study to estimate precipitation inten-       the avoidance of a temporal lag effect in the measurement
sities in case of snowfall (Sect. 3.2). The dominant precipi-           (Savina et al., 2012). The instrument is thus able to measure
tation type (WMO table 4680) and precipitation intensity are            precipitation amounts with high accuracy and is therefore
reported by the instrument every minute. Furthermore, parti-            used as a reference for precipitation amounts at the ground
cle diameter and velocity distributions are summarized by the           surface in various applications, including the validation of
number of particles recorded in paired classes of diameters             disdrometers (e.g., Raupach and Berne, 2015). According to
(20 classes, ranging from 0.125 to 9 mm) and velocity (22               the operating instructions of the OTT pluviometer, the instru-
classes, ranging from 0 to 12 m s−1 ), yielding a total of 440          ment provides the raw precipitation values every 6 s using a
classes. Note that in some studies using optical disdrometer            resolution of 0.001 mm. After the application of special fil-
measurements, additional filters are applied to remove spu-             ter algorithms (e.g., a correction for wind effects), non-real-
rious measurements due to splashing or margin faller effects            time 1 min outputs are available at a resolution of 0.01 mm.
(e.g., Chen et al., 2016; Friedrich et al., 2013; Raupach and           Of course, it can be questioned whether very weak precipi-
Berne, 2015; von Lerber et al., 2017). Usually, such filters are        tation can actually be measured so accurately. For example,
based on a validity check of the combined diameter and fall             Tiira et al. (2016) found in their mass retrieval (performed
velocity information, e.g., excluding data that are more than           approximately every 5 min) that the output seems to fluctu-
60 % above or below the fall velocity–diameter relationship             ate and used a threshold of 0.2 mm h−1 for their analysis.
for rain (Jaffrain and Berne, 2011). However, as investigated           Furthermore, a well-known problem when using precipita-
in detail by Friedrich et al. (2013) for Parsivel disdrometers,         tion gauges mounted above ground is the undercatch due to
such spurious measurements mostly occur at wind speeds ex-              the influence of wind, which has been extensively studied for
ceeding 20 m s−1 . As our study is extremely wind-sheltered             rainfall (e.g., Pollock et al., 2018) and in particular for snow-
(see Sect. 4), we thus did not see the need to apply such a fil-        fall (e.g., Fassnacht, 2004; Kochendorfer et al., 2017; Yang,
ter in this study. This is further supported by an exploratory          2014; Wolff et al., 2015). The undercatch is thereby found to
analysis of applying the filter proposed by Chen et al. (2016)          be larger for snowfall than for rainfall and to increase with
to the Thies disdrometer measurements over the full time pe-            increasing wind speed. In this study, however, we do not ex-
riod, which revealed that the volume contribution of the fil-           plicitly correct for wind effects, as wind speeds at the study

https://doi.org/10.5194/amt-13-4683-2020                                                  Atmos. Meas. Tech., 13, 4683–4698, 2020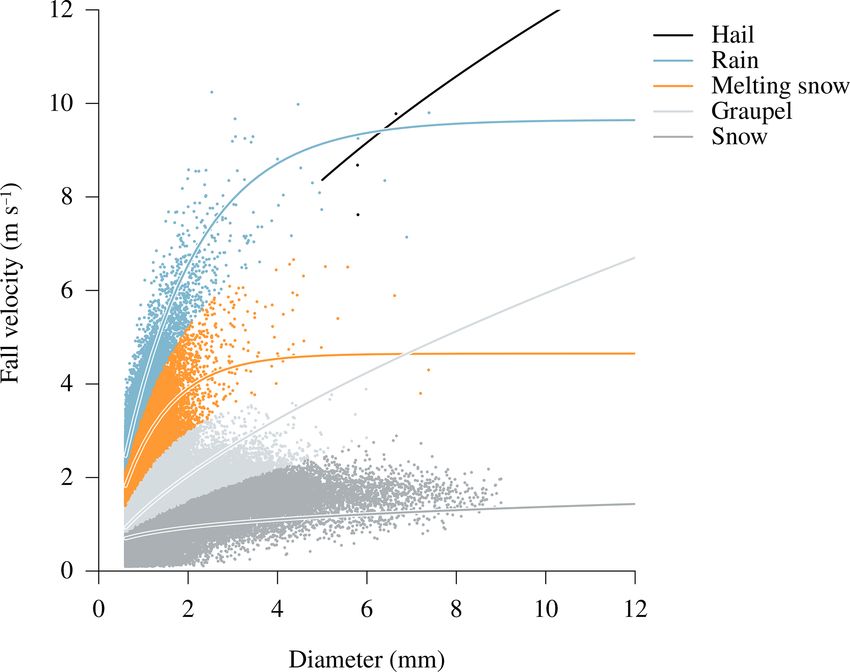
4686                                                  M. Fehlmann et al.: Precipitation monitoring with the Thies disdrometer

Figure 2. Comparison of the measurement principles of the Thies disdrometer (a) and the two-dimensional video disdrometer (2DVD, b):
while the Thies disdrometer measures the attenuation of an infrared laser beam (786 nm) via falling particles, the 2DVD detects the shadowing
of individual pixels in images taken by two optical cameras and from two perspectives.

site are generally very low (on average 0.46 m s−1 during the            analyses conducted by Joanneum Research.
investigated time period). The maintenance requirements of
the instrument are relatively low – only the container, which            VHail = 3.74 · D 0.5 ,                                          (1)
holds 750 mm for the model used, must be emptied regularly.              VRain = 9.65 − (10.3 · e−0.6·D ),                               (2)
Precipitation intensity and amount are reported every minute.                                            −0.95·D
   Finally, temperature and wind measurements of a LUFFT                 VMelting = 4.65 − (5 · e                  ),                    (3)
                                                                                              0.66
weather sensor are used in this study. This sensor was located           VGraupel = 1.3 · D          ,                                   (4)
at the same measuring station (Fig. 1) and provided corre-               VSnow = 0.79 · D   0.24
                                                                                                   .                                     (5)
sponding measurements every minute. Temperature is mea-
sured by way of a highly accurate negative temperature coef-                A particle is considered for classification only if its diame-
ficient (NTC) resistor in a ventilated housing with radiation            ter D and velocity V lie within a valid range (0.6 mm < D <
protection in order to keep the effects of external influences           9 mm, V < 17 m s−1 ) and if no major differences exist in par-
(e.g., solar radiation) as low as possible. The wind meter uses          ticle size between the two cameras (0.8 < HA /HB < 1.25,
four ultrasonic sensors that take cyclical measurements in all           where HA and HB denote the particle height in camera A
directions. The resulting wind speed and direction are calcu-            and B, respectively). For each valid particle, theoretical fall
lated from the measured run-time sound differential.                     speeds for different precipitation types are calculated accord-
                                                                         ing to its diameter and Eqs. (1)–(5). The estimated values are
                                                                         then compared to measured velocity, whereas precipitation
2.2    2DVD classification algorithm
                                                                         type is determined according to the closest match between
                                                                         these values. In addition, snow or melting snow above 10 ◦ C
As precipitation type is not reported by the 2DVD by default,            is reclassified as rain – a plausibility check which is also ap-
a classification algorithm was developed in this study to as-            plied by Thies Clima for the processing of Thies disdrometer
sign one of the following precipitation types to each observed           data. An example of the resulting particle-by-particle classi-
hydrometeor: hail, rain, melting snow, graupel, or snow. Un-             fication is given in Fig. 3 for a transition from rain to snowfall
like other algorithms (e.g., Grazioli et al., 2014), the algo-           during 6 h.
rithm used here is based on a particle-by-particle classifica-              After the inspection of 1 min mixing ratios of different
tion rather than on bulk information, which even allows for              precipitation types obtained by this classification algorithm
the explicit quantification of hydrometeor mixtures during a             (not shown here), we determined the dominant precipitation
given time period. For the validation of the Thies disdrom-              phase during 1 min as follows (Table 1): rain is considered
eter, the dominant precipitation type during 1 min observa-              dominant if more than 70 % of the particles are classified as
tions was then estimated on the basis of these mixing ratios.            rain, whereas snow and/or graupel are considered dominant if
   Similar to the Thies disdrometer, the classification algo-            more than 80 % of the particles are classified as snow, melt-
rithm is based on the empirical relationship between particle            ing snow, or graupel. Furthermore, hail is already assigned
diameter D and fall velocity V , which varies among differ-              for mixing ratios greater than 1 % as the chance of (larger)
ent types of precipitation. The equations used (Eqs. 1–5) are            hailstones being captured by the relatively small measuring
based on literature (Gunn and Kinzer, 1949; Locatelli and                area is quite small. In the remaining cases, mixed-phase pre-
Hobbs, 1974; Mitchell, 1996), as well as measurements and                cipitation is assigned.

Atmos. Meas. Tech., 13, 4683–4698, 2020                                                    https://doi.org/10.5194/amt-13-4683-2020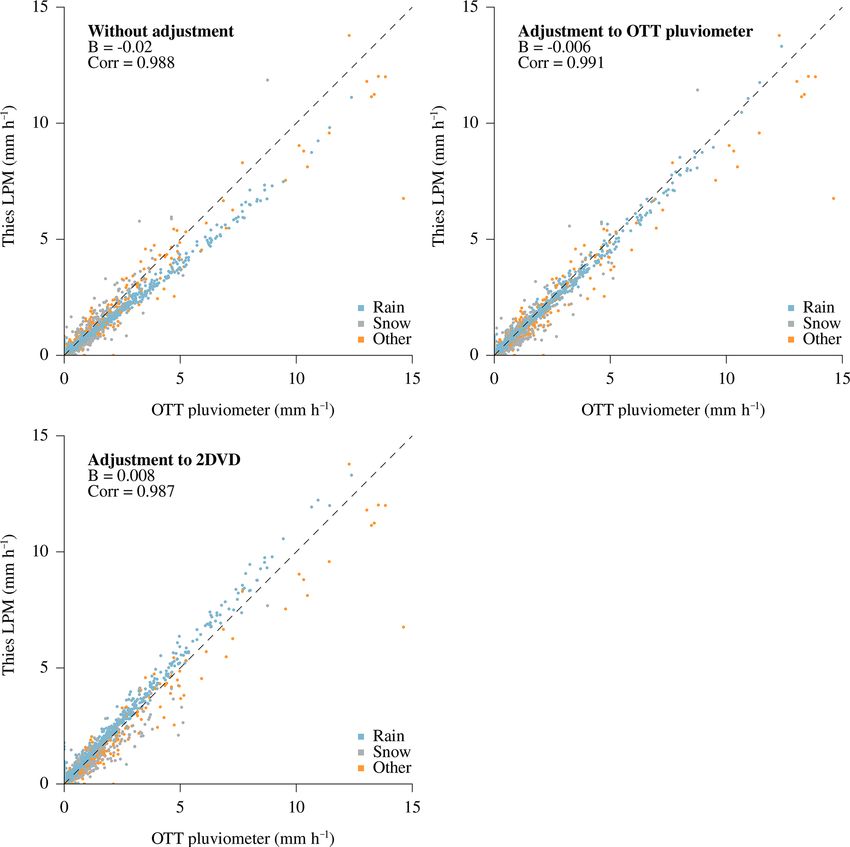
M. Fehlmann et al.: Precipitation monitoring with the Thies disdrometer                                                                4687

                                                                      Table 1. Reclassification scheme used for the comparison of domi-
                                                                      nant precipitation phase (1 min) between the Thies disdrometer and
                                                                      the two-dimensional video disdrometer (2DVD). Note that codes in
                                                                      square brackets refer to precipitation types that are not yet identifi-
                                                                      able automatically, i.e., that are not reported by the instrument.

                                                                       Analyzed     Thies disdrometer                  2DVD
                                                                                    (SYNOP table 4680)                 (Eqs. 1–5)
                                                                       Rain         51, 52, 53, [54 ,55 ,56], 57,      Rain > 70 %
                                                                                    58, 61, 62, 63, [64, 65, 66]
                                                                       Mixed        67, 68                             Rain ≤ 70 % and snow/
                                                                                                                       melting snow/graupel
                                                                                                                       ≤ 80 % and hail ≤ 1 %
                                                                       Snow         71, 72, 73, 74, 75, 76, 77, [78]   Snow/melting snow/
                                                                       /graupel                                        graupel > 80 %
                                                                       Hail         89                                 Hail > 1 %

Figure 3. Example of the classification algorithm developed in this
study during a transition from rain to snowfall (17 February 2018,    erational applications, we also report results for integration
17:00 to 23:00 UTC). After a plausibility check, each hydrometeor     times up to 4 h (i.e., 5, 10, 20, 30, 60, 90, 120, and 240 min).
detected by the two-dimensional video disdrometer is classified as    Intensities for different integration times are calculated based
one of five precipitation types (hail, rain, melting snow, graupel,
                                                                      on the cumulative precipitation sum, which is given by both
snow). This classification is based on empirical relationships be-
tween particle diameter and fall velocity (Eqs. 1–5).
                                                                      instruments. For all correction methods applied, the variable
                                                                      of interest is first integrated over the considered integration
                                                                      time before any correction is applied.
   To investigate the effect of applying different classification        When comparing the Thies disdrometer (or the OTT plu-
methodologies on obtained results, the classification algo-           viometer) with the 2DVD, 1 min observations can be used,
rithm described above was also applied to Thies data. Given           and the 2DVD data is aggregated accordingly. When com-
the binned data, the mean velocity and diameter of each V -D          paring the PSD between the two disdrometers, the number
class were used for the classification rather than information        of particles is normalized by the so-called effective measur-
about individual particles.                                           ing area. This area slightly deviates from the actual mea-
                                                                      suring area (being 45.32 cm2 for the Thies disdrometer and
2.3   Comparison of measurements and performance                      109.39 cm2 for the 2DVD) as a function of particle diameter.
      measures                                                        Essentially, the effective measuring area decreases for larger
                                                                      particles due to the increasing nonrecognition of partially ob-
The Thies disdrometer is evaluated by using the OTT plu-              served particles at the border of the measuring area. Whereas
viometer as a reference for precipitation detection and in-           the effective measuring area is reported by the 2DVD for
tensities and the 2DVD as a reference for particle size dis-          each observed particle, it is calculated for each diameter class
tribution (PSD) and precipitation type. The following com-            of the Thies disdrometer following Angulo-Martínez et al.
parisons refer to a time period of 2 years (1 July 2017–              (2018), using the mean diameter of each class. For the ad-
30 June 2019), during which all of these instruments have             justment of the particle size distribution (PSD) measured by
been installed simultaneously. Whereas the first year of mea-         the Thies disdrometer, we adopt a methodology proposed
surements (1 July 2017–30 June 2018) is used for the design           by Raupach and Berne (2015), which essentially scales drop
of the proposed correction methods, the second year of mea-           concentrations per diameter class to ensure that they on aver-
surements (1 July 2018–30 June 2019) is used for the inde-            age match those recorded by the 2DVD. The correction fac-
pendent validation of the methods.                                    tors used for this scaling correspond to the ratio of summed
   When comparing the Thies disdrometer with the OTT plu-             2DVD drop concentrations to summed Thies drop concen-
viometer, corresponding 1 min observations are merged. Al-            trations in the calibration period (1 July 2017–30 June 2018)
though both instruments are measuring with a resolution of            and are separately calculated for rain and snowfall. For the
1 min, they have not been set up to measure synchronously.            consistent comparison of precipitation phase between the
To avoid mismatches due to temporal shifts between observa-           two disdrometers, certain precipitation types were aggre-
tions, the minimum integration time considered for the eval-          gated according to Table 1. Furthermore, we only consider
uation of precipitation detection and precipitation intensities       pairwise complete (1 min) observations of both instruments
was set to 5 min. As the effect of increasing integration time        with either rain, snow, or mixed precipitation, resulting in a
on the reliability of measurements can be of interest for op-         time series of 2533 h of precipitation.

https://doi.org/10.5194/amt-13-4683-2020                                                  Atmos. Meas. Tech., 13, 4683–4698, 2020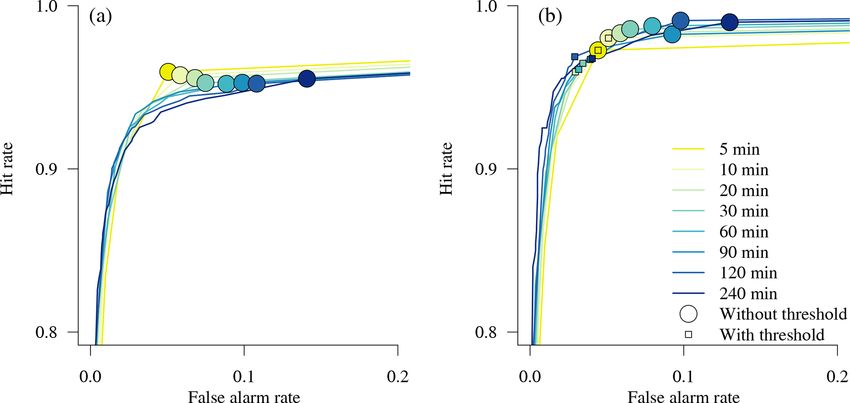
4688                                                M. Fehlmann et al.: Precipitation monitoring with the Thies disdrometer

   For the evaluation of categorical variables, i.e., pre-           Table 2. Minimum precipitation thresholds established in the cali-
cipitation detection (yes/no) and precipitation phase                bration period to optimize precipitation detection for different inte-
(rain/mixed/snow), hit and false alarm rates with respect            gration times. The thresholds are chosen to minimize the distance to
to the reference instrument are calculated according to              an ideal point in a receiver operating characteristic (ROC) diagram
Jolliffe and Stephenson (2012). In the case of precipitation         (i.e., a hit rate equal to 1 and a false alarm rate equal to 0, Fig. 4).
                                                                     The corresponding reduction in hit and false alarm rates and the re-
detection (yes/no), we further investigate the effect of
                                                                     sulting distance to this point are given for the independent validation
minimum precipitation thresholds applied to measurements             period.
of the Thies disdrometer on hit and false alarm rates by
investigating the so-called Receiver Operating Characteristic          1t       Threshold        1 Hit    1 False alarm       Distance to
(ROC) curves (e.g., Jolliffe and Stephenson, 2012). A                  (min)    (mm h−1 )     rate (%)         rate (%)     optimum (%)
ROC curve thereby depicts the variation of hit and false
alarm rates with the variation of such a threshold. For                5              0.10           0                 0               5.2
                                                                       10             0.05           0                 0               5.5
example, using a threshold of 0 mm h−1 for precipitation
                                                                       20             0.05         2.4               2.9               5.0
detection (i.e., always reporting precipitation regardless of          30             0.04         2.1               3.1               4.9
the measurement) will result in both a hit and a false alarm           60             0.03         2.7               4.8               5.0
rate of 1. On the other hand, choosing an indefinitely high            90             0.02         1.5               5.3               5.1
minimum precipitation threshold will result in both a hit and          120            0.02         2.2               6.9               4.3
a false alarm rate of 0. Between these extremes, the resulting         240            0.01         2.2               8.9               5.2
hit and false alarm rates depend on the capabilities of the
Thies disdrometer to detect precipitation as compared to the
reference instrument, while the theoretical optimum (hit rate        periods of 5 min) but tend to increase with increasing inte-
of 1 and false alarm rate of 0) can usually not be achieved.         gration time (e.g., 14.1 % for periods of 4 h).
To establish ROC curves for different integration times we              In a second step, we tested the application of minimum
use the fixed thresholds THROC = {0, 0.001, 0.002, ..., 0.05,        precipitation thresholds to the Thies disdrometer observa-
0.1, 0.15, ..., 1, 1.2, 1.4, ..., 3} in mm h−1 .                     tions in order to reduce false alarm rates for longer integra-
   For the evaluation of biases in precipitation intensity mea-      tion times. The ROC curves shown in Fig. 4 (left) thereby
surements, systematic deviations between the instruments             depict all possible combinations of hit and false alarm rates
are characterized in terms of the absolute bias B (Eq. 6),           that can be achieved by the introduction of such a threshold.
where x̂ denotes the estimation of the Thies disdrometer and         The application of a minimum threshold will generally re-
x denotes the measurement of the OTT pluviometer for all             duce both false alarms and hit rates. Therefore, an optimal
observations n.                                                      threshold was defined for each integration time by minimiz-
          n
                                                                     ing the Euclidean distance to the upper-left corner in the ROC
       1X                                                            diagram (i.e., to the theoretical optimum with a hit rate equal
B=           x̂i − xi                                         (6)
       n i=1                                                         to 1 and a false alarm rate equal to 0), resulting in a balanced
                                                                     solution between the two measures. This optimization was
                                                                     applied to the first year of measurements, and the resulting
3     Results                                                        thresholds are listed in Table 2 for each integration time. It
                                                                     is noteworthy that these thresholds (expressed in mm h−1 )
3.1    Precipitation detection                                       are quite stable for different integration times with a mean
                                                                     of 0.04 mm h−1 .
The capability of the Thies disdrometer to detect precipita-            The effect of applying the proposed thresholds on hit and
tion is assessed using the OTT pluviometer as a reference.           false alarm rates during the second year of measurements
After exploring the full time series, data from the first year       is depicted in Fig. 4b and Table 2. The application of such
of measurements was used to optimize precipitation detec-            thresholds is particularly beneficial for integration times ex-
tion by establishing minimum precipitation thresholds. The           ceeding 20 min, as they allow us to effectively reduce false
application of these thresholds was then evaluated during the        alarm rates by up to 8.9 % (for periods of 4 h). For integra-
second year of independent measurements.                             tion times shorter than 20 min, the application of a minimum
   The capability of the Thies disdrometer to distinguish pre-       precipitation threshold only has a negligible effect. Further-
cipitation from no precipitation is described in terms of its        more, by applying the proposed thresholds, a balanced so-
hit and false alarm rate when using the OTT pluviometer as           lution with respect to hit rates and false alarm rates can be
a reference. In a first step, hit and false alarm rates are calcu-   found for all the integration times considered, resulting in a
lated over the whole time series and are indicated with circles      relatively similar distance to the theoretical optimum in the
in Fig. 4a for different integration times. Thereby, hit rates       ROC diagram.
are stable and reach values between 95.2 % and 95.9 %. False
alarm rates are low for short integration times (e.g., 5.1 % for

Atmos. Meas. Tech., 13, 4683–4698, 2020                                                 https://doi.org/10.5194/amt-13-4683-2020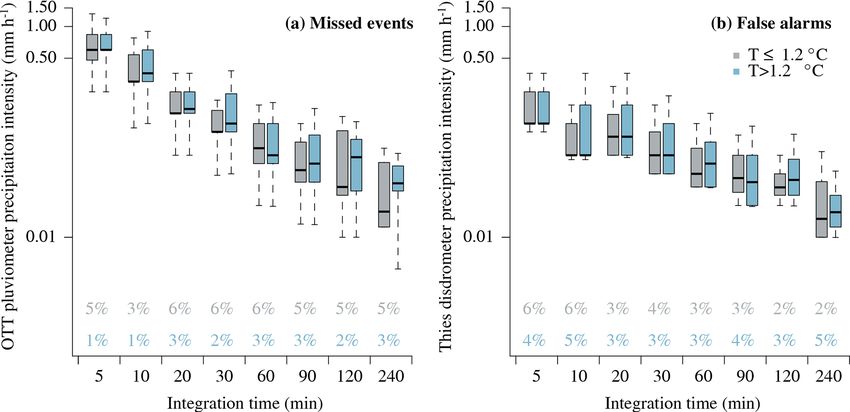
M. Fehlmann et al.: Precipitation monitoring with the Thies disdrometer                                                                     4689

Figure 4. Receiver operating characteristic (ROC) curves showing hit and false alarm rates of the Thies disdrometer with respect to the
detection of precipitation using the OTT pluviometer as a reference. (a) Exploration of hit and false alarm rates during the whole time series
(2 years). (b) Effect of applying minimum precipitation thresholds on hit and false alarm rates during the second year of measurements. Note
that the proposed thresholds are established during the first year of measurements in order to reduce false alarm rates, particularly for longer
integration times.

Figure 5. Distribution of precipitation intensities and phase during missed events (a) and false alarms (b) by the Thies disdrometer during
the validation period (each box shows the median and interquartile range of the distribution, while the whiskers extend to 1.5 times this
range from the box or to the most extreme data point). While precipitation intensities measured by the OTT pluviometer are analyzed during
missed events, precipitation intensities indicated by the Thies disdrometer are analyzed during false alarms. Events are separated according
to a temperature threshold (1.2 ◦ C), and the relative frequency of missed events, as well as the false alarm rate, is given at the bottom of each
panel for cases above and below this temperature threshold. Note that a logarithmic scale is used to display precipitation intensities.

   Finally, by applying the proposed minimum precipitation                 according to a temperature threshold of 1.2 ◦ C (Fehlmann
thresholds in Table 2, we analyze missed events as well as                 et al., 2018). The resulting distributions of precipitation in-
false alarms produced by the Thies disdrometer in the val-                 tensities and phase during missed events and false alarms
idation period in more detail, i.e., with respect to precipi-              are shown in Fig. 5. Precipitation intensities during missed
tation intensity and phase. Whereas precipitation intensities              events decrease with increasing integration time, mean in-
measured by the OTT pluviometer were of interest during                    tensities being around 0.6 mm h−1 during periods of 5 min
missed events, precipitation intensities indicated by the Thies            and decreasing to around 0.03 mm h−1 during periods of 4 h.
disdrometer were analyzed during false alarms. To investi-                 While precipitation intensities during missed events are very
gate whether the phase of precipitation could be relevant for              similar above and below the temperature threshold of 1.2 ◦ C,
missed events or false alarms, observations were separated                 the relative frequency of missed events seems to be slightly

https://doi.org/10.5194/amt-13-4683-2020                                                       Atmos. Meas. Tech., 13, 4683–4698, 2020
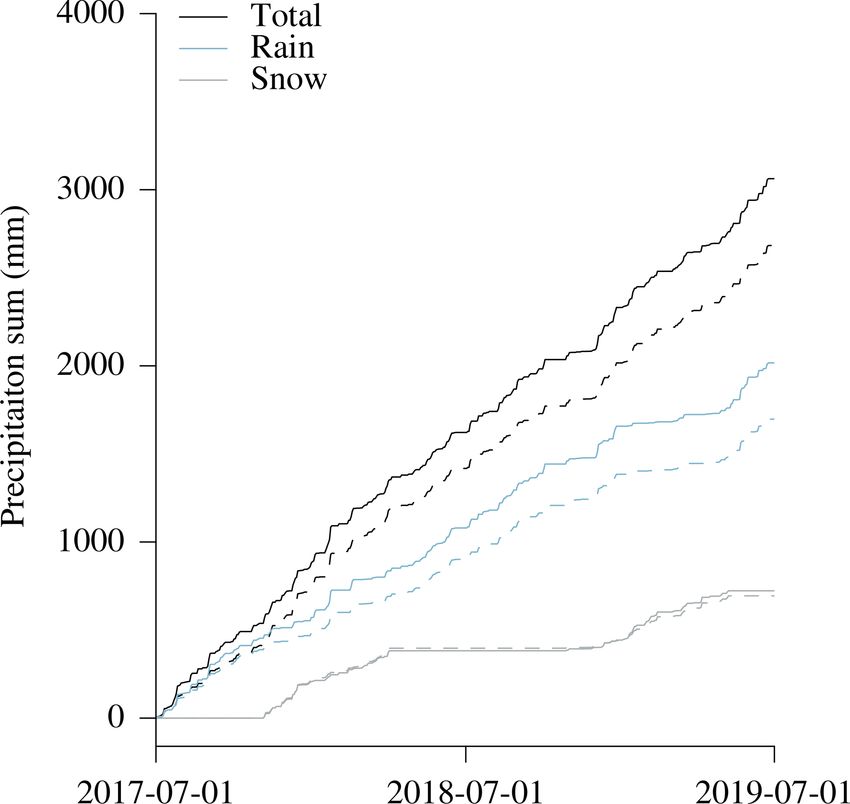
4690                                               M. Fehlmann et al.: Precipitation monitoring with the Thies disdrometer

higher below this temperature threshold. Precipitation inten-
sities indicated by the Thies disdrometer during false alarms
are very low, ranging from 0.12 mm h−1 for 5 min periods to
0.02 mm h−1 for 4 h periods, with no remarkable differences
above and below the temperature threshold of 1.2 ◦ C.

3.2    Precipitation intensities

The capability of the Thies disdrometer to measure precipita-
tion intensities is assessed with the OTT pluviometer as a ref-
erence for precipitation intensities as well as with the 2DVD
as a reference for the PSD. After exploring error patterns in
the entire time series, the first year of measurements was used
to establish corresponding correction methods. The applica-
tion of the established correction methods was then evalu-
ated with independent data from the second year of measure-
ments.
   Figure 6 depicts the cumulative precipitation sums of the
Thies disdrometer over the full investigation period as com-
pared to the OTT pluviometer. Precipitation sums for both
instruments are separated into rain and snow according to          Figure 6. Cumulative precipitation sums as measured by the Thies
1 min precipitation type estimates of the Thies disdrometer.       disdrometer (dashed lines) and the OTT pluviometer (solid lines)
As rain and snowfall events represent 89.5 % of the total pre-     during the whole time series (2 years). Precipitation sums are sepa-
cipitation sum, we restrict analysis to these two precipitation    rated into rain and snow based on the recorded dominant precipita-
types in the following. Total precipitation after 2 years of       tion type by the Thies disdrometer (1 min).
measurements is underestimated by 12.4 % by the Thies dis-
drometer. This systematic underestimation is almost entirely
related to rainfall events, during which the total precipitation   snowfall events is based on the recorded dominant precipi-
sum is underestimated by even 16.5 %. The underestimation          tation type by the Thies disdrometer (1 min). Although the
during snowfall events is much smaller (4.0 %) and seems           overall shape of the PSD is similar for both instruments,
to be less systematic but instead related to individual events     systematic deviations seem to exist during both rain and
during the second year of measurements.                            snowfall events. During rainfall events, the number of par-
   As a first approach to improve precipitation intensity esti-    ticles with diameters between 0.5 and 3.5 mm (class nos. 4–
mates by the Thies disdrometer, we tested a direct adjustment      12) is systematically underestimated, whereas the number of
to the measurements of the OTT pluviometer. A comparison           smaller and larger particles is overestimated by the Thies dis-
of precipitation intensities between these instruments during      drometer as compared to the 2DVD. When looking at the
the full investigation period is shown in Fig. 7 for an integra-   monthly variability of the resulting correction factors (Fig. 8,
tion time of 30 min; it confirms the error pattern described       right), the overestimation seems to be less stable than the un-
above: whereas a systematic underestimation of rainfall in-        derestimation. During snowfall, the number of particles with
tensities is visible, almost no systematic error can be seen       diameters exceeding 0.75 mm is overestimated, whereas the
with respect to snowfall intensities. Furthermore, the system-     number of smaller particles is underestimated as well. It is
atic underestimation of precipitation intensities seems to be      worth noting that the underestimation (class nos. 4–12 for
well captured by a constant factor (i.e., independent of inte-     rainfall and 5–22 for snowfall) will affect resulting estimates
gration time or precipitation intensity). We thus propose us-      of precipitation intensity in particular. In the case of rainfall
ing the ratio of the OTT pluviometer to the Thies disdrome-        and assuming the mean PSD obtained by the Thies disdrom-
ter precipitation sum as a correction factor and to distinguish    eter, particles between 0.5 and 3.5 mm (class nos. 4–12) con-
between rain and snowfall. Using the first year of measure-        tribute to 90 % of the total rainfall volume. The smallest and
ments, the resulting correction factors for rain and snowfall      largest particles are almost negligible for total volume due to
intensities are 1.20 and 0.96, respectively.                       their small volume (smallest particles) and number (largest
   As a second approach to improve precipitation intensity         particles), respectively. Nevertheless, we propose applying
estimates using the Thies disdrometer, we tested an adjust-        correction factors for the number of particles in each di-
ment of the PSD to the measurements of the 2DVD. A com-            ameter class and further distinguishing between rainfall and
parison of the summed PSD between these two instruments            snowfall. Using the first year of measurements, the resulting
is shown in Fig. 8 for all rain and snowfall events during         correction factors for rain and snowfall are listed in Table 3.
the whole time series (2 years). The separation into rain and      Given the corrected PSD, rainfall intensity is calculated by

Atmos. Meas. Tech., 13, 4683–4698, 2020                                              https://doi.org/10.5194/amt-13-4683-2020
M. Fehlmann et al.: Precipitation monitoring with the Thies disdrometer 4691
Figure 7. Precipitation intensities during periods of 30 min as recorded by the Thies disdrometer and the OTT pluviometer during the whole
time series (2 years). Precipitation is separated into rain (a) and snow (b) based on the recorded dominant precipitation type by the Thies
disdrometer (1 min). To highlight systematic errors, a linear regression is shown in both panels (red line), which is forced through the origin
and has a slope of 0.80 for rainfall intensities and of 1.05 for snowfall intensities.
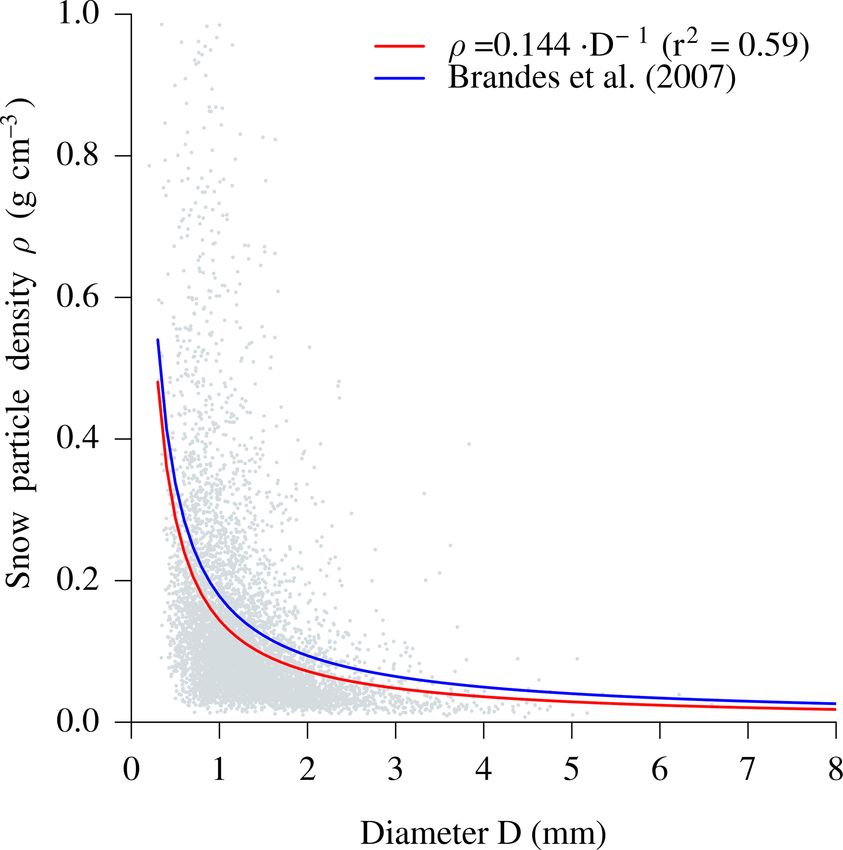
assuming a density of 1 g cm−3 . For snowfall, a relationship Table 3. Correction factors for the number of particles in 22 diam-
between particle diameter and density is established by com- eter classes as measured by the Thies disdrometer, resulting from a
paring 1 min accumulated volumes (measured by the 2DVD) comparison to the two-dimensional video disdrometer in the cal-
to the corresponding mass (measured by the OTT pluviome- ibration period. Measurements are separated into rain and snow
ter) and is shown in Fig. 9. based on the recorded dominant precipitation type by the Thies dis-
drometer (1 min).
The effect of both correction methods proposed here was
subsequently tested during the second year of measurements.
Rain Snow
The resulting biases of the Thies disdrometer before and af-
Class correction correction
ter the correction are given in Table 4 for different integra- (no.) Range (mm) factor factor
tion times. These biases are thereby calculated for the whole
dataset, as well as for all rain and snowfall separately. An ex- 1 0.125–0.25 0.92 0.43
ample for the integration time of 30 min is further given in 2 0.25–0.375 0.83 0.55
Fig. 10. As can be seen in Table 4 and Fig. 10, the most ro- 3 0.375–0.5 0.92 0.68
4 0.5–0.75 1.08 0.78
bust result is achieved by the adjustment of rainfall intensities
5 0.75–1 1.57 1.26
to the OTT pluviometer, which successfully reduces the un- 6 1–1.25 1.40 1.25
derestimation of liquid precipitation in the validation period. 7 1.25–1.5 1.43 1.21
The adjustment of rainfall intensities to the 2DVD, however, 8 1.5–1.75 1.38 1.20
results in a positive bias in the validation period. For snow- 9 1.75–2 1.35 1.19
fall, both correction methods have a smaller impact and even 10 2–2.5 1.29 1.20
result in slightly higher negative biases than are present with- 11 2.5–3 1.18 1.21
out any adjustment. 12 3–3.5 1.10 1.18
13 3.5–4 0.92 1.12
14 4–4.5 0.88 1.11
3.3 Precipitation phase
15 4.5–5 0.81 1.08
16 5–5.5 0.63 1.04
The capability of the Thies disdrometer to detect the predom- 17 5.5–6 0.34 1.04
inant precipitation type is assessed using the 2DVD as a ref- 18 6–6.5 0.70 1.02
erence. We thereby focus on the precipitation phase, i.e. the 19 6.5–7 0.29 1.02
distinction of rain and snowfall, which has been shown above 20 7–7.5 0.17 1.02
to be an important criterion for the proposed correction meth- 21 7.5–8 0.17 1.01
ods. 22 >8 0.19 1.06
Table 5 shows the agreement of precipitation phase esti-
mates between the Thies disdrometer and the 2DVD during
the full time series, while Fig. 11 depicts the relative fre-
https://doi.org/10.5194/amt-13-4683-2020 Atmos. Meas. Tech., 13, 4683–4698, 2020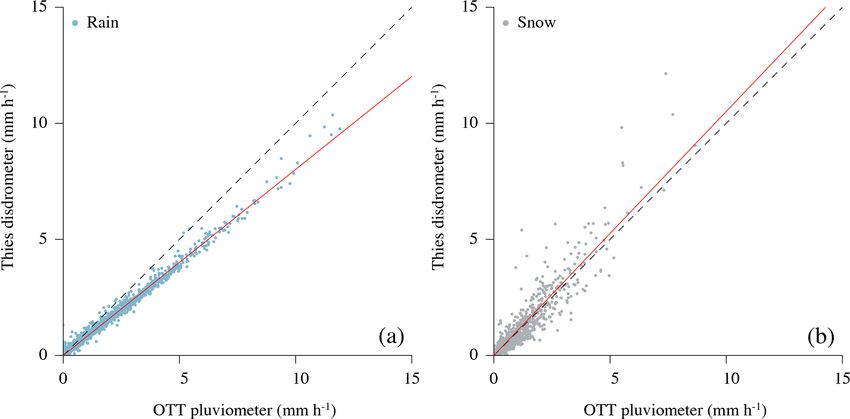
4692 M. Fehlmann et al.: Precipitation monitoring with the Thies disdrometer
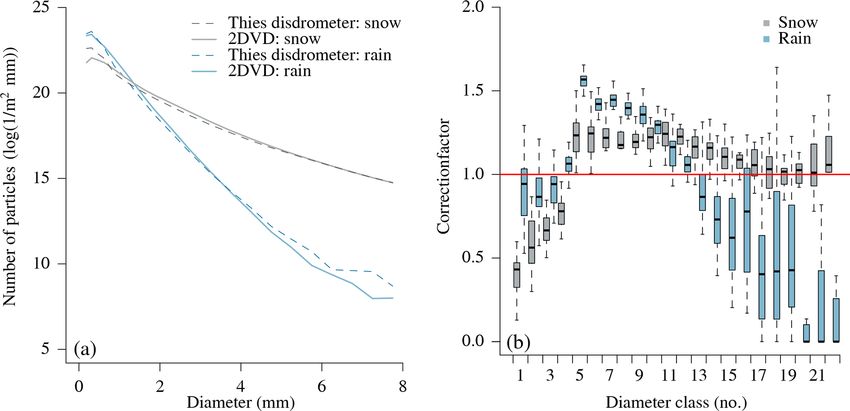
Figure 8. Comparison of particle size distribution (PSD) obtained by the Thies disdrometer and the two-dimensional video disdrometer
(2DVD) during the whole time series (2 years). (a) Summed PSD during all observed rain and snowfall events. The separation into rain and
snowfall events is based on the recorded dominant precipitation type by the Thies disdrometer (1 min). (b) Resulting correction factors for
different diameter classes of the Thies disdrometer, using the 2DVD as a reference. Thereby, the median and variability of these correction
factors is shown using monthly results (each box shows the interquartile range of the distribution, while the whiskers extend to 1.5 times this
range from the box or to the most extreme data point).
Table 4. Biases in precipitation intensity measurements of the Thies disdrometer during the second year of measurement using the OTT
pluviometer as a reference. The absolute bias B (Eq. 6) of the uncorrected measurements is given for all events, as well as for rain and
snowfall separately (left value). Furthermore, the effect of the two proposed correction methods is shown, i.e., the adjustment to the OTT
pluviometer (middle value) and the two-dimensional video disdrometer (right value). The correction methods are thereby established during
the first year of measurements.
1t (min) All events Rain Snow
5 −0.02/< 0.01/0.01 −0.23/0.02/0.23 −0.05/−0.09/−0.19
10 −0.02/< 0.01/0.01 −0.19/0.01/0.20 −0.05/−0.08/−0.15
20 −0.02/−0.01/0.01 −0.16/< 0.01/0.16 −0.03/−0.06/−0.11
30 −0.02/−0.01/0.01 −0.14/< 0.01/0.14 −0.03/−0.05/−0.08
60 −0.02/−0.01/0.01 −0.11/< 0.01/0.11 −0.02/−0.04/−0.05
90 −0.02/−0.01/0.01 −0.10/< 0.01/0.10 −0.02/−0.04/−0.05
120 −0.02/−0.01/0.01 −0.08/< 0.01/0.09 −0.02/−0.03/−0.04
240 −0.02/−0.01/0.01 −0.06/< 0.01/0.07 −0.02/−0.03/−0.03
quency of observations as a function of temperature for both the 2DVD (4.3 %), resulting in both a low hit and false alarm
instruments, including an indication of the mixing ratios ob- rate for these cases.
tained by the 2DVD. Thereby, the Thies disdrometer agrees Most misclassifications are related to cases during which
well with the 2DVD insofar as the classification of rain and the Thies disdrometer indicates rain, whereas the 2DVD indi-
snow is concerned. By contrast, larger differences exist with cates mixed precipitation or snow. As can be seen in Fig. 11,
respect to the classification of mixed precipitation. Regarding such cases occur at both temperatures above and well be-
the detection of rain, the Thies disdrometer reaches an almost low 0 ◦ C. Thereby, the Thies disdrometer seems to overesti-
perfect hit rate (99.7 %). However, the overall frequency of mate cases of rain below 0 ◦ C and to underestimate cases of
rain is slightly overestimated by the Thies disdrometer, being snowfall or mixed precipitation above 0 ◦ C as compared to
reflected by a false alarm rate of 9.9 %. Regarding the detec- the 2DVD. At least during distinct misclassifications, i.e., in
tion of snow, the overall frequency of detected cases is almost cases where the Thies disdrometer indicated rain while the
equal for both instruments. The hit and false alarm rate of 2DVD indicating snow, it can be shown that precipitation in-
the Thies disdrometer with respect to the 2DVD is reaching tensities are very small, i.e., their mean being 0.19 mm h−1
95.3 % and 1.3 %, respectively, reflecting a good agreement (while being 0.93 mm h−1 for all cases).
between the two instruments. Finally, the Thies disdrometer
classifies far fewer cases as mixed precipitation (1 %) than
Atmos. Meas. Tech., 13, 4683–4698, 2020 https://doi.org/10.5194/amt-13-4683-2020M. Fehlmann et al.: Precipitation monitoring with the Thies disdrometer 4693
Table 5. Comparison of the precipitation phase detected by the
Thies disdrometer (rows) and the two-dimensional video disdrom-
eter (columns). The numbers are given as percentages of the to-
tal number of 1 min observations during 2 years of measurements,
which are equal to 2533 h of precipitation.
Rain Mixed Snow Total
Rain 52.4 2.9 1.8 57.1
Mixed 0.1 0.7 0.2 1.0
Snow 0.1 0.7 41.1 41.8
Total 52.6 4.3 43.1 100.0
Hit rate (%) 99.7 16.6 95.3 94.2
False alarm rate (%) 9.9 0.3 1.3 2.9
for the resulting estimates of rainfall intensities. Other stud-
ies have reported similar patterns in terms of bias in the PSD
and while analyzing other disdrometers, such as the Joss–
Waldvogel (Leinonen et al., 2012) or the OTT Parsivel dis-
drometers (Raupach and Berne, 2015). However, the devia-
Figure 9. Relationship between snow particle density and mean par- tions in the PSD and implications for rainfall intensity es-
ticle diameter based on 1 min observations during the first year of timates can be different between different types of instru-
measurements. Snowfall events are identified based on the recorded ments. For example, the OTT Parsivel1 disdrometer only
dominant precipitation type by the Thies disdrometer. Snow parti- underestimates drops with sizes ranging between 0.8 and
cle density is then calculated by comparing the precipitation vol- 1.6 mm and only during periods of higher rainfall intensity.
ume measured by the two-dimensional video disdrometer (2DVD) In addition, the device tends to even overestimate rainfall in-
and precipitation mass measured by the OTT pluviometer and is tensities (Raupach and Berne, 2015). Interestingly, an over-
related to mean particle diameter as measured by the 2DVD. The estimation of rainfall intensities is also reported for the Thies
fitted curve is used to translate particle size distribution into snow- disdrometer at the intercomparison site Wasserkuppe in Ger-
fall intensities during the second year of measurements. Note that
many (Lanzinger et al., 2006). Supposedly, this contrary re-
the corresponding relationship established by Brandes et al. (2007)
is shown as a reference.
sult to our study is due to differences in wind exposure.
While our study site in Innereriz is extremely wind-sheltered
(average wind speeds being 0.46 m s−1 during the investiga-
4 Discussion and conclusions tion period), the site at Wasserkuppe is strongly exposed to
wind, average wind speeds being 6.4 m s−1 from 1999–2018
In this study, we have shown that the Thies disdrometer is (data obtained by the German weather service, DWD). Fi-
well suited for precipitation detection, reaching hit rates of nally, when compared the OTT Parsivels, Guyot et al. (2019)
around 95 % with respect to the OTT pluviometer. The false found that the Thies disdrometer starts to underestimate the
alarm rate, which indicates the probability of the Thies dis- number of droplets from 0.75 mm up towards larger diame-
drometer detecting precipitation during a dry period, is in- ters when compared to Parsivel1 and also underestimates liq-
creasing with increasing integration time. This can be some- uid precipitation compared to both Parsivel1 and Parsivel2 .
what expected, as the chance of misinterpreting a signal or To reduce the underestimation of rainfall intensities by the
disturbance as precipitation is increasing with the increasing Thies disdrometer found at our study site, we established an
duration of this period. Furthermore, false alarm rates might adjustment to 2DVD measurements following the methodol-
be affected by the sensitivity of the reference instrument ogy of Raupach and Berne (2015). However, when applying
but are comparable to findings of Bloemink and Lanzinger the resulting adjustment in the validation period, we intro-
(2005), who use human observations as a reference. duce a positive bias, which could indicate a slight overesti-
We have further demonstrated that the Thies disdrome- mation of liquid precipitation by the 2DVD when compared
ter systematically underestimated rainfall intensities at the to the OTT pluviometer. A more stable correction is achieved
study site by 16.5 % during 2 years of measurements, which by applying a linear adjustment to the OTT pluviometer. This
we explain as being related to an underestimation of drop method is thus proposed as the preferred correction method
concentrations for drop diameters ranging between 0.5 and in this study, especially when the PSD itself is not of interest
3.5 mm. At the same time, larger and smaller drops are over- to the user. It should be noted further that the overestima-
estimated by the instrument; this is, however, less relevant tion of smaller drops by laser disdrometers with respect to
https://doi.org/10.5194/amt-13-4683-2020 Atmos. Meas. Tech., 13, 4683–4698, 20204694 M. Fehlmann et al.: Precipitation monitoring with the Thies disdrometer Figure 10. Precipitation intensities during periods of 30 min as recorded by the Thies disdrometer and the OTT pluviometer during the second year of measurements. Precipitation is separated into rain, snow, and other types (e.g., mixed) based on the recorded dominant precipitation type by the Thies disdrometer (1 min observation). The effect of the two proposed correction methods, i.e., adjustment to the OTT pluviometer and the two-dimensional video disdrometer (2DVD), are shown in separate panels (B: bias; Corr: correlation coefficient). Note that these adjustments distinguish between rain and snowfall and were established in the first year of measurements. Figure 11. Relative frequency of the observed dominant precipitation phase by the Thies disdrometer (a) and the two-dimensional video disdrometer (2DVD, b) as a function of air temperature during 2 years of measurements (2533 h of precipitation). For the 2DVD, the mixing ratio of liquid precipitation obtained at different temperatures is indicated by the 10th and 90th percentile of its distribution (dashed lines). Atmos. Meas. Tech., 13, 4683–4698, 2020 https://doi.org/10.5194/amt-13-4683-2020
M. Fehlmann et al.: Precipitation monitoring with the Thies disdrometer                                                          4695

the 2DVD is also found in other studies (Krajewski et al.,          sistent with results of Bloemink and Lanzinger (2005). At the
2006; Raupach and Berne, 2015), but can at least partly be          same time, a recently reported case study suggests that the in-
related to unreliable estimates by the 2DVD for small drops         strument is able to accurately signal mixed precipitation dur-
(Tokay et al., 2013). As rainfall intensity or radar reflectiv-     ing changes between snow and rain (Pickering et al., 2019).
ity are not strongly affected by the concentrations of small        In this context, we would like to point out that the agreement
drops, no further adjustment of the PSD is considered in this       of the dominant precipitation type during mixed precipita-
study. For the reconstruction of the drizzle mode of the PSD,       tion with any reference observation will depend on the range
Raupach et al. (2019) present a method that is able to cor-         of mixing ratios implicitly or explicitly considered as mixed
rect for this deficiency and further improve rainfall intensity     precipitation. Our analysis indicates that the distinction be-
estimates for light rain.                                           tween liquid and mixed precipitation is particularly sensitive
   Regarding the measurement of snow, we show that the              to the choice of such a threshold. Furthermore, the appli-
number of particles with diameters exceeding 0.75 mm is             cation of the proposed classification algorithm to both dis-
slightly underestimated by the Thies disdrometer. However,          drometers indicates that a reasonable choice for these thresh-
this bias is not reflected in intensity estimates. Although not     olds might differ between different instruments. In addition
systematically biased, a more detailed analysis of the corre-       to the validation of dominant precipitation type estimates, the
lation coefficient (not shown here) revealed that uncertainty       particle-by-particle classification algorithm presented in this
in snowfall intensity estimates is higher than for rainfall. This   study can provide a basis for the validation of explicitly char-
is most likely related to some of the underlying assump-            acterized hydrometeor mixtures, as is the case, for example,
tions (e.g., about particle orientation, shape, or density) be-     in polarimetric radar observations (e.g., Besic et al., 2018) or
ing less appropriate for solid than liquid precipitation (Yuter     atmospheric models (e.g., Forbes et al., 2014).
et al., 2006; Battaglia et al., 2010). Regarding snow density,         The Thies disdrometer has the advantage of low mainte-
we propose a simple parametrization of particle density as a        nance requirements and allows the estimation of not only
function of particle diameter, which is similar to other stud-      precipitation intensity but also precipitation type. The re-
ies (e.g., Fabry and Szyrmer, 1999; Brandes et al., 2007)           liable distinction between rainfall and snowfall is consid-
and found here to substantially improve intensity estimates         ered here as an advantage for hydrological applications in
as compared to a constant density assumption. By applying           mountainous environments, where local estimates of precip-
the proposed adjustment of the PSD and this snow density            itation phase are still uncertain. We therefore see potential in
parametrization to Thies disdrometer measurements, corre-           installing disdrometers at sensitive elevations in mountain-
lation of the resulting snow intensity estimates with respect       ous catchments complementary to precipitation gauge and
to the OTT pluviometer can be slightly improved. Given the          weather radar data to improve precipitation monitoring and
still high uncertainties in the snow density parameterization       short-term flood forecasting in these areas.
(apparent in Fig. 9), we further tested the inclusion of infor-        The 2DVD was particularly useful in this study to further
mation about particle velocity and temperature but could not        investigate the biases of the Thies disdrometer, to establish
thereby improve resulting intensity estimates. The analysis         a parametrization of snow density, and to provide a refer-
of the correlation coefficient for snowfall intensities further     ence for the estimation of precipitation phase. Future stud-
revealed that correlations generally increase with increasing       ies may focus on a refinement of the proposed snow density
integration time (particularly up to 20 min). This indicates        parametrization and hydrometeor classification algorithm by
that at least some uncertainties in estimates of snowfall in-       taking other parameters such as particle orientation or shape
tensities, including small time shifts between observations,        (e.g., roundness, oblateness) into account.
are averaged out over longer integration times.                        In this study, we could not clarify how the relevant under-
   The distinction between rainfall and snowfall is not only        estimation for liquid precipitation is dependent on wind or
an important prerequisite for the proposed correction meth-         other influences. We suggest investigating this dependence
ods, but also relevant with respect to hydrological applica-        in further studies.
tions in alpine or pre-alpine areas. In this study, we show
that the Thies disdrometer is well suited for a distinction
of rainfall from snowfall (hit rates reaching 99.7 % for rain-      Data availability. The data used in this study, i.e., measurement
fall and 95 % for snowfall using the 2DVD as a reference).          outputs of the Thies disdrometer, the OTT pluviometer, the two-
Larger differences between the two disdrometers exist for           dimensional video disdrometer, and the LUFFT weather sensor
mixed precipitation, particularly for small precipitation in-       (1 July 2017–30 June 2019), can be found in Fehlmann et al. (2020).
tensities. As such, our results are in line with other studies in
which precipitation-phase estimates from disdrometers (in-
                                                                    Author contributions. MF designed the framework of the study and
cluding the Thies disdrometer) have been compared to hu-
                                                                    evaluation strategy with help from all coauthors. MF processed the
man observations (Bloemink and Lanzinger, 2005; Merenti-            data obtained by the measurement devices (i.e., the Thies disdrom-
Välimäki et al., 2001). In particular the underestimation of        eter, the two-dimensional video disdrometer, the OTT pluviome-
mixed-phase precipitation by the Thies disdrometer is con-

https://doi.org/10.5194/amt-13-4683-2020                                               Atmos. Meas. Tech., 13, 4683–4698, 2020
You can also read


