Operational risk dependencies - Cambridge University Press
←
→
Page content transcription
If your browser does not render page correctly, please read the page content below
British Actuarial Journal (2020), Vol. 25, e5, pp. 1–21
        doi:10.1017/S1357321720000033

        DISCUSSION PAPER

        Operational risk dependencies
        P. O. J. Kelliher*, M. Acharyya, A. Couper, E. Maguire, P. Nicholas, N. Pang, C. Smerald,
        D. Stevenson, J. Sullivan and P. Teggin
        *Corresponding author. Patrick Kelliher, c/o Research and Knowledge, Institute and Faculty of Actuaries’ Operational Risk
        Working Party, Level 2 Exchange Crescent, 7 Conference Square, Edinburgh, EH3 8RA, United Kingdom. Email:
        patrick_oj_kelliher@yahoo.co.uk

           Abstract
           This paper explores dependencies between operational risks and between operational risks and other risks
           such as market, credit and insurance risk. The paper starts by setting the regulatory context and then goes
           into practical aspects of operational risk dependencies. Next, methods of modelling operational risk depen-
           dencies are considered with a simulation study exploring the sensitivity of diversification benefits arising
           from dependency models. The following two sections consider how correlation assumptions may be set,
           highlighting some generic dependencies between operational risks and with non-operational risks to assist
           in the assessment of dependencies and correlation assumptions. Supplementary appendices provide fur-
           ther detail on generic dependencies as well as a case study of how business models can lead to operational
           risks interacting with other risks. Finally, the paper finishes with a literature review of operational risk
           dependency papers including correlation studies and benchmark reports.

        Keywords: Operational Risk; Dependency; Diversification; Correlation; Copulas

        1. Introduction
        The Operational Risk Working Party aims to assist actuaries and others in the modelling and
        management of operational risk. One of the key challenges in modelling operational risk is the
        modelling of dependencies between operational risks and between operational and non-
        operational risks such as market, credit and insurance risk. This paper seeks to assist in this
        regard and help develop good practice in setting assumptions and modelling operational risk
        dependencies.
           In terms of structure, the paper starts by outlining why we model operational risk dependencies
        and makes some general observations on the nature of these. It then considers methods for model-
        ling dependencies and how we might set correlation and other assumptions. This includes some
        generic sources of operational risk dependency which can be used to inform the modelling of
        dependency and the setting of correlation and other dependency assumptions. Lastly, we outline
        a review of literature pertaining to operational risk dependencies.
           The paper focuses on financial services companies and in particular banks, asset managers and
        insurers, but it is hoped that this also has wider relevance.

        2. Why Model Operational Risk Dependencies?
        The primary reason to model operational risk dependencies is to understand the nature of opera-
        tional risk exposures and how disparate risks may be connected. This feeds into the assessment of
        economic capital and other resources required to be able to withstand extreme yet plausible com-
        binations of operational and other loss events at a desired level of confidence. It is unlikely that all
        © Institute and Faculty of Actuaries 2020. This is an Open Access article, distributed under the terms of the Creative Commons Attribution
        licence (http://creativecommons.org/licenses/by/4.0/), which permits unrestricted re-use, distribution, and reproduction in any medium,
        provided the original work is properly cited.

Downloaded from https://www.cambridge.org/core. IP address: 46.4.80.155, on 10 Dec 2020 at 17:48:16, subject to the Cambridge Core terms of use, available at
https://www.cambridge.org/core/terms. https://doi.org/10.1017/S1357321720000033
2       P. O. J. Kelliher et al.

            operational risks will crystallise at the same time, and it is appropriate to allow for a diversification
            benefit to reflect this, that is, the economic capital requirement for all operational risks should be
            less than the sum of stand-alone requirements for individual operational risks. Allowances for
            dependencies between operational risks will affect the level of this diversification benefit.
               The Working Party also believes that it is appropriate to allow for diversification between oper-
            ational and non-operational risks as again it is unlikely that these will all crystallise at the same
            time. There is thus a need to understand dependencies between operational and non-operational
            risks to model the degree of diversification between these risks.
               As well as modelling operational risks and associated economic capital requirements, there is
            also a regulatory context in that banks and insurers need to hold regulatory (“Pillar 1”) capital to
            cover operational risks, and dependencies may affect the amount of capital held.

            2.1. Banks
            An explicit requirement to hold operational risk capital was introduced for banks as part of Basel
            II which was finalised in June 2006 (Basel Committee on Banking Supervision (BCBS), 2006, part
            2.V). There were three alternatives for assessing this capital requirement. The Basic Indicator
            Approach and the Standardised Approach (TSA) were based on set percentages of gross income,
            with the latter refined by type of business. As an alternative to these, a bank could apply to use its
            own model of operational risks for setting capital requirements as part of the advanced measure-
            ment approach (AMA), subject to this model meeting quantitative and qualitative standards.
               As part of the AMA, a bank could allow for diversification between operational risks subject to
            satisfying regulators about their system for identifying and modelling dependencies between risks.
            Note, however, that the Basel II framework did not allow for diversification between operational
            and non-operational risks. The Working Party feels that this was unduly prudent in that it did not
            recognise that operational and credit and markets risks are not perfectly correlated, particularly
            over the 1-year time horizon used to assess capital requirements under Basel II. Worse, it may
            have introduced bias to operational risk assessments as a high stand-alone operational risk
            requirement may have been unpalatable to senior management when combined with credit
            and market risk requirements with no allowance for diversification.
               In any case, in the aftermath of the financial crisis of 2007/09, conduct and other losses often
            exceeded regulatory operational risk requirements, pointing to the need to strengthen require-
            ments.1 By March 2016, this and regulatory dissatisfaction with the complexity of AMA and
            the lack of comparability between bank operational risk requirements prompted BCBS to propose
            dispensing with internal models of operational risk and replace all approaches with a Standardised
            Measurement Approach (BCBS, 20162). This was adopted as part of wider Basel III reforms in
            December 2017 (BCBS, 2017).
               With internal models no longer permitted to be used for regulatory capital requirements, mod-
            els of operational risk dependencies and diversification benefits no longer affect regulatory
            requirements. However, banks should still assess their economic capital requirements for opera-
            tional risks including for the (“Pillar 2”) Individual Capital Adequacy Assessment Process
            (ICAAP) required by regulators. The Working Party believes that such assessment should allow
            not just for dependencies and diversification between operational risks, but also for diversification
                1
                For example, at the end of 2010, LBG reported that its capital requirement under TSA was just over £2.5bn (see LBG’s
            Basel II Pillar III disclosures document, 31/12/2010, page 100 – see http://www.lloydsbankinggroup.com/globalassets/
            documents/investors/2010/2010_lbg_pillar3_disclosure.pdf). However, within 6 months, they would have to set aside
            £3.2bn to cover payment protection insurance (PPI) claims and £500 m for customer goodwill payments relating to issues
            with the wording of HBOS mortgage contracts. The cost of PPI to LBG would ultimately increase to over £17 m.
               2
                The Institute and Faculty of Actuaries response to this can be found at https://www.actuaries.org.uk/system/files/field/document/
            06-03%20IFoA%20response%20to%20Basel%20Committee%20on%20Banking%20Supervision-%20Consultative%
            20Document%20Standardised%20Measurement%20Approach%20for%20Operational%20Risk.pdf

Downloaded from https://www.cambridge.org/core. IP address: 46.4.80.155, on 10 Dec 2020 at 17:48:16, subject to the Cambridge Core terms of use, available at
https://www.cambridge.org/core/terms. https://doi.org/10.1017/S1357321720000033
British Actuarial Journal 3
benefits between operational and non-operational risks. This provides a more realistic picture of
risks, and in distinguishing between stand-alone operational risk requirements and their marginal
contribution to overall diversified requirements, helps foster a realistic assessment of exposures.
2.2. Asset Managers
Asset managers are in a similar position to banks in having to produce a Pillar 2 ICAAP for reg-
ulators. Operational risk is often the main risk faced by asset managers so the assessment of eco-
nomic capital requirements for operational risks, and the diversification assumed between these
operational risk requirements, will be key to this assessment. Diversification with non-operational
risks will generally be less important given often limited exposure to non-operational risks.
2.3. Insurers
Insurers have in some ways moved in the opposite direction to banks. Prior to the introduction of
Solvency II in 2016, regulatory requirements for UK insurers did not explicitly reflect operational
risks. However, UK insurers were required to produce their own assessment of economic capital
requirements for operational risks as part of individual capital assessments required by the reg-
ulators, similar to banks’ ICAAP. While approaches to assessing operational risk requirements
varied, these generally allowed for diversification both between operational risks and between
operational and non-operational risks.
Solvency II introduced an explicit regulatory capital requirement for operational risk as part of
the Pillar 1 Solvency Capital Requirement (SCR). Under the standard formula, this is based on
percentages of metrics such as premium income and reserves which were calibrated based on
those insurers who were already using internal models of operational risk for internal economic
capital assessment (section 3.6, 325–336, Committee of European Insurance and Occupational
Pension Supervisors (CEIOPS), 2010).
Due to differences in sample sizes of insurers contributing pre- and post-diversification figures
to CEIOPS, economic capital requirements after allowing for diversification with non-operational
risks were perversely greater than those before such diversification, so the post-diversification
figures were discarded and standard formula percentages were based on figures before diversifi-
cation with non-operational risks.
Not only is the standard formula operational risk requirement based on assessments before
allowance for diversification with non-operational risk, but also there is no allowance in the
standard formula aggregation module for such diversification. Whereas allowance is made for
diversification between market, counterparty and insurance risk in the calculation of the Basic
SCR, the operational risk requirement is simply added to this without allowance for diversification
between operational and these other risks.
However, while the standard formula does not allow for diversification between operational
and non-operational risks, firms may apply to use their own internal models of risks to set regu-
latory capital requirements instead of the standard formula, subject to satisfying regulatory
requirements. These models can and generally do allow for dependencies between operational
risks and between operational and non-operational risks.
Even for standard formula firms, there is a requirement to assess economic capital require-
ments for operational and other risks as part of the Own Risk and Solvency Assessment (ORSA),
which is akin to banks’ ICAAP. As part of the ORSA, there is a need to consider the appropriateness
of the Standard Formula, including the addition for operational risk. The Working Party understands
that the assessment of operational risk requirements and the appropriateness of standard formula
for operational risk will typically include allowance for dependencies and diversification between
operational risks and between operational and non-operational risks, though these allowances
may not be as rigorous as those used in internal models.
Downloaded from https://www.cambridge.org/core. IP address: 46.4.80.155, on 10 Dec 2020 at 17:48:16, subject to the Cambridge Core terms of use, available at
https://www.cambridge.org/core/terms. https://doi.org/10.1017/S13573217200000334 P. O. J. Kelliher et al.
3. The Nature of Operational Risk Dependencies
Based on their review, the Working Party would note the following aspects of operational risk
dependencies both between operational risk and with non-operational risk.
3.1. Indirect Nature of Dependencies
Unlike market risks, say, where, for example, base rate changes may directly affect equity markets
and vice versa, most operational risk dependencies are indirect in nature. There is usually no obvi-
ous direct link between operational risks, but often there will be underlying risk drivers which
affect disparate operational risks. For instance, poor governance could lead to operational failing
across different types of risk (see section 4.1 below). Similarly, a flu pandemic may lead to business
continuity losses as well as higher life insurance claims and market falls.
There are some instances where a direct link can be observed between non-operational risk
events and operational losses. For instance, a fall in stock markets could trigger mis-selling claims
related to the sale of equity-linked products.
3.2. Asymmetry
Where there is a dependency between operational and non-operational risks, this will generally be
asymmetric as while market, insurance and credit events may trigger operational losses, the
reverse does not apply as operational losses tend to be idiosyncratic with little impact on markets,
the wider economy and insured experience.
3.3. Operational Losses Contingent on Non-Operational Risk Drivers
Often operational losses will only crystallise depending on the occurrence of other events. For
example, an investment product may be mis-sold, but losses might only arise if markets fall.
This occurred with LTSB’s Extra Income and Growth Plan, where falling stock markets over
2001/03 led to customer losses of 30–48% of amounts invested, and a £100 m loss for LTSB.3
Similarly, the severity of operational losses may also be dependent on market, credit or insur-
ance experience. An example of this would be the US$250 m loss suffered by Sphere Drake in the
1990s as a result of fraudulent collusion between underwriters.4 This resulted in it being wrongly
exposed to US workers compensation claims at a time when the claims experience of this line of
business was deteriorating, hence the large loss.
By the same token, there are many instances of “near misses” where an operational failing has
not crystallised due to favourable non-operational risk experience, or where losses could have been
even more severe.5 Analysis of dependencies should therefore consider not just operational fail-
ings but also how the subsequent crystallisation of loss is connected to other risks. It should also
consider “near misses” where favourable experience may mask an underlying dependency.
3
See Financial Services Authority’s (FSA’s) final notice to LTSB, 25 September 2003 at https://www.fca.org.uk/publication/
final-notices/lloyds-tsb_24sept03.pdf
4
See “FSA bans four individuals for dishonest behaviour in the reinsurance market”, 14 December 2007 at http://www.fsa.
gov.uk/library/communication/pr/2007/127.shtml
5
An example of this might be the FSA’s decision not to proceed with a full-scale review of mortgage endowments in October
2000 as the indications were that most policyholders were better off with a mortgage endowment based on returns to that
date – see “FSA acts on mortgage endowment complaints”, 3 October 2012 at http://www.fsa.gov.uk/library/communication/
pr/2000/121.shtml
Downloaded from https://www.cambridge.org/core. IP address: 46.4.80.155, on 10 Dec 2020 at 17:48:16, subject to the Cambridge Core terms of use, available at
https://www.cambridge.org/core/terms. https://doi.org/10.1017/S1357321720000033British Actuarial Journal 5
3.4. High-Frequency, Low-Impact versus Low-Frequency, High-Impact Losses
Operational losses typically comprise lots of small-impact losses coupled with infrequent, large-
scale losses. Economic capital requirements will generally be driven by infrequent, high-impact
losses, and it is the dependencies of these with other risks which matter to capital assessment,
though analysis of dependencies of lower level losses can prove useful to business as usual
(BAU) operational loss management.
There may be different drivers to each type of loss, with different dependencies to other risks.
For example, there may be little correlation between low-impact, high-frequency losses under two
operational risk categories (e.g. manual processing errors and card fraud), but these may be cor-
related at the tail (e.g. weak IT system implementation leads to systemic processing errors and also
exposes a firm to large-scale cyber theft).
Similarly, in terms of correlation with non-operational risks, an insurer may experience fre-
quent, low-level financial reporting errors which might not be correlated with market conditions.
In distressed markets, however, there may be a greater reliance on mark-to-model valuations with
the related risk of significant errors in such valuations.
Note, however, it is not always the case that operational losses at the tail are more highly
correlated with other risks. For example, there may be strong correlations between low-impact,
high-frequency losses in two categories (e.g. weakness in customer service recruitment leads to
manual processing errors and petty theft), and there may be less connection between high-impact,
low-frequency events (e.g. large-scale system processing errors and rogue trading).
Considering non-operational risk dependencies, a general insurer may experience low-level
manual processing losses linked to claim volumes (e.g. data entry errors), but the tail of processing
risk may revolve around system failure which may be unrelated to claim volumes.
The important thing to note is that care should be exercised in assessing dependencies based on
high-frequency, low-impact data as it may under- or overstate dependence at the tail, which is
critical to economic capital assessment.
3.5. Loss Components and Fines
The Working Party would highlight a potential pitfall in assessing dependencies. Operational risks
such as business continuity failings may generate Financial Conduct Authority (Financial
Conduct Authority (FCA) fines6), but the Working Party believes that such fines should be con-
sidered as part of the overall operational losses rather than separate conduct risk events. Treating
the fine separately would result in two separate yet perfectly correlated loss events which would
give a distorted view of conduct risk correlations.
In general, in assessing dependencies between operational risks, care needs to be exercised to
avoid treating a single loss as two separate loss events under different categories, which would
distort the analysis of dependencies between categories.
3.6. Implicit Allowance for Operational Losses in Other Data
Another issue in the assessment of dependencies is the implicit allowance for operational losses in
other loss data, and hence the implicit allowance for operational risk in non-operational risk
capital. For instance, insurance claims data will implicitly include an element of non-disclosure
and claim fraud as well as underwriting and process errors to the extent these are not detected.
Such errors will add not just to the base level of claims, but also to the volatility of insurance risk
data and hence insurance risk capital.
6
For example, in October 2018, the FCA fined Tesco Bank £16.4 m for failings in protecting client data against cyber attack
(−https://www.fca.org.uk/news/press-releases/fca-fines-tesco-bank-failures−2016-cyber-attack), while TSB Bank is likely to
be fined for its 2018 systems disruption due to migration problems.
Downloaded from https://www.cambridge.org/core. IP address: 46.4.80.155, on 10 Dec 2020 at 17:48:16, subject to the Cambridge Core terms of use, available at
https://www.cambridge.org/core/terms. https://doi.org/10.1017/S13573217200000336 P. O. J. Kelliher et al.
In terms of the dependence between these operational risks and insurance risk, to the extent
that insurance risk provisions and capital implicitly reflect these sources of loss, then we can say
these implicitly allow for the aggregation of underlying claims experience with these operational
risks, and there is a risk of double counting these risks if a strong correlation assumption is then
used between insurance and operational risk.
Ultimately, the Working Party believes that if claims experience includes a significant element
of fraud and processing errors, then the assessment of these operational risks should seek to focus
on the scope for errors above and beyond what may normally come through in claim data, for
instance, the risk of systematic processing errors in underwriting systems as opposed to what may
be termed BAU underwriting errors.
There may still be a strong correlation between these exceptional losses and insurance experi-
ence. For instance, catastrophic claim experience could lead to a breakdown in claims controls and
much higher levels of claim fraud and processing errors. On the other hand, the systematic failure
of an underwriting system may be more idiosyncratic.
3.7. Lags in the Emergence of Operational Losses
A final observation on operational risk dependencies relates to the time it takes for many opera-
tional losses to crystallise. For instance, PPI mis-selling claims arise in many cases from policies
sold before 2000, yet banks only started making provisions for these from 2011 onwards. As we
shall see in Appendix B, while there may be a link between, say, compliance breaches and weak
loan underwriting, the fines and other losses associated with the former may crystallise some years
after credit losses in respect of the latter.
From the perspective of a 1-year economic capital assessment, frequently we will be looking to
aggregate operational risk requirements based on past failures crystallising alongside market,
credit and insurance losses arising over the year. There is thus an element of temporal dislocation
which should be borne in mind when setting dependencies: while we might argue for a link
between operational losses and other risks in the long term, this may be less relevant in the
short term.
4. Methods for Modelling Dependencies
Based on benchmarking studies (Institute of Risk Management (IRM), 2015) and what the authors
have observed in practice, the most common methods for modelling dependencies are, in increas-
ing order of sophistication:
• correlation matrices;
• copula aggregation:
○ Gaussian copula;
○ T- and other copulas;
• Bayesian Networks. Simpler methods include:
(a) no allowance for diversification (i.e. aggregate operational risk requirement is the sum
of capital requirements for individual operational risks, which is then added to require-
ments for non-operational risks without allowance for diversification);
(b) as (a) but with an arbitrary “haircut” applied to aggregate requirements to allow for
diversification;
(c) the square root of the sum of individual operational risk requirements squared – effectively
a simplification of correlation matrix aggregation with 0% correlation;
(d) as (c), but with an arbitrary loading to allow for dependencies between operational
risk; and
(e) assess capital requirements at a lower confidence level and simply add these up.
Downloaded from https://www.cambridge.org/core. IP address: 46.4.80.155, on 10 Dec 2020 at 17:48:16, subject to the Cambridge Core terms of use, available at
https://www.cambridge.org/core/terms. https://doi.org/10.1017/S1357321720000033British Actuarial Journal 7
The Working Party does not believe that such simpler approaches are appropriate to modelling
economic capital requirements, though they could be useful in assessing standard formula appro-
priateness (e.g. assessing the haircut in (b) that would equate to the marginal standard formula
addition for operational risk).
4.1. Correlation Matrices
A fuller description of correlation matrix (aka variance–covariance matrix) aggregation is supplied
in section 7 of Shaw et al. (2010) on modelling of dependencies in economic capital, but the
Working Party would highlight the following limitations.
• It assumes that individual risk distributions are elliptically distributed, but in practice indi-
vidual operational risk distributions will be highly skewed – depending on the frequency of
an individual risk occurring, the operational loss will be £0 at most percentiles, but large,
potentially catastrophic losses at the tail.
• Linked to this, correlation matrix aggregation may produce materially higher economic
capital requirements.
• It focuses on aggregating economic capital requirements at a particular percentile and does
not produce aggregate requirements at other percentiles, providing a limited view of aggre-
gate operational losses.
• As such, it is not consistent with the requirements to provide the holistic distribution of own
funds impacts required of internal models under Article 228 of Solvency II Delegated
Regulations.
The Working Party is of the view that correlation matrix aggregation is not appropriate for inter-
nal models of operational risks. However, it does have the advantage that it can be readily imple-
mented and easily understood and as such may be appropriate for the assessment of standard
formula appropriateness.
4.2. Copulas
The bulk of insurance internal models aggregate operational risks using a Monte Carlo approach
with copulas in order to produce a holistic distribution of aggregated operational losses, which can
in turn be combined with distributions of non-operational risks to form an overall distribution of
losses. A fuller description of copulas is given in section 8 of the Shaw et al. (2010), but in essence
these allow random percentiles of individual risk distributions to be simulated which nonetheless
reflect dependencies between risks.
Copulas are flexible in that they can cater for different distributions of individual risks and do
not assume that these are elliptical. They do not even require individual risks to follow a certain
distribution but may instead sample from Monte Carlo simulations of individual risks (the Iman
Conover approach).
One limitation with copulas is that it can prove challenging to address asymmetric dependen-
cies. For example, using a copula approach with a high correlation between say mortality catas-
trophe (flu pandemic etc.) and business continuity risks will generate loss simulations where
mortality catastrophes are accompanied by business continuity losses – as we might expect –
but also where business continuity losses are accompanied by excess mortality levels even though
many business continuity events, such as an office being flooded, should have no impact on
mortality rates.
To get around this problem of asymmetry, correlation assumptions are often adjusted down-
wards, but this can result in understatement of operational losses simulated in non-operational
Downloaded from https://www.cambridge.org/core. IP address: 46.4.80.155, on 10 Dec 2020 at 17:48:16, subject to the Cambridge Core terms of use, available at
https://www.cambridge.org/core/terms. https://doi.org/10.1017/S13573217200000338 P. O. J. Kelliher et al.
risk scenarios where we might expect operational losses to be higher. Simulations of combined
losses need to be examined to ensure that any adjustment does not lead to material
understatement.
4.2.1. Choice of copula
Among UK life insurers, the most common copula used is the Gaussian copula which is based on a
multivariate normal distribution. This is relatively easy to implement and does not require any
assumption beyond a matrix of correlations between risks. However, an oft-cited limitation of the
Gaussian copula is that it has a zero co-efficient of tail dependency so that the conditional
probability of risk A exceeding (or undershooting) a certain percentile given risk B exceeds
(or undershoots) that percentile will tend to zero for extreme percentiles. It is noteworthy that
prior to the abandonment of AMA, the European Banking Authority (EBA) proscribed the
use of Gaussian copula for modelling dependence between operational risks in bank operational
risk models (EBA, 2015).
Therefore, some insurers instead use a T-copula based on a multivariate T-distribution which
has a positive co-efficient of tail dependence and will give rise to higher conditional probabilities of
an extreme event for risk A given an equally extreme event for risk B compared to a Gaussian
copula with the same correlation matrix. A T-copula is somewhat more complex to implement
and also requires a degree of freedom assumption in addition to the matrix of correlation assump-
tions, with the lower the degree of freedom parameter, the greater the likelihood of extreme events
co-occurring.
Gaussian- and T-copulas are two of the most common copulas used, but there is a wide range
of alternative copulas including the Archimedean family of copulas, which can model particularly
heavy tail dependence. Archimedean copulas are not based on a multivariate distribution, nor
require a correlation matrix, but are driven instead by a parameter which drives tail dependency.
A downside is that they may prove more complex to implement for increasing numbers of risks
aggregated.
In terms of the choice of copula, the Working Party believes that the limitations of Gaussian
copula and its zero co-efficient of tail dependency can be overstated. Depending on correlation
assumptions used, it can model combinations of extreme events co-occurring and may ascribe a
higher probability of such co-occurrence than other copulas with weaker correlation and depen-
dency assumptions. Correlation and dependency assumptions may be highly subjective. It may be
that using more complex copulas may be spurious given the subjectivity of the assumptions.
Whatever copula and assumptions are chosen, it is important to examine the resulting
simulations generated to see whether the likelihood of extreme events under different risks
co-occurring, and conditional expectations given an extreme loss in one category of losses under
other categories, is reasonable.
4.3. Bayesian Networks
Bayesian Network modelling seeks to derive a combined probability distribution of operational
losses from all types, having regard to underlying causal variables (e.g. staff turnover affecting
processing errors and internal fraud losses). It thus addresses the modelling dependencies explic-
itly without the need to consider correlation assumptions.
It may also address the problem of asymmetry. For instance, a Bayesian Network approach
could capture the impact of flu pandemics on business continuity losses, or equity market falls
on mis-selling, while ensuring that the crystallisation of these operational losses does not affect
the occurrence of pandemics or stock market crashes.
Bayesian Networks will be underpinned by assumptions of probability (e.g. of a rise in the staff
turnover rate) and conditional probability (probability of process error given a rise in staff
Downloaded from https://www.cambridge.org/core. IP address: 46.4.80.155, on 10 Dec 2020 at 17:48:16, subject to the Cambridge Core terms of use, available at
https://www.cambridge.org/core/terms. https://doi.org/10.1017/S1357321720000033British Actuarial Journal 9
turnover). Many of these probabilities can be determined from empirical data, but others may be
based on expert judgement or a combination of two. The process for identifying causal factors and
deriving unconditional and conditional probabilities linking these and operational risks is likely to
require significant effort. However, it can yield useful insights into linkages between operational
risks, and between operational and non-operational risks, which may prove useful in BAU opera-
tional risk management.
For a fuller description of Bayesian Networks and other advanced operational risk modelling
techniques, the Working Party would refer to Corrigan et al. (2013) on operational risk modelling
and the Canadian Institute of Actuaries’ November 2014 research paper on operational risk.
5. Simulation Study of Operational Risk Dependencies
To gain further insight into operational risk diversification benefits, the Working Party carried out
a study of these using a relatively simple dependency structure involving up to seven operational
risk types (which may be assumed to correspond to Basel Level 1 categories) with uniform cor-
relations between types and modelled using a Gaussian copula.
Each risk type has a binary probability of a material loss occurrence under each type (i.e.
Bernoulli frequency distribution) and a Lognormal severity distribution based on typical and
severity loss estimates corresponding to the median and 90th percentile of the distribution. 10 runs
of 100,000 simulations were generated to minimise simulation error.
The base run assumed a 25% probability of occurrence for each risk type; typical and severe
case loss estimates of £2 and £8 m, respectively, for all types; and 25% correlation between all
types. Based on this, the diversification benefit was 52% of undiversified requirements.
Next, we explored the impact of more skewed severity distributions on diversification, with the
severe case loss estimate (90th percentile) now assumed to be £16 m for all risk types. As one would
expect the marginal requirements at the 99.5th percentile were much higher, but the crucial point
to note is that the diversified benefit was much lower at 44% of undiversified requirements,
highlighting that the more skewed the marginal distributions are, the lower the likely diversifica-
tion benefit.
The Working Party then looked at the impact on the base case of different frequency
parameters for the individual risk types of 50%, 10% and 2.5% for each. While there was not much
difference in diversification benefits for the first two frequency assumptions, the 2.5% frequency
assumption resulted in a lower diversification benefit of 48%, highlighting the potential sensitivity
of diversification benefits with frequency, particularly at lower levels.
In practice, marginal distributions will not be uniform. Typically, more losses may be assumed
to arise under the Basel high Level 1 categories of Clients, Products and Business Practices (CPBP,
broadly corresponding to conduct risk losses) and Execution, Delivery and Process Management
(EDPM, broadly relating to processing and reporting risks). Based on banking loss figures for 2012−17
from the Operational Riskdata eXchange Association (ORX, 2018), a leading operational loss
data-sharing consortium, 61% of losses arose under the CPBP category, with 22% under EDPM.
To gauge the impact of this, rather than assuming £2 m typical loss for each category, the total
typical loss of £14 m was weighted in proportion to losses under each high-level category from the
ORX survey above, with the severe case equal to four times consistent with the base run skew. As
one may expect given the high weighting to CPBP, the diversification benefit reduced to 31% of
undiversified requirements.
Diversification benefits will also vary with the number of risks modelled: if only four risks were
modelled instead of the seven in the base run, the diversification benefit would be −44% as
opposed to −52%. In practice, marginal operational risk distributions will be based on more gran-
ular categories of risk, so there may be 20 risk categories aggregated, with consequent impact on
diversification benefits.
Downloaded from https://www.cambridge.org/core. IP address: 46.4.80.155, on 10 Dec 2020 at 17:48:16, subject to the Cambridge Core terms of use, available at
https://www.cambridge.org/core/terms. https://doi.org/10.1017/S135732172000003310 P. O. J. Kelliher et al.
6. Setting Correlation Assumptions
The setting of correlation assumptions was covered by the Working Party’s paper on inputs to
operational risk models (Kelliher et al., 2016). In essence, correlations can be derived from empir-
ical data and/or expert judgement.
6.1. Empirical Data
Correlation assumptions could be derived for internal and external loss data, for example, by
considering correlations between quarterly loss totals for each category (as in Cope &
Antonini (2008)).
However, loss data and hence empirical correlations may be driven mainly by low-impact,
high-frequency losses. These may give a misleading picture of correlations at the tail (see section
3.4 above).
There is also an issue as to how far data go back. A dataset going back to 2010, for example, will
not capture the interaction of operational and other risks during the financial crisis of 2007/09 and
so may miss key dependencies.
Another issue with empirical correlations is that they may systematically understate correla-
tions between low-frequency events. To illustrate this, as part of our paper on inputs to opera-
tional risk models, the Working Party simulated five operational risks, each distributed binomially
with p = 0.1 probability of a loss and assuming a Gaussian copula with a medium 50% correlation
between variables. The empirical correlation between the number of losses was circa 25%.
On the other hand, random coincidence can give rise to significant yet spurious estimates of
correlation when other evidence and reasoning do not support a significant correlation between
conduct and business continuity losses.
Finally, there is the question of relevance. For instance, pensions and mortgage endowment
mis-selling losses may form a large part of insurers’ historic loss data, and from above, there
is a link between these and market levels. Going forward, however, the combination of policies
already reviewed and time bars on complaints from the rest will limit exposure to these sources of
mis-selling. Exposure may arise in respect of other products which are not market-related.
6.2. Expert Judgement
Given the limitations of correlations derived from data, the Working Party believes that expert
judgement is essential to determine correlation assumptions. However, it would probably be
impractical to ask subject matter experts to identify correlations for each pair of risks. If one
was seeking to model 20 risks – in line with Basel II Level 2 categories7say – this would require
190 separate correlation assumptions which would be too much to ask for and difficult to validate.
The resulting correlation matrix is also unlikely to satisfy the positive semi-definite property
required to be valid.
To address this, one approach may be to group risks and assume a common correlation
between groups of risks. For instance, splitting 20 Level 2 risks into four groups of five, we would
need 10 correlation assumptions within each group (40 in total) plus 6 correlation assumptions
between groups, which may be more manageable. If one assumed a uniform correlation within
groups the task of setting correlations becomes easier still.
Risks could be grouped by some common factors, for instance by
7
Under the Basel II taxonomy, there are seven High Level 1 categories – Internal Fraud, External Fraud, Employment
Practices and Workplace Safety; Clients Products and Business Practices (regulatory compliance, mis-selling, etc.);
Damage to Physical Assets; Business Disruption and Systems Failure; and Execution, Delivery and Process Management.
Sitting underneath these are 20 more granular Level 2 categories. See Annex 9 of Basel II at https://www.bis.org/publ/
bcbs128d.pdf
Downloaded from https://www.cambridge.org/core. IP address: 46.4.80.155, on 10 Dec 2020 at 17:48:16, subject to the Cambridge Core terms of use, available at
https://www.cambridge.org/core/terms. https://doi.org/10.1017/S1357321720000033British Actuarial Journal 11
• high-level risk type, for example, Basel Level 1 categories;
• type of risk, for example, people, process, system or external event; or
• function, for example, conduct risks mapped to sales; processing risks to operations, people-
related risks to HR, etc.
Given the heterogeneity of operational risk categories, however, it is likely that there will be a loss
of granularity, for example, two sub-types of risks in two otherwise uncorrelated groups could be
strongly correlated. (It should be noted that this applies not just to groups but also within Level 2
categories given the broad range of sub-risks in each category.)
Another approach to determining correlation may be to consider the results of broader stress
and scenario testing work, for example, flu pandemic scenario testing could highlight common
dependencies between processing risks (due to backlogs arising) and mis-selling (due to falling
markets giving rise to customer losses). This could also help with setting correlations between
operational risks and market and other non-operational risks.
An extension of this would be a causal driver approach, which involves seeking to identify
underlying factors which may drive losses under categories. Correlations for different operational
risks could then be set having regard to the extent that common factors are identified for each
risk pair.
Potential causal drivers are discussed in the next section.
Whichever approach is adopted, expert judgements on correlation assumptions should be
subject to rigorous review and challenge given their subjectivity. Key correlation assumptions
should be identified through sensitivity analysis, which should be subject to particular scrutiny.
This review should be independent and performed by those with an understanding of operational
risks and how these interact.
7. Generic Operational Risk Dependencies
To assist in the identification of dependencies and the setting of correlation and other dependency
assumptions, the Working Party has identified a number of generic dependencies both between
operational risks and between operational and non-operational risks, which is set out in detail in
Appendix A. This is not a definitive list of possible dependencies, and many may not be relevant
for a firm, but it is hoped that this could be a useful basis for assessing and validating dependency
assumptions.
7.1. Intra-Operational Risk Dependencies
In summary, disparate operational risks could be affected by the following:
• people – weaknesses in recruitment, training and retention;
• system development and implementation (see below);
• model governance – leading to flaws in product pricing and financial reporting;
• treating customers fairly (TCF) and compliance – a weak culture could lead to compliance
breaches across different operational risk categories; and
• governance – weak governance contributing inter alia to fraud, conduct failings and other
operational failings.
Even where prima facie two operational risks might appear independent, there may be
underlying drivers which lead to the two being linked. An example might be weaknesses in system
development and implementation where flawed design, project management and/or inadequate
Downloaded from https://www.cambridge.org/core. IP address: 46.4.80.155, on 10 Dec 2020 at 17:48:16, subject to the Cambridge Core terms of use, available at
https://www.cambridge.org/core/terms. https://doi.org/10.1017/S135732172000003312 P. O. J. Kelliher et al.
Fraud risk
Weak fraud/
Cyber controls Cyber/Information
security risk
Product risk
Errors in policy Inadvertent guarantees
documentation
Customer detriment
Illustration and Conduct risk
Issues with disclosure errors
AML and other checks
Poor charge
management Processing risk
Systematic processing
errors
Errors in MI and financial Financial
reporting feeds reporting risk
Unstable system IT Systems risk
Business
Supplier resilience untested
Due diligence issues continuity risk
Flaws in supplier contracts Outsourcing/
Supplier risk
Figure 1. Consequences of flawed system development and implementation.
testing of changes could contribute to a wide range of operational risks as the following diagram
illustrates.
7.2. Dependencies with Non-Operational Risks
In terms of dependencies between operational risk and other risks, the Working Party would note
in particular that reputational damage as a result of operational failings could feed through into
expense and lapse experience. Higher lapses could in turn lead to liquidity strains. Thus, reputa-
tional damage may be considered a “vector of transmission” from operational risk to insurance
and liquidity risk.
As noted in section 3.6 above, underwriting and claim processing errors as well as fraud can
also affect claims experience, though this will be implicitly reflected in insurance risk capital
requirements based on this experience. Adverse claims experience can also cause operational
failures to crystallise (e.g. an error in an excess of loss reinsurance treaty might only become
apparent after claims exceed the loss limit); or exacerbate their severity (e.g. the Sphere Drake
fraud cited in section 3.3). Catastrophic claims can also put a strain on claims controls and lead
to higher levels of claim processing error.
In terms of market and credit risk dependencies, adverse macroeconomic conditions could lead
to increased levels of attempted fraud as well as market falls and higher defaults, while market
levels can affect the crystallisation and severity of mis-selling of products linked to markets.
The severity of dealing errors will also depend on market movements, though gains may be as
likely as losses.
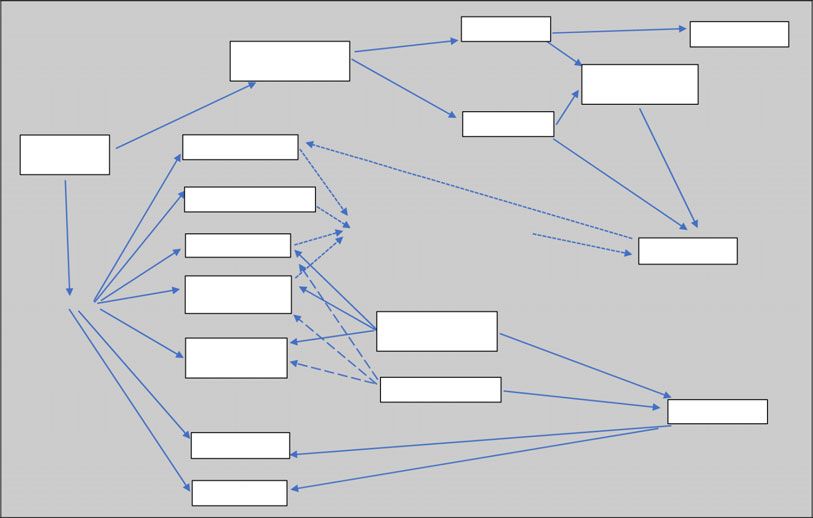
These linkages are summarised in the following diagram.
Finally, issues with business models could trigger a wide range of operational losses as well as
market, credit and insurance losses. An example of this is the “originate and distribute” business
Downloaded from https://www.cambridge.org/core. IP address: 46.4.80.155, on 10 Dec 2020 at 17:48:16, subject to the Cambridge Core terms of use, available at
https://www.cambridge.org/core/terms. https://doi.org/10.1017/S1357321720000033British Actuarial Journal 13
Lower sales Strategy risk
Reputational
damage
Higher unit costs
(Expense risk)
Higher lapses
Operational Underwriting fraud
losses Claims experience
affects cost of fraud
Underwriting errors
Implicity reflected in claims experience
and capital calibrated to this experience
Claim fraud Insurance risk
Claim processing
Including errors
Natural and manmade
catastrophes
Business
continuity losses
Pandemics
Market risk
Mis-selling risk Losses dependent on market levels
Dealing errors
Figure 2. Operational and non-operational risk dependencies.
model adopted by US banks in respect of sub-prime mortgage lending in the run up to the
financial crisis of 2007/09. This is considered further in Appendix B, but note that the operational
losses associated with this business model arose some years after the market and credit losses,
highlighting the point made in section 3.7 above about how operational losses may not be linked
with market and credit losses over a 1-year time frame even if over the long term there is a linkage.
8. Review of Literature Review on Operational Risk Dependencies
The Working Party struggled to find literature on operational risk dependencies and how these
may be modelled. Such literature as was identified can be split into (a) studies of correlations based
on empirical loss data and (b) benchmarking surveys of modelling practices and assumptions.
8.1. Empirical Studies of Correlations
The Working Party has identified two studies of correlations between bank operational losses. The
first was Cope & Antonini (2008) on observed correlations and dependencies based on ORX data
between 2002 and 2007, with ca. 90,000 loss data points from 41 organisations.
Correlations between seven high Level 1 event types and between 10 business line categories
under Basel II were calculated based on quarterly loss data, with a focus on the Kendal tau measure
of rank correlation.
Key conclusions of this paper:
• With a few exceptions, Kendall rank correlations by business line or event type level are low,
usually not exceeding 20%.
• Homogeneity was observed among correlations measured at different banks and the
correlation averages across banks.
Downloaded from https://www.cambridge.org/core. IP address: 46.4.80.155, on 10 Dec 2020 at 17:48:16, subject to the Cambridge Core terms of use, available at
https://www.cambridge.org/core/terms. https://doi.org/10.1017/S135732172000003314 P. O. J. Kelliher et al.
• There was slight evidence that extreme losses in one unit of measure are much more likely to
occur when extreme losses are observed in other units of measure.
• Based on the available data, there are some indications of diversification benefits at high
quantiles of the quarterly loss distribution, although no accurate estimates of this benefit
could be drawn at the 99.9th percentile level on which bank regulatory capital is based.
The conclusions of the Cope and Antonini paper were challenged by Abdymomunov & Ergen
(2017), a paper on tail dependence and systemic risk in the operational losses of the US banking
industry. This was based on operational loss data from regulatory returns, with over 277,000 indi-
vidual loss events across 31 bank holding companies for 43 quarters between 2004 and 2014.
Again, data were analysed based on the seven Basel Level 1 event types.
Their analysis starts by establishing tail dependence between operational risks by looking at the
ranks of losses and the conditional probability of risk pairs at different percentiles based on the
number of observations where the rank of losses for both risks exceeded a certain percentile. Next,
Pearson correlation estimates are derived. Generally, these are less than 10% – broadly consistent
with Cope and Antonini – but with wide variations between banks.
However, correlations were then derived by applying maximum likelihood estimation
techniques to estimate parameters for a T-copula based on empirical loss data. This gave rise
to significantly higher correlation estimates with a median correlation parameter for the key
operational loss types around 30% and exceeds 50% for some banks in our sample. This is sig-
nificantly higher than Cope and Antonini and other studies.
The correlation estimates vary between banks, with higher correlations observed in larger
banks. The paper also considers correlations between bank operational losses and estimates cor-
relation parameters between losses of large banks in our sample to be 42% on average and suggests
the presence of systemic risk from the simultaneous occurrence of operational tail losses in dif-
ferent large banks. It should be noted, however, that the period considered for this study included
many industry wide scandals such as LIBOR-fixing which gave rise to heavy fines, and this may
affect the degree of correlation observed between banks.
8.2. Benchmarking Surveys of Modelling Practices and Assumptions
A number of benchmarking surveys of modelling practices have covered operational risk depen-
dency modelling and correlations.
ORIC International carried out a benchmarking survey of operational risk correlations across
22 of its member firms (ORIC International, 2016). This survey provides a useful summary of best
practices for setting correlations. Key findings in relation to dependencies between operational
risks are as follows:
• Most firms allowing for dependencies between operational risks were internal model firms.
• Correlations between operational risk ranged between 0% and 100%, but on average positive
correlation was being allowed for between all operational risk categories.
• Half of respondents used causal analysis to set correlations.
• The reduction in operational risk capital after allowing for diversification between opera-
tional risks was between 16% and 85%, with a mean of 55% and a median reduction of 36.5%.
In terms of dependencies between operational and non-operational risks, key findings of this
survey are as follows:
• Most firms allow for this, with 94%, 88% and 82% of respondents allowing for dependencies
between operational and insurance, market and credit risk, respectively.
Downloaded from https://www.cambridge.org/core. IP address: 46.4.80.155, on 10 Dec 2020 at 17:48:16, subject to the Cambridge Core terms of use, available at
https://www.cambridge.org/core/terms. https://doi.org/10.1017/S1357321720000033British Actuarial Journal 15
• No 0% correlations were observed, that is, allowance is made for some level of dependency
between operational and non-operational risk.
• The reduction in stand-alone operational risk capital after allowing for diversification with
non-operational risks was between 20% and 75%, with mean and median reductions of 45%.
ORIC also contributed to the IRM’s 2015 paper on insurer operational risk modelling. This survey
covered a mix of internal model (68% of or 19 out of 28 respondents) and standard formula firms.
In terms of operational dependency methodology, this survey found that Gaussian copula
aggregation was the most common approach used to aggregate operational risks (30% of respond-
ents), while 78% of respondents used Monte Carlo simulation techniques in some form for
aggregation, with T-copula also popular.
There was less consistency around the setting of correlation assumptions, with practices rang-
ing from a common correlation for all operational risks to correlations by operational risk pair,
with some opting for a hybrid approach with a common correlation for most risk pairs but with a
bespoke assessment for key operational risk. Correlations were set by either statistical analysis of
internal and external data or by expert judgement.
A more recent benchmarking survey was produced by KPMG in 2018, the results of which were
presented at the 2018 Life Conference. Again, Gaussian copula was the most popular approach to
aggregation with 41% of respondents, 12% using T-copula, 29% using correlation matrix
aggregation and 18% using other approaches. 82% of firms use pure expert judgement to set
correlations between operational risks. KPMG suggest that good practice would be to use a causal
driver approach to provide a better structure to the expert judgement process.
KPMG’s annual Technical Practices Survey also regularly surveys operational risk modelling
practices and includes benchmarking of operational risk correlations against non-operational
risks which may be useful in validating correlation assumptions (see 36–37 of the 2018
Technical Practices Survey).
Other actuarial benchmarking surveys which have relevance to modelling operational risk
include
• PriceWaterhouseCoopers (PwC’s) Life Insurance Capital Modelling Survey noted that the
majority of participants use a copula to aggregate operational risk stresses, with most of these
opting for the Gaussian copula. The dependencies between operational risks are most com-
monly based on either causal rationalisation or expert judgement.
• Ernst and Young’s UK Solvency II Pillar 1 Survey noted that the main method of aggregate
operational risks was the Gaussian copula, with over 80% of respondents setting correlation
assumptions by expert judgement as a lack of data makes derivation of correlations from internal
data difficult or unstable. The average diversification benefit between operational risks was 46%.
9. Conclusion
For the purposes of economic capital assessment, and for internal models of operational risk
under Solvency II, the Working Party believes that it is appropriate to model diversification
benefits both between operational risks, and between operational and non-operational risks.
Modelling dependencies can also shed insights into how operational and other risks are linked.
There are, however, a number of complications to this caused inter alia by a lack of data,
asymmetry between risks, implicit allowance for operational risks in non-operational risk capital
and lags in the emergence of operational losses.
In terms of methodology, benchmarking surveys suggest that copula approaches are the most
popular approach to modelling dependencies, with Gaussian copula the most common choice of
copula. While this copula has theoretical limitations in terms of tail dependency, we believe that
these are moot when there is so much uncertainty around correlation assumptions.
Downloaded from https://www.cambridge.org/core. IP address: 46.4.80.155, on 10 Dec 2020 at 17:48:16, subject to the Cambridge Core terms of use, available at
https://www.cambridge.org/core/terms. https://doi.org/10.1017/S1357321720000033You can also read