CRISIS COR NAVIRUS COVID-19 LESSONS FROM THE PAST AND OTHER JURISDICTIONS
←
→
Page content transcription
If your browser does not render page correctly, please read the page content below
RECOVERY FROM THE
                                  COR NAVIRUS
                                      CRISIS

COVID-19 LESSONS FROM
THE PAST AND OTHER
JURISDICTIONS
by Julian Morris and Marc Joffe

July 2020
Reason Foundation’s mission is to advance a free society by developing,
applying and promoting libertarian principles, including individual
liberty, free markets and the rule of law. We use journalism and public
policy research to influence the frameworks and actions of policymakers,
journalists and opinion leaders.

Reason Foundation’s nonpartisan public policy research promotes
choice, competition and a dynamic market economy as the foundation
for human dignity and progress. Reason produces rigorous, peer-
reviewed research and directly engages the policy process, seeking
strategies that emphasize cooperation, flexibility, local knowledge
and results. Through practical and innovative approaches to complex
problems, Reason seeks to change the way people think about issues,
and promote policies that allow and encourage individuals and
voluntary institutions to flourish.

Reason Foundation is a tax-exempt research and education organization
as defined under IRS code 501(c)(3). Reason Foundation is supported by
voluntary contributions from individuals, foundations and corporations.
The views are those of the author, not necessarily those of Reason
Foundation or its trustees.

Illustration 176773046 © Vladgrin - Dreamstime.com
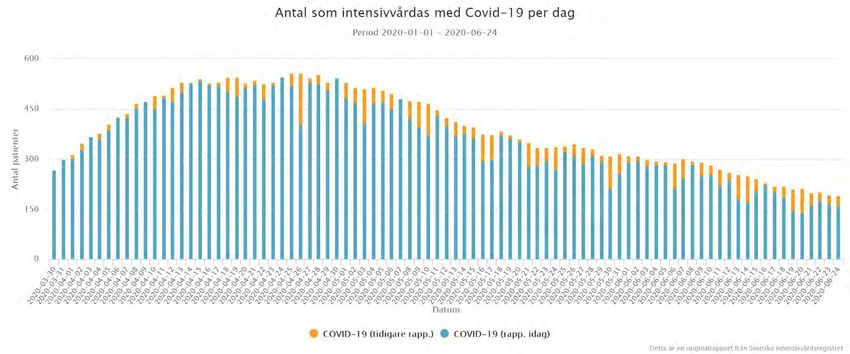
TABLE OF CONTENTS

PART 1                 INTRODUCTION ................................................................................................................... 1
PART 2                 U.S. RESPONSES TO THE SPANISH FLU ............................................................................ 2
PART 3                 BE PREPARED—AND ACT QUICKLY TO PREVENT THE SPREAD .................................... 7
PART 4                 ONCE THE VIRUS HAS SPREAD, IDENTIFY AND CONTAIN CLUSTERS ........................ 10
                       4.1 SOME LESSONS FROM SOUTH KOREA ............................................................................... 10
                       4.2 VO, ITALY ....................................................................................................................................... 12
                       4.3 VENETO AND LOMBARDY, ITALY .......................................................................................... 13
                       4.4 GERMANY AND THE U.K. .......................................................................................................... 13
                       4.5 SWEDEN AND ITS NEIGHBORS .............................................................................................. 17
                       4.6 ICELAND ......................................................................................................................................... 23
                       4.7 SAN FRANCISCO BAY AREA AND NEW YORK ................................................................... 27
PART 5                 DISCUSSION AND CONCLUSIONS .................................................................................... 30
ABOUT THE AUTHORS ................................................................................................................................. 34

  BRIEFS IN THIS SERIES
  Reason’s series of policy briefs on Recovery from the Coronavirus Crisis includes:

        •    Covid-19 Lockdown Problems and Alternative Strategies to Reopening the Economy
        •    Covid-19: Lessons from the Past and Other Jurisdictions
        •    The Covid-19 Status App: A Risk-Based Tool to Enable Businesses to Reopen While
             Limiting the Spread of SARS-CoV-2
        •    Monitor-Test-Trace-Isolate: Policies for Understanding and Reacting to Covid-19
             Infections
        •    Risk Management Tools for Covid-19: Information on Activity Risks and Industry
             Standards
        •    PPE: How to Increase Production and Distribution of Masks Amid Covid-19

Morris and Joffe | Covid-19 Lessons from the Past and Other Jurisdictions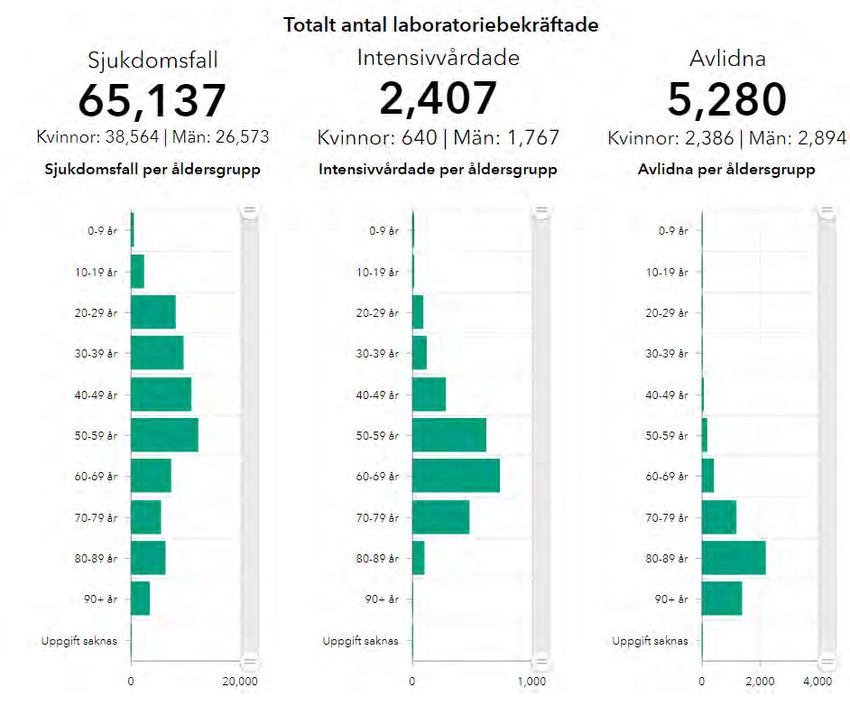
COVID-19: LESSONS FROM THE PAST AND OTHER JURISDICTIONS                                         1

PART 1

 INTRODUCTION
 Over the past six months, an astounding number of studies and reports have been produced
 addressing practically all possible aspects of the SARS-CoV-2 virus and the disease it
 causes, Covid-19. A search of Google Scholar for “Covid-19” generates over 1.2 million
 results. This brief does not attempt comprehensively to review that body of work. Instead, it
 draws upon what we believe are some of the more relevant studies and data in an attempt
 to provide an overview of some of the more compelling lessons that can reasonably be
 drawn regarding the effectiveness of different approaches that have been taken to prevent,
 contain and mitigate Covid-19.

 The report begins with a brief review of evidence regarding policies undertaken to address
 the Spanish Flu pandemic of 1918-19. Part 2 considers the policies implemented by
 jurisdictions that rapidly brought Covid-19 under control. Part 3 compares and contrasts
 policies undertaken by a range of different jurisdictions to contain Covid-19 once it has
 spread. Finally, Part 4 draws some tentative conclusions.

                                                                       Julian Morris and Marc Joffe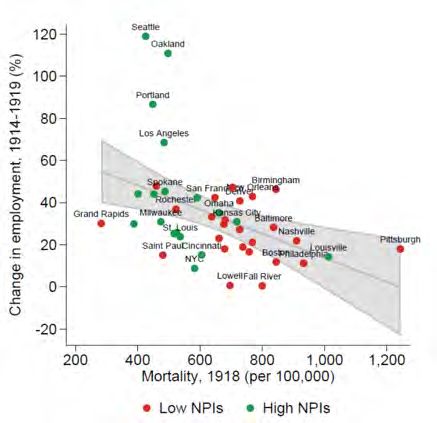
COVID-19: LESSONS FROM THE PAST AND OTHER JURISDICTIONS                                                          2

PART 2

 U.S. RESPONSES TO THE
 SPANISH FLU
 The Spanish Flu pandemic of 1918-1919 infected about one third of the world’s population
 and killed approximately one in ten of those who became infected, or 50 million people,
 including about 675,000 in the United States.1 While the Spanish Flu thus had a much
 higher fatality rate than Covid-19, especially among younger people, its global nature and
 some similarities in disease transmission mechanisms have invited comparisons between
 the two pandemics.

 While the Spanish Flu thus had a much higher fatality rate than
 Covid-19, especially among younger people, its global nature and
 some similarities in disease transmission mechanisms have
 invited comparisons between the two pandemics.

 1
     Taubenberger, Jeffery K. and David M. Morens. “1918 Influenza: the Mother of All Pandemics.” Emerging
     Infectious Diseases. Vol. 12 (1), 2006, 15–22; CDC. 1918 Pandemic (H1N1 virus). Washington DC: Centers for
     Disease Control, no date. https://www.cdc.gov/flu/pandemic-resources/1918-pandemic-h1n1.html

 Morris and Joffe | Covid-19 Lessons from the Past and Other Jurisdictions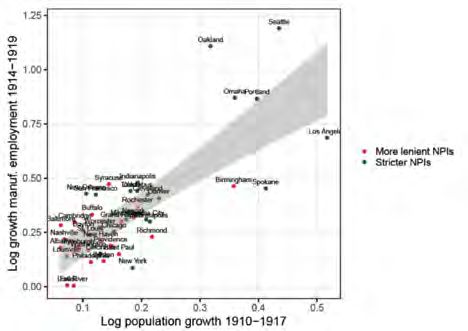
COVID-19: LESSONS FROM THE PAST AND OTHER JURISDICTIONS                                                        3

At the time of the Spanish Flu, there was no vaccine and there were few if any other
effective pharmaceutical interventions. As a result, and similar to Covid-19, the primary
means of control were through “non-pharmaceutical interventions” (NPIs), which during the
Spanish Flu pandemic mainly meant closing schools, banning public gatherings, and
requiring the use of masks.

A 2007 study by several public health experts published in the Journal of the American
Medical Association looked at the effects of these NPIs implemented at different times and
for different durations in 43 U.S. cities during the 1918-1919 flu pandemic.2 The authors
found that cities that had closed schools and banned public gatherings earlier delayed the
peak of the disease and had a lower peak—in other words, they “flattened the curve.” In
addition, those cities that kept the NPIs in place for longer, had lower overall mortality
rates.

While the effectiveness of early implementation of NPIs in reducing the severity of the
Spanish Flu seems clear, a second question has been raised regarding the cost-
effectiveness of the measures. One way to answer this question is to look at the effects the
NPIs had on the economy. Two recent studies sought to do that by looking at differences in
the timing and extent of NPIs implemented.

On March 26, 2020, economists Sergio Correia, Stephan Luck and Emil Verner posted a
working paper on the Social Sciences Research Network (SSRN) site reporting on their
analysis of the differential effect of the 1918 flu pandemic in the United States.3 Their main
finding was that cities that took early and aggressive action had a lower mortality rate and
a more rapid economic recovery. This can be seen in Figure 1 (taken from their paper),
which contrasts cities that implemented early and aggressive NPIs to contain the spread of
the Spanish ‘flu (green dots with those that did and red dots with those that did not). Cities
that took early and aggressive action had both lower mortality in 1918 and higher rates of
employment growth (a measure of economic growth) over the period 1914-1919.

2
    Markel, Howard, et al. “Nonpharmaceutical Interventions Implemented by US Cities During the 1918-1919
    Influenza Pandemic.” Journal of the American Medical Association. 2007;298(6):644–654., August 8, 2007.
3
    Correia, Sergio, Stephan Luck and Emil Verner. “Pandemics Depress the Economy, Public Health
    Interventions Do Not: Evidence from the 1918 Flu.” Social Science Research Network, (March 30, 2020).
    https://ssrn.com/abstract=3561560 or http://dx.doi.org/10.2139/ssrn.3561560

                                                                                     Julian Morris and Marc Joffe
COVID-19: LESSONS FROM THE PAST AND OTHER JURISDICTIONS 4
Correia et al.’s paper garnered considerable attention in the media, including in The New
York Times4 and The Economist.5 The paper has been downloaded over 70,000 times and the
abstract viewed over 360,000 times—and is ranked 10th of all papers on SSRN.6
FIGURE 1: CITY-LEVEL 1918 INFLUENZA MORTALITY AND MANUFACTURING
EMPLOYMENT GROWTH 1914-19
■ Low NPIs ■ High NPIs
120
100
Change in employment, 1914–1919 (%)
80
60
40
20
0
-20
200 400 600 800 1,000 1,200
Mortality, 1918 (per 100,000)
Source: Correia et al. Pandemics Depress the Economy (2020)
4
Badger, Emily and Quoctrung Bui. “Cities That Went All In on Social Distancing in 1918 Emerged Stronger
for It.” The New York Times, April 3, 2020.
https://www.nytimes.com/interactive/2020/04/03/upshot/coronavirus-cities-social-distancing-better-
employment.html
5
“Lessons from the Spanish flu: social distancing can be good for the economy.” The Economist. March 31,
2020.
6
Correia, et al. “Pandemics Depress the Economy, Public Health Interventions Do Not.”
Morris and Joffe | Covid-19 Lessons from the Past and Other JurisdictionsCOVID-19: LESSONS FROM THE PAST AND OTHER JURISDICTIONS 5
On May 2, 2020, three other economists, Andrew Lilley, Matthew Lilley and Gianluca
Rinaldi, published another study on SSRN reporting on a similar analysis, but looking over a
longer time period and taking into account changes in population.7 They concluded that
pre-existing trends, most notably in population growth, better accounted for the
differences in outcomes observed than did the timing and aggressiveness of NPIs. This
relationship can be seen in Figure 2. Indeed, the authors note that “once we account for
pre-existing differential trends, the estimated effect of NPIs on economic growth are a
noisy zero; we can neither rule out substantial positive nor negative effects of NPIs on
employment growth.”
FIGURE 2: CITY-LEVEL MANUFACTURING EMPLOYMENT GROWTH AGAINST POPULATION
GROWTH
■ More lenient NPIs ■ Stricter NPIs
1.25
Log growth manuf. employment 1914–1919
1.00
0.75
0.50
0.25
0
0.1 0.2 0.3 0.4 0.5
Log population growth 1910–1917
Source: Lilley et al.
7
Lilley, Andrew, Matthew Lilley and Gianluca Rinaldi. “Public Health Interventions and Economic Growth:
Revisiting The Spanish Flu Evidence.” SSRN, May 2, 2020.
https://papers.ssrn.com/sol3/papers.cfm?abstract_id=3590008
Julian Morris and Marc JoffeCOVID-19: LESSONS FROM THE PAST AND OTHER JURISDICTIONS 6
So, from the available evidence, it seems that the early imposition of NPIs were effective in
flattening the curve of the Spanish Flu. Meanwhile, keeping those NPIs in place for longer
did reduce the mortality rate. However, there does not seem to be good evidence regarding
the economic effects of such interventions one way or another.
It bears repeating that, during the 1918-19 flu pandemic, no jurisdiction imposed anything
approaching the kind of lockdowns—i.e. mandatory shelter-in-place requirements—that
were introduced widely during the current Covid-19 pandemic.8 Indeed, a 2006 review of
measures to address influenza pandemics noted:
There are no historical observations or scientific studies that support the confinement by
quarantine of groups of possibly infected people for extended periods in order to slow the
spread of influenza. A World Health Organization (WHO) Writing Group, after reviewing
the literature and considering contemporary international experience, concluded that
“forced isolation and quarantine are ineffective and impractical.”9
As such, it would be quite improper to conclude from the various studies of the Spanish Flu
and other influenza outbreaks that lockdowns were either a necessary or a desirable means
to contain Covid-19.
However, it is worth noting that the ‘flu is not a coronavirus and the characteristics of the
Covid-19 pandemic do seem to be quite different from influenza pandemics. For example,
whereas the Spanish Flu had very high incidence and mortality among infants and among
young adults,10 Covid-19 predominantly affects older adults, and most deaths have been
concentrated among those aged over 60.11
8
Stone, Lyman, “Lockdowns Don’t Work.” American Enterprise Institute, April 21, 2020.
https://www.aei.org/articles/lockdowns-dont-work/
9
Inglesby, Thomas V. et al. “Disease Mitigation Measures in the Control of Pandemic Influenza.” Biosecurity
and Bioterrorism: Biodefense Strategy, Practice, and Science. Vol 4 (4), 2006. Citing: “World Health Organization
Writing Group. Non pharmaceutical public health interventions for pandemic influenza, national and
community measures.” Emerging Infectious Diseases. Vol. 12, 2006. 88–94.
10
Taubenberger and Morens. “1918 Influenza.” 15–22.
11
Our World Data. “Mortality Risk of Covid-19.” https://ourworldindata.org/mortality-risk-covid
Morris and Joffe | Covid-19 Lessons from the Past and Other JurisdictionsCOVID-19: LESSONS FROM THE PAST AND OTHER JURISDICTIONS 7
PART 3
BE PREPARED—AND ACT
QUICKLY TO PREVENT
THE SPREAD
Some jurisdictions, most notably Asian countries that had experience with the 2002-2004
SARS outbreak, responded very swiftly to Covid-19. Starting in late December 2019,
Singapore, Hong Kong, Taiwan, and South Korea, all of which have strong direct ties to
China, very rapidly put in place measures to limit transmission.12 These measures included
travel restrictions, testing, tracing and isolation. As a result, they managed to contain the
spread of the virus, keeping infection rates and mortality low. Most other places
procrastinated, letting the virus spread.
Taiwan’s response, arguably the swiftest and most effective, included:
#1 Tracing and quarantining travelers with Covid-19 symptoms;
#2 Stringent restrictions on travel to and from areas with Covid-19 outbreaks;
12
On Hong Kong and Singapore, see: Purnell, Newley and Feliz Solomon. “Coronavirus Doesn’t Have to Be So
Deadly. Just Look at Hong Kong and Singapore.” The Wall Street Journal. May 26, 2020.
https://www.wsj.com/articles/coronavirus-doesnt-have-to-be-so-deadly-just-look-at-hong-kong-and-
singapore-11590491418
Julian Morris and Marc JoffeCOVID-19: LESSONS FROM THE PAST AND OTHER JURISDICTIONS 8
#3 The introduction of “health declaration passes,” issued by text message, that enabled
faster immigration for people from low-risk areas;
#4 The purchase and distribution of tens of millions of surgical and N95 masks.13
Starting in late December 2019, Singapore, Hong Kong, Taiwan,
and South Korea, all of which have strong direct ties to China,
very rapidly put in place measures to limit transmission. Most
other places procrastinated, letting the virus spread.
As a result, Taiwan successfully contained the spread of SARS-CoV-2 without resorting to a
full lockdown. As of June 24th, Taiwan reported a total of 446 confirmed cases of Covid-19
and seven deaths.14 This is all the more remarkable given Taiwan’s proximity to China, its
relatively large population (23.8 million), and the fact that it had daily direct flights to
Wuhan.
But not every country that successfully contained the spread of Covid-19 early took such
aggressive measures. Perhaps most notable was Japan, which did relatively little and yet
has seen fewer than 1,000 deaths from Covid-19 among its population of over 125
13
From December 31st, individuals with Covid-19 symptoms (coughing, fever) and a travel history to Wuhan
were required to quarantine. From January 20th, limits were imposed on travel to and from affected areas
based on risk, with mandatory 14-day quarantine for individuals from high-risk areas. All travelers were
required to complete health declaration forms before or on arrival in Taiwan and were issued “health
declaration passes” by SMS (text), which enabled more rapid immigration for those presenting minimal risk.
Taiwan also instituted increasingly strict prohibitions on non-Taiwanese nationals with travel history from
various affected jurisdictions. Meanwhile, by January 30th, the government was purchasing and distributing
four million masks/day. See Wang CJ, CY Ng and RH Brook. “Response to Covid-19 in Taiwan: Big Data
Analytics, New Technology, and Proactive Testing.” Journal of the American Medical Association.
2020;323(14).1341–1342. doi:10.1001/jama.2020.3151
https://jamanetwork.com/journals/jama/fullarticle/2762689#note-JVP200035-1
14
Johns Hopkins University Coronavirus Map (https://coronavirus.jhu.edu/map.html), Accessed 6/24/2020.
Morris and Joffe | Covid-19 Lessons from the Past and Other JurisdictionsCOVID-19: LESSONS FROM THE PAST AND OTHER JURISDICTIONS 9
million—a mortality rate of 7.6 deaths per million people.15 How did it achieve this? One
plausible explanation is that people in Japan routinely wear masks when they have any
kind of respiratory infection, and when Covid-19 began to spread in January, practically the
entire population rapidly adapted by wearing masks whenever they were in public.16 With
some encouragement (but no mandates) from government, many businesses did switch to
teleworking in early March, and karaoke bars closed down. The government also
subsequently declared a state of emergency in April, which lasted for six weeks, but it did
not impose any widespread restrictions; rather, it focused on identifying and containing
clusters—and reiterating the importance of avoiding close contact, especially when
unmasked.17
15
Ibid. and World Bank for population data: https://data.worldbank.org/indicator/SP.POP.TOTL
16
Rich, Motoko. “Is the Secret to Japan’s Virus Success Right in Front of Its Face?” The New York Times. June 6,
2020. https://www.nytimes.com/2020/06/06/world/asia/japan-coronavirus-masks.html
17
Normile, Dennis. “Japan ends its Covid-19 state of emergency.” Science. May. 26, 2020.
https://www.sciencemag.org/news/2020/05/japan-ends-its-covid-19-state-emergency
Julian Morris and Marc JoffeCOVID-19: LESSONS FROM THE PAST AND OTHER JURISDICTIONS 10
PART 4
ONCE THE VIRUS HAS
SPREAD, IDENTIFY AND
CONTAIN CLUSTERS
There are important lessons to be learned from the approaches to Covid-19 taken by
jurisdictions such as South Korea, regions of Italy, Germany (contrasted with the U.K.),
Iceland and the San Francisco Bay Area (contrasted with NYC).
4.1 SOME LESSONS FROM SOUTH KOREA
Like Taiwan, South Korea managed to contain the spread of SARS-CoV-2 relatively quickly
through similar measures. In addition, the government:
#1 Introduced social distancing measures (including closing schools and restricting large
gatherings).
#2 Announced that it would rapidly issue emergency authorization for tests that detect the
presence of the virus. (The first such authorization came on February 4th.18)
18
Terhune, Chad, Dan Levine, Hyunjoo Jin and Jane Lanhee Lee. “Special Report: How Korea trounced U.S. in
race to test people for coronavirus.” Reuters. March 18, 2020 https://www.reuters.com/article/us-health-
Morris and Joffe | Covid-19 Lessons from the Past and Other JurisdictionsCOVID-19: LESSONS FROM THE PAST AND OTHER JURISDICTIONS 11
#3 Provided testing to anyone who had Covid-19 symptoms (and increasingly those without
symptoms) for the presence of the virus.
#4 Utilized tests produced by private companies and contracted out test analysis to private
laboratories.19
#5 Undertook tracing and testing of people who had contact with those symptomatic
individuals and sent texts to individuals who might have been in contact with those who
tested positive.20
#6 Treated those with severe symptoms.
#7 Quarantined those who tested positive but had no or only mild symptoms (the
quarantine was monitored using a phone app and strictly enforced).21
Unfortunately, South Korea experienced a sudden uptick in cases, starting in the city of
Daegu on February 18th. The outbreak was traced to a single individual, “Patient 31” who is
estimated to have infected approximately 1,100 people.22
coronavirus-testing-specialrep/special-report-how-korea-trounced-u-s-in-race-to-test-people-for-
coronavirus-idUSKBN2153BW
19
Lee, David and Jaehong Lee. “Testing on the move: South Korea’s rapid response to the Covid-19 pandemic.”
Transportation Research Interdisciplinary Perspectives, Vol. 5, May 2020.
https://www.sciencedirect.com/science/article/pii/S2590198220300221
20
Zastrow, Mark. "South Korea is reporting intimate details of Covid-19 cases: has it helped?" Nature. 18 March
2020. https://www.nature.com/articles/d41586-020-00740-y
21
Dudden, Alexis and Andrew Marks. “South Korea took rapid, intrusive measures against Covid-19 – and they
worked.” The Guardian. 20 March 2020. https://www.theguardian.com/commentisfree/2020/mar/20/south-
korea-rapid-intrusive-measures-covid-19; Braun, Andrés Sánchez, “Commitment, transparency pay off as
South Korea limits COVID-19 spread,” EurActiv, March 16, 2020.
https://www.euractiv.com/section/coronavirus/news/commitment-transparency-pay-off-as-south-korea-
limits-covid-19-spread/
22
“Patient 31” had a car accident on February 7th and had been in hospital. Then, on February 10th she
developed a fever and a week later was tested for Covid-19; she received a positive test result on the 18th
and was put in isolation. Unfortunately, before she received her positive test result, Patient 31 had attended
a religious service and went for lunch with a friend.
https://www.cdc.go.kr/board/board.es?mid=a30402000000&bid=0030&tag=&act=view&list_no=366232
Julian Morris and Marc JoffeCOVID-19: LESSONS FROM THE PAST AND OTHER JURISDICTIONS 12
In order to contain the cluster, on February 23rd Korea’s Ministry of Health and Welfare
(MOHW) requested that all residents of and visitors to Daegu voluntarily self-isolate.23 It
also established mobile testing in Daegu and Gyeongsangbuk-do, the site of another
cluster.24 As a result of these actions, South Korea was able to slow the spread in the
clusters and prevent them from affecting other regions.
It is notable that South Korea’s success—and in particular its reliance on testing, tracing
and isolation—was already widely known by mid-March. Indeed, The Wall Street Journal ran
a story about it on March 16th.25 Yet, the U.S., which has a larger biotechnology industry
than South Korea, and could easily have ramped up production of tests, failed to do so—in
no small part because of actions taken by the CDC and FDA that impeded private
production and use of tests.26
4.2 VO, ITALY
South Korea’s experience shows that, even after community spread has occurred, it may be
possible to stop it relatively quickly. The small town of Vo in Northern Italy, the site of the
first death in the country from Covid-19, appears to have stopped the disease from
spreading in approximately three weeks.27 It did so through a combination of universal
testing, two weeks of strict lockdown, and quarantine of cases.
23
Korean Center for Disease Control. “The Updates of Covid-19 in Republic of Korea.” 02 February, 2020.
https://www.mohw.go.kr/eng/nw/nw0101vw.jsp?PAR_MENU_ID=1007&MENU_ID=100701&page=1&CONT_
SEQ=353124
24
Ibid.
25
Yoon Dasl and Timothy W. Martin. “How South Korea Put into Place the World’s Most Aggressive
Coronavirus Test Program.” The Wall Street Journal. March 16, 2020. https://www.wsj.com/articles/how-
south-korea-put-into-place-the-worlds-most-aggressive-coronavirus-testing-
11584377217?mod=article_inline
26
Boburg, Shawn, Robert O'Harrow Jr., Neena Satija and Amy Goldstein. “Inside the coronavirus testing failure:
Alarm and dismay among the scientists who sought to help.” Washington Post. April 3, 2020.
https://www.washingtonpost.com/investigations/2020/04/03/coronavirus-cdc-test-kits-public-health-
labs/?arc404=true
27
Rettner, Rachael. “How one small Italian town cut coronavirus cases to zero in just a few weeks.”
LiveScience. March 18, 2020. https://www.livescience.com/small-italian-town-cuts-coronavirus-cases-
testing.html
Morris and Joffe | Covid-19 Lessons from the Past and Other JurisdictionsCOVID-19: LESSONS FROM THE PAST AND OTHER JURISDICTIONS 13
Vo has a population of 3,300, which made universal testing more realistically feasible than
would be the case in a much larger jurisdiction. But the general approach of widespread
testing, tracing the contacts of those who test positive, and isolating all those who test
positive has been applied in numerous locations with considerable success.
4.3 VENETO AND LOMBARDY, ITALY
Indeed, Veneto—the region that contains Vo—has been quite successful in limiting
transmission, at least compared to neighboring regions in Italy, through a combination of
widespread testing, including both symptomatic and asymptomatic individuals, and tracing
and testing contacts of those who tested positive. It also took great care to ensure those
with the infection self-isolated, including by offering tests at home. By comparison,
Lombardy, which neighbors Veneto, has undertaken far fewer tests per capita, done a less
thorough job of contact tracing, and has done less to encourage self-isolation.28
4.4 GERMANY AND THE U.K.
Both the U.K. and Germany have suffered severe outbreaks of Covid-19 but far more people
have died in the U.K. than have died in Germany, in spite of the latter having a considerably
larger population (about 83 million compared to about 67 million in the U.K.). Part of the
difference in mortality is likely due to demographic factors: Germany has lower population
density and its largest city, Berlin, has a population of only 3.3 million, compared to
London’s 8.9 million. Culture also likely plays a role. But a large part of the difference in
mortality is likely a result of difference in the approach taken to testing, tracing and
isolating people.
Since February 28th, insurance funds in Germany have covered the costs of testing
individuals who were symptomatic, following the advice of the Robert Koch Institute,
Germany’s equivalent of the Centers for Disease Control (CDC).29 As the scale of the
28
Pisano, Gary P., Raffaella Sadun and Michele Zanini. “Lessons from Italy’s Response to Coronavirus.” Harvard
Business Review, March 27, 2020. https://hbr.org/2020/03/lessons-from-italys-response-to-coronavirus.
29
Federal Ministry of Health, “Information on testing.”
https://www.zusammengegencorona.de/en/inform/information-on-testing/; see also: Robert Koch Institute,
“COVID-19 in Germany,” https://www.rki.de/EN/Content/Institute/institute_node.html
Julian Morris and Marc JoffeCOVID-19: LESSONS FROM THE PAST AND OTHER JURISDICTIONS 14
problem grew during March, provincial governments began widespread testing of non-
symptomatic individuals, and initiated an aggressive program of testing, contact tracing
and isolation. The aim was to understand the overall incidence of Covid-19, as well as to
identify and contain disease clusters.30 By the week of April 4th, 132—mostly private—
testing labs were carrying out an average of over 115,000 swab tests per day.31 Provinces
with significant outbreaks also introduced aggressive social distancing measures—and the
federal government then introduced “guidelines” for businesses to be implemented by the
provinces that included a $27,000 fine for non-compliance.32 This strategy seems to have
largely been successful; as can be seen in Figure 5.
FIGURE 3: NUMBER OF NEW CASES OF COVID-19 IN GERMAN PROVINCES
Others North Rhine-Westphalia Bavaria Baden-Württemberg Berlin
Source: Data from Robert Koch Institute; graphic from:
https://en.wikipedia.org/wiki/2020_coronavirus_pandemic_in_Germany
30
Schneider, Paula. “Statistikerin fordert Tests, die endlich das wahre Corona-Ausmaß in Deutschland zeigen.”
Focus Online. 25 March 2020. https://www.focus.de/gesundheit/news/es-grassiert-ungewissheit-
repraesentative-tests-sollen-wahres-ausmass-in-deutschland-zeigen_id_11813688.html
31
Morris, Chris. “Coronavirus: What can the UK learn from Germany on testing.” BBC News. April 11, 2020.
https://www.bbc.com/news/health-52234061
32
“What are Germany’s new coronavirus social distancing rules?” DW. 22 March 2020.
https://p.dw.com/p/3ZsxK.
Morris and Joffe | Covid-19 Lessons from the Past and Other JurisdictionsCOVID-19: LESSONS FROM THE PAST AND OTHER JURISDICTIONS 15
On paper, the U.K.’s approach was almost a mirror image of Germany’s. From early
February, Public Health England, the country’s equivalent of the CDC, recommended testing
not only those who were symptomatic but also non-symptomatic contacts.33 But then on
March 13, PHE changed its advice, limiting testing to those who were hospitalized.34 This
apparently sudden change was partly a consequence of PHE’s highly centralized approach
to analyzing swabs, which were being carried out only in PHE’s own labs, rather than
relying on the hundreds of private labs around the country.35 It was also seemingly driven
by an assumption on the part of the government that mass infection was inevitable and
containment thus pointless.36
On April 1st, Mike Fischer, the owner of a private lab, initiated a program of private testing,
both at his own lab and by offering 1 million pounds ($1.25 m) to support testing at other
labs around the country.37 Fischer is reported to have said, “Our aspirational goal ... is that if
we can get to 1,000 labs doing 800 tests per day within a few months, that will provide
800,000 tests per day.”38 Then on April 4th, the government announced its own plan to scale
up testing, this time involving the private sector in both testing and logistics.39 Six weeks
33
Public Health England. “Guidance: COVID-19: investigation and initial clinical management of possible
cases.” Updated 6 February
(https://web.archive.org/web/20200206233909/https://www.gov.uk/government/publications/wuhan-novel-
coronavirus-initial-investigation-of-possible-cases/investigation-and-initial-clinical-management-of-
possible-cases-of-wuhan-novel-coronavirus-wn-cov-infection ) and updated 12 March 2020
(https://web.archive.org/web/20200312190449/https:/www.gov.uk/government/publications/wuhan-novel-
coronavirus-initial-investigation-of-possible-cases/investigation-and-initial-clinical-management-of-
possible-cases-of-wuhan-novel-coronavirus-wn-cov-infection).
34
Public Health England. “Guidance: COVID-19: investigation and initial clinical management of possible
cases.” Updated 13 March.
https://web.archive.org/web/20200315110334/https://www.gov.uk/government/publications/wuhan-novel-
coronavirus-initial-investigation-of-possible-cases/investigation-and-initial-clinical-management-of-
possible-cases-of-wuhan-novel-coronavirus-wn-cov-infection
35
Lesh, Matthew. “Testing Times: The urgent need to decentralise COVID-19 diagnostic testing in the United
Kingdom.” London: Adam Smith Institute. April 2, 2020. https://www.adamsmith.org/research/testing-times
36
FT Reporters. “Why the UK is struggling to scale up coronavirus testing.” Financial Times. April 1, 2020.
https://www.ft.com/content/3c9cf7d0-3d11-443e-a156-d111b333fd72
37
Whittaker, Rebecca, “Abingdon lab owner calls for more Covid-19 tests.” Oxford Mail. April 7, 2020.
https://www.oxfordmail.co.uk/news/18365557.abingdon-lab-owner-calls-covid-19-tests/
38
Ibid, citing an interview on Radio 5 live.
39
Department of Health and Social Care. Coronavirus (COVID-19): Scaling up our testing programmes. 4 April 2020.
https://assets.publishing.service.gov.uk/government/uploads/system/uploads/attachment_data/file/878121/
coronavirus-covid-19-testing-strategy.pdf
Julian Morris and Marc JoffeCOVID-19: LESSONS FROM THE PAST AND OTHER JURISDICTIONS 16
later, the U.K. had still only performed about half the total number of tests per 1,000
people as Germany.
Figure 4 contrasts the cumulative of tests (per 1,000 people) in Germany and the U.K. As of
April 28th, the proportion of people tested in Germany was three times that in the U.K. Only
in the past few weeks has the U.K. finally caught up with Germany. Meanwhile, the
effectiveness of the differences in approach taken in Germany and the U.K. can be seen in
Figure 5, which shows the number of new confirmed cases and the number of deaths from
Covid-19 each day from the beginning of March to the end of May. Germany’s more
aggressive testing led to the identification of a much larger number of cases early on,
enabling effective isolation, which reduced transmission and lowered mortality.
FIGURE 4: TOTAL COVID-19 TESTS PER 1,000 PEOPLE IN THE U.K. AND GERMANY
70
UK tests performed UK people tested Germany tests performed
60
50
40
30
20
10
0
0
0
0
0
0
20
20
0
0
0
0
20
0
0
0
0
-2
-2
-2
-2
-2
-2
-2
-2
-2
-2
-2
r-2
-2
n-
n-
n-
pr
pr
pr
ay
ay
ay
ay
ar
ar
ar
ar
ay
Ap
-Ju
-Ju
Ju
M
-M
-M
-M
-A
-A
-A
-M
-M
-M
-M
M
7-
5-
8-
14
21
3-
12
19
26
15
22
29
10
17
24
31
Source: Our World In Data. “Total Covid-19 Tests per 1,000 People.” https://ourworldindata.org/grapher/full-list-
cumulative-total-tests-per-thousand
Morris and Joffe | Covid-19 Lessons from the Past and Other JurisdictionsCOVID-19: LESSONS FROM THE PAST AND OTHER JURISDICTIONS 17
FIGURE 5: CONFIRMED CASES (LEFT AXIS) AND DEATHS (RIGHT AXIS) FROM COVID-19,
U.K. AND GERMANY (7-DAY MOVING AVERAGE)
7000 1400
7 per. Mov. Avg. (Germany Cases) 7 per. Mov. Avg. (UK Cases)
7 per. Mov. Avg. (Germany Deaths) 7 per. Mov. Avg. (UK Deaths)
6000 1200
5000 1000
4000 800
3000 600
2000 400
1000 200
0 0
0
0
0
0
20
20
0
0
0
20
0
0
0
0
0
0
-2
-2
-2
-2
-2
-2
r-2
-2
-2
-2
-2
-2
-2
n-
n-
n-
ay
ay
ay
ar
ay
ay
ar
ar
ar
pr
pr
pr
Ap
-Ju
-Ju
Ju
M
-M
-M
-M
-A
-A
-A
-M
-M
-M
M
M
6-
4-
13
20
7-
11
18
25
2-
9-
14
21
28
16
23
30
Source: Our World in Data, “Daily confirmed COVID-19 cases and deaths.” https://ourworldindata.org/grapher/daily-covid-
cases-deaths
4.5 SWEDEN AND ITS NEIGHBORS
The only significant “social distancing” measure mandated by the Swedish government has
been to ban gatherings of 50 or more people. It imposed relatively few other restrictions on
businesses other than high schools and universities, which it closed on March 18, and it did
not limit travel. However, the country’s government also barred visits to nursing homes and
told all citizens over 70 years of age and anyone feeling ill to self-isolate. These shelter-in-
place orders were targeted specifically at these populations precisely because they were
assumed to be most vulnerable to Covid-19.
Julian Morris and Marc JoffeCOVID-19: LESSONS FROM THE PAST AND OTHER JURISDICTIONS 18 The Swedish Covid-19 dashboard provides the age profile of both cases and deaths. This chart shows deaths heavily concentrated in older age groups but does not show the percentage of fatalities in patients with comorbidities. FIGURE 6: SWEDEN, POSITIVE TESTS (LEFT), ICU CASES (MIDDLE), AND DEATHS (RIGHT) BY AGE GROUP Source: Swedish Public Health Agency. “Total Number of Laboratory Confirmed.” https://experience.arcgis.com/experience/09f821667ce64bf7be6f9f87457ed9aa Morris and Joffe | Covid-19 Lessons from the Past and Other Jurisdictions
COVID-19: LESSONS FROM THE PAST AND OTHER JURISDICTIONS                                                              19

 FIGURE 7: SWEDEN, COVID-19 INTENSIVE CARE ADMISSIONS PER DAY

Source: Swedish Intensive Care Register, https://portal.icuregswe.org/siri/report/corona.covid-dagligen

 FIGURE 8: SWEDEN, COVID-19 DEATHS PER DAY
   200

   180

   160

   140

   120

   100

    80

    60

    40

    20

      0
           20
            0
            0

            0

            0

            0

            0

            0
            0

           20

           20
            0

            0

            0

            0
         -2

         -2

         -2

         -2

         -2

         -2

         -2

         -2

         -2

         -2

         -2
        r-2

        n-

        n-

        n-
       ar

       ar

       ar

      pr

      pr

      pr

      ay

      ay

      ay

      ay

      ay
     Ap

     Ju

    -Ju

    -Ju
   -M

   -M

   -M

    -A

    -A

    -A

    M

   -M

   -M

   -M

   -M

  7-
  5-

 3-

 14

 21
 12

 19

 26
15

22

29

10

17

24

31

Source: Our World in Data: https://ourworldindata.org/grapher/daily-covid-cases-deaths

                                                                                            Julian Morris and Marc Joffe
COVID-19: LESSONS FROM THE PAST AND OTHER JURISDICTIONS 20
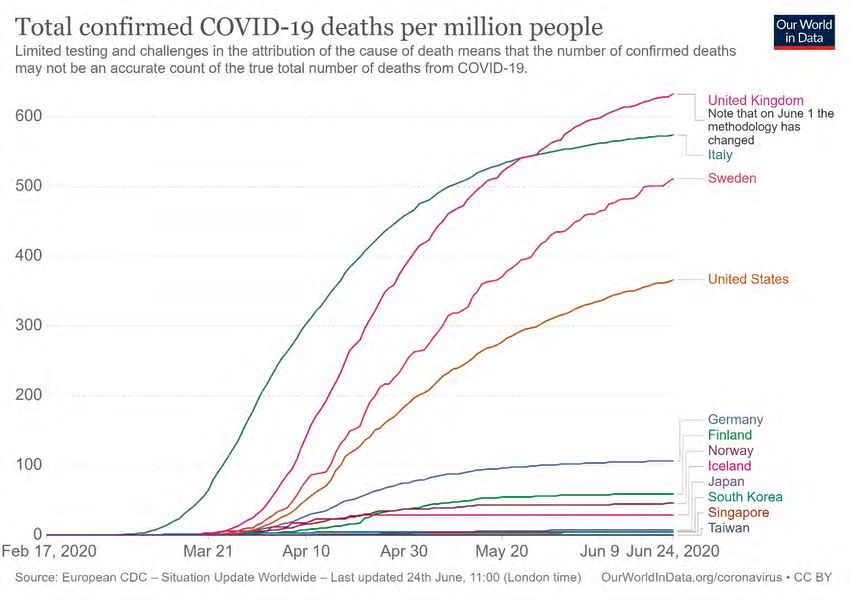
Some commentators criticized Sweden early on for its approach, noting its higher death
rates compared to neighboring countries that enacted more-pervasive restrictions.40 Figure
9 shows death rates per million for Sweden and its neighbors: Norway, Finland, and
Denmark. The contrast is striking: as of May 23rd, the death rate in Sweden is four times
that of Denmark and nearly eight times that of Finland and Norway. While some of this
difference may be explained by the more-aggressive lockdowns imposed in the other
Scandinavian countries in mid-March, there are likely other explanations as well.
FIGURE 9: TOTAL DEATHS PER MILLION FROM COVID-19, SWEDEN, DENMARK, NORWAY,
AND FINLAND
600
Sweden Denmark Norway Finland
500
400
300
200
100
0
20
0
0
0
0
0
0
0
0
0
20
20
20
0
0
0
-2
-2
-2
-2
-2
-2
-2
-2
-2
-2
r-2
r-2
n-
n-
n-
n-
ar
ar
ar
pr
pr
pr
ay
ay
ay
ay
Ap
Ap
Ju
-Ju
-Ju
-Ju
-M
-M
-M
-A
-A
-A
M
-M
-M
-M
3-
1-
8-
6-
10
17
24
15
22
29
11
18
25
13
20
27
Source: Our World in Data. “Total confirmed Covid-19 deaths per million people.” May 26, 2020
https://ourworldindata.org/grapher/total-covid-deaths-per-million
40
Wiley, Melissa. “Sweden’s coronavirus death rate is nearly 6 times that of neighboring Norway and Finland.
Here's a look at how the countries have approached the coronavirus pandemic differently.” Business Insider,
April 28, 2020, https://www.businessinsider.com/photos-norway-sweden-different-coronavirus-responses-
fatality-rates-2020-4
Morris and Joffe | Covid-19 Lessons from the Past and Other JurisdictionsCOVID-19: LESSONS FROM THE PAST AND OTHER JURISDICTIONS 21
Part of the difference is likely due to differences in testing regimes. As Figure 10 shows,
Norway implemented a more aggressive testing program earlier than Sweden, Finland or
Denmark, and as of May 17th had tested twice as many people per 1,000 as Sweden.
Meanwhile, although it got off to a late start, Denmark rapidly ramped up its testing and as
of May 17 th had tested nearly four times as many people per 1,000 as Sweden. Had Sweden
implemented a more effective test-trace-isolate regime it might have caught and contained
the clusters of Covid-19 in care homes that have contributed to so much to its mortality
rate.
The timing of infections is also relevant. Although the first confirmed case of Covid-19 in
Finland (a traveller from Wuhan) was identified on January 31st, there were no other cases
until the end of February, and the first Covid-19 death in the country occurred at the end of
March. Given the heightened awareness of Covid-19 during March, it seems likely that
caution on the part of individuals contributed the low incidence of Covid-19 in the country.
Given the heightened awareness of Covid-19 during March, it
seems likely that caution on the part of individuals contributed the
low incidence of Covid-19 in the country.
The head of Norway’s public health agency, Camilla Stoltenberg, recently acknowledged
that the lockdown was likely not necessary. In an interview with the state broadcaster NRK
she stated:
Our assessment now....is that we could possibly have achieved the same effects and
avoided some of the unfortunate impacts by not locking down, but by instead keeping
open but with infection control measures. 41
41
Norway 'could have controlled infection without lockdown': health chief. Thelocal.no. 22 May 2020.
https://www.thelocal.no/20200522/norway-could-have-controlled-infection-without-lockdown-health-
chief/amp
Julian Morris and Marc JoffeCOVID-19: LESSONS FROM THE PAST AND OTHER JURISDICTIONS 22
Denmark has been steadily relaxing its lockdown since mid-April. By late May, the
government had reopened a wide array of facilities including schools, restaurants, shopping
malls,42 museums and zoos.43
FIGURE 10: COVID-19 TESTS PER 1,000 SWEDEN, DENMARK, NORWAY, AND FINLAND
180
Sweden Denmark Norway Finland
160
140
120
100
80
60
40
20
0
0
0
0
0
0
0
20
20
0
0
0
0
20
0
0
0
0
-2
-2
-2
-2
-2
-2
-2
-2
-2
-2
-2
-2
r-2
-2
n-
n-
n-
pr
pr
pr
ay
ay
ay
ay
ar
ar
ar
ar
ar
ay
Ap
-Ju
-Ju
Ju
M
M
-M
-M
-M
-A
-A
-A
-M
-M
-M
-M
M
7-
5-
1-
8-
14
21
3-
12
19
26
15
22
29
10
17
24
31
Source: Our World in Data. “Coronavirus Testing.” https://ourworldindata.org/coronavirus-testing
NOTE: Swedish testing rates are reported weekly, so for simplicity we have used weekly data for all jurisdictions. (As of
June 24, data is not yet available for testing in Sweden for the week ending June 21)
In some respects, since Sweden’s approach was to achieve herd immunity early through
widespread infection with the virus, it is hardly surprising that it has had a higher mortality
rate than its neighbors. And its intensive care admission rates and death rates have fallen,
as shown in the figures above, in line with their expectations.
42
Denmark unlocking restaurants, shopping malls in reopening 2.0 after virus shutdown. Reuters. May 7, 2020.
https://www.reuters.com/article/us-health-coronavirus-denmark/denmark-unlocking-restaurants-shopping-
malls-in-reopening-2-0-after-virus-shutdown-idUSKBN22J2W2
43
Denmark speeds up reopening as virus spread slows. Medical Xpress. May 21, 2020.
https://medicalxpress.com/news/2020-05-denmark-reopening-virus.html
Morris and Joffe | Covid-19 Lessons from the Past and Other JurisdictionsCOVID-19: LESSONS FROM THE PAST AND OTHER JURISDICTIONS 23
One important feature of Sweden’s experiment is that under 2% of the Covid-19 deaths in
the country have befallen individuals below 50 years of age. While similar patterns have
been observed elsewhere, the data from Sweden are of particular saliency owing to the
relative absences of controls on movement there. This provides empirical support for
proposals to exempt younger adults who don’t have underlying health conditions from all
shelter-in-place orders and to reopen schools.
4.6 ICELAND
Like Hawaii and New Zealand—both of which have had relatively low mortality rates—
Iceland benefits from having few ports of entry.44 How did Iceland do it?
Iceland’s approach has combined widespread testing, quarantine and isolation, and
treatment. This has enabled it to contain the spread of the virus, limit mortality, and avoid
a lockdown.
Iceland’s aggressive testing program combines:
1. A targeted assessment of symptomatic individuals and their contacts, conducted by
the government-funded and government-run National University Hospital of Iceland
(NUHI),45 and
2. Population testing (a mix of open invitation random sampling), conducted and
funded by deCODE genetics, a local biotechnology company that is now owned by
Amgen.46
44
As of April 28, Iceland has had 10 deaths from Covid-19 out of a population of 364,000; Sweden has had
2,355 deaths out of a population of 10.23 million. European Centre for Disease Prevention and Control.
“Download today’s data on the geographic distribution of COVID-19 cases worldwide.”
https://www.ecdc.europa.eu/en/publications-data/download-todays-data-geographic-distribution-covid-19-
cases-worldwide
45
“Large scale testing of general population in Iceland underway.” Ministry for Foreign Affairs. Prime Minister's
Office, and Ministry of Health, Iceland. March 15, 2020.
https://www.government.is/news/article/2020/03/15/Large-scale-testing-of-general-population-in-Iceland-
underway/
46
Otmani, Malin. “COVID-19: First results of the voluntary screening in Iceland.” Nordic Life Science News.
March 22, 2020. https://nordiclifescience.org/covid-19-first-results-of-the-voluntary-screening-in-iceland/
Julian Morris and Marc JoffeCOVID-19: LESSONS FROM THE PAST AND OTHER JURISDICTIONS 24
In addition, a team of 50 individuals, employed by NUHI, has been tracing contacts of all
those who test positive.47
The targeted testing has focused on symptomatic individuals in “high risk” areas and those
who had contact with someone who tested positive. Those who test positive, whether or
not they are symptomatic, are then required to quarantine for 14 days.
FIGURE 11: TESTING IN ICELAND
2500
tests NUHI* tests deCODE Genetics
2000
1500
1000
500
0
2.03
6.03
3.04
7.04
1.05
5.05
9.05
2.06
6.06
27.02
10.03
14.03
18.03
22.03
26.03
30.03
11.04
15.04
19.04
23.04
27.04
13.05
17.05
21.05
25.05
29.05
10.06
14.06
Source: Iceland Directorate of Health and The Department of Civil Protection and Emergency Management,
www.covid.is/data
47
Gudbjartsson, Daniel F. et al. “Spread of SARS-CoV-2 in the Icelandic Population.” New England Journal of
Medicine. April 14, 2020. https://www.nejm.org/doi/full/10.1056/NEJMoa2006100
Morris and Joffe | Covid-19 Lessons from the Past and Other JurisdictionsCOVID-19: LESSONS FROM THE PAST AND OTHER JURISDICTIONS 25
The targeted testing program began on February 1st and the population testing program
began on March 15th. Figure 11 shows the number of tests undertaken in the two programs
on a daily basis from February 27th to June 14th.48 Figure 12 shows the number of new cases
identified through each. As of June 14th, a total of 63,157 samples have been taken (some of
these represent re-testing of the same individual); 1,810 confirmed cases were identified, of
which 1,796 have recovered, four are in isolation, and 10 have died.
FIGURE 12: NEW CASES OF COVID-19 IN ICELAND
120
new cases NUHI* new cases deCODE Genetics
100
80
60
40
20
0
2.03
6.03
3.04
7.04
1.05
5.05
9.05
2.06
6.06
27.02
10.03
14.03
18.03
22.03
26.03
30.03
11.04
15.04
19.04
23.04
27.04
13.05
17.05
21.05
25.05
29.05
10.06
14.06
Source: Iceland Directorate of Health and The Department of Civil Protection and Emergency Management,
www.covid.is/data
48
Between Feb 1st and Feb 26th, 46 samples were tested, according to the Directorate of Health and The
Department of Civil Protection and Emergency Management. On June 15th, Iceland reopened its borders and
has been screening all arrivals—about 800 per day—and Iceland subsequently changed the way it is
reporting tests and incidence. https://www.covid.is/data;
Julian Morris and Marc JoffeCOVID-19: LESSONS FROM THE PAST AND OTHER JURISDICTIONS 26
It is also worth noting the demographic distribution of cases and deaths in Iceland, as
shown in Figure 13: 95% of cases were in people under 70 years of age, while 70% of
deaths were in people over 70. Meanwhile, the case fatality rate for people under 60 is
0.07% (that’s 7 in 10,000), while the case fatality rate for people over 60 is about 3%.49
FIGURE 13: AGE DISTRIBUTION OF COVID INFECTIONS IN ICELAND
400
Active infections Recovered Deaths
350
300
250
200
150
100
50
0
Uner 1 1-5 6-12 13-17 18-29 30-39 40-49 50-59 60-69 70-79 80-89 90-99 100-109
Source: Iceland Directorate of Health and The Department of Civil Protection and Emergency Management,
www.covid.is/data
49
Author’s calculations based on data from the Iclandic Directorate of Health and The Department of Civil
Protection and Emergency Management at www.covid.is/data
Morris and Joffe | Covid-19 Lessons from the Past and Other JurisdictionsCOVID-19: LESSONS FROM THE PAST AND OTHER JURISDICTIONS 27
4.7 SAN FRANCISCO BAY AREA AND NEW YORK
In the U.S., the San Francisco Bay Area and New York offer among the starkest contrast in
approaches.
Covid-19 infections became a concern in the Bay Area shortly after the initial U.S. outbreak
occurred at the Life Care Center in Kirkland, Washington. San Francisco’s technology sector
was ahead of the curve in terms of raising concerns about and responding to SARS-CoV-2.
Several days before local governments took any action, company leaders from Bay Area
companies were instructing their employees to work from home.50 Because the Bay Area
has a relatively high proportion of technology workers, it was easier for employers to
implement work-from-home policies without a major loss of productivity.
Dr. Sara Cody, head of Santa Clara County’s Public Health Department, was also proactive;
she established an incident room on January 23rd,51 long before any local residents were
hospitalized with Covid-19.52 And on March 14th, Cody notified other Bay Area officials of an
50
Twitter strongly encouraged all its employees globally to work from home on March 2nd and mandated it on
March 11th. https://blog.twitter.com/en_us/topics/company/2020/keeping-our-employees-and-partners-safe-
during-coronavirus.html; Google asked all its North American employees to begin working from home on
March 10th and offered payments to temporary staff and vendors impacted by office closures. Fried, Ina.
“Google asks all North American employees to work from home.” Axios. March 11, 2020.
https://www.axios.com/google-asks-all-north-american-employees-to-work-from-home-2fff5a0d-cb7f-
4c98-8256-43737f6a68ea.html; Other companies that implemented work from home policies included
Apple, Facebook, Salesforce and Microsoft (whose LinkedIn subsidiary is headquartered in San Francisco).
Thomas, Owen. “Salesforce marks its 21st anniversary with a coronavirus work-from-home order.” San
Francisco Chronicle. March 7, 2020. https://www.sfchronicle.com/business/article/Salesforce-marks-its-21st-
anniversary-with-a-15114231.php#; Fottrell, Quentin. “Facebook, Apple and Twitter ask staff to work from
home due to coronavirus — now here’s the bad news for the rest of America.” MarketWatch. March 8, 2020.
https://www.marketwatch.com/story/facebook-apple-google-and-twitter-ask-staff-to-work-remotely-due-to-
coronavirus-heres-the-bad-news-for-the-rest-of-america-2020-03-08
51
Khanna, Ro. “Why Silicon Valley got coronavirus response right.” San Francisco Chronicle. April 13, 2020.
https://www.sfchronicle.com/opinion/openforum/article/Why-Silicon-Valley-got-coronavirus-response-right-
15195118.php
52
Krieger, Lisa, and Nico Savidge. “Coronavirus: Nation’s first cluster and death reported in Seattle area; Santa
Clara County also adds new case.” The Mercury News. February 29, 2020.
https://www.mercurynews.com/2020/02/29/coronavirus-nations-first-cluster-of-illnesses-reported-in-
seattle-area/
Julian Morris and Marc JoffeCOVID-19: LESSONS FROM THE PAST AND OTHER JURISDICTIONS 28
impending disaster on the scale of Italy’s.53 Two days later, the Bay Area counties issued the
nation’s first shelter-in-place order and by the end of the week, all of California was
operating under a statewide order issued by Governor Gavin Newsom.54 As a result of these
and additional measures, California had flattened the curve by early April.55
By contrast, New York’s response was lackadaisical and uncoordinated for many weeks. On
March 17th, Governor Andrew Cuomo rebuked New York City Mayor Bill DeBlasio’s warnings
of an imminent citywide shelter-in-place order stating: “We hear ‘New York City is going to
quarantine itself.’ That is not true. That cannot happen. It cannot happen legally. No city in
the state can quarantine itself without state approval. And I have no interest whatsoever
and no plan whatsoever to quarantine any city.”56
DeBlasio nonetheless began closing dine-in restaurants, movie theaters and gyms, but
undermined his public health messaging by squeezing in a last-minute workout at the
YMCA.57 Cuomo reversed himself on March 20th after seeing a spike in cases the previous
day. By then, there were 5,151 confirmed cases in New York City and an additional 1,951
cases elsewhere around the state. Cuomo imposed a set of restrictions similar to those
implemented in California effective March 22nd.58 But by then the virus had clearly spread
widely, with devastating consequences for the entire tri-state area.
53
Ravani, Sarah. “Bay Area coronavirus decision: Behind the scenes of nation’s first shelter-in-place order.” San
Francisco Chronicle. March 21, 2020. https://www.sfchronicle.com/bayarea/article/Bay-Area-coronavirus-
decision-Behind-the-scenes-15148425.php
54
Ibid.
55
California COVID-19 Public Dashboard. https://public.tableau.com/views/COVID-19PublicDashboard/Covid-
19Public?%3Aembed=y&%3Adisplay_count=no&%3AshowVizHome=no, and Institute for Health Metrics and
Evaluation. https://covid19.healthdata.org/united-states-of-america/california
56
Duster, Chandelis and Paul LeBlanc. “New York governor dismisses possibility of shelter in place order after
mayor urged New Yorkers to prepare for it.” CNN. March 17, 2020.
https://www.cnn.com/2020/03/17/politics/bill-de-blasio-andrew-cuomo-new-york-shelter-in-place-
coronavirus-cnntv/index.html
57
Sheets, Megan. “New York City is considering a ‘shelter in place’' order and Bill de Blasio says economic
fallout could be on par with the Great Depression with the city poised to lose $3.2BILLION in tax revenue in
the next six months.” Daily Mail. 17 March 2020. https://www.dailymail.co.uk/news/article-8121307/New-
York-City-Mayor-Bill-Blasio-considering-shelter-place-order.html
58
Feuer, William and Noah Higgins-Dunn. “Cuomo orders most New Yorkers to stay inside — ‘we’re all under
quarantine now’.” CNBC. March 20 2020. https://www.cnbc.com/2020/03/20/new-york-gov-cuomo-orders-
100percent-of-non-essential-businesses-to-work-from-home.html
Morris and Joffe | Covid-19 Lessons from the Past and Other JurisdictionsCOVID-19: LESSONS FROM THE PAST AND OTHER JURISDICTIONS 29
Unfortunately, the Bay Area’s Covid-19 response has not weathered well. Despite low
hospitalizations and deaths, the six counties have extended strict shelter-in-place orders
into June, damaging area restaurants and other small businesses, many of which are closing
permanently.59 As of this writing, most Bay Area counties had substantially tighter
restrictions than those imposed by California state government, which, in turn, are much
tighter than those previously imposed by Texas and Florida—which even now have similar
Covid-19 death rates.
59
EaterSF: A running list of notable Bay Area bars and restaurants that have announced permanent closures.
https://sf.eater.com/2020/5/4/21246691/restaurants-bars-closed-san-francisco-bay-area
Julian Morris and Marc JoffeYou can also read