Measurement report: Hydrolyzed amino acids in fine and coarse atmospheric aerosol in Nanchang, China: concentrations, compositions, sources and ...
←
→
Page content transcription
If your browser does not render page correctly, please read the page content below
Atmos. Chem. Phys., 21, 2585–2600, 2021
https://doi.org/10.5194/acp-21-2585-2021
© Author(s) 2021. This work is distributed under
the Creative Commons Attribution 4.0 License.

Measurement report: Hydrolyzed amino acids in fine and coarse
atmospheric aerosol in Nanchang, China: concentrations,
compositions, sources and possible bacterial degradation state
Ren-Guo Zhu1 , Hua-Yun Xiao2 , Li Luo1 , Hongwei Xiao1 , Zequn Wen3 , Yuwen Zhu1,4 , Xiaozheng Fang1 ,
Yuanyuan Pan1 , and Zhenping Chen1
1 JiangxiProvince Key Laboratory of the Causes and Control of Atmospheric Pollution, East China University of Technology,
Nanchang 330013, China
2 School of Environmental Science and Engineering, Shanghai Jiao Tong University, Shanghai 200240, China
3 Department of Earth Sciences, Faculty of Land Resource Engineering, Kunming University of Science and Technology,

Kunming 650021, China
4 School of Earth Sciences, East China University of Technology, Nanchang 330013, China

Correspondence: Hua-Yun Xiao (xiaohuayun@ecut.edu.cn)

Received: 1 June 2020 – Discussion started: 23 July 2020
Revised: 30 October 2020 – Accepted: 4 January 2021 – Published: 22 February 2021

Abstract. Amino acids (AAs) are relevant for nitrogen cy-         spheric HAAs for fine and coarse particles might be similar.
cles, climate change and public health. Their size distribu-      Meanwhile, compared to fine particles, significantly lower
tion may help to uncover the source, transformation and fate      DI values (p < 0.05),                15
                                                                                     P “scattered” δ N distribution in trophic
of protein in the atmosphere. This paper explores the use         AA and higher          V values (p < 0.05) were observed in
of compound-specific δ 15 N patterns of hydrolyzed amino          coarse particles. But the difference in δ 15 N values of source
acid (HAA), δ 15 N values of total hydrolyzed amino acid          AA (glycine, serine, phenylalanine and lysine) and THAA
(δ 15 NTHAA ), degradation
                P          index (DI) and the variance within     between coarse particles and fine particles was relatively
trophic AAs ( V ) as markers to examine the sources and           small. It is likely that AAs in coarse particles have advanced
processing history of different sizes of particle in the atmo-    bacterial degradation states compared to fine particles. Be-
sphere. Two weeks of daily aerosol samples from five sam-         sides
                                                                     P that, the significant increase in DI values and a decrease
pling sites in the Nanchang area (Jiangxi Province, China)        in V values for coarse particles were observed on days on
and samples of main emission sources of AAs in aerosols           which precipitation fell (p < 0.05). This implies that “fresh”
(biomass burning, soil and plants) were collected (Zhu et         AAs in coarse particles were likely released following the
al., 2020). Here, we measured the concentrations and δ 15 N       precipitation.
values of each HAA in two size-segregated aerosol particles
(> 2.5 µm and PM2.5 ). Our results showed that the average
concentrations of THAA in fine particles was nearly 6 times
higher than that in coarse particles (p < 0.01) and compo-        1   Introduction
sition profiles of fine and coarse particles were quite differ-
ent from each other. The δ 15 N values of hydrolyzed glycine      Recently, an increasing number of researchers highlight the
and THAA in both fine and coarse particles were typically         importance of amino acids (AAs) in the atmosphere because
in the range of those from biomass burning, soil and plant        AA is considered to be one of the most important organic ni-
sources. Moreover, the average difference in the δ 15 NTHAA       trogen compounds in atmosphere (Zhang et al., 2002; Matos
value between fine and coarse particles was smaller than          et al., 2016). Moreover, AAs are bioavailable and can be di-
1.5 ‰. These results suggested that the sources of atmo-          rectly utilized by plant and soil communities (Wedyan and
                                                                  Preston, 2008; Song et al., 2017). Its key role in atmosphere–

Published by Copernicus Publications on behalf of the European Geosciences Union.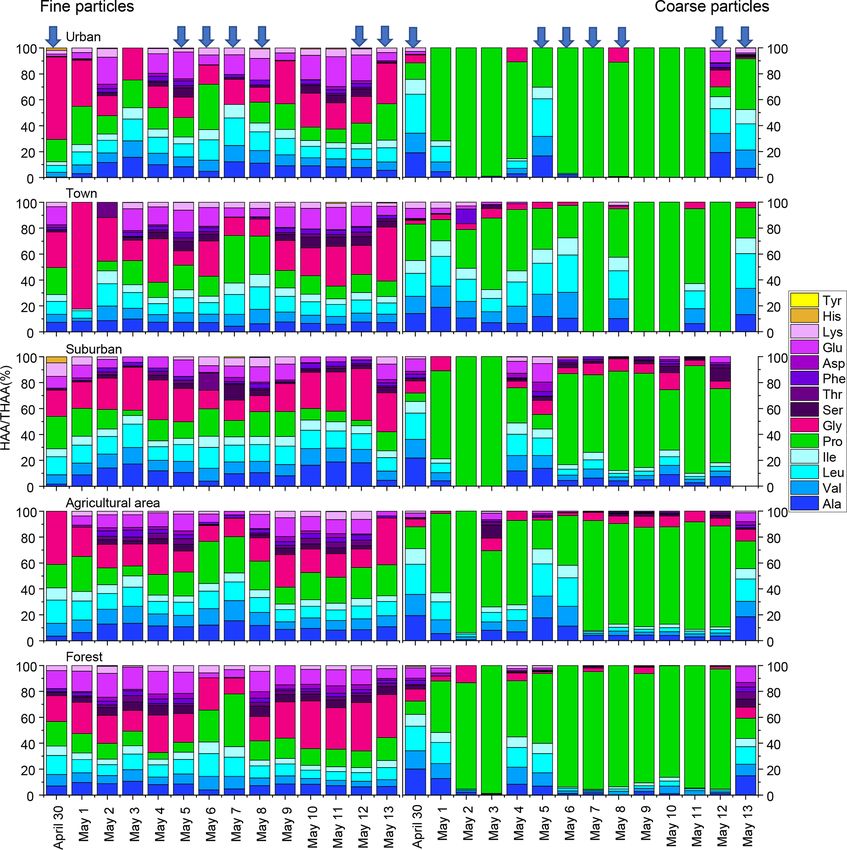
2586                        R.-G. Zhu et al.: Hydrolyzed amino acids in fine and coarse atmospheric aerosol in Nanchang

biosphere nutrient cycling and the global nitrogen cycle has        rials (OMs) in terrestrial, aquatic and marine environments
aroused great concern (Samy et al., 2013; Zhang and Anas-           (Dauwe and Middelburg, 1998; Wang et al., 2018; Dauwe
tasio, 2003). Besides that, AAs and proteins are important          et al., 1999). This value is based on the molar percentage
constituents of allergenic bioaerosol (Miguel et al., 1999;         (Mol %) of the amino acid pool, and higher DI values denote
Huffman et al., 2013). The distribution of AAs and proteins         a more “fresh” state of protein matter. However, DI values
in different particle sizes will determine whether these com-       of AAs in aerosol particles and whether bacterial degrada-
pounds can reach the pulmonary alveoli and the allergenic-          tion plays a role in the levels and compositions of AAs in
ity of aerosols (Di Filippo et al., 2014). And the distribution     different particle sizes are still unknown.
of AAs associated with different particle sizes can help to            A consensus has recently been reached on whether selec-
trace the sources and transformation of atmospheric aerosols        tive use of the 15 N depleted or enriched trophic AAs dur-
(Barbaro et al., 2019; Feltracco et al., 2019; Di Filippo et al.,   ing bacterial heterotrophy processes can lead to large nitro-
2014).                                                              gen isotopic fractionation in trophic AAs (McCarthy et al.,
    The sources of atmospheric proteinaceous matter are very        2004). Thus, substantial δ 15 N pattern shiftsPof trophic AAs
complex. Primary biological aerosol particles (e.g, plants,         can index bacterial heterotrophy processes. V , defined as
soil, pollen, bacteria, fungi, spores and debris of living          the average deviation in the δ 15 N values of the trophic AA,
things), biomass burning, and agricultural activities are gen-      has therefore been established to track the degree of bacterial
erally suggested to be the main contributing sources of at-         degradation of AAs in marine and terrestrial environments
mospheric AAs (Matos et al., 2016; Mace et al., 2003). It is        (McCarthy et al., 2007; Philben et al., 2018; Yamaguchi et
still unclear whether the fine and coarse particles of AAs are      al., 2017).
influenced by different sources.                                       In the present work, we sought to improve our under-
    Compound-specific nitrogen isotope analysis of individual       standing of AAs distributed in different particle sizes. We
amino acids provides an opportunity to offer the key informa-       measured the concentrations and δ 15 N values of each hy-
tion on widely varied photochemical processes and origins           drolyzed amino acid in two size-segregated aerosol particles
of proteinaceous matter in the atmosphere. Nitrogen source          (> 2.5 µm and PM2.5 ) in aerosols collected in the Nanchang
information and any possible nitrogen isotopic fractionation        area (southeastern China). Furthermore, δ 15 N values of Gly
caused by transformation processes could be held by the             and THAA in fine and coarse particles were compared with
δ 15 N-AA pattern (McCarthy et al., 2007; Bol et al., 2002).        those in the main emission sources (biomass burning, soil
At the same time, the δ 15 N value of total hydrolysable AA         and plant sources) to identify the potential
                                                                                                              P sources of fine
(δ 15 NAvg-THAA ), calculated as the average molar-weighted         and coarse particles. In addition, the DI, V value and δ 15 N
δ 15 N value of individual AA, has been used as a proxy for         value patterns of hydrolyzed AA in fine and coarse particles
total protein δ 15 N value (McCarthy et al., 2013). However,        were analysed to explore the possible bacterial degradation
to our knowledge, no study has used the δ 15 N-AA pattern           of HAAs in fine and coarse particles.
and δ 15 NAvg-THAA values to identify the sources of AAs dis-
tributed in different particle sizes.
    It is generally accepted that AAs in aerosols are mainly        2     Experimental section
controlled by abiotic photochemical ageing processes. On
the contrary, the biological degradation of AAs in aerosols         2.1    Sample collection
are neglected. This can be attributed to two factors. First, the
sources and transformation pathways of protein matter and           Aerosol samples were collected at the five locations includ-
AAs in aerosols are highly complex (Wang et al., 2019; Zhu          ing urban, town, suburban, agricultural area and forest loca-
et al., 2020). Second, the residence time of protein matter         tions in the Nanchang area (southern China) from 30 April
in aerosols is relatively short (Papastefanou, 2006). Admit-        to 13 May 2019, using a high-volume air sampler (KC-1000,
tedly, bacteria and fungi are ubiquitous and can be observed        Qingdao Laoshan Electronic Instrument company, China) at
in all PM samples where people look for them, and this has          a flow rate of 1.05 ± 0.03 m3 min−1 . The characteristics of
been done routinely for many decades (Bauer et al., 2002;           the five sampling area are defined in Table S1. The sam-
Bowers et al., 2013; Huffman et al., 2013; Wei et al., 2016;        pler allows particles of different aerodynamic diameters to
Wei et al., 2019). In situ bacterial degradation processes oc-      be separated in two stages: with diameter (D) above 2.5 µm
curred in the aerosols, and the cloud water was also observed       (coarse particles) and D ≤ 2.5 µm (fine particles). Quartz fi-
(Amato et al., 2007; Husárová et al., 2011). Unfortunately,         bre filters were used, and filters were heated at 450◦ for 10 h
bacterial degradation of atmospheric AAs is limited. For ex-        to remove any organics before sampling. Aerosol sampling
ample, see two studies on marine aerosols by Wedyan and             was conducted at the rooftop of the building in each site,
Preston (2008) and Kuznetsova et al. (2005) and one study           about 10 m above the ground except for the agricultural area
on precipitation by Yan et al. (2015). The degradation index        where the sampler was placed in a clear spot about 1000 m
(DI) proposed by Dauwe and Middelburg (1998) has been               away from the runway. The sampling time for each sample
widely used to assess the degradation state of organic mate-        was from 17:00 to 16:30 LT (local time) of the next day.

Atmos. Chem. Phys., 21, 2585–2600, 2021                                              https://doi.org/10.5194/acp-21-2585-2021
R.-G. Zhu et al.: Hydrolyzed amino acids in fine and coarse atmospheric aerosol in Nanchang                                 2587

More details on the sample collection are provided in Zhu            The concentrations of HAAs were analysed using a gas
et al. (2020).                                                    chromatograph–mass spectrometer (GC-MS). The GC-MS
   Forest soil samples were collected at the top 10 cm of         instrument was composed of a Thermo Scientific TRACE
the evergreen broad-leaved forest soil in the Nanchang area       GC (Thermo Scientific, Bremen, Germany) connected into
(28.8◦ N, 115.8◦ E). Paddy soil samples were collected from       a Thermo Scientific ISQ QD single quadrupole MS. The sin-
the topmost 10 cm layer of rice cultivation soil (28.2◦ N.        gle quadrupole MS was operated in electron impact ioniza-
115.1◦ E). Road soil was collected from highway topsoil           tion (70 eV electron energy) and full scan mode. The tem-
(28.7◦ N, 115.8◦ E). For each type of soil sample, triplicate     peratures of the transfer line and ion source were 250 and
representative soil samples (approximately 100 g) were col-       200 ◦ C, respectively. More details on quality assurance and
lected.                                                           control (recoveries, linearity, detection limits, quantitation
   Masson pine (Pinus massoniana (Lamb.)) and camphor             limits and corresponding effective limits in the aerosol sam-
(Cinnamomum camphora), common vegetation in the study             ples of AAs) are provided in Zhu et al. (2020). δ 15 N values of
area (28.8◦ N, 115.8◦ E), were collected during May 2019.         AA-tBDMS derivatives were analysed using a Thermo Trace
Approximately 4–6 g of pine needles or camphor leaves were        GC (Thermo Scientific, Bremen, Germany) and a conflo IV
collected from the outer branches in the east, south, north and   interface (Thermo Scientific, Bremen, Germany) interfaced
west directions (about 10 m above the ground). We collected       with a Thermo Delta V IRMS (Thermo Scientific, Bremen,
five to six representative samples for each kind of leaf. All     Germany). The analytical precision (SD, n = 3) of δ 15 N was
fresh samples were placed in plastic bags, labelled and stored    better than ±1.4 ‰. Moreover, α-aminobutyric acid (AABA)
in a chilled box immediately. In the laboratory, all plant and    with known δ 15 N value (−8.17 ‰ ± 0.03 ‰) was added in
soil samples were freeze-dried. Then, freeze-dried samples        each sample to check the accuracy of the isotope measure-
were stored at −80 ◦ C until further use.                         ments. The analytical run was accepted when the differences
   Aerosols from straw burning were sampled by pumping            of δ 15 N values of AABA between GC-IRMS and EA-IRMS
into a high-volume air sampler (KC-1000, Qingdao Laoshan          values were at most ±1.5 ‰. Each reported value is a mean
Electronic Instrument Company, China) from the funnel on          of at least three δ 15 N determinations. For more details of the
the combustion furnace during July 2017. The combustion           analyses of HAA δ 15 N values refer to our previous publica-
furnace is a domestic furnace widely used by local residents.     tion (Zhu et al., 2018).
                                                                     The concentrations and δ 15 N value of Cys, Trp, Asn and
2.2   Analyses of the concentration and δ 15 N value of           Gln in HAAs could not be determined using this method be-
      individual hydrolyzed amino acid (HAA)                      cause, under strongly acidic conditions, Cys and Trp are de-
                                                                  stroyed, and Asn and Gln are converted to Asp and Glu, re-
For hydrolyzed AA analysis, samples were prepared using a         spectively. The concentration and δ 15 N value of hydrolysable
modified version of Wang et al. (2019) and Ren et al. (2018).     Asp represents the sum of Asp and Asn; the concentration
In total, 1/16 of each fine-aerosol filter (∼ 80 m3 of air) or    and δ 15 N value of hydrolysable Glu represents the sum of
2/7 of each coarse-aerosol filter (∼ 366 m3 of air) was bro-      Glu and Gln.
ken into small pieces and placed in a glass hydrolysis tube.
Prior to the hydrolysis, 25 µL of ascorbic acid at a concentra-   2.3   DI index
tion of 20 µg µL−1 (500 µg absolute) was added to each fil-
ter sample. Then, 10 mL and 6 M of hydrochloric acid (HCl)        The degradation process could significantly modify the mole
was used to convert all of the combined AAs to free AAs. To       composition of protein amino acids (Dauwe et al., 1999). Ac-
avoid oxidation of AAs, the hydrolysis tube was flushed with      cordingly, a quantitative DI has been developed based on the
nitrogen and tightly sealed before hydrolysis. The mixture        mole composition of a hydrolyzed amino acid pool. The DI
was later placed in an oven at 110 ◦ C for 24 h.                  was calculated using the formula Eq. (1) originally proposed
   For plant and soil samples, approximately 30–40 mg of          by Dauwe et al. (1999):
plant or 500–600 mg of soil was ground separately in liquid
                                                                       X  Vari − Avg
nitrogen into fine powders using a mortar and pestle. Then,       DI =                    i
                                                                                             × PC1i ,                      (1)
well ground and homogenized soil and plant power were hy-                  i      SDi
drolyzed in the same way as the aerosol samples.
                                                                  where DI is the degradation index; Var is the Mol % of each
   After cooling to room temperature, the hydrolyzed solu-
                                                                  individual HAA; Avgi and SDi are the average Mol % and
tion was dried with a stream of nitrogen and HCl was re-
                                                                  standard deviation of each HAA in our data set, respectively;
moved. The dried solution was then redissolved in 0.1 M HCl
                                                                  and PC1 is the loading of the amino acid i obtained from
and purified by a cation exchange column (Dowex 50 W X
                                                                  principal-component analysis (Table S2).
8H+ , 200–400 mesh; Sigma-Aldrich, St Louis, MO, USA).
Later, tert-butyldimethylsilyl (tBDMS) derivatives of HAAs
were prepared following the method described by our previ-
ous study (Zhu et al., 2018).

https://doi.org/10.5194/acp-21-2585-2021                                           Atmos. Chem. Phys., 21, 2585–2600, 2021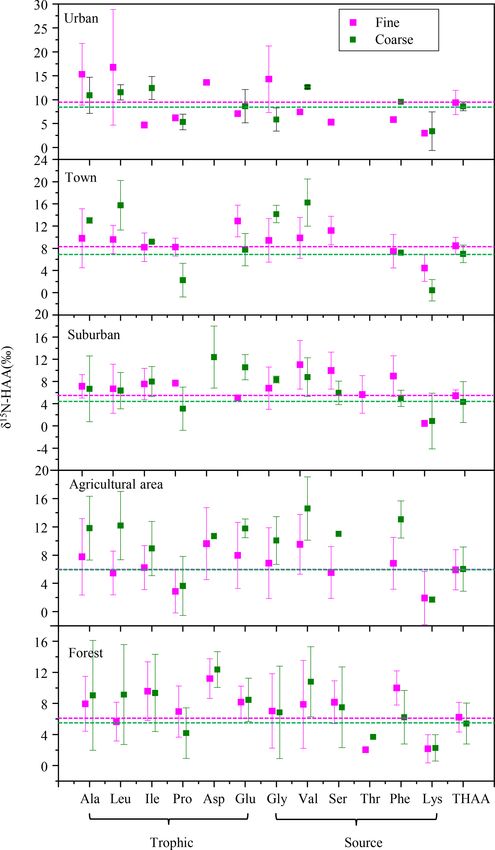
2588                        R.-G. Zhu et al.: Hydrolyzed amino acids in fine and coarse atmospheric aerosol in Nanchang

2.4    δ 15 N values                                               interaction. Tukey’s honestly significant difference (Tukey-
                                                                   HSD) test was used to evaluate which combinations of lo-
The natural abundance of 15 N was calculated as δ 15 N values      cation and aerosol size were significantly different. Two-way
in per mille (‰), using atmospheric N2 as the international        ANOVA was also conducted for DI values, examining the ef-
standard:                                                          fect of aerosol sizes, coefficients (obtained by using the first-
                                                                 principal-component score or previous reported coefficients)
                       Rsample
 15
δ N (‰ vs. air) =                    × 1000,              (2)      and their interaction. The differences in δ 15 NGly values for
                     Rstandard − 1                                 fine particles between the five sampling locations were ex-
where R is the ratio of mass 29 to mass 28.                        amined using the one-way ANOVA procedure and compared
   A derivatized mixture of 20 amino acid standards (Ala,          using the Tukey-HSD test.
Gaba, Arg, Asn, Asp, Gln, Glu, Gly, His, Ile, Leu, Lys, Met,          The exponential regression was analysed to evaluate
Phe, Pro, Ser, Thr, Trp, Tyr and Val) and several interna-         changes in the DI index as a function of the concentration
tional amino acid standards (Ala, Gly3, Gly4, Phe, USGS40,         of THAA.
USGS41a and Val) with known δ 15 N values (−26.35 ‰ to                To testPfor changes in the concentration of THAA, DI in-
+47.55 ‰) was prepared to assess the isotope measurement           dex and      V values following the rain events, a two-way
reproducibility and normalize the δ 15 N values of the amino       ANOVA was performed, testing for effects of precipitation,
acids in the samples (Zhu et al., 2018).                           aerosol sizes and their interactions. Tukey-HSD test was
                                                                   conducted to compare the significant difference. Changes
2.5
      P
          V parameter                                              in mole percentage of each HAA’s concentrations follow-
                                                                   ing precipitation were tested for significance by using an
                                                                   ANOVA procedure followed by a Tukey-HSD test to com-
     P
The V parameter is defined as the average absolute devia-
tion in the δ 15 N values of the trophic AA (including Ala, Asp,   pare significant differences. For all tests, statistically signifi-
Glu, Ile, Leu and Pro) (McCarthy et al., 2007). This param-        cant differences were considered at p < 0.05.
eter has been used as a proxy for the degree of heterotrophic
resynthesis and calculated by Eq. (3):
X           1 X                                                    3     Results and discussion
      V =     × Abs(χAA),                                   (3)
            n
                                                                   3.1    Concentrations and mole-percentage composition
where χAA is defined as the deviation of the δ 15 N of each               profile of HAA in size-segregated aerosol
trophic amino acid from the δ 15 N of the mean of trophic
amino acids (δ 15 N AA − average δ 15 N of Ala, Asp, Glu, Ile,     A total of 14 hydrolyzed amino acids (Ala, Val, Leu,
Leu and Pro), and n is the total number of trophic amino           Ile, Pro, Gly, Ser, Thr, Phe, Asp, Glu, Lys, His and Tyr)
acids used in the calculation.                                     were found in fine and coarse aerosol samples collected
                                                                   in Nanchang areas during spring 2019 (Fig. 1). The aver-
2.6    δ 15 NTHAA values                                           age concentrations of THAA in fine and coarse particles
                                                                   were 2542 ± 1820 pmol m−3 and 434 ± 722 pmol m−3 , re-
The δ 15 N values of total hydrolysable amino acids
                                                                   spectively. The mean concentration of THAA for fine par-
(δ 15 NTHAA ) are calculated as the mole percent weighted
                                                                   ticles was nearly 6 times higher than that for coarse particles
sum of the δ 15 N values of each individual HAA, following
                                                                   (p < 0.01) (Fig. S1).
Eq. (4):
                                                                      For fine particles, the average concentrations of THAA
                                                                   in the five sampling sites were significantly differ-
              X
δ 15 NTHAA =     (δ 15 NHAA · Mol %HAA),               (4)
                                                                   ent (p < 0.05), with the highest mean concentration of
where Mol %HAA is the mole contribution of each HAA,               THAA in agricultural areas (3455 ± 2203 pmol m−3 ), fol-
and δ 15 NTHAA is the δ 15 N value of individual HAA.              lowed by those in urban (2941 ± 2443 pmol m−3 ), forest
                                                                   (2730 ± 1435 pmol m−3 ) and town (2314 ± 1211 pmol m−3 )
2.7    Statistics                                                  areas. The lowest THAA concentration occurred at a subur-
                                                                   ban site (1633 ± 1087 pmol m−3 ) (Fig. S1).
All statistical analyses were performed using SPSS 16.0               However, for coarse particles, the differences in THAA
(SPSS Science, USA). Graphs were generated using Orig-             concentrations between the five sampling sites were not sig-
inPro 2018 (OriginLab Corporation, USA) and Sigmaplot              nificant (p > 0.05) (Fig. S1). The mean concentration of
12.5 software (SPSS Science, USA). We performed a two-             THAA in agricultural, urban, forest, town and suburban lo-
way analysis of variance (ANOVA) for the concentration             cations was 540 ± 821, 230 ± 300, 654 ± 1152, 437 ± 583
of THAA, the DI index, δ 15 NTHAA values and                       and 291 ± 426 pmol m−3 , respectively. The highest concen-
                                                   P
                                                     V val-
ues, testing the effect of aerosol sizes, location and their       tration of atmospheric AAs in the agricultural area would be

Atmos. Chem. Phys., 21, 2585–2600, 2021                                              https://doi.org/10.5194/acp-21-2585-2021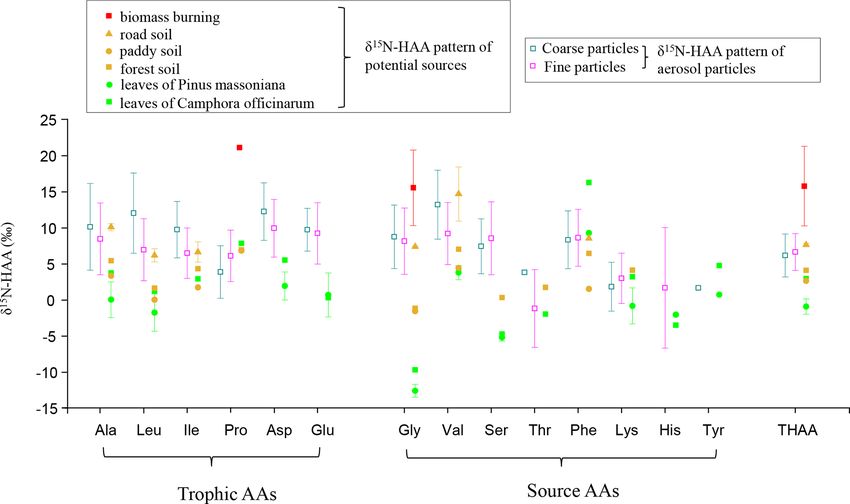
R.-G. Zhu et al.: Hydrolyzed amino acids in fine and coarse atmospheric aerosol in Nanchang                                              2589

Figure 1. Concentrations of hydrolyzed amino acids for fine and coarse particles in urban, town, suburban, agricultural and forest sites during
14 consecutive sampling days. The concentrations of HAAs for each sample were normalized for the total volume of air sampled. The blue
arrow and shallow represent precipitation.

ascribed to the enhanced agricultural activities and natural              3.2   Similar contribution sources of fine and coarse
source emission (e.g. pollen grain) in spring (Xu et al., 2019).                particles
   The composition profiles of HAA in fine and coarse par-
ticles during the whole campaign are shown in Fig. 2. The                 The detailed size-resolved investigation for the sources of at-
composition profiles of HAA in fine particles are quite differ-           mospheric AAs is limited. Di Filippo et al. (2014) obtained
ent from those in coarse particles (Fig. 2). For fine particles,          very variable results for the size-segregated concentrations
Gly, Pro, Leu and Glu were the four most abundant com-                    of atmospheric combined amino acids in the city of Rome.
pounds, accounting for an average of 25 ± 12 %, 17 ± 8 %,                 In the warm season, the highest concentration of CAAs was
12 ± 3 % and 11 ± 6 %, respectively, of the THAA pool.                    distributed in the fine fraction, whereas, in the colder season,
   For coarse particles, Pro was the most abundant THAA                   the increased distribution of CAAs in the coarse fractions
species, with an average contribution of 63 ± 31% to the                  was observed. Feltracco et al. (2019) demonstrated that free
THAA pool. Leu, Ala and Val were the next most abundant                   and combined amino acids in Arctic aerosols were mainly
species, each accounting for 7 %–9 % of the THAA pool,                    distributed in the fine fraction, which could be affected by
while other individual HAAs were only minor components                    several sources, including biological primary production and
in coarse particles (Fig. 2). The HAA distribution among the              biomass burning. These results could not provide conclusive
different sampling locations for both fine and coarse particles           evidence to define the origin of atmospheric AAs in the dif-
appeared similar (Fig. 2).                                                ferent particle sizes.

https://doi.org/10.5194/acp-21-2585-2021                                                    Atmos. Chem. Phys., 21, 2585–2600, 2021
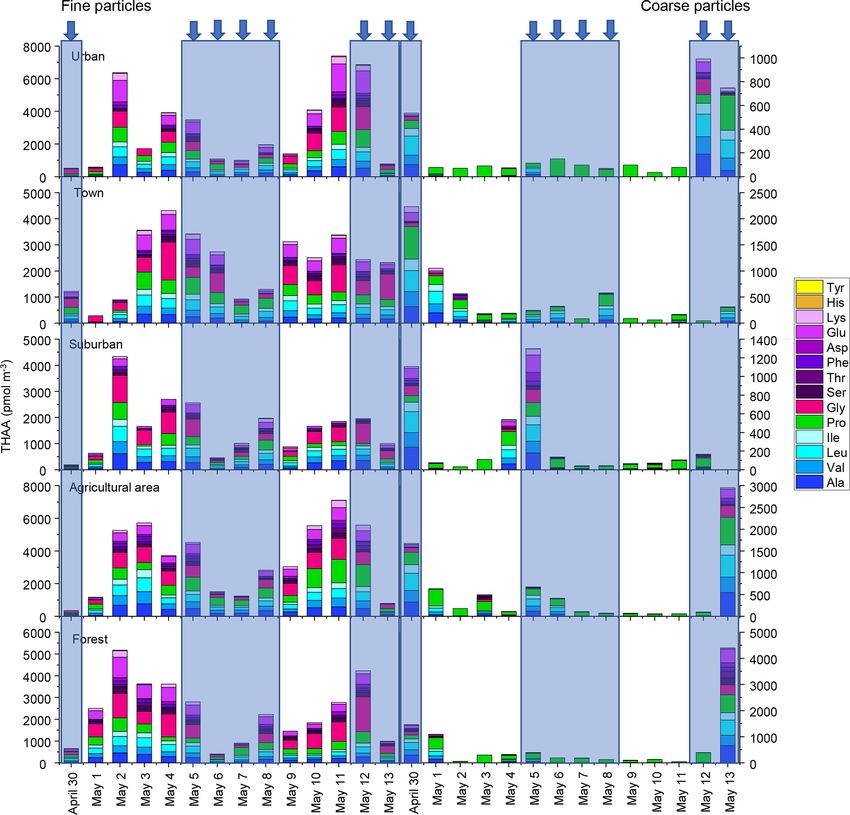
2590                         R.-G. Zhu et al.: Hydrolyzed amino acids in fine and coarse atmospheric aerosol in Nanchang

Figure 2. Percentage composition of each hydrolyzed amino acid (% of THAA) for fine and coarse aerosol particles in urban, town, suburban,
agricultural and forest sites during 14 consecutive sampling days. The blue arrow represent precipitation.

   With the development of stable N isotope technology,                   In this study, the δ 15 N values of hydrolyzed Gly in fine and
δ 15 N values and δ 15 N patterns have become effective tools          coarse particles exhibited wide ranges: −1.0 ‰ to +20.3 ‰
to trace the sources of nitrogen compounds. Our previous               and −0.8 ‰ to +15.7 ‰, which fall within the ranges of
study found that the δ 15 N value of Gly in PM2.5 can be               biomass burning, soil and plants sources (Fig. 3). The δ 15 N
used to trace the potential emission sources for aerosol AAs           of protein AA (δ 15 NTHAA ) has been also used as a proxy
because the N isotope fractionation associated with Gly                for indicating the nutrient N in marine sediments (Batista
transformation in aerosols is relatively small (Zhu et al.,            et al., 2014). To test δ 15 NTHAA values of aerosol particles
2020). To trace the sources of fine and coarse particles, we           could also be used to trace the sources of aerosol particles,
measured the nitrogen isotopic compositions of hydrolyzed              δ 15 NTHAA values were compared with the δ 15 NGly values.
Gly and THAA sampled from the main emission sources                    Since the concentration of hydrolyzed Gly is very low in
in the study areas, including biomass burning, soil and lo-            coarse particles, a few of the δ 15 NGly values could be mea-
cal plants (Fig. 3). The average δ 15 N value for hydrolyzed           sured in coarse aerosol samples. Thus, only the δ 15 NTHAA
Gly from the biomass burning, soil and plant sources was               values of fine particles were compared with the δ 15 NGly val-
+15.6 ± 4.3 ‰, +3.0 ± 4.4 ‰ and −11.9 ± 1.4 ‰, respec-                 ues of fine particles in the same sampling sites.
tively, and the mean δ 15 NTHAA value was +15.8 ± 4.5 ‰,                  A remarkably consistent spatially related trend was ob-
+5.5 ± 2.2 ‰ and −0.0 ± 1.8 ‰, respectively.                           served in δ 15 NTHAA values and the δ 15 N values of hy-

Atmos. Chem. Phys., 21, 2585–2600, 2021                                                   https://doi.org/10.5194/acp-21-2585-2021
R.-G. Zhu et al.: Hydrolyzed amino acids in fine and coarse atmospheric aerosol in Nanchang                                      2591

Figure 3. Comparison of δ 15 N-HAA patterns of fine and coarse aerosol particles with those of potential local sources.

drolyzed Gly (Fig. 4b and c). Both the δ 15 NGly and the                 back trajectory during sampling periods (Fig. S2), we can
δ 15 NTHAA values of fine particles in the urban and town loca-          observe that the aerosol collected flowed principally from
tions were shown to be more positive than those in suburban,             the mainland, and air mass from marine sources only ac-
agricultural area and forest locations (p < 0.05). Further-              counted for 16 %. Moreover, during the long-range transport,
more, the mean δ 15 NTHAA value was not significantly dif-               PBAPs may be removed by dry and wet deposition (Després
ferent from the average δ 15 N value of hydrolyzed Gly in the            et al., 2012). Therefore, in this study, compared to land ori-
five sampling locations (p > 0.05), supporting the idea that             gins, the contribution of marine sources to aerosol AAs ob-
δ 15 NTHAA values of aerosols may also imprint the sources               served here may be relatively small. Unfortunately, we do not
of atmospheric AAs. Similarly, according to the δ 15 N in-               have δ 15 N-HAA data for marine aerosols. Pooling δ 15 NGly
ventories of THAA in potential emission sources of atmo-                 values from literature data, we found that the δ 15 NGly val-
spheric protein AA, both fine (+0.7 ‰ to +13.3 ‰) and                    ues in ocean high-molecular-weight dissolved organic matter
coarse particles (−2.3 ‰ to +10.0 ‰) also had δ 15 NTHAA                 (DOM), cyanobacteria and plankton ranged from −16.6 ‰
values typically in the range of these three main emission               to +7.7 ‰ (McCarthy et al., 2007; Mcclelland and Mon-
sources (Fig. 3). Therefore, it is likely that the main sources          toya, 2002; Chikaraishi et al., 2009; Calleja et al., 2013),
of atmospheric AAs for both fine and coarse particles were               which was close to the range of the natural sources including
mainly biomass burning, soil and plants.                                 plant (range: −13.2 ‰ to −9.7 ‰) and soil (range: −1.6 ‰
   However, there is no significant difference in the                    to +7.4 ‰) sources. Conclusively, the contribution from soil
δ 15 NTHAA value between fine and coarse particles in each               and plant sources mentioned in this study may include a very
sampling site (p > 0.05) (Fig. 4c), and the average offset of            small amount of marine contribution.
δ 15 NTHAA value between fine and coarse particles was lower
than 1.5 ± 1.7 ‰ at the five sampling sites (Fig. 4a).Thus, it
is suggested that the main sources of AAs in fine and coarse             3.3   Sources of HAA in aerosol at different locations
particles might be similar, all of which were influenced by
biomass burning, soil and plant sources.
                                                                         The δ 15 NGly values of fine particles was significantly
   In addition, as one of the main components of primary
                                                                         different at the five sampling sites (p < 0.05). The av-
biological aerosol particles (PBAPs), AAs are proved to be
                                                                         erage δ 15 NGly values of fine particles in urban (av-
ejected from ocean water by bursting bubbles (Leck and
                                                                         erage = 14.3 ± 8.5 ‰) and town (average = 9.4 ± 4.2 ‰)
Bigg, 2005a, b; Bigg, 2007; Bigg and Leck, 2008). Marine
                                                                         sites were more positive than those in suburban (aver-
sources may also contribute to atmospheric AAs for both
                                                                         age = 6.7 ± 4.3 ‰), agricultural (average = 6.9 ± 5.3 ‰) and
fine and coarse particles observed here. However, the sam-
                                                                         forest sites (average=6.5 ± 5.0 ‰) (Fig. 4b). The signifi-
pling sites are located in an inland city. Considering the 2 d
                                                                         cantly higher δ 15 NGly values observed in the urban and town

https://doi.org/10.5194/acp-21-2585-2021                                                   Atmos. Chem. Phys., 21, 2585–2600, 2021
2592 R.-G. Zhu et al.: Hydrolyzed amino acids in fine and coarse atmospheric aerosol in Nanchang
3.4 Different degradation state of AAs between fine
and coarse aerosol particles
In this study, a huge difference was observed in the concen-
trations and mole-percentage compositions of THAAs be-
tween fine and coarse particles (Figs. 1 and 3). As we dis-
cussed above, the sources of AAs in fine and coarse particles
are similar; therefore this larger difference may be attributed
to protein matter in fine and coarse particles undergoing dif-
ferent degrees of oxidation, nitration and oligomerization in
the atmosphere (Liu et al., 2017; Wang et al., 2019; Song
et al., 2017; Haan et al., 2009). Another possibility is that
biologically relevant degradation of AAs may contribute to
this variation observed between fine and coarse particles. To
investigate whether AAs in fine and coarse particles may be
degraded by bacteria to different degrees, degradation marker
(DI) and bacterial
P heterotrophy indicators (δ 15 N-AA distri-
bution and V ) were used.
Proteins as major components in all source organisms are
sensitive to all stages of degradation (Cowie and Hedges,
1992). Moreover, compared to the alteration of the degra-
dation, the dissimilarity in amino acid composition of pro-
tein in the source organisms is minor (Dauwe and Middel-
burg, 1998). Therefore, the degradation index (DI) was de-
Figure 4. (a) The offset of δ 15 NTHAA values between fine and
coarse particles. (b) The δ 15 NGly values of fine particles. (c) The
veloped, which are based on protein amino acid composition
and factor coefficients based on the first axis of the PCA anal-
δ 15 NTHAA values of fine and coarse particles in urban, town, subur-
ban, agricultural and forest sites. Different uppercase letters denote
ysis (Eq. 1). Since AAs concentrated in cell walls are prefer-
means found to be statistically different (Tukey-HSD test) between entially accumulated during decomposition, whereas amino
sites. Different lower case letters denote a significant difference be- acids that are concentrated in cell plasma tend to be depleted
tween fine and coarse particles. The error bars in (a) indicate the during degradation (Dauwe et al., 1999), the compositional
standard deviation. changes of amino acids associated with degradation can be
traced by the DI value. The higher DI values indicate the
protein is relatively “fresh” (Yan et al., 2015), and changes
locations suggested an increased contribution from biomass tracked by DI are proposed to be driven in large part by en-
burning sources to Gly in fine particles at these two locations. richment of AAs concentrated in cell walls (McCarthy et al.,
A similar spatial variation trend in δ 15 NTHAA values 2007).
of fine and coarse particles among the five sampling For the calculation of DI values for fine and coarse par-
sites was found. For fine particles, the highest δ 15 NTHAA ticles, the first-principal-component score from principal-
values of fine particles were observed in urban (av- component analysis (PCA) was applied to our own data (in-
erage = 9.4 ± 2.5 ‰), town (average = 8.4 ± 1.5 ‰), cluding Ala, Gly, Val, Leu, Ile, Pro, Ser, Thr, Phe, Asp, Glu,
suburban (average = 5.4 ± 1.1 ‰), agricultural (aver- Lys, His and Tyr), following the method described by Dauwe
age = 5.9 ± 2.8 ‰) and forest (average = 5.7 ± 1.9 ‰) sites. et al. (1999). The first principal component explained 38 %
For coarse particles, the most positive δ 15 NTHAA values of the variability, and the second principal component ex-
were also recorded in urban (average = 8.6 ± 0.9 ‰), town plained 21 % (Table S2). Figure 5a shows plots of the scores
(average = 7.0 ± 1.6 ‰), suburban (average = 4.3 ± 3.4 ‰), of the first and second principal components of fine and
agricultural (average = 6.0 ± 3.1 ‰) and forest (aver- coarse particles in the five sites. Components of fine and
age = 5.4 ± 2.6 ‰) sites (Fig. 4c). The more positive coarse particles could be roughly separated. The plots of
δ 15 NTHAA values occurred in urban and town locations the fine particles tended to cluster in the upper middle and
compared to other sampling sites for both fine and coarse right areas (approximately −1.7 to +2.0 and −0.4 to 1.4 at
particles (p < 0.05), indicating that atmospheric AAs for first and second-principal-component scores, respectively).
both fine and coarse particles in urban and town sites were In contrast, the plots of the coarse particles tended to be lo-
more influenced by biomass burning. cated in the lower and left areas (approximately −1.9 to 1.4
and −2.8 to +0.5 at first- and second-principal-component
scores, respectively). Fine and coarse particles were clearly
distinguished by first-principal-component scores, suggest-
Atmos. Chem. Phys., 21, 2585–2600, 2021 https://doi.org/10.5194/acp-21-2585-2021R.-G. Zhu et al.: Hydrolyzed amino acids in fine and coarse atmospheric aerosol in Nanchang 2593
relatively high principal-component scores of fine particles
in PC1 and PC2 were more affected by the high relative
abundances of amino acids which have a high factor coef-
ficient (Group 1 and Group 2). In contrast, the relatively low
principal-component scores of coarse particles in PC1 and
PC2 were more affected by the low relative abundances of
amino acids which have a low factor coefficient (Group 1
and Group 4).
Furthermore, DI values for fine particles showed a positive
correlation with the percentage of HAA species in Group1
(e.g. Lys, Glu, Asp, Phe, Thr and Ser), but DI values for
coarse particles were positively correlated to the percent-
age of HAA species in Group 2 (e.g. Ala, Val, Leu and Ile)
(Fig. S4), indicating the difference in composition profiles of
HAA between fine and coarse particles may be affected by
the degradation process. Plots of DI as a function of THAA
concentration in both fine and coarse particles showed an ex-
ponential relationship (y = 1067.4e−1.0x ; r = 0.6, p < 0.01);
i.e. at higher values of DI, concentrations of THAA were
higher, and vice versa (Fig. S5). The coarse particles had sig-
nificantly lower THAA concentrations compared to fine par-
ticles (Fig. S1). Clearly, both composition profiles of HAA
and concentrations of THAAs in aerosols may be related to
degradation processes.
Figure 5. (a) Cross plot of the first and second component scores DI values from literature data, where possible, and DI val-
of PCA based on percentage composition (Mol %) of hydrolyzed ues for fine and coarse aerosol particles are shown in Fig. 6a
amino acid for fine and coarse particles. (b) Cross plot of factor
and Fig. 7. Fine particles had significantly higher DI val-
coefficients of the first and second principal components of PCA.
The lines enclosing each group of amino acid are arbitrarily drawn.
ues than coarse particles (p < 0.05) (Fig. 6a). The DI values
for fine and coarse particles ranged from −0.3 to 1.4 (av-
erage = 0.6 ± 0.4) and −1.8 to 1.4 (average = −0.6 ± 1.0),
respectively (Fig. 7). The DI values of fine particles were
ing that the first-principal-component score may also be de- close to those of “fresh” material, for instance, source mate-
signed as a degradation index of THAA in aerosols. rials (e.g. plankton, bacteria and sediment trap material). On
This is the first report of the DI values for aerosol particles. the contrary, the DI values of coarse particles were compa-
We compared DI values obtained by our calculating method rable to those of surface soil, particle organic matter (POM)
with those calculated by using the coefficients given in pre- in coastal sediments and DOM in coastal areas, which were
vious references (Dauwe et al., 1999; Yamashita and Tanoue, proved to be more degraded materials (Fig. 7). In marine en-
2003). There is no significant difference between the DI vironments, high DI values (> 0.5) indicate the better preser-
values calculated using the first-principal-component score vation of more fresh organic matter from marine primary pro-
and the DI values calculated using the coefficients given in duction (Jiang et al., 2014). On the contrary, low DI values
the previous reference (Dauwe et al., 1999;Yamashita and ( < 0.5) indicate the presence of relatively degraded organic
Tanoue, 2003) (p > 0.05) (Fig. S3), confirming our calcula- matter (Burdige, 2007; Wang et al., 2018). In this study, the
tion method is reliable. lower DI values are observed in coarse particles, implying
A plot of factor coefficients of each individual amino acid that AAs in coarse particles may undergo more degradation
in the first and second principal components was examined than those in fine particles. Our result is also comparable to
to clarify the reasons for variation of the scores of fine and that observed in precipitation at Uljin and Seoul (Yan et al.,
coarse particles (Fig. 5b). Based on this cross plot, 14 HAA 2015). The DI values measured in coarse particles are closer
species were divided into 4 groups. In Fig. 5b, Group 1 is to those observed in Seoul, which is believed to have more
located in the lower right portion of the plot and includes advanced degradation than Uljin, further supporting the idea
Val, Leu, Ile and Ala. Group 2, in the upper right of the that the degradation degree of amino acids in coarse particles
plot, includes Lys, Glu, Asp, Phe, Thr, Ser and Gly. Group is higher than that in fine particles.
3, in the middle, includes Tyr and His. Group 4, in the left of However, the differences in DI values were not signifi-
the plot, includes Pro. The principal-component scores of at- cant among the five sampling sites for both fine and coarse
mospheric particles were affected by the relative abundance particles (p > 0.05) (Fig. S6). For fine particles, the average
and the factor coefficient of each individual amino acid. The DI values in agricultural, urban, forest, town and suburban
https://doi.org/10.5194/acp-21-2585-2021 Atmos. Chem. Phys., 21, 2585–2600, 20212594 R.-G. Zhu et al.: Hydrolyzed amino acids in fine and coarse atmospheric aerosol in Nanchang
P
Figure 6. DI values (a) and (b) V for fine (red box) and coarse (blue box) particles. The box encloses 50 % of the data, the whisker is
standard deviation of the data, the horizontal bar is the median, the solid circles are outliers. The differences in means were statistically
significant (two-way ANOVA, p < 0.05). Different uppercase letters denote means found to be statistically different (Tukey-HSD test)
between fine and coarse particles. Different lower case letters denote means found to be statistically different (Tukey-HSD test) between
rainy and dry days.
3.5 Bacterial signature in aerosol AAs
The existence of microorganisms in aerosol particles has
been documented. However, whether bacterial degradation
processes play a role in atmospheric protein degradation is
not well understood. The negative correlation of the DI with
the concentration of free γ -aminobutyric acid (GABA) and
its mole percentage are depicted in Fig. S7. Since bacteria are
known to produce free GABA from their protein precursors
(Cowie and Hedges, 1994; Koolman and Röhm, 2005), the
concentrations and mole percentage of free GABA may tend
to increase during the biodegradation process. Therefore, the
negative relationship between the DI values and GABA in
aerosols suggested that the degradation of atmospheric pro-
Figure 7. DI values of fine and coarse particles in comparison to
other studies. a This study. b Source materials including phyto- tein is probably induced by bacteria. Dauwe et al. (1999)
plankton, bacteria, zooplankton and sediment trap material from have also reported the negative correlation of the DI with
Dauwe et al., 1999. c Yan et al. (2015). d Philben et al. (2018). the mole percentage of the GABA and β-alanine (BALA)
e particle organic matter from McCarthy et al. (2007). f Wang et in marine particulate matter samples, and they attributed the
al. (2018). g Yamashita and Tanoue (2003). h Chen et al. (2016). i Ji correlation of the DI with the variation of GABA mole per-
et al. (2019). centage to the stimulation of degradation by the activity of
microorganism.
Moreover, it is interesting to note that a substantial δ 15 N-
locations were 0.6 ± 0.4, 0.5 ± 0.5, 0.7 ± 0.3, 0.6 ± 0.3 and AA shift in the trophic-AA group was observed between
0.7 ± 0.2, respectively. For coarse particles, the mean DI val- fine and coarse particles among the five sampling sites. Ala,
ues in agricultural area, urban, forest, town and suburban lo- Leu, Ile and Asp were 15 N-enriched in coarse particles com-
cation was −0.5 ± 0.9, −1.0 ± 1.1, −0.8 ± 1.1, −0.3 ± 1.1 pared to fine particles, whereas Pro in coarse particles was
and −0.5 ± 1.1, respectively. As we discussed above, the more 15 N-depleted than that in fine particles (Fig. 8). Clearly,
sources of atmospheric HAA were different among the five there is no uni-directional 15 N depletion or enrichment of
sampling sites. This result suggested that the degradation trophic AA observed between fine and coarse particle sam-
process of amino acids in the atmosphere is less affected by ples. The δ 15 N-AA distribution in the trophic-AA group is
their emission sources. more “scattered” in coarse particles than that in fine particles
(Fig. 8). However, the difference in δ 15 N values of source
AA between coarse particles and fine particles was relatively
small except for Val. δ 15 N values of Gly, Ser, Phe and Lys
measured in coarse particles are close to those measured in
Atmos. Chem. Phys., 21, 2585–2600, 2021 https://doi.org/10.5194/acp-21-2585-2021R.-G. Zhu et al.: Hydrolyzed amino acids in fine and coarse atmospheric aerosol in Nanchang 2595
et al. (2007) hypothesized that the process of incorporat-
ing the salvage AAs into new protein should not alter origi-
nal δ 15 N values of salvaged AAs. The substantial δ 15 N-AA
shifts in only selected AA indicates the N of an assimilated
AA has been replaced through a de novo heterotrophic AA
resynthesis pathway with N isotope fractionation. Therefore,
the substantial δ 15 N-AA shifts in the trophic-AA group could
be observed when bacterial heterotrophy has occurred and
those new resynthesized proteins have become an important
part of protein material measured (McCarthy et al., 2007).
Fogel and Tuross (1999) first observed that δ 15 N-AA patterns
of degraded material was highly scattered, and the N isotope
fractionation between degraded material and fresh protein
was up to 15 ‰. Moreover, obviously changes for the δ 15 N
values of several AAs were found in high-molecular-weight
dissolved organic carbon after bacterial reworking (Calleja
et al., 2013). Similarly, the scattered characteristics of δ 15 N-
AA distribution in the trophic-AA group of coarse particles
may be due to the nitrogen fractionation occurred in micro-
bial
Pconsumers selectively using trophic AA.
V is defined as the average deviation in six trophic AAs
and has been proposed to reflect the extent of protein resyn-
thesis during microbial degradation
P processes (McCarthy et
al., 2007). Figure 9 shows the V values measured in fine
particles,
P coarse particles and local natural sources,Pas well
as V values reported in previous references. V val-
ues for the main natural sources
P collected around the sam-
pling sites were calculated. V values for local plants (nee-
dles of Pinus massoniana (Lamb.) and leaves of Camphora
officinarum) ranged fromP 1.0 ‰ to 2.1 ‰, with a mean of
1.7 ± 0.4 ‰ (Fig. 9). V values in local soil (paddy soil,
road soil and forest soil) ranged from 1.4 ‰ to 2.1 ‰, with
aPmean of 1.7 ± 0.3 ‰. Overall, coarse particles had higher
V values (average = 3.6 ± 1.5 ‰)P than those of fine parti-
cles (p < 0.05) (Fig. 9). The mean V value of fine particles
Figure 8. δ 15 N-HAA patterns of fine and coarse aerosol particles in the five sampling sites (average = 2.4 ± 1.1 ‰) was simi-
in urban, town, suburban, agricultural and forest sites. lar to or slightly higher than that of plants and soil collected
around sampling sites; phytoplankton (1.0 ‰) and zooplank-
ton (1.5 ‰) in marine sources (McCarthy et al., 2007); nee-
fine particles. Recent work on δ 15 N signatures of individ- dle (average = 1.5 ± 0.1 ‰), moss (average = 1.1 ± 0.02 ‰)
ual AA has suggested that bacterial heterotrophy often re- and soil (average = 1.4 ± 0.1 ‰) samples measured in a bal-
sults in strong fractionation in some specific AAs, which sam fir forest (Philben et al., 2018); and marine POM (av-
are tied directly to specific microbial biochemical pathways. erage = 2.3 ± 0.7 ‰)P (Batista et al., 2014; McCarthy et al.,
Among those specific AAs, both Ala and Leu are commonly 2007). In contrast, V values of coarse particles were equal
observed to show strong δ 15 N shifts with the processes of to or even higher than those of more degraded materials, such
bacterial heterotrophy (McCarthy et al., 2004). Hence, 15 N- as marine DOM reworked by bacterial heterotrophy (aver-
enriched Ala and Ile found in coarse particles compared ageP= 3.0 ± 0.5 ‰) (Batista et al., 2014).
to fine particles suggested more bacterial heterotrophy took V could reflect the increasing trend of “scattering”
place in coarse particles. δ 15 N-trophic AA patterns related to more intensive bacterial
Heterotrophic reworking of proteins encompasses a se- resynthesis (Batista et al., 2014; Calleja et al., 2013; Yam-
ries of processes, including hydrolysis, uptake and de novo aguchi
P et al., 2017). In this study, significantly higher values
synthesis, and salvages AA incorporation into new protein. of V were measured in coarse particles than Pin fine par-
Therefore, new proteins reworked by heterotrophically pro- ticles (p < 0.05) (Fig. 6). Moreover, the mean V value of
cesses represent a mixture of resynthesized AAs and AAs fine particles was similar to or slightly higher than that mea-
that have never been hydrolyzed (salvaged AAs). McCarthy sured in “fresh” materials (McCarthy et al., 2007; Philben et
https://doi.org/10.5194/acp-21-2585-2021 Atmos. Chem. Phys., 21, 2585–2600, 20212596 R.-G. Zhu et al.: Hydrolyzed amino acids in fine and coarse atmospheric aerosol in Nanchang
3.6 Release of coarse “fresh” bioparticles during the
rainfall
A close relationship between atmospheric bioaerosols and
precipitation has been found by previous studies (Huffman
et al., 2013; Yue et al., 2016). Since biological sources con-
tain a large abundance of AAs (Ren et al., 2018), HAAs in
aerosols can be used as tracer compounds to indicate the re-
lease of biological sources during precipitation. However, de-
tailed size-resolved and time-resolved observations for the
release of bioparticles initiated by precipitation are spare,
and the degradation state of different sizes of bioparticles has
never been examined.
In this study, precipitation was observed to exert differ-
ent impacts on the concentrations of the THAA in fine
and coarse particles. The average concentration of THAA
in fine particles on rainfall days (1948 ± 1546 pmol m−3 )
was significantly lower than that measured on dry days
(3137 ± 1898 pmol m−3 ) (p < 0.05), whereas the average
concentrations of THAA in coarse particles displayed no
significant changes between rainy and dry days (p > 0.05)
(Figs. 1 and S1). For coarse particles, the average concen-
trations of THAA on rainy and dry days were 660 ± 947
and 212 ± 266 pmol m−3 , respectively. It is expected that the
concentrations of individual AAs in aerosol were assumed to
decrease on days on which precipitation fell because of the
P
Figure 9. V values for fine and coarse particles in comparison to high scavenging ratio of AAs in aerosols (Gorzelska and Gal-
local natural sources and other studies. a Calleja et al. (2013). b Mc- loway, 1990). In this study, from rainy to dry days, the con-
Carthy et al. (2007). c Philben et al. (2018). d Batista et al. (2014). centrations of THAA for fine particles decreased (p < 0.05)
(Fig. S1), but the concentration of THAAs for coarse par-
ticles displayed no significant change (p > 0.05) (Fig. S1).
P Similar variation trends of different sizes of particles fol-
al., 2018; Batista et al., 2014), while V values of coarse lowing the precipitation were also observed by Huffman et
particles were equal to or even higher than those of more de- al. (2013). They also found a steep increase in coarse parti-
graded materials (Fig. 9). These corroborate that more bac- cles while low concentrations of fluorescent bioparticles and
terial heterotrophic resynthesis occurred in coarse particles total aerosol particles were found in fine particles during the
compared to fine particles. precipitation, suggesting the newly released AAs during the
Despite the uncertainties surrounding oxidation, nitration precipitation are mainly distributed in coarse particles.
and oligomerization of AAs in the atmosphere, the main It is worth noting that the influence of precipitation on the
observations remain that the difference in δ 15 N values of mole composition profile of HAA is different for the coarse
source AA (Gly, Ser, Phe and Lys) and total hydrolysable and fine particles (Fig. 2). For fine particles, only the percent-
amino acids (δ 15 NTHAA ) between coarse particles and fine age of Pro significantly increased from 14 ± 6 % on dry days
particles was relatively small (Fig. 3). The average offset to 20 ± 9 % on rainfall days (p < 0.05). There was no appar-
of δ 15 NTHAA values between fine and coarse particles was ent trend in the percentage of other individual HAAs for fine
lower than 1.5 ‰ (Fig. 4a). These results appear to contrast particles following the precipitation.
with what one might expect for AAs in either particle size For coarse aerosol, the percentage composition of HAA on
undergoing particularly more photochemical transformation dry days is quite different from that on rainy days for coarse
than the other. Therefore, significantly lower DI values, scat- particles (Fig. 2). From dry days to rainfall days, the percent-
tered characteristics
P of δ 15 N distribution in trophic AA and age of Pro in coarse particles significantly decreased from
higher V values observed in coarse particles in this study 74 ± 25 % to 53 ± 34 % (p < 0.05); meanwhile the percent-
provide evidence that the difference in the THAA concentra- age of Ala, Val, Leu, Ile and Glu in coarse particles signifi-
tion and mole-percentage composition distribution between cantly increased (p < 0.05). These HAA species together ac-
fine and coarse particles may be related to AAs in coarse par- counted for 39 % of the total THAA pool on dry days, while
ticles having a stronger bacterial degradation state than those on rainfall days, this proportion was only 20 %. Besides that,
in fine particles. compared to fine particles, the large variation in mole compo-
Atmos. Chem. Phys., 21, 2585–2600, 2021 https://doi.org/10.5194/acp-21-2585-2021R.-G. Zhu et al.: Hydrolyzed amino acids in fine and coarse atmospheric aerosol in Nanchang 2597
sition of THAA for coarse particles was observed on rainfall sity. Specifically, a steep decrease in the percentage of Pro
days (Fig. 2). From dry days to rainfall days, the percentage and increase in other HAAs in coarse particles mainly oc-
change of Pro for coarse particles (21 %) was roughly 4 times curred on days with a daily precipitation amount above 1 mm
greater than that for fine particles (6 %). Similarly, from dry and hourly rainfall amount above 0.2 mm, whereas the mole-
days to rainy days, the increase in the percentage of Ala, Val, percentage composition of HAA on days with a lower daily
Leu, Ile and Glu in coarse particles was significantly greater and hourly precipitation amount were similar to those ob-
than that in fine particles. For example, following the precip- served on dry days (Fig. 2). As we discussed above, AAs
itation, Val in coarse particles increased by 4 %, whereas Val in coarse particles on dry days were more degraded. There-
in fine particles only increased by 0.3 %. These large varia- fore, we conclude that those “fresh” protein matters in coarse
tions in the percentage of some HAA species (e.g. Pro, Ala, particles are likely prone to be released by droplets, and the
Val, Leu, Ile and Glu) were observed in coarse particles on amount and intensity of the rainfall are the key factors con-
rainy days, which imply the states of coarse particles mea- trolling this mechanism.
sured on rainfall days were different from the ones measured
on dry days (Fig. 2).
PThis conclusion also supported by the variation of DI and 4 Conclusions
V values for coarse particles on days which on precip-
itation fell. As exhibited in Fig. 6a, DI values of coarse This size distribution of AAs can help understand its trans-
aerosol particles were influenced by precipitation. For coarse formation and fate in the atmosphere. Therefore, verification
aerosol particles, a significant increase in DI value was of the different types, concentrations, origin and atmospheric
found from dry (average = −1.0 ± 0.8) to rainy days (aver- processes of AAs distribution along the different air particle
age = −0.3 ± 1.1) (p < 0.05), whereas the DI values of fine sizes is important and meaningful.
particles on dry (average = 0.7 ± 0.3) and rainy days (aver- This study presents the first isotopic evidence that the
age = 0.6 ± 0.4) werePnot significantly different (p > 0.05). sources of AAs for fine and coarse aerosol particles may be
Figure 6b shows the V values P of fine and coarse particles similar, all of which were influenced by biomass burning,
on dry and rainy days. The V values of coarse aerosol par- soil and plant sources. It is therefore that the huge difference
ticles were also significantly
P affected by precipitation. From in the concentrations and mole-percentage compositions of
dry to rainy days, V values of coarse aerosol particles de- THAAs between fine and coarse particles observed in this
creased from 4.5 P ± 1.5 ‰ to 3.0 ± 1.3 ‰ (p < 0.05). In con- study is closely relevant to the degradation processes of AAs
trast, the average V value of fine particles on dry and rainy in aerosols.
days was identical (2.4 ± 1.1 ‰). From dry to rainy days, DI Although the oxidation, nitrification and oligomerization
values in coarse aerosol
P particles were significant increased processes of protein substances in the atmosphere have been
(p < 0.05) but the V value was significantly decreased widely reported, these abiotic photochemical ageing pro-
(p < 0.05), suggesting more fresh AAs in coarse particles cesses that occur between fine particles and coarse particles
were released on days on which precipitation fell, whereas have not been compared. In this study, the difference in δ 15 N
on dry days AAs in coarse particles were more degraded. values of source AA (Gly, Ser, Phe and Lys) and total hy-
Furthermore, we observed an obviously temporal varia- drolysable amino acids (δ 15 NTHAA ) between coarse particles
tion of the concentration and mole-percentage composition and fine particles was relatively small. The average offset of
of HAA for coarse particles during the precipitation. The δ 15 NTHAA value between fine and coarse particles was lower
higher concentration of THAAs in coarse particles occurred than 1.5 ‰. These results appear to contrast with what one
on 30 April and 5, 6 and 13 May when the daily precipita- might expect for AAs of either particle size undergoing par-
tion amount was above 1mm and the hourly rainfall amount ticularly more photochemical transformation than the other.
was above 0.2 mm (Fig. 1 and Table S4). Previous studies On the contrary, the degradation of atmospheric AAs in
demonstrated that droplets splashing on a porous medium aerosols is rarely investigated. This is the first report of us-
can deliver fresh biological aerosols in the porous medium ing a degradation marker (DI) to investigate the degradation
to the aerosol, and this mechanism is closely related to the state of aerosol particles. Both composition profiles of HAA
amounts and intensity of the rainfall events (Joung and Buie, and concentrations of THAAs in aerosols are shown to be
2015; Huffman et al., 2013; Yue et al., 2016). Thus, the tem- closely related to DI. And fine particles had significantly
poral variation trend of HAA concentration for coarse par- higher DI values than that of coarse particles (p < 0.05),
ticles in this study can be attributed to the active release suggesting the degradation degree of amino acids in coarse
of biological aerosols caused by droplets, and it highly de- particles is higher than that in fine particles. Combining a
pends on the amounts and intensity of the rainfall. Moreover, new compound-specific nitrogen isotope tool (δP 15 N-HAA)
the mole-percentage composition of HAA in coarse particles and effective bacterial heterotrophy indicator ( V ), scat-
measured on days with higher daily precipitation amount and tered characteristics
P of δ 15 N distribution in trophic AA and
hourly rainfall amount was significantly different from that higher V values were observed in coarse particles in this
observed on days with lower precipitation amount and inten- study, which firstly provide evidence that the stronger degra-
https://doi.org/10.5194/acp-21-2585-2021 Atmos. Chem. Phys., 21, 2585–2600, 2021You can also read