Ambient nitro-aromatic compounds - biomass burning versus secondary formation in rural China
←
→
Page content transcription
If your browser does not render page correctly, please read the page content below
Atmos. Chem. Phys., 21, 1389–1406, 2021
https://doi.org/10.5194/acp-21-1389-2021
© Author(s) 2021. This work is distributed under
the Creative Commons Attribution 4.0 License.

Ambient nitro-aromatic compounds – biomass burning versus
secondary formation in rural China
Christian Mark Garcia Salvador1 , Rongzhi Tang2 , Michael Priestley1 , Linjie Li1 , Epameinondas Tsiligiannis1 ,
Michael Le Breton1,a , Wenfei Zhu3 , Limin Zeng2 , Hui Wang2 , Ying Yu2 , Min Hu2 , Song Guo4 , and Mattias Hallquist1
1 Department  of Chemistry and Molecular Biology, University of Gothenburg, Gothenburg, Sweden
2 College of Environmental Sciences and Engineering, Peking University, Beijing, 100871, China
3 Shanghai Academy of Environmental Sciences, Shanghai, 200233, China
4 State Key Joint Laboratory of Environmental Simulation and Pollution Control, International Joint Laboratory for Regional

Pollution Control, Ministry of Education (IJRC), College of Environmental Sciences and Engineering, Peking University,
Beijing, 100871, P. R. China
a now at: Volvo Group Trucks and Technology Method and Technical Development, Gothenburg, Sweden

Correspondence: Mattias Hallquist (hallq@chem.gu.se) and Song Guo (songguo@pku.edu.cn)

Received: 27 August 2020 – Discussion started: 24 September 2020
Revised: 18 December 2020 – Accepted: 21 December 2020 – Published: 2 February 2021

Abstract. Nitro-aromatic compounds (NACs) were mea-               formation was the dominant source of NACs, and NAC lev-
sured hourly at a rural site in China during wintertime to        els correlated strongly with the ambient ozone concentration.
monitor the changes due to local and regional impacts of          Analyses of individual NACs in the regionally aged plumes
biomass burning (BB). Concurrent and continuous measure-          sampled on these days allowed precursors such as phenol
ments of the concentrations of 16 NACs in the gas and par-        and catechol to be linked to their NAC derivatives (i.e. ni-
ticle phases were performed with a time-of-flight chemical        trophenol and nitrocatechol). Correlation analysis using the
ionization mass spectrometer (CIMS) equipped with a Fil-          high time resolution data and box-model simulation results
ter Inlet for Gases and AEROsols (FIGAERO) unit using io-         constrained the relationships between these compounds and
dide as the reagent ion. NACs accounted for
1390                                                             C. M. G. Salvador et al.: Ambient nitro-aromatic compounds

and behaviour of NACs have attracted interest due to their           can cause both daytime and night-time formation of NACs.
role in the formation of brown carbon (BrC) aerosols (Xie et         Wood burning processes also emit significant quantities of
al., 2017, 2019; Lin et al., 2016; Mohr et al., 2013; Kroflič       aromatic compounds with OH substituents such as phenol
et al., 2015). Nitro-aromatic compounds such as nitrophe-            and catechol, which can be transformed into NP and NC
nol (NP), nitrocatechol (NC), and dinitrophenol (DNP) ab-            under high NOx conditions (Finewax et al., 2018). In the
sorb light in the near-ultraviolet (UV) and visible regions,         same way, oxidation of mononitrates generates nitrophe-
which can cause positive radiative forcing (Zhang et al.,            noxy radicals and similar compounds that produce DNP and
2017). While NACs may constitute only a minor fraction of            other dinitrates. In most of these processes, the ambient con-
aerosols (3000) has facilitated the detection of analytes with
the emission of 8.1 mg kg−1 of NACs, primarily NC and NP             very low detection limits. Additionally, by using a Filter In-
(Hoffmann et al., 2007). A total of 14 NAC species were              let for Gases and AEROsols (FIGAERO) unit, the concentra-
detected in laboratory simulations of open BB, with nitro-           tions of NACs and other species in both the gas and aerosol
catechol having the highest mass concentration regardless of         phases can be analysed simultaneously without need for sam-
the choice of wood fuel (Xie et al., 2019). The same study           ple preparation (e.g. by solvent extraction) (Lopez-Hilfiker et
reported a significant contribution of NACs to absorption            al., 2014; Gaston et al., 2016; Lee et al., 2014).
at 365 nm (Abs365 ), indicating that NACs are strong brown              In this work, the formation of gas- and particle-
carbon (BrC) chromophores. Cloud water samples collected             phase NACs in a rural area of China was studied using a ToF-
during a period of extensive wheat straw burning at a moun-          CIMS instrument with a FIGAERO unit. NACs were classi-
tain site in North China also showed the presence of NP, NC,         fied based on their similarity to NP, NC, nitrobenzoic acid,
and their derivatives (Desyaterik et al., 2013).                     and DNP. The measurements were performed in Dezhou,
   The atmospheric abundance of NACs can also be at-                 China, where open burning of crop residues is a major source
tributed to secondary oxidation of precursor aromatic com-           of atmospheric pollutants (Wang et al., 2018). A previous
pounds (Yuan et al., 2016). The photooxidation and subse-            study conducted in this area recorded some of the highest
quent nitration of benzene and toluene yield NP and methyl-          levels of emissions from open burning of crop residues ever
nitrophenol (MNP), respectively. Oxidation of precursors is          observed in Shandong Province (Gao et al., 2017), so it was
initiated by hydroxyl (OH) and nitrate (NO3 ) radicals, which

Atmos. Chem. Phys., 21, 1389–1406, 2021                                               https://doi.org/10.5194/acp-21-1389-2021
C. M. G. Salvador et al.: Ambient nitro-aromatic compounds                                                                1391

expected that emissions due to BB events would be captured           The ToF-CIMS was optimized to have an average spec-
during the study period.                                          tral mass resolution (m/1 m) of 3000. ToF spectra show-
                                                                  ing ions with mass-to-charge (m/z) ratios between 7–620 Da
                                                                  were acquired with a time resolution of 1 s and averaged over
2     Experimental design                                         1 min for data analysis The ToF spectra were mass calibrated
                                                                  using four frequently occurring ion peaks: iodide monomer
2.1    Site description                                           (I− , 126.904 m/z), dimer (I−                              −
                                                                                                2 253.809 m/z), and trimer (I3 ,
                                                                                              −
                                                                  380.713 m/z) and the NO3 ion (61.988 m/z). The signal of
Measurements were conducted in Dezhou, Shandong
                                                                  the reagent ion (iodide, m/z = 126.904) provided the infor-
Province, China (37.4341◦ N, 116.3575◦ E), as part of the
                                                                  mation on the drift of the signal of the mass spectrometer
“Photochemical Smog in China” project, which aims to eval-
                                                                  (MS). The variabilities of the raw iodide signal during the
uate haze formation in China and its implications for air qual-
                                                                  field measurement were less than 10 % and 20 % for the
ity policies (Hallquist et al., 2016). Instrumental measure-
                                                                  gas- and particle-phase analysis, which indicated the mini-
ments were performed at the Meteorological Weather Bureau
                                                                  mal drift of the CIMS signal. During the post-processing of
of Pingyuan from November 2017 to January 2018. This sea-
                                                                  the data, all signals from MS were normalized to the signal
son is of specific interest because previous wintertime mea-
                                                                  of the reagent ion to account for the daily variations/drifts.
surements in this area have indicated that NACs can con-
                                                                  Gas-phase blank analysis was performed during the post-
tribute as much as 50 ng m−3 to the mass concentration of
                                                                  campaign calibration of the instrument
PM2.5 (particulate matter). The temperature and relative hu-
                                                                     Aerosol particles were collected for 30 min with a PM1.0
midity during the measurement period ranged from −11.7
                                                                  cyclone and deposited on a Zefluor® PTFE membrane filter.
to 20.9 ◦ C and from 129 %–99 %, with campaign averages
                                                                  Analytes were then desorbed by passing heated N2 gas over
of 2.2 ◦ C and 50 %, respectively. The wind speed averaged
                                                                  the filter, with a temperature cycle from room temperature to
2.4 m s−1 ; a time series of the metrological conditions during
                                                                  200 ◦ C over 20 min, followed by a 10 min soak at 200 ◦ C to
the experimental campaign is shown in Fig. 1. The daytime
                                                                  ensure desorption of the compounds from the filter (a typical
mass concentration of particulate matter (PM1.0 ) measured
                                                                  desorption profile is shown in the Supplement). The NACs
with an aerosol mass spectrometer typically exceeded the Eu-
                                                                  were quantified by doping the PTFE filter of the FIGAERO
ropean Air Quality allowable limit for PM2.5 (25 µg m−3 ),
                                                                  with known amounts of freshly prepared authentic standards.
and there were more than 10 pollution episodes with high
                                                                  The standards were analysed using the same thermal desorp-
aerosol loadings (>100 µg m−3 ). Organic matter comprised
                                                                  tion procedure as for the aerosol particles. NACs with no
60 % of the PM1.0 on average, and it contributed as much as
                                                                  available standard were quantified by applying sensitivities
80 % in several field measurements. Inorganic nitrate (NO−   3)   for compounds with similar chemical structures.
accounted for 20 % of the measured PM1.0 levels on aver-
age. The diurnal profiles of total particulate matter and or-
ganic matter were similar, with two distinct peaks at 08:00       2.3   Other collocated instruments
and 19:00 (LT) (Fig. 1).
                                                                  A high-resolution time-of-flight aerosol mass spectrometer
2.2    FIGAERO–CIMS measurement                                   (HR-ToF-AMS) was used to measure the composition and
                                                                  size distribution of particles with diameters below 1.0 µm
A Filter Inlet for Gases and AEROsols (FIGAERO) coupled           (PM1.0 ). These measurements provided mass concentrations
to a time-of-flight mass spectrometer (ToF-CIMS) was uti-         of particle-bound non-refractory species such as organics,
lized to characterize the NAC content of the gas and par-         sulfates, nitrates, ammonium, and chloride with a 4 min av-
ticle phases. This instrument is described in detail in pre-      erage time resolution (DeCarlo et al., 2006). Volatile organic
vious publications (Lopez-Hilfiker et al., 2014; Le Breton        compounds (VOCs), including some precursors of NACs,
et al., 2018, 2019). Teflon tubing and copper tubing were         were monitored using a combination of two online gas chro-
used as sample lines for the gas and particle phases, respec-     matographs (GCs) with a mass spectrometer (MS) and flame
tively. The ToF-CIMS was operated in negative ionization          ionization (FID) detectors, resulting in the detection of over
mode with iodide (I–) as the reagent ion. High-purity N2          100 VOCs. Photolysis rates of ozone (j (O1D)) and NO2
air (99.9 % purity) was flown over a glass vial containing        (JNO2 ) were measured using a commercial spectroradiome-
methyl iodide (CH3 I) and into a TOFWERK type-P X-ray             ter, which was calibrated using a high-power halogen lamp
ion source (operated at 9.5 kV and 150 µA) to create ions to      after the field campaign.
charge compounds (MH) entering the ion–molecule region
(IMR). The resulting product ions were identified either as       2.4   Box-model simulation of nitrocatechol using the
molecular adducts with iodide (MHI− ) or deprotonated ions              AtChem tool
(M− ) (Eq. 1):
                                                                  A series of box-model simulations was conducted to clar-
(H2 O) I− + MH → n (H2 O) + MHI− /M− .                     (1)    ify the mechanism of NC formation during the second pe-

https://doi.org/10.5194/acp-21-1389-2021                                          Atmos. Chem. Phys., 21, 1389–1406, 2021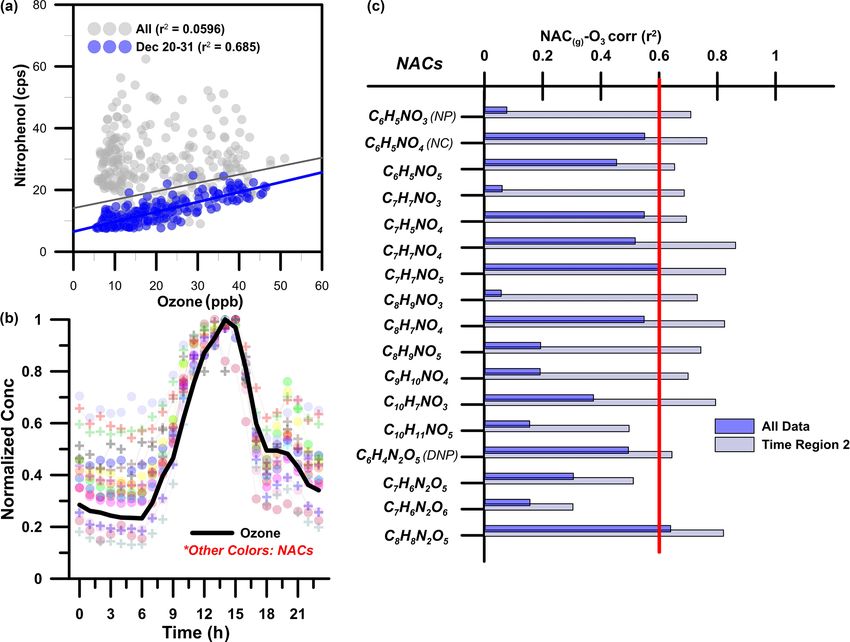
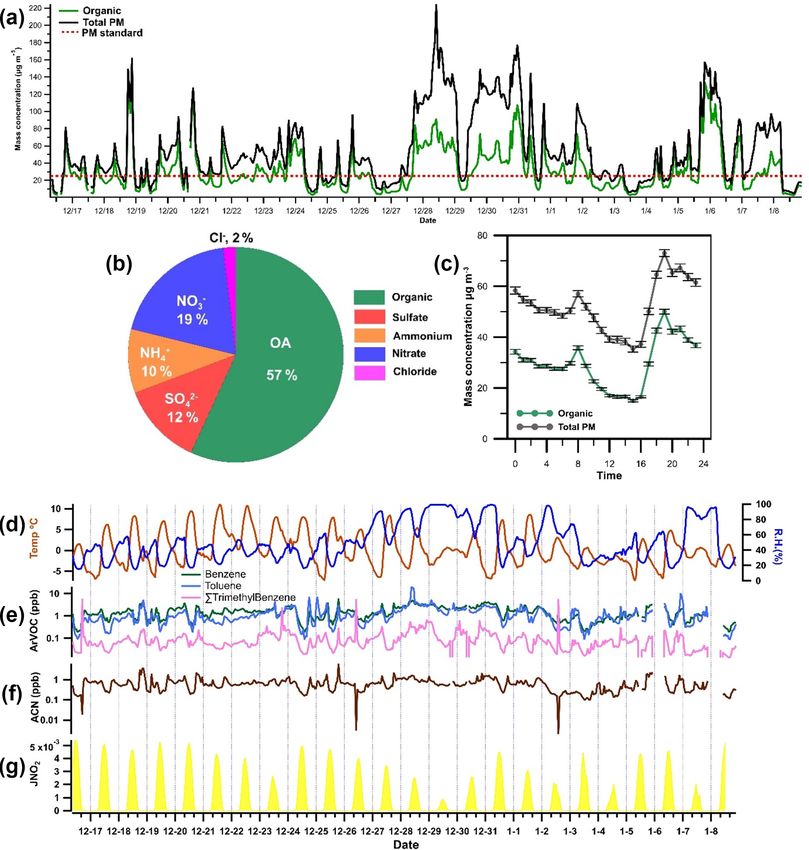
1392                                                               C. M. G. Salvador et al.: Ambient nitro-aromatic compounds

Figure 1. (a) Time series profiles of organic matter (OM) and total particulate matter (PM) concentrations during the field campaign.
The red reference line at 25 µg m−3 represents a typical PM2.5 mass limit. (b) Contribution of different aerosol components to particulate
mass concentration as measured with an aerosol mass spectrometer (AMS). (c) Diurnal variation in levels of organic and total particulate
matter during the wintertime measurement period in Dezhou. Error bars indicate standard errors. Time series of (d) temperature and relative
humidity (RH) and (e) aromatic VOCs such as benzene, toluene, and trimethylbenzene. Also included in the figure are (f) the mixing ratio
of acetonitrile (ACN) and (g) the rate of NO2 photolysis, expressed as j (NO2 ).

riod of the experimental campaign (see below), when sec-                et al., 2016). In our simulations, NC was used as a repre-
ondary chemistry dominated the formation of NACs. Sim-                  sentative NAC to clarify the potential contribution of com-
ulations were performed using AtChem (Sommariva et al.,                 pounds emitted during biomass burning (i.e. catechol) to sec-
2020; http://https://atchem.leeds.ac.uk/, last access: 27 Jan-          ondary NAC formation. The strong dependence of NC pro-
uary 2021), an online zero-dimensional box model, together              duction on the overall rate of secondary formation and its
with chemical reactions extracted from the Master Chemi-                significant mixing ratio during the second period (74 ng m−3 )
cal Mechanism (MCMv3.3.1) via the website (http://mcm.                  made this compound a suitable representative NAC for this
leeds.ac.uk/MCM, last access: 27 January 2021; Jenkin et                purpose. The MCM (v.3.3.1) assumes that NC is the sole
al., 2003; Saunders et al., 2003). AtChem was previously                product of catechol, which greatly reduces the complexity
utilized to simulate the formation of formic acid and nitro-            of the model’s calculations. Measured concentrations of in-
phenol at a site dominated by oil and gas production (Yuan              organic gases such as CO, O3 , NOx , and selected volatile

Atmos. Chem. Phys., 21, 1389–1406, 2021                                                    https://doi.org/10.5194/acp-21-1389-2021
C. M. G. Salvador et al.: Ambient nitro-aromatic compounds 1393
organic compounds were used to constrain the simulations sources and formation pathways influence the concentration
(Table S3). Over 90 VOCs were measured during the field of NACs. Since the analytical technique used in this work
campaign in Dezhou. However, to minimize the computa- cannot account for all NACs, the mass loadings reported here
tional cost of the modelling process, only the 10 VOCs with should be treated as lower limits. Nevertheless, the mean
the highest mixing ratios were included in the model. Addi- concentrations measured in Dezhou were higher than the
tionally, compounds with multiple isomers (e.g. xylene and mixing ratios of total NACs reported in other studies (Teich
trimethylbenzene) were treated as single species to further et al., 2017; Wang et al., 2018, 2019; Kahnt et al., 2013), pos-
reduce computational cost. The VOCs with the highest con- sibly because this work examined a greater number of NACs
tribution to OH reactivity in four Chinese cities (Tan et al., (16 compounds). Furthermore, concentrations of NACs mea-
2019) were also included in the model to properly simulate sured in winter are normally significantly higher than those
the major oxidation reactions in the atmosphere. The VOC measured in the summer because the boundary layer is usu-
concentration assumed in the simulations amounted to 75 % ally more shallow, and BB (wood combustion) occurs more
of the total VOC concentration measured in Dezhou. Over- frequently in winter.
all, a total of 1195 species (intermediates, products, etc.) and The diurnal profile of total gas-phase NACs exhibits two
3705 reactions (oxidation, photolysis, etc.) were included in distinct peaks: a broad peak around midday, between 13:00–
the mechanism. The contribution of traffic sources was also 16:00, and another in the evening (around 20:00 local time),
analysed; results for these sources are presented in the Sup- as shown in Fig. 3. The mean daytime concentration of gas-
plement. phase NACs in Dezhou (2200 ng m−3 ) was almost twice
the night-time mixing ratio (1400 ng m−3 ), presumably be-
cause either the rate of NAC production was higher dur-
3 Results and discussion ing the daytime or the rate of loss was lower. These re-
sults stand in contrast to those of an earlier study, in which
3.1 Identification and occurrence of NACs in Dezhou only night-time peaks were observed due to the daytime
photolysis of NACs (Yuan et al., 2016). Mean daytime and
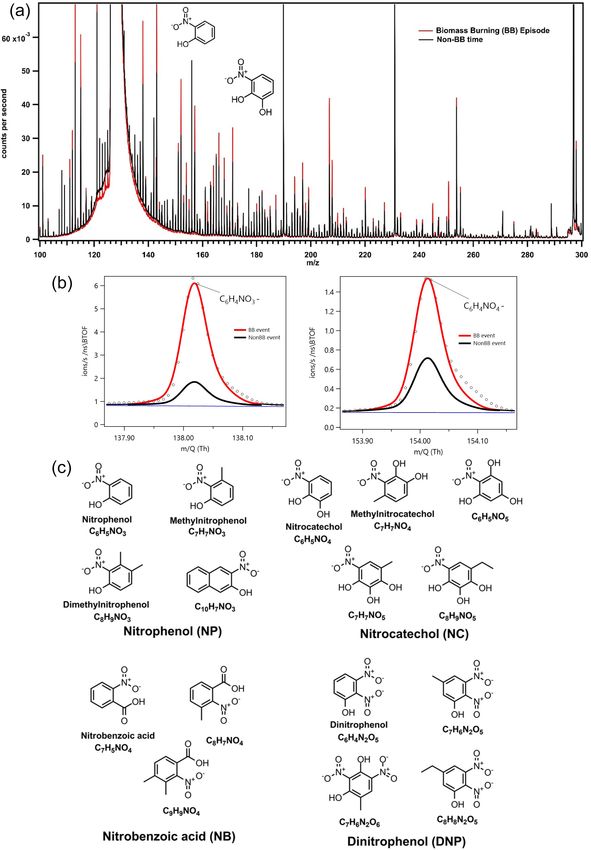
Figure 2 compares mass spectra collected during a strong BB night-time concentrations of particle-phase NACs were sim-
episode (red lines) to those for a typical clean day (black ilar (304 and 300 ng m−3 , respectively) but with clear vari-
lines) in Dezhou. The intensities of several molecular ion ability, as shown in the corresponding diurnal profiles: there
peaks increased significantly during the BB episode, par- were two diurnal particle-phase peaks (08:00 and 20:00 LT),
ticularly those at 138.019 and 154.014 m/z, which corre- but both were less pronounced than their gas-phase counter-
spond to the deprotonated masses of NP (C6 H4 NO− 3 ) and NC parts. These maxima coincided with the peaks in the diur-
(C6 H4 NO− 4 ), respectively. These ions exhibited 6- to 8-fold nal profiles of organic and particulate matter, suggesting that
increases in signal intensity during the BB episode, clearly levels of particle-phase NACs were linked to the general oc-
indicating substantial increases in the concentrations of the currence of ambient aerosols. This may be due to enhanced
corresponding compounds. By analysing the difference be- partitioning towards the particle phase caused by increases
tween polluted and clear episodes, 16 ions related to nitro- in the organic aerosol mass. The diurnal profile of particle-
aromatic compounds were identified (see Fig. 2), including phase NACs was comparable with the observed profile of ni-
nitrobenzoic acid, methoxy/methyl NP, and DNP. The exact trocatechol detected from residential wood smoke (Gaston et
positioning and assignment of the functional groups of the al., 2016).
nitro-aromatic compounds could not be determined because Figure 3 also shows the mass contribution of lumped NAC
ToF-CIMS cannot differentiate between isomers, i.e. com- categories in the gas and particle phases. NACs were as-
pounds with the same molecular formulas. High-resolution signed to lumped categories based on their structural similar-
fitting results for individual peaks are presented in the Sup- ity to the most common NACs reported in previous studies.
plement. Both the gas and particle phases exhibited similar percent-
The campaign-average mixing ratios of NACs measured age contributions for each category. NP and its analogues ac-
for the gas and particle phase were 1720 and 299 ng m−3 , re- counted for almost half of the total NAC concentration in
spectively. The measured fractions of the 16 NACs in the par- both phases, which was assumed to be due to the strong in-
ticle phase (Fp ) ranged between 9 % and 28 %, with a mean fluence of primary emission from BB events. NC and methyl-
of 16 %; these results are consistent with those obtained in an nitrocatechol, both of which are commonly used as biomass
earlier study that applied the same measurement technique tracers (Iinuma et al., 2010; Finewax et al., 2018), individu-
during springtime at a suburban site in Changping near Bei- ally accounted for as much as 9 % of the total NAC concen-
jing, China (Le Breton et al., 2018). The overall contribution tration. Interestingly, the diurnal profiles of NP did not follow
of particle-phase NACs to the total concentrations of organic the general trend of the other measured NACs. This suggests
matter (mean: 1.9 %; range: 0.0025 %–21 %) and total PM that its formation pathway differs from that of other NACs
(mean: 1.1 %; range: 0.0013 %–11 %) varied substantially such as NC; it may be that the contribution of secondary for-
over the campaign, which may indicate that multiple NAC
https://doi.org/10.5194/acp-21-1389-2021 Atmos. Chem. Phys., 21, 1389–1406, 2021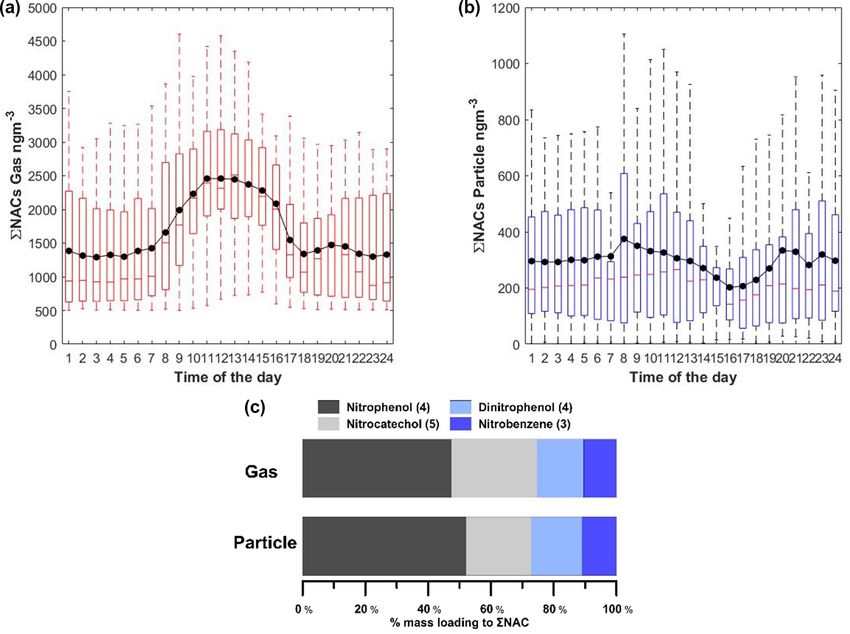
1394 C. M. G. Salvador et al.: Ambient nitro-aromatic compounds
mation is greater than that of direct primary emission from combustion; levels of NOx in plumes originating from local
BB for NP. BB are high, typically resulting in a ratio close to 1. The at-
mospheric transformation of NOx leads to the formation of
3.2 Sources of nitro-aromatic compounds NOz components such as HNO3 and organonitrates, causing
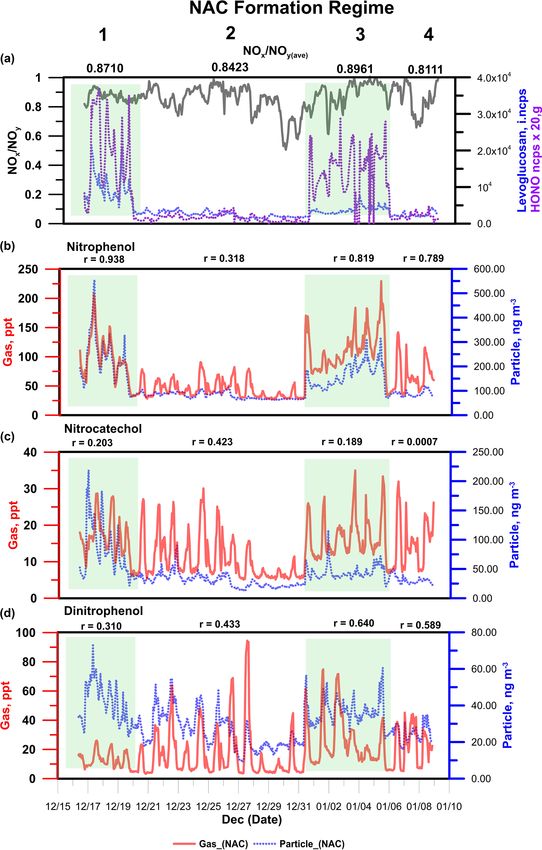
the ratio of NOx to NOy to deviate from unity. In Fig. 4, the
Previous studies indicated that NACs mainly originate from 3-week measurement campaign is separated into four peri-
BB, traffic, or secondary formation in the gas or condensed ods corresponding to four distinct NAC formation regimes.
phase, with minor contributions from coal combustion (Han- Regimes 1 and 3 are associated with strong BB episodes
son et al., 1983; Wang et al., 2018; Yuan et al., 2016; Xie et based on the profiles of the three previously mentioned trac-
al., 2019; Chow et al., 2016). While previous studies found ers. Levels of NACs in the condensed phase mirrored those
that traffic has important effects on NAC levels (Cecinato et of levoglucosan, which exhibited two strong peaks at 08:00
al., 2005; Tremp et al., 1993), its influence appeared to be and 20:00 LT. Moreover, during apparent BB events, the tim-
limited in this case: there was a weak to negative associ- ing of the peaks in NAC concentrations agreed well with that
ation between typical automobile exhaust VOCs (benzene, of the peaks in the diurnal OM profile. This demonstrates
toluene, and trimethylbenzene) (Zhang et al., 2018; Geng et the apparently strong contribution of NACs to submicron
al., 2008; Batterman et al., 2002) and the studied NACs. Fur- aerosols in the studied city in rural China
thermore, concentrations of the measured NACs did not peak Figure 4 also shows the gas and particle concentration time
during or shortly after periods of high traffic intensity, in con- series of three representative NACs (NP, NC, and DNP). NP
trast to results obtained at three sites in Europe during cold and NC are frequently reported to be the dominant NACs
and warm seasons (Delhomme et al., 2010). in field- and laboratory-based BB studies (Xie et al., 2019;
NACs may also form in aqueous phases, particularly when Wang et al., 2017, 2018). Figure 4 clearly shows that the
the atmosphere has a high liquid water content (Harrison three NACs behave in quite different ways under the regimes
et al., 2005b; Vidović et al., 2018, 2020). The contribution linked to strong BB episodes. In these regimes, gas-phase NP
of aqueous-phase oxidation to NAC formation was found to concentrations correlated strongly (r = 0.8 − 0.9) with those
be limited based on the negative relationship (r = −0.1 to in the particle phase. This may be because there was a com-
−0.6) between the relative humidity (RH) and the mixing ra- mon dominant source of NP in the gas and particle phases or
tios of NACs in the gas and particle phases. An earlier study because of fast partitioning of NP between these phases dur-
found that the relative contribution of aqueous-phase oxida- ing BB events. There was also good agreement between the
tion to NAC formation in Beijing increased as the ambient gas- and particle-phase time series for the methoxy/methyl
RH increased (Wang et al., 2019). The conditions in Dezhou (C7 H7 NO3 ) and ethoxy/ethyl (C8 H9 NO3 ) derivatives of NP
during the measurement campaign were relatively dry (the during BB regimes. NP and its analogues thus appear to be
campaign average RH was 50 %), with few days exceeding good direct tracers of primary emissions from BB events in
70 % RH as shown in Fig. 1. Dezhou.
Given the minor contributions of traffic and aqueous-phase Conversely, the correlations between the gas- and particle-
oxidation, most of the subsequent analysis focused on pri- phase concentrations of NC and DNP were very weak (r =
mary BB emissions and secondary formation in the gas and 0.2 − 0.3), indicating that BB events had different effects
particle phases. on the formation and partitioning of these NACs (see Sup-
plement for a complete correlation analysis). During typical
3.3 Primary emission from biomass burning clean days, particularly from 20 to 30 December (regime 2),
the average correlation coefficient between the gas and parti-
The measurement period included many intense BB episodes cle phases for all NACs fell to less than 0.5, possibly because
that increased the concentrations of some NACs, particu- the contribution of photochemical processes to NAC forma-
larly in the particle phase. To verify the association between tion was high relative to that of primary BB sources.
these elevated concentrations and the observed BB episodes, Secondary NAC formation may also occur during peri-
the atmospheric behaviours of levoglucosan and nitrous acid ods of extensive BB, resulting in mixed contributions to
(HONO) and the ratio of NOx to NOy (NOx / NOy ) were the observed NAC concentration. Differences in the mix-
used as tracers of BB. Levoglucosan is a commonly used ing ratios and mass concentrations of NACs between BB
molecular tracer of BB that is superior to other markers such regimes and relatively clean regimes can shed light on the
as K+ and black carbon (BC) because it is much less prone relative contributions of primary emissions from BB and
to interference from non-BB sources (Zhang et al., 2012; secondary production during each regime type. This can be
Simoneit et al., 1999). Concentrations of HONO increase demonstrated by considering the average NAC concentra-
during BB episodes because the rate of conversion of NO2 tions under regimes 1 (a strong BB regime) and 2 (a non-
into HONO is elevated in BB plumes due to the presence of BB regime); pronounced differences (>50 %) in NAC con-
aerosols with high surface areas (Nie et al., 2015). The ratio centration between these regimes can be considered indica-
of NOx and NOy reflects the freshness of the emissions from tive of the influence of BB on NAC production in Dezhou.
Atmos. Chem. Phys., 21, 1389–1406, 2021 https://doi.org/10.5194/acp-21-1389-2021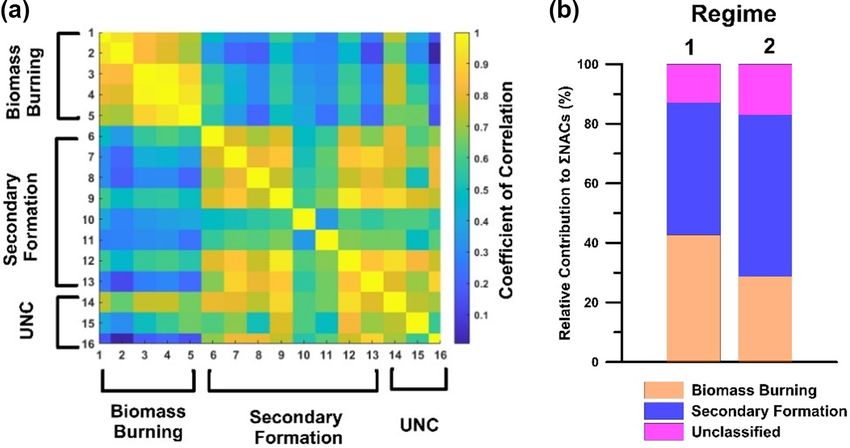
C. M. G. Salvador et al.: Ambient nitro-aromatic compounds                                                                           1395

Figure 2. (a) Integrated mass spectra during a biomass burning episode (red) and a typical “clean” day. (b) Expansions of the peaks at
m/z 138 and 154, which correspond to deprotonated nitrophenol (NP) and nitrocatechol (NC). The increase in the strength of the NP and
NC signals during the biomass burning episode is readily apparent. (c) Molecular structures of the 16 NACs identified in this work, grouped
according to structural similarity.

The average recorded signal intensities for levoglucosan in             useful direct tracers of BB in Dezhou. Some NACs exhib-
the gas and particle phases under regime 2 were 52 % and                ited lesser declines (
1396 C. M. G. Salvador et al.: Ambient nitro-aromatic compounds
Figure 3. (a, b) Diurnal profile of the sum of NACs in the gas (a) and particle (b) phases. The solid black line indicates the hourly average.
Note that outliers are not shown in the figure. (c) Molecular distribution of NACs in the gas and particle phases, classified according to
similarity to major NACs. Values in parentheses indicate the number of compounds per category.
C7 H7 NO3 ) (Yuan et al., 2016; Vione et al., 2005). Such nitra- nate mainly from primary sources (e.g. NP); for compounds
tion processes are mainly driven by secondary photochemical expected to be formed mainly via secondary production (e.g.
or multiphase reactions, explaining the comparatively small NC and DNP), the r 2 with ozone remained relatively high
difference in the mixing ratios of these compounds between throughout the campaign (see Fig. 5).
regimes 1 and 2. Secondary production of NACs can be linked to the
presence of specific precursor compounds (Harrison et al.,
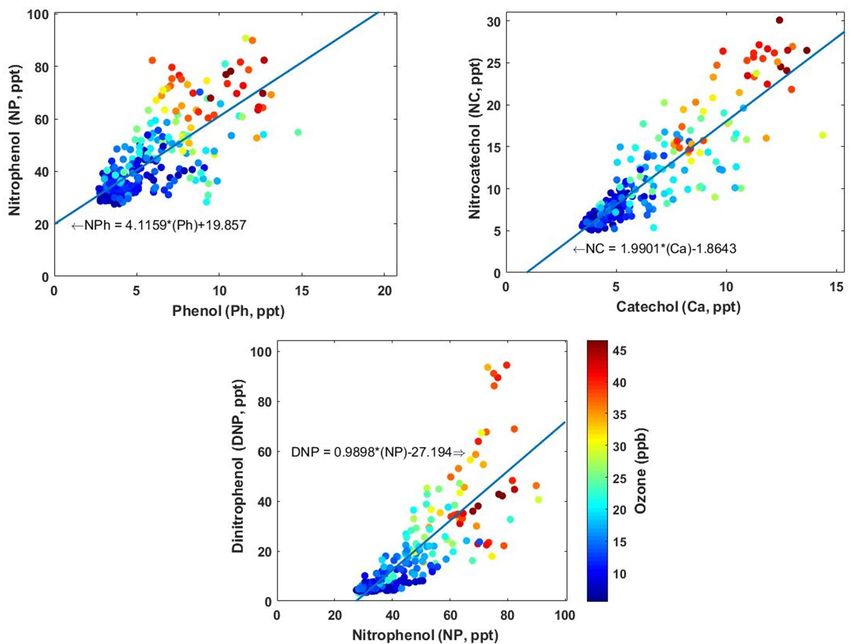
3.4 Secondary formation of gas-phase NACs 2005a). Figure 6 shows the correlations between levels of
NP, NC, and DNP and those of their proposed precursors –
Under regime 2, concentrations of BB markers fell dramati- phenol (C6 H6 O), catechol/dihydroxybenzene (C6 H6 O2 ), and
cally, indicating that the influence of primary biomass emis- NP. Phenol and catechol are primarily formed by the pyroly-
sions was limited (as shown in Fig. 4). Here, the diurnal pro- sis of lignins and can be precursors for secondary formation
files of gas-phase NACs (as shown in Fig. 5) exhibit increases of NACs, particularly during BB events (Yee et al., 2013;
in concentration at 14:00–15:00 LT and a minor night-time Finewax et al., 2018; Gaston et al., 2016). Levels of NACs
peak at 20:00 LT. Similarly, in contrast to the events during correlated strongly (r 2 = 0.7–0.8) with those of their primary
regime 1, the peak in particle-phase NAC concentrations oc- precursors (i.e. phenol and catechol). This indicates that ni-
curred also in the afternoon at 14:00–15:00 LT. These peaks tration of these precursor phenolic compounds in the pres-
in the daily mixing ratios NACs coincided with the daily ence of OH or NO3 radicals was an important route of NP
peak ozone concentration. Secondary photochemical forma- and NC formation. The figure showing the correlation be-
tion was therefore probably the dominant NAC formation tween precursors and final products also shows the observed
process under regimes 2 and 4. This conclusion is supported ozone mixing ratio, which is a measure of secondary photo-
by the fact that the coefficient of determination (r 2 ) between chemical activity. This further underscores the significance
ozone and nitrophenol (see Fig. 5) under regime 2 (r 2 = 0.7) of photochemical oxidation in the formation of NC and NP
is substantially higher than that for the full data set including from catechol and phenol. A similar relationship was ob-
BB regimes 1 and 3 (r 2 =0.1). The most pronounced reduc- served for the secondary formation of DNP via further oxida-
tions in r 2 were observed for compounds expected to origi-
Atmos. Chem. Phys., 21, 1389–1406, 2021 https://doi.org/10.5194/acp-21-1389-2021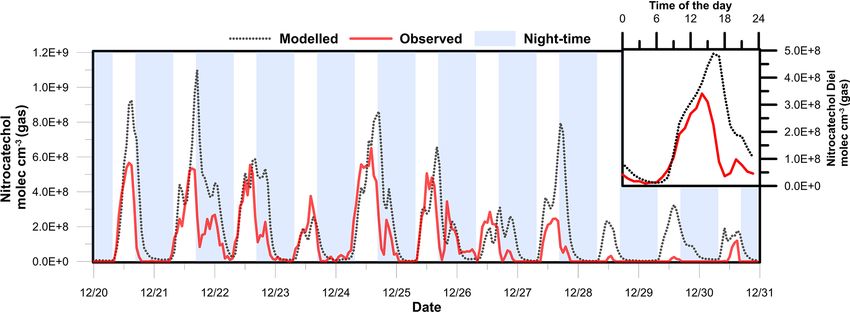
C. M. G. Salvador et al.: Ambient nitro-aromatic compounds                                                                         1397

                                                                                                                        q
                                                                        by the nitration of phenoxy radicals (C6 H5 O ), which are
                                                                        themselves formed by the OH/NO3 -mediated oxidation of
                                                                        phenol (Berndt and Böge, 2003). Mechanistically, the for-
                                                                        mation of NACs such as NP should be heavily dependent on
                                                                        the atmospheric concentration of NO2 . However, NACs such
                                                                        as NP and nitrosalicylic acid were formed consistently in a
                                                                        mountainous region of China, even when the NO2 concentra-
                                                                        tion was below 5 ppb (Wang et al., 2018). The campaign NO2
                                                                        average for this work in Dezhou was 23 ppb, with daytime
                                                                        and night-time means of 17 and 26 ppb, respectively. These
                                                                        mixing ratios may have been high enough to sustain the nitra-
                                                                        tion of aromatic VOCs. However, a negative correlation was
                                                                        observed between NO2 and NACs in the gas (ravg = −0.598)
                                                                        and particle phases (ravg = −0.116) under regime 2, when
                                                                        secondary formation was the dominant source of NACs. In
                                                                        aged air masses such as those sampled during regime 2, NOx
                                                                        will be transformed into nitrated compounds (and HNO3 ),
                                                                        which may explain this negative correlation.

                                                                        3.5   Analysis of NAC production and loss pathways

                                                                        To further investigate the secondary production of NAC
                                                                        during the experimental campaign, box-model simulations
                                                                        were performed to model NC formation and loss using the
                                                                        AtChem tool and atmospheric oxidation chemistry models
                                                                        from MCMv3.3.1. Figure 7 shows the reaction pathway for
                                                                        the formation of NC by catechol oxidation initiated by OH
                                                                        or NO3 radicals. Unlike in the case of NP, only one precursor
                                                                        – catechol – can generate the intermediates (i.e. CATEC1O,
                                                                        CATEC1O2, and CATEC1OOH) in NC formation. Sinks of
                                                                        NC are its further oxidation by NO3 or OH radicals, which
                                                                        lead to stable ring-opening products such as 2-oxoacetic
                                                                        acid. Photolysis and deposition/dilution of NC were also ac-
Figure 4. (a) Time series of particle-phase concentrations of lev-
                                                                        counted for in the simulation because of their reported impor-
oglucosan, gas-phase concentrations of HONO, and ratios of NOx
to NOy as markers of BB episodes during field measurements. (b,
                                                                        tance in the gas-phase atmospheric loss of formic acid and
c, d) Mixing ratios of nitrophenol, nitrocatechol, and dinitrophenol    NP (Yuan et al., 2015, 2016). The photolysis frequency of
under regimes corresponding to BB episodes and non-BB episodes.         NC used in the simulations was based on the reported value
The coefficient of correlation (r) reflects the agreement between the   for NP (1.4 % of the photolysis frequency of NO2 ). A sen-
gas- and particle-phase concentrations.                                 sitivity analysis (see Supplement) of the box model against
                                                                        variation of the effective physical loss rates (due to dispersion
                                                                        and deposition) indicated that a high loss rate (1 h) provided
tion of nitrophenol. DNP is formed by the reaction of nitro-            the best estimate of the observed NC mixing ratios. Physical
phenol with OH or NO3 radicals to form nitrophenoxy radi-               loss terms with equivalent lifetimes above 1 h (e.g. 3 h) over-
                  q
cals (NO2 C6 H5 O ), whose subsequent nitration yields DNP              estimated the measured NC concentrations by at least 50 %.
(Yuan et al., 2016).                                                    As a result, the tail of the modelled daytime peak extended
   As shown in Fig. 4, the ratio of NOx to NOy , which is an            well into the night when using low physical loss rates. The
indicator of plume freshness, was lower under regime 2 than             loss rate used in this work was higher than the rates used in
regime 1, suggesting that an older plume was sampled in the             previous box-model analyses of formic acid and NP (Yuan
former case. This aged plume may have contained residual                et al., 2015, 2016) but is reasonable given the low vapour
traces of regional photochemical smog containing phenol,                pressure of NC (2.1 × 10⁻⁴ Pa) (Finewax et al., 2018), which
catechol, and their derivatives that were formed as primary             favours partitioning into the condensed phase.
emissions during BB events outside the studied region.                     Figure 8 shows time series of the observed and mod-
   The yield of NACs produced by secondary formation is                 elled mixing ratios of nitrocatechol under regime 2. The
known to depend on the NO2 concentration (Wang et al.,                  simulated mixing ratio profile agrees reasonably well with
2018, 2019; Yuan et al., 2016). For instance, NP is formed              the experimental data, as indicated by the mean ratio of

https://doi.org/10.5194/acp-21-1389-2021                                                 Atmos. Chem. Phys., 21, 1389–1406, 2021
1398 C. M. G. Salvador et al.: Ambient nitro-aromatic compounds Figure 5. (a) Correlation between levels of nitrophenol and ozone (O3 ). (b) Normalized diurnal profiles of gas-phase NACs and ozone under the second NAC formation regime observed during the field campaign. (c) Coefficients of determination (r 2 ) between gas-phase NACs and O3 for the whole data set and for regime 2 only. Figure 6. 3D scatter plots showing the variation of the concentrations of NP, NC, and DNP with the concentrations of their precursors, together with the corresponding ozone mixing ratios. Atmos. Chem. Phys., 21, 1389–1406, 2021 https://doi.org/10.5194/acp-21-1389-2021
C. M. G. Salvador et al.: Ambient nitro-aromatic compounds                                                                         1399

Figure 7. Schematic depiction of the atmospheric formation and loss of nitrocatechol in the gas phase based on the reaction pathways
included in the Master Chemical Mechanism (MCMv3.3.1). Species names used in the MCM are given in parentheses.

Figure 8. Modelled and observed nitrocatechol concentration time series. The inset shows the diurnal profile of the observed and modelled
nitrocatechol concentrations.

the modelled concentration to the observed concentration               local time, but the experimentally observed afternoon peak in
(Model/Obsavg = 1.25) and the coefficient of determination             NC levels occurred around 14:00 LT. This discrepancy can be
(r 2 = 0.51) between the two data sets. These results clearly          explained by the change of wind direction from north-west
show the explicit dependence of the secondary formation                to north-east observed after 14:00 LT. It should be noted that
of NACs such as nitrocatechol on the oxidation of thermal              the parametrization of AtChem does not account for meteo-
degradation and pyrolysis products of lignins (e.g. catechol)          rological effects and that it only partially accounts for dis-
in aged plumes. The modelling procedure overestimated the              persion via the effective physical loss rate parameter. The
observed concentration from 27 to 31 December, which was               three daily maxima were attributed to the contributions of
attributed to the elevated mass aerosol mass concentration             different sources of the intermediate hydroxyphenoxy radi-
and increased RH which would favour the partitioning of the            cals (CATEC1O) throughout the day. As shown in Fig. 7, the
gas-phase NACs to the particle phase and a potential loss              nitration of CATEC1O radicals is the only source of NC, so
by condensed-phase processes/deposition. Additionally, the             the production of hydroxyphenoxy radicals will dictate the
presence of the simulated daytime peak confirms that the rate          overall rate of NC formation under excess NOx conditions.
of daytime production of NC (source) exceeded its rate of              Figure 9 shows the relative contributions of the three ma-
photolysis (sink) during the second period of the field cam-           jor CATEC1O formation pathways. Note that CATEC1O can
paign. If the daytime loss rate of NC due to photolysis is dis-        also be produced through photolysis of hydroperoxylphe-
regarded, the mixing ratio will only increase by 10 %, clearly         nol (CATEC1OOH) and the reaction of hydroxyphenylper-
showing the weak contribution of photolysis to the overall             oxy (CATEC1O2) with NO3 and RO2 radicals, as shown
loss of NC. The primary pathways of NC loss were thus oxi-             in Fig. 7. However, these pathways account for less than
dation by OH radicals and night-time oxidation by NO3 rad-             0.05 % of the total CATEC1O production and were there-
icals.                                                                 fore disregarded. The daytime shoulder peak of NC at 10:00
    Figure 8 also shows the diurnal profiles of the modelled           was due to OH radical oxidation of catechol and accord-
and observed NC concentrations. The modelled profile fea-              ingly coincides with the diurnal peak in the OH concentration
tures prominent peaks at 10:00 (shoulder), 16:00, and 20:00            (∼ 4.5 × 10⁶ molec cm−3 ). The major formation pathways of

https://doi.org/10.5194/acp-21-1389-2021                                                 Atmos. Chem. Phys., 21, 1389–1406, 2021
1400 C. M. G. Salvador et al.: Ambient nitro-aromatic compounds
under regime 2, suggesting that secondary formation does
contribute to their presence. To assess the impact of each for-
mation pathway under regime 1, two approaches were used.
In the first approach, it was assumed that the degree of sec-
ondary formation was similar under regimes 1 and 2, which
is reasonable based on the average ozone levels under each
regime (O3 avg = 20 ppb). Both regimes had similar total gas
and particle-phase concentrations of DNP, a product only
formed by secondary oxidation, further supporting the valid-
ity of this assumption. This first approach was referred to as
the DNP method based on the similar DNP profiles observed
under regimes 1 and 2. By subtracting the concentrations of
the five BB compounds under regime 2 from those under
regime 1, it was determined that primary BB combustion pro-
cesses accounted for 70 % of the observed concentrations of
these compounds. The second approach used to estimate the
Figure 9. Diurnal variation in the relative contribution of the hy-
contribution of primary BB to the measured NAC concentra-
droxyphenoxy (CATEC1O) pathway to overall nitrocatechol forma-
tion. Also shown are the observed concentrations of nitrocatechol
tions involved using levoglucosan as a primary source tracer.
and the summed rates of CATEC1O production. This approach is analogous to the widely used EC (elemental
carbon) tracer approach, in which EC is used to distinguish
the primary organic carbon (POC) fraction from secondary
OH radicals in Dezhou during wintertime were HONO pho- organic carbon (SOC) in total organic carbon (OC) measure-
tolysis and the reaction of HO2 with NO, causing measured ments (Day et al., 2015; Cabada et al., 2004). The high time
OH production to peak in the afternoon rather than at midday, resolution levoglucosan (lev.) measurements were performed
as is more common. Ozone photolysis, which is typically a using the same instrument and conditions as the NAC mea-
major source of OH radicals, made a negligible contribution surements, so they provided good data coverage, making lev.
under the studied wintertime conditions. The simulated di- a suitable tracer for primary BB. The relative contributions
urnal profiles of major oxidants are presented in the Supple- of primary emission (BB) and secondary (sec) formation for
ment. Additionally, the box model indicated that the high lev- each NAC were estimated using the following expression:
els of CATEC1O at 13:00 were predominantly due to the re-
action of NO with hydroxyphenylperoxy radicals (∼ 50 %). [NAC]BB = ([NAC]/[lev.])BB × [lev.] (2)
Finally, the elevated levels of NC at 20:00 were primarily at- [NACsec ] = [NACTot ] − [NACBB ] . (3)
tributed to the very efficient (∼ 90 % conversion) NO3 night-
time chemistry after sunset (16:30).
Here, ([NAC] / [lev.])BB is the ratio of the concentration
3.6 Classification and quantification of sources of of the NAC to that of lev. during strong primary combustion
nitro-aromatic compounds emission, and NACBB and NACsec are the fractions of NACs
generated through biomass burning and secondary produc-
The general sources of NACs have been explored in previ- tion, respectively. NACTot and lev. are the measured con-
ous works (Wang et al., 2017, 2019). The 16 NACs found in centrations of NACs and levoglucosan in ambient measure-
Dezhou were further categorized based on their main forma- ments, respectively. Using this approach, primary BB com-
tion routes: primary BB and secondary formation. As noted bustion processes were found to account for 60 % of the to-
above, secondary processes were dominant under regime 2, tal production of BB-related compounds under regime 1, in
whereas both routes contributed under regime 1. The NACs good agreement with the estimate obtained using the DNP
detected under regime 1 were further classified based on method.
the correlation between their gas-phase and condensed-phase The secondary compounds were categorized as such based
concentrations. A strong correlation between the gas and par- on the weak correlations between their gas- and condensed-
ticle phase (rg/p ) was taken to indicate either that primary phase concentrations (rg/pC. M. G. Salvador et al.: Ambient nitro-aromatic compounds 1401
Table 1. Classification of the detected nitro-aromatic compounds based on their major formation pathways.
NACs a
rg/p 1r 2 (NAC–O3 )b 0.75; X1402 C. M. G. Salvador et al.: Ambient nitro-aromatic compounds
two phases, presumably due to the contribution of strong gas- gests that photochemical smog plays a significant role in
phase sources. NAC formation, even during wintertime air pollution events
The measurement campaign was divided into four dif- in rural China that are dominated by primary emissions. This
ferent periods associated with different NAC formation is consistent with the evident contribution of secondary for-
regimes; in some periods, primary BB was the dominant mation in high PM episodes in North China, where oxidation
source of atmospheric NACs, while in other periods sec- of other oxidation anthropogenic tracers, such as SO2 , plays
ondary formation processes played a greater role. The con- an important role during severe haze events (An et al., 2019;
tributions of other sources such as traffic and aqueous-phase Huang et al., 2019).
processes were found to be negligible. The mixing ratios Continuous and concurrent measurement of NACs in the
of NP and its derivatives increased markedly under regimes gas and particle phases with high time resolution has en-
coinciding with primary BB events, indicating that these abled us to understand the formation of compounds that in-
combustion processes contribute strongly to the formation duce radiative forcing in the atmosphere by absorbing near-
of nitrophenolic compounds. The concentrations of gas and UV and visible light. The finding that primary emission and
particle-phase NACs decreased by 40 % and 60 % on aver- secondary formation were the dominant NAC-forming pro-
age (max: 80 % and 88 %) upon shifting from a regime dom- cesses during the measurement period highlights the dom-
inated by primary emission to one dominated by secondary inant contribution of combustion of vegetation and indoor
formation, clearly indicating that the contributions of fresh fuels to the warming effect of brown carbon in the atmo-
biomass burning events to NAC formation significantly out- sphere. Additionally, the NAC production and loss pathways
weigh those of secondary formation processes. identified in this work provide insight into the climate im-
During periods with low concentrations of biomass burn- pact of brown carbons, which partially depends on the life-
ing indicators such as levoglucosan, the diurnal profiles of time of their light-absorbing components (Hems and Abbatt,
gas-phase NACs clearly mirrored those of the atmospheric 2018). Some oxygenated VOCs emitted during BB (e.g. cat-
ozone concentration. This was attributed to dominant NAC echol) were shown to have extended atmospheric lifespans,
formation via regional secondary chemistry (photochemical allowing them to persist beyond the combustion events in
smog). Under these conditions, the concentrations of precur- which they were formed and serve as precursors for sec-
sors such as catechol and phenol correlated strongly with ondary formation of NACs, further exacerbating the warm-
those of the corresponding secondarily produced NACs (e.g. ing effects of BB episodes. In this work, NACs were found
NC and NP). Secondary formation was scrutinized using to comprise less than 2 % of the sampled aerosol by mass, so
box-model simulations of NC formation and loss to link the one might expect their overall impact to be minimal. How-
observed results to specific chemical mechanisms. The three ever, heavy pollution episodes (PMmass >100 µg m−3 ) such
peaks in the experimentally observed diurnal NC concentra- as those caused by biomass burning during wintertime may
tion profiles were attributed to variation in the production of increase the formation of NACs that can induce climate forc-
the hydroxyphenoxy radical intermediate over the course of ing and pose health hazards. There is thus a need for fur-
the day. The daytime increase in NAC levels observed in this ther research on the mechanisms of oxidation of these an-
work was higher than in previous studies, possibly because thropogenic aromatic compounds under different scenarios,
of a high production rate relative to the rate of primary loss potentially building on the classification and quantification
via OH-mediated oxidation, which in turn was considerably of NACs presented in this work, to better understand their
higher than the rate of loss via photolysis (which accounted global budgets and roles in climate forcing.
for only 10 % of the observed loss).
The individual NACs identified here were classified and
quantified based on the trends in their gas- and condensed- Data availability. The data used in this publication are available to
phase mixing ratios. Five of the 16 NACs, mainly the NP the community, and they can be accessed by request to the corre-
analogues, were classified as typical primary products of BB, sponding authors.
while 8 were classified as originating mainly from secondary
production. However, it was clear that secondary formation
processes also contributed appreciably to the observed con- Supplement. The supplement related to this article is available on-
line at: https://doi.org/10.5194/acp-21-1389-2021-supplement.
centrations of the five primary BB compounds. These contri-
butions were estimated using two approaches – the dinitro-
phenol (DNP) and levoglucosan tracer methods. Both meth-
Author contributions. MaH, MiH, and SG were the project leaders
ods indicated that primary combustion processes accounted
for this measurement campaign. CMS, MLB, RT, and HW operated
for at least 60 % of the total production of the five NACs clas- the CIMS. CMS, LL, MP, and ET performed the calibration pro-
sified as primary BB products during the regime dominated cedures and modelling/simulation experiments. WZ, LZ, and YY
by primary BB. However, the contribution of secondary pro- supported with the analysis of other inorganic and organic pollu-
cesses was clearly significant, which may explain the high tants. CMS and MaH wrote the paper. All authors commented on
observed levels of other secondary compounds. This sug-
Atmos. Chem. Phys., 21, 1389–1406, 2021 https://doi.org/10.5194/acp-21-1389-2021C. M. G. Salvador et al.: Ambient nitro-aromatic compounds 1403
the paper and were involved in the scientific interpretation and dis- ter Supersites Program, Aerosol Sci. Tech., 38, 140–155,
cussion. https://doi.org/10.1080/02786820390229084, 2004.
Cecinato, A., Di Palo, V., Pomata, D., Tomasi Scianò, M. C.,
and Possanzini, M.: Measurement of phase-distributed nitro-
Competing interests. The authors declare that they have no conflict phenols in Rome ambient air, Chemosphere, 59, 679–683,
of interest. https://doi.org/10.1016/j.chemosphere.2004.10.045, 2005.
Chen, J., Li, C., Ristovski, Z., Milic, A., Gu, Y., Islam, M.
S., Wang, S., Hao, J., Zhang, H., He, C., Guo, H., Fu, H.,
Special issue statement. This article is part of the special issue Miljevic, B., Morawska, L., Thai, P., Lam, Y. F., Pereira,
“Multiphase chemistry of secondary aerosol formation under severe G., Ding, A., Huang, X., and Dumka, U. C.: A review of
haze”. It is not associated with a conference. biomass burning: Emissions and impacts on air quality, health
and climate in China, Sci. Total Environ., 579, 1000–1034,
https://doi.org/10.1016/j.scitotenv.2016.11.025, 2017.
Chow, K. S., Huang, X. H. H., and Yu, J. Z.: Quantification of
Acknowledgements. The work was done under the framework of
nitroaromatic compounds in atmospheric fine particulate mat-
the research programme “Photochemical Smog in China”, financed
ter in Hong Kong over 3 years: field measurement evidence for
by the Swedish Research Council (2013-6917). In addition, the Na-
secondary formation derived from biomass burning emissions,
tional Natural Science Foundation of China (21677002, 41977179),
Environ. Chem., 13, 665-673, https://doi.org/10.1071/EN15174,
the National Key Research and Development Programme of China
2016.
(2016YFC0202003), and the Swedish Research Council (2018-
Day, M. C., Zhang, M., and Pandis, S. N.: Evaluation of
04430) are acknowledged for financial support.
the ability of the EC tracer method to estimate sec-
ondary organic carbon, Atmos. Environ., 112, 317–325,
https://doi.org/10.1016/j.atmosenv.2015.04.044, 2015.
Financial support. This research has been supported by the Veten- DeCarlo, P. F., Kimmel, J. R., Trimborn, A., Northway,
skapsrådet (grant nos. 2018-04430 and 2013-06917), the National M. J., Jayne, J. T., Aiken, A. C., Gonin, M., Fuhrer,
Natural Science Foundation of China (grant nos. 41977179 and K., Horvath, T., Docherty, K. S., Worsnop, D. R., and
21677002), and the National Key Research and Development Jimenez, J. L.: Field-Deployable, High-Resolution, Time-of-
Programme of China (grant no. 2016YFC0202003). Flight Aerosol Mass Spectrometer, Anal. Chem., 78, 8281–8289,
https://doi.org/10.1021/ac061249n, 2006.
The article processing charges for this open-access Delhomme, O., Morville, S., and Millet, M.: Seasonal and diurnal
publication were covered by the Gothenburg University Library. variations of atmospheric concentrations of phenols and nitro-
phenols measured in the Strasbourg area, France, Atmos. Pollut.
Res., 1, 16–22, https://doi.org/10.5094/APR.2010.003, 2010.
Review statement. This paper was edited by Daniel Knopf and re- Desyaterik, Y., Sun, Y., Shen, X., Lee, T., Wang, X., Wang,
viewed by two anonymous referees. T., and Collett Jr., J. L.: Speciation of “brown” carbon in
cloud water impacted by agricultural biomass burning in
eastern China, J. Geophys. Res.-Atmos., 118, 7389–7399,
https://doi.org/10.1002/jgrd.50561, 2013.
References Finewax, Z., de Gouw, J. A., and Ziemann, P. J.: Identification and
Quantification of 4-Nitrocatechol Formed from OH and NO3
Agency for Toxic Substances and Disease Registry: https://www. Radical-Initiated Reactions of Catechol in Air in the Presence
atsdr.cdc.gov/phs/phs.asp?id=878&tid=172 (last access: 27 Jan- of NOx: Implications for Secondary Organic Aerosol Forma-
uary 2021), 2015. tion from Biomass Burning, Environ. Sci. Tech., 52, 1981–1989,
An, Z., Huang, R.-J., Zhang, R., Tie, X., Li, G., Cao, J., Zhou, https://doi.org/10.1021/acs.est.7b05864, 2018.
W., Shi, Z., Han, Y., Gu, Z., and Ji, Y.: Severe haze in north- Gao, R., Jiang, W., Gao, W., and Sun, S.: Emission inventory of crop
ern China: A synergy of anthropogenic emissions and atmo- residue open burning and its high-resolution spatial distribution
spheric processes, P. Natl. Acad. Sci. USA, 116, 8657–8666, in 2014 for Shandong province, China, Atmos. Pollut. Res., 8,
https://doi.org/10.1073/pnas.1900125116, 2019. 545–554, https://doi.org/10.1016/j.apr.2016.12.009, 2017.
Batterman, S. A., Peng, C. Y., and Braun, J.: Levels and Gaston, C. J., Lopez-Hilfiker, F. D., Whybrew, L. E., Hadley,
composition of volatile organic compounds on commuting O., McNair, F., Gao, H., Jaffe, D. A., and Thornton, J.
routes in Detroit, Michigan, Atmos. Environ., 36, 6015–6030, A.: Online molecular characterization of fine particulate mat-
https://doi.org/10.1016/s1352-2310(02)00770-7, 2002. ter in Port Angeles, WA: Evidence for a major impact
Berndt, T. and Böge, O.: Gas-phase reaction of OH radi- from residential wood smoke, Atmos. Environ., 138, 99–107,
cals with phenol, Phys. Chem. Chem. Phys., 5, 342–350, https://doi.org/10.1016/j.atmosenv.2016.05.013, 2016.
https://doi.org/10.1039/B208187C, 2003. Geng, F. H., Tie, X. X., Xu, J. M., Zhou, G. Q., Peng, L., Gao, W.,
Cabada, J. C., Pandis, S. N., Subramanian, R., Robinson, Tang, X., and Zhao, C. S.: Characterizations of ozone, NOx, and
A. L., Polidori, A., and Turpin, B.: Estimating the Sec- VOCs measured in Shanghai, China, Atmos. Environ., 42, 6873–
ondary Organic Aerosol Contribution to PM2.5 Using the 6883, https://doi.org/10.1016/j.atmosenv.2008.05.045, 2008.
EC Tracer Method Special Issue of Aerosol Science and
Technology on Findings from the Fine Particulate Mat-
https://doi.org/10.5194/acp-21-1389-2021 Atmos. Chem. Phys., 21, 1389–1406, 20211404 C. M. G. Salvador et al.: Ambient nitro-aromatic compounds Hallquist, M., Munthe, J., Hu, M., Wang, T., Chan, C. K., Gao, J., for characterization of monoaromatic nitro-compounds in at- Boman, J., Guo, S., Hallquist, A. M., Mellqvist, J., Moldanova, mospheric particulate matter, J. Chromatogr. A, 1268, 35–43, J., Pathak, R. K., Pettersson, J. B. C., Pleijel, H., Simpson, D., https://doi.org/10.1016/j.chroma.2012.10.021, 2012a. and Thynell, M.: Photochemical smog in China: scientific chal- Kitanovski, Z., Grgić, I., Yasmeen, F., Claeys, M., and Čusak, lenges and implications for air-quality policies, Natl. Sci. Rev., A.: Development of a liquid chromatographic method based 3, 401–403, https://doi.org/10.1093/nsr/nww080, 2016. on ultraviolet–visible and electrospray ionization mass spec- Hanson, R. L., Henderson, T. R., Hobbs, C. H., Clark, C. trometric detection for the identification of nitrocatechols R., Carpenter, R. L., Dutcher, J. S., Harvey, T. M., and and related tracers in biomass burning atmospheric or- Hunt, D. F.: Detection of nitroaromatic compounds on coal ganic aerosol, Rapid Commun. Mass Sp., 26, 793–804, combustion particles, J. Tox. Env. Health, 11, 971–980, https://doi.org/10.1002/rcm.6170, 2012b. https://doi.org/10.1080/15287398309530400, 1983. Kroflič, A., Grilc, M., and Grgić, I.: Does toxicity of aromatic pollu- Harrison, M. A. J., Barra, S., Borghesi, D., Vione, D., tants increase under remote atmospheric conditions?, Sci. Rep.- Arsene, C., and Iulian Olariu, R.: Nitrated phenols in UK, 5, 8859, https://doi.org/10.1038/srep08859, 2015. the atmosphere: a review, Atmos. Environ., 39, 231–248, Laskin, A., Laskin, J., and Nizkorodov, S. A.: Chemistry of https://doi.org/10.1016/j.atmosenv.2004.09.044, 2005a. Atmospheric Brown Carbon, Chem. Rev., 115, 4335–4382, Harrison, M. A. J., Heal, M. R., and Cape, J. N.: Evaluation of the https://doi.org/10.1021/cr5006167, 2015. pathways of tropospheric nitrophenol formation from benzene Le Breton, M., Wang, Y., Hallquist, Å. M., Pathak, R. K., Zheng, J., and phenol using a multiphase model, Atmos. Chem. Phys., 5, Yang, Y., Shang, D., Glasius, M., Bannan, T. J., Liu, Q., Chan, 1679–1695, https://doi.org/10.5194/acp-5-1679-2005, 2005b. C. K., Percival, C. J., Zhu, W., Lou, S., Topping, D., Wang, Y., Hems, R. F. and Abbatt, J. P. D.: Aqueous Phase Photo-oxidation Yu, J., Lu, K., Guo, S., Hu, M., and Hallquist, M.: Online gas- of Brown Carbon Nitrophenols: Reaction Kinetics, Mechanism, and particle-phase measurements of organosulfates, organosul- and Evolution of Light Absorption, ACS Earth Space Chem., 2, fonates and nitrooxy organosulfates in Beijing utilizing a FI- 225–234, https://doi.org/10.1021/acsearthspacechem.7b00123, GAERO ToF-CIMS, Atmos. Chem. Phys., 18, 10355–10371, 2018. https://doi.org/10.5194/acp-18-10355-2018, 2018. Hoffmann, D., Iinuma, Y., and Herrmann, H.: Development Le Breton, M., Psichoudaki, M., Hallquist, M., Watne, Å. K., Lutz, of a method for fast analysis of phenolic molecular mark- A., and Hallquist, Å. M.: Application of a FIGAERO ToF CIMS ers in biomass burning particles using high performance for on-line characterization of real-world fresh and aged par- liquid chromatography/atmospheric pressure chemical ionisa- ticle emissions from buses, Aerosol Sci. Tech., 53, 244–259, tion mass spectrometry, J. Chromatogr. A, 1143, 168–175, https://doi.org/10.1080/02786826.2019.1566592, 2019. https://doi.org/10.1016/j.chroma.2007.01.035, 2007. Lee, B. H., Lopez-Hilfiker, F. D., Mohr, C., Kurtén, T., Huang, R.-J., Wang, Y., Cao, J., Lin, C., Duan, J., Chen, Q., Worsnop, D. R., and Thornton, J. A.: An Iodide-Adduct High- Li, Y., Gu, Y., Yan, J., Xu, W., Fröhlich, R., Canonaco, F., Resolution Time-of-Flight Chemical-Ionization Mass Spec- Bozzetti, C., Ovadnevaite, J., Ceburnis, D., Canagaratna, M. R., trometer: Application to Atmospheric Inorganic and Or- Jayne, J., Worsnop, D. R., El-Haddad, I., Prévôt, A. S. H., and ganic Compounds, Environ. Sci. Tech., 48, 6309–6317, O’Dowd, C. D.: Primary emissions versus secondary forma- https://doi.org/10.1021/es500362a, 2014. tion of fine particulate matter in the most polluted city (Shiji- Lin, P., Aiona, P. K., Li, Y., Shiraiwa, M., Laskin, J., Nizkorodov, S. azhuang) in North China, Atmos. Chem. Phys., 19, 2283–2298, A., and Laskin, A.: Molecular Characterization of Brown Carbon https://doi.org/10.5194/acp-19-2283-2019, 2019. in Biomass Burning Aerosol Particles, Environ. Sci. Tech., 50, Iinuma, Y., Böge, O., Gräfe, R., and Herrmann, H.: Methyl- 11815–11824, https://doi.org/10.1021/acs.est.6b03024, 2016. Nitrocatechols: Atmospheric Tracer Compounds for Biomass Lin, P., Bluvshtein, N., Rudich, Y., Nizkorodov, S. A., Laskin, Burning Secondary Organic Aerosols, Environ. Sci. Tech., 44, J., and Laskin, A.: Molecular Chemistry of Atmospheric 8453–8459, https://doi.org/10.1021/es102938a, 2010. Brown Carbon Inferred from a Nationwide Biomass Inomata, S., Yamada, H., and Tanimoto, H.: Investigation on Burning Event, Environ. Sci. Tech., 51, 11561–11570, VOC Emissions from Automobile Sources by Means of On- https://doi.org/10.1021/acs.est.7b02276, 2017. line Mass Spectrometry, Current Pollut. Rep., 2, 188–199, Lopez-Hilfiker, F. D., Mohr, C., Ehn, M., Rubach, F., Kleist, E., https://doi.org/10.1007/s40726-016-0032-6, 2016. Wildt, J., Mentel, Th. F., Lutz, A., Hallquist, M., Worsnop, D., Jenkin, M. E., Saunders, S. M., Wagner, V., and Pilling, M. J.: and Thornton, J. A.: A novel method for online analysis of gas Protocol for the development of the Master Chemical Mecha- and particle composition: description and evaluation of a Filter nism, MCM v3 (Part B): tropospheric degradation of aromatic Inlet for Gases and AEROsols (FIGAERO), Atmos. Meas. Tech., volatile organic compounds, Atmos. Chem. Phys., 3, 181–193, 7, 983–1001, https://doi.org/10.5194/amt-7-983-2014, 2014. https://doi.org/10.5194/acp-3-181-2003, 2003. Lüttke, J., Scheer, V., Levsen, K., Wünsch, G., Neil Cape, J., Kahnt, A., Behrouzi, S., Vermeylen, R., Safi Shalamzari, Hargreaves, K. J., Storeton-West, R. L., Acker, K., Wieprecht, M., Vercauteren, J., Roekens, E., Claeys, M., and Maen- W., and Jones, B.: Occurrence and formation of nitrated phe- haut, W.: One-year study of nitro-organic compounds and nols in and out of cloud, Atmos. Environ., 31, 2637–2648, their relation to wood burning in PM10 aerosol from https://doi.org/10.1016/S1352-2310(96)00229-4, 1997. a rural site in Belgium, Atmos. Environ., 81, 561–568, Mohr, C., Lopez-Hilfiker, F. D., Zotter, P., Prévôt, A. S. H., Xu, https://doi.org/10.1016/j.atmosenv.2013.09.041, 2013. L., Ng, N. L., Herndon, S. C., Williams, L. R., Franklin, J. P., Kitanovski, Z., Grgić, I., Vermeylen, R., Claeys, M., and Maenhaut, Zahniser, M. S., Worsnop, D. R., Knighton, W. B., Aiken, A. W.: Liquid chromatography tandem mass spectrometry method C., Gorkowski, K. J., Dubey, M. K., Allan, J. D., and Thorn- Atmos. Chem. Phys., 21, 1389–1406, 2021 https://doi.org/10.5194/acp-21-1389-2021
You can also read