Bacteria enhance the production of extracellular polymeric substances by the green dinoflagellate Lepidodinium chlorophorum
←
→
Page content transcription
If your browser does not render page correctly, please read the page content below

www.nature.com/scientificreports
OPEN Bacteria enhance the production
of extracellular polymeric
substances by the green
dinoflagellate Lepidodinium
chlorophorum
Pauline Roux1, Raffaele Siano2*, Karine Collin1, Gwenael Bilien3, Corinne Sinquin4,
Laetitia Marchand4, Agata Zykwinska4, Christine Delbarre‑Ladrat4 & Mathilde Schapira1
High biomasses of the marine dinoflagellate Lepidodinium chlorophorum cause green seawater
discolorations along Southern Brittany (NE Atlantic, France). The viscosity associated to these
phenomena has been related to problems in oyster cultivation. The harmful effect of L. chlorophorum
might originate from the secretion of Extracellular Polymeric Substances (EPS). To understand
whether the EPS are produced by L. chlorophorum or its associated bacteria, or if they are a product
of their interaction, batch cultures were performed under non-axenic and pseudo-axenic conditions
for three strains. Maximum dinoflagellate cell abundances were observed in pseudo-axenic cultures.
The non-sinking fraction of polymers (Soluble Extracellular Polymers, SEP), mainly composed of
proteins and the exopolysaccharide sulphated galactan, slightly increased in pseudo-axenic cultures.
The amount of Transparent Exopolymer Particles (TEP) per cell increased under non-axenic conditions.
Despite the high concentrations of Particulate Organic Carbon (POC) measured, viscosity did not
vary. These results suggest that the L. chlorophorum-bacteria interaction could have a detrimental
consequence on the dinoflagellate, translating in a negative effect on L. chlorophorum growth, as
well as EPS overproduction by the dinoflagellate, at concentrations that should not affect seawater
viscosity.
Green seawater discolorations have been recorded in Southern Brittany (North East Atlantic, France) every year
since 19821. These phenomena are the consequences of a massive development of the green dinoflagellate Lepido-
dinium chlorophorum2,3, a species characterised by bright green plasts inherited from a secondary endosymbiosis
with a chlorophyte4–6. Lepidodinium chlorophorum is not known to produce toxigenic substances for humans or
marine fauna. However, blooms of the species have been associated with mass mortalities of fishes and cultured
bivalves7,8. The potential harmful effect of L. chlorophorum blooms in coastal waters remains to be elucidated,
as well as the phenology and physiology of this peculiar dinoflagellate, which have barely been studied so far.
Under laboratory conditions, L. chlorophorum excretes a large amount of Transparent Exopolymer Particles
(TEP)9, which are defined as particles (size > 0.22 μm) stainable with Alcian B lue10,11. These particles are the
result of TEP-precursor aggregation, mainly composed of exopolysaccharides. The TEP are composed of a large
amount of carbon and may play a key role in biogeochemical cycling and in the structure and function of the
pelagic food chain12,13. Indeed, TEP aggregations tend to accelerate the sedimentation of organic matter from the
surface to the seabed14–16 and can increase seawater viscosity11,17. The TEP accumulations during blooms of L.
chlorophorum in both the seabed and in the water column may create microenvironments promoting bacterial
activity18–20, followed by high organic carbon degradations and potential anoxia conditions, likely causing fauna
mortalities. As a consequence, the high production of TEP by this bloom-forming dinoflagellate could result in
an indirect harmful property of L. chlorophorum.
The TEP, together with Soluble Extracellular Polymers (SEP) corresponding to non-sinking fraction of poly-
mers, constitute the Extracellular Polymeric Substances (EPS) produced by some marine m icroorganisms21.
The SEP control the floc formation rate and directly influence aggregate f ormation11; it therefore contributes,
1
Ifremer, LITTORAL, 44300 Nantes, France. 2Ifremer, DYNECO, 29280 Plouzané, France. 3Ifremer, LITTORAL,
29900 Concarneau, France. 4Ifremer, BRM, 44300 Nantes, France. *email: raffaele.siano@ifremer.fr
Scientific Reports | (2021) 11:4795 | https://doi.org/10.1038/s41598-021-84253-2 1
Vol.:(0123456789)
www.nature.com/scientificreports/
as TEP, to the modification of seawater viscosity. Beyond L. chlorophorum, other species belonging to different
phytoplankton classes produce TEP, such as other dinoflagellates11, diatoms11,22–25, prymnesiophyceae11,25–27 and
cyanobacteria28,29. However, phytoplankton is not the only source of EPS in oceans. Indeed, many studies have
demonstrated the exudation of exopolysaccharides by marine bacteria30–32. Marine microorganisms produce
EPS to promote microbial a dhesion33 and/or to release metabolic-excess waste p roducts34. Therefore, EPS can
promote the formation of microalgae aggregates, initiate cell adhesion to a substrate and create biofilm m atrix35.
Furthermore, EPS can protect cells against dewatering and toxic substances and can serve as energy and carbon
sinks responding to stress32. The EPS produced by microorganisms are mainly composed of exopolysaccharides,
proteins (enzymes and structural proteins), nucleic acid (DNA) and l ipids21,32,34. Humic substances and inorganic
components are also found within EPS. Specifically, exopolysaccharides produced by bacteria consist of mannose
(Man), rhamnose (Rha), glucose (Glc), galactose (Gal) and galacturonic acid (GalA)21,32,34; they are characterised
by a high proportion of uronic a cid31. The protein fraction interacts with polysaccharides and other components
to form a stable extracellular matrix. For example, sulphates can generate flocs in the presence of deoxy s ugars36.
The production and composition of EPS is influenced by various factors including species, strain, substrate
type, nutrient availability, environmental conditions (temperature, pH, shear force and salinity), physiology and
age of the c ulture32. Laboratory studies have shown a high variability among species in terms of the quantity of
EPS produced9,11,32,37. For a given species, the amount of TEP produced strongly depends on its environmental
growing conditions. Indeed, previous studies have shown an increase in TEP production with an increase in
temperature9,38, a limitation by n utrients11,30,39,40 or an increase in C ressure41. The physiological state
O2 partial p
of the cells can also strongly condition the quantity of TEP produced, as a close relationship has been established
between TEP formation and cell death processes42. Moreover, a study suggested the importance of bacteria as
mediators of bacteria-associated TEP formation coupled to the supply of usable dissolved organic matter, includ-
ing TEP p recursors43. Lepidodinium chlorophorum may be listed among the species capable of producing high
amounts of TEP9. However, the production of TEP by L. chlorophorum cultures has been demonstrated only
under non-axenic conditions9. To the best of our knowledge, no study has investigated the relative contribution,
if any, to the EPS production by this dinoflagellate and its associated bacteria. Given that both dinoflagellate and
bacteria may produce EPS, it is questionable which microorganism is responsible for EPS production in both
natural and cultivated L. chlorophorum—bacterial consortia or whether the interaction between both microor-
ganisms can cause an increase in EPS production.
With the aim of identifying the source of EPS production among L. chlorophorum and its associated bacteria,
we used batch cultures of three strains cultivated under pseudo-axenic (PA) and non-axenic (NA) conditions.
We estimated the concentration of TEP at different growth phases under both culture conditions. To further
investigate the EPS, for the first time, the SEP was characterised by the contents in proteins, polysaccharides
and inorganic compounds, such as sulphur. Finally, we investigated the potential impact of EPS produced by
L. chlorophorum on viscosity in culture to better understand the consequences of L. chlorophorum blooms on
ecosystem functioning and potential bloom-associated oyster mortalities.
Results
Antibiotic protocol. Our axenization protocol did not result in a complete removal of bacteria from the
cultures. This process allowed to drastically reduce the number of bacteria per cell of dinoflagellate, which
decreased from 1030 ± 199 in the non-axenic culture (NA) to 104 ± 2 bacteria c ell−1 after axenization for the
strain RCC1489. For L. chlorophorum KL1C4, 1639 ± 443 bacteria c ell−1 were enumerated in the NA culture
against only 80 ± 1 bacteria cell−1 after axenization. Therefore, 90 and 95% of bacteria per cell could be eliminated
via axenization in RCC1489 and KL1C4 cultures, respectively. For L. chlorophorum MAR1D2, the number of
bacteria per cell decreased from 204 ± 10 in NA conditions to 121 ± 17 bacteria c ell−1 after axenization. Over-
all, 41% of bacteria were removed per cell. We therefore assume that our experiments were conducted under
pseudo-axenic conditions (PA) (see Supplementary Table S1).
Lepidodinium chlorophorum growth. Lepidodinium chlorophorum growth was analysed for all three
strains in both NA and PA culture conditions (Fig. 1). For the NA condition (Fig. 1A), similar maximum L. chlo-
rophorum concentrations were observed for RCC1489 (1.4 × 10⁴ ± 646 cells mL−1), KL1C4 (1.2 × 10⁴ ± 462 cells
mL−1) and MAR1D2 (1.4 × 10⁴ ± 1549 cells mL−1). For the PA condition (Fig. 1B), the maximum abundance of L.
chlorophorum was twice as high as that of the NA condition (RCC1489: 2.2 × 10⁴ ± 577; KL1C4: 2.4 × 10⁴ ± 390;
MAR1D2: 2.4 × 10⁴ ± 492 cells mL−1) (p = 0.05 for each strain, one-tailed Wilcoxon signed-rank test). For the
NA condition, the maximum bacterial concentration varied between strains, with the MAR1D2 concentration
(3 × 10⁶ ± 1 × 10⁵ bacteria m
L−1) being lower than those of RCC1489 (7 × 10⁶ ± 2 × 10⁵ bacteria m L−1) and
6 5 −1
KL1C4 (9 × 10 ± 3 × 10 bacteria mL ) (Fig. 1A). In PA cultures, bacterial growth slowed down, and maximum
bacterial concentrations (≈ 2 × 10⁶ bacteria mL−1) remained lower than the minimal values observed in NA for
the three strains (Fig. 1). Despite the difference in dinoflagellate cell max and bacterial cell numbers, L. chloro-
phorum growth rates (µ), calculated during the exponential phase under NA and PA conditions, were similar
for all strains and conditions, ranging from 0.24 to 0.31 day−1. Over time, the maximum quantum efficiency
of the photosystem II (FV/FM) ranged from 0.55 ± 0.00 to 0.72 ± 0.02 (see Supplementary Table S2). These are
near-optimal values obtained for chlorophyll b containing organisms44,45. No significant difference was observed
regarding (FV/FM) values between NA and PA conditions (p = 0.8 for RCC1489; p = 0.3 for KL1C4; p = 0.2 for
MAR1D2, two-tailed Wilcoxon signed-rank test). These results indicate a high photosystem II efficiency and,
consequently, a good photo-physiological status of the cells throughout the experiment in all culture conditions
and for the three studied strains.
Scientific Reports | (2021) 11:4795 | https://doi.org/10.1038/s41598-021-84253-2 2
Vol:.(1234567890)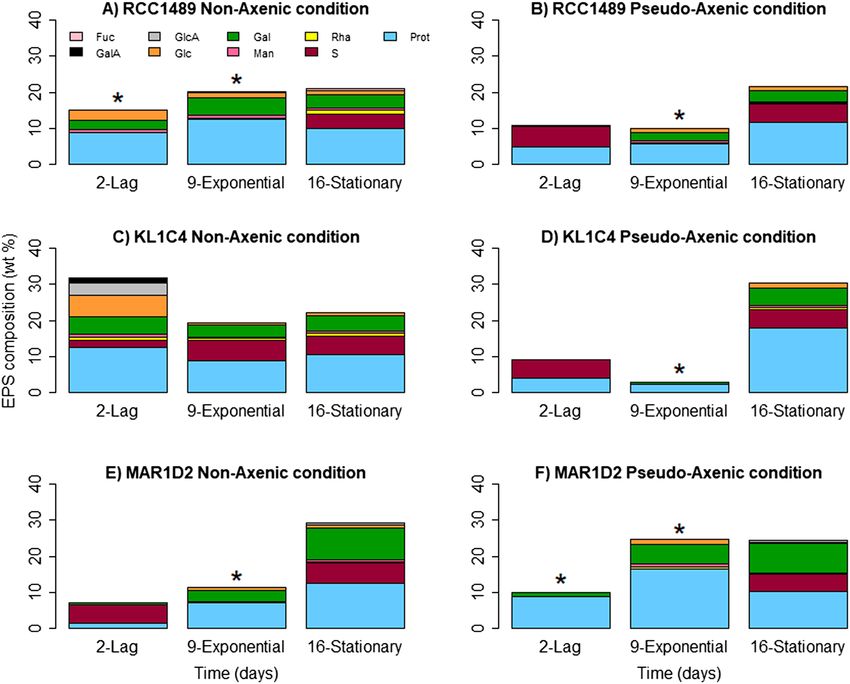
www.nature.com/scientificreports/
Figure 1. Lepidodinium chlorophorum concentrations (cell m L−1; solid lines) and bacterial concentrations
(bacterial cell mL−1; dashed lines) for the three L. chlorophorum strains analysed under (A) non-axenic (NA)
and (B) pseudo-axenic (PA) culture conditions. Symbols represent means and error bars represent the standard
deviations from triplicate cultures.
EPS characterisation. For all strains, the TEP concentration increased significantly between the lag and sta-
tionary phases (p = 0.02 for each strain, two-tailed Kruskal Wallis test) under both NA and PA conditions (Fig. 2).
Similar maximum TEP concentrations were observed under the NA condition for RCC1489 (17.4 ± 1.2 mg Xeq
L−1), KL1C4 (15.8 ± 2.1 mg Xeq L −1) and MAR1D2 (17.2 ± 4.9 mg Xeq L −1) (Fig. 2A) and under the PA condition
(RCC1489: 9.9 ± 0.9; KL1C4: 11.1 ± 1.5; MAR1D2: 14.7 ± 5.1 mg Xeq L −1) (Fig. 2B). For all strains, no statisti-
cally significant difference was observed regarding TEP concentrations between NA and PA conditions (p = 0.1
for RCC1489; p = 0.1 for KL1C4; p = 0.7 for MAR1D2, two-tailed Wilcoxon signed-rank test) (Fig. 2A,B). This
allows to hypothesize that dinoflagellate cells are the main producer of TEP and that bacterial TEP production is
negligible. In addition, similar maximal particulate organic carbon (POC) concentrations were observed under
the NA condition for RCC1489 (20.4 ± 0.2 mg L −1), KL1C4 (18.6 ± 0.5 mg L −1) and MAR1D2 (17.5 ± 0.8 mg L −1)
−1
and under the PA condition (RCC1489: 16.8 ± 0.8; KL1C4: 16.9 ± 0.1; MAR1D2: 16.9 ± 1.1 mg L ) (see Supple-
mentary Table S2). Assuming that majority of TEP production is ascribable to dinoflagellate, we can estimate
maximum TEP production per dinoflagellate cell. This value did not vary among strains. Values ranged between
1.3 × 10⁻⁶ ± 2.5 × 10⁻⁷ for MAR1D2 and 2.4 × 10⁻⁶ ± 1.5 × 10⁻⁷ mg Xeq c ell−1 for KL1C4 under the NA condition
(Fig. 2C) and between 7.3 × 10⁻⁷ ± 6.2 × 10⁻⁸ for KL1C4 and 9.2 × 10⁻⁷ ± 1.4 × 10⁻⁷ mg Xeq cell−1 for MAR1D2 in
PA cultures (Fig. 2D). While no significant differences were observed among strains, maximum TEP per cell was
significantly higher under NA than under PA for all three strains (p = 0.05 for each strain, one-tailed Wilcoxon
signed-rank test) (Fig. 2C,D). For the strain RCC1489, TEP production per microalgal cell remained constant
over time under both NA and PA conditions. In fact, no significant differences were observed among growth
phases (p = 0.06, two-tailed Kruskal Wallis test) (Fig. 2C,D). In contrast, for strain KL1C4, TEP per dinoflagellate
cell decreased significantly between lag and exponential phases (p = 0.02, two-tailed Kruskal Wallis test) under
both NA and PA conditions (Fig. 2C,D). A different pattern was observed for strain MAR1D2. While TEP per
microalgal cell remained constant over time under NA conditions (Fig. 2C), a significant decrease was observed
between lag and exponential phases under PA conditions (p = 0.03, two-tailed Kruskal Wallis test) (Fig. 2D).
During the stationary phase, SEP yields were higher under PA than under NA conditions for the three strains.
For all strains under both NA and PA conditions, SEP yields increased over time except for the strain KL1C4
under NA conditions (Table 1). The SEP yields in L. chlorophorum culture supernatants were characterised for
protein, sugar and sulphur contents (Fig. 3). The analyses revealed that SEP were mainly composed of proteins
(< 20%), followed by neutral sugars (< 10%) and sulphur (3–6%). The composition of SEP was similar for the three
strains. Their composition varied only slightly between different growth phases, under both NA (Fig. 3A,C,E)
and PA conditions (Fig. 3B,D,F). Amongst neutral sugars, Gal was present in high amounts in SEP of all strains.
The highest Gal content was detected in SEP from MAR1D2 in the stationary phase, in both NA (8.9 wt% Gal)
and PA (8.2 wt% Gal) conditions. Traces of other neutral sugars such as Glc, Man, Rha and fucose (Fuc) were
also detected in several samples. Anionic sugars, glucuronic acid (GlcA) and GalA, were only observed for SEP
in the KL1C4 strain under NA conditions (Fig. 3C), and their presence could be explained by contamination of
the supernatant by bacterial cell membranes during sample preparation. A similar composition was obtained
for SEP closely associated with L. chlorophorum cells solubilised from pellets (see Supplementary Table S3).
The amount of sulphur detected in the samples was similar for each strain and independent from the growth
phase. Sulphur can be associated with sugars and proteins. SEP from RCC1489 and KL1C4 strains were only
Scientific Reports | (2021) 11:4795 | https://doi.org/10.1038/s41598-021-84253-2 3
Vol.:(0123456789)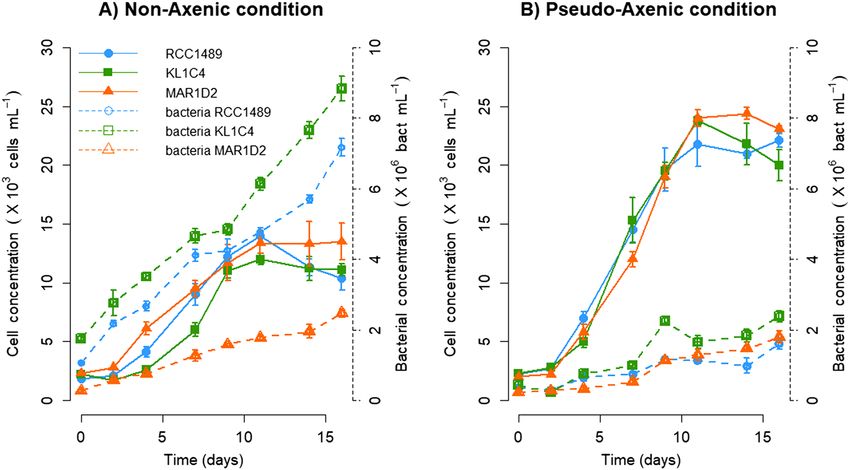
www.nature.com/scientificreports/
Figure 2. Mean TEP concentrations (mg Xeq L−1) measured under (A) non-axenic (NA), (B) pseudo-axenic
(PA) conditions and mean cell normalised TEP production (mg Xeq c ell−1) estimated under (C) NA, (D)
PA conditions for the three L. chlorophorum strains during the different growth phases. Error bars represent
standard deviation (n = 3).
L. chlorophorum strains
RCC1489 KL1C4 MAR1D2
Condition NA PA NA PA NA PA
Mean Y (g L−1)
Lag 7.8 × 10⁻³ nd 1.8 × 10⁻² nd 9.9 × 10⁻³ 2.2 × 10⁻³
–3 –3 –2 –2 –3
Exponential 8.1 × 10 5.2 × 10 1.2 × 10 1.2 × 10 8.0 × 10 6.4 × 10⁻³
–2 –2 –2 –2 –2
Stationary 1.8 × 10 5.5 × 10 1.3 × 10 3.6 × 10 4.4 × 10 4.7 × 10⁻²
Table 1. SEP yields (Y; g L−1) from culture supernatants for the three L. chlorophorum strains during the
different growth phases under non-axenic (NA) and pseudo-axenic (PA) conditions. nd not determined
because values were overestimated due to the presence of salts.
composed of proteins and sulphur at the lag phase (Fig. 3B,D). To deepen the SEP characterisation under NA
and PA conditions, HPSEC-MALS analyses were performed (Fig. 4). Several peaks were observed on HPSEC
elution profiles of proteins (followed by UV detector), suggesting the presence of several protein populations (see
Supplementary Table S4). Although HPSEC profiles were similar among the three L. chlorophorum strains at dif-
ferent growth phases, they clearly varied between NA and PA conditions. Only in NA cultures, protein aggregates
of high molecular weight were produced (≥ 1,000,000 g mol−1, Supplementary Table S4). Less heterogeneous
protein populations were observed in PA cultures. These proteins were mainly of medium and low molecular
weights. In contrast to proteins, HPSEC profiles of polysaccharides (RI detector, Supplementary Figure S1) were
similar in both culture conditions for the three L. chlorophorum strains. Three main peaks were distinguished
(see Supplementary Table S4), highlighting the presence of three polysaccharide fractions of high molecular
(> 1,000,000 g mol−1), medium and low molecular weights. Similar polysaccharides were produced in either
Scientific Reports | (2021) 11:4795 | https://doi.org/10.1038/s41598-021-84253-2 4
Vol:.(1234567890)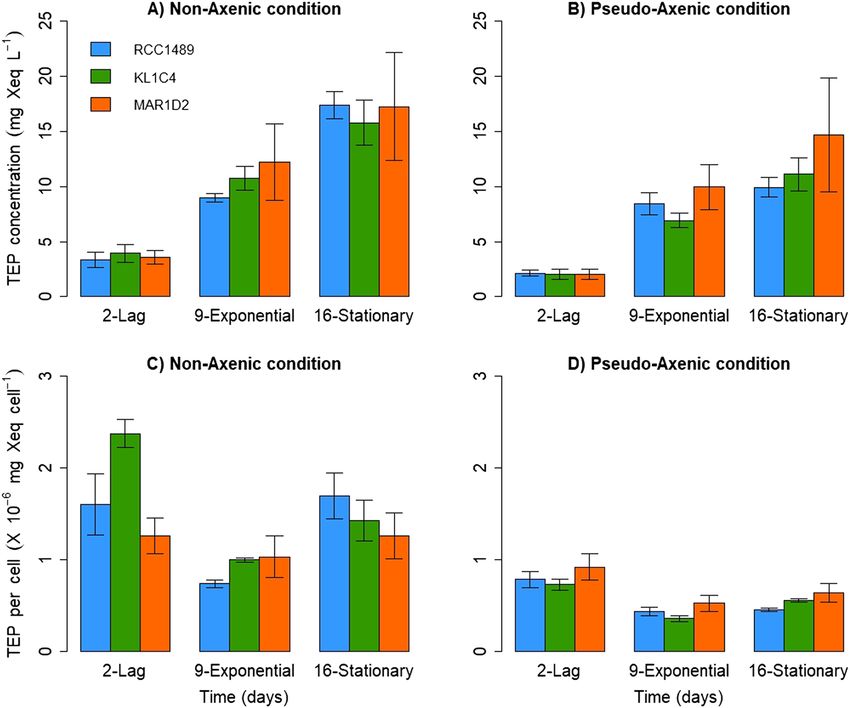
www.nature.com/scientificreports/

                                  Figure 3.  Monosaccharide composition, proteins and sulphate (wt %) of SEP from supernatants, at three
                                  growth times, for all three L. chlorophorum strains under non-axenic (NA) conditions: (A) RCC1489, (C)
                                  KL1C4, (E) MAR1D2 and pseudo-axenic (PA) conditions: (B) RCC1489, (D) KL1C4, (F) MAR1D2 (n = 1).
                                  Prot proteins, S sulphur, Rha rhamnose, Man mannose, Gal galactose, Glc glucose, GlcA glucuronic acid, GalA
                                  galacturonic acid, Fuc fucose. *Samples were not analysed for their sulphur content due to insufficient sample
                                  amount for elementary analysis.

                                  NA or PA conditions, with slightly higher amounts under NA. Some protein and polysaccharide peaks eluted
                                  at the same time from HPSEC-MALS might suggest the existence of glycoproteins or the presence of proteins
                                  and polysaccharides linked together by ionic interactions. To assess whether the polymers are polysaccharides,
                                  proteins or glycoprotein conjugates, we analysed SEP components from stationary phases on SDS-PAGE and
                                  agarose gel electrophoresis (see Supplementary Figure S2). No difference between NA and PA conditions and
                                  between strains was observed. Despite Sypro Ruby sensitive staining for proteins, none of them was observed in
                                  the samples. Proteins quantified in the samples by colorimetric assay and HPSEC-MALS could not be revealed
                                  by different staining techniques, which leads us to infer that protein aggregates could not enter into the gel and
                                  migrate properly prior to be detected by staining. However, electrophoresis allowed to assess the presence of a
                                  polysaccharidic fraction that was clearly stained by Stains-All cationic dye. The migration of this polysaccharide
                                  in electrophoresis, suggests the presence of sulphated galactose polymer, such as sulphated galactan. Indeed,
                                  similar migration patterns were observed for galactan sulphate and dextran sulphate used as references.

                                  Viscosity changes in seawater. Under both conditions, the maximum viscosity excess (ɳ) for all L. chlo-
                                  rophorum strains was 2.7% ± 0.4–0.5 (Table 2). No difference was observed between the excess of viscosity under
                                  NA and PA conditions during cell growth.

                                  Comparison between non‑axenic (NA) and pseudo‑axenic (PA) conditions. Principal Compo-
                                  nents Analysis (PCA), computed on all data collected (see Supplementary Table S2), summarises the differ-
                                  ences between NA and PA culture conditions (Fig. 5). The PCA described 79.6% of the total variance along
                                  two principal dimensions (Dim1 and Dim2). The Dim1 explained L. chlorophorum cell and bacteria concentra-
                                  tions, [TEP] and [POC] as well as [NO−   3 +NO2 ] and [PO4 ]. [TEP] was positively correlated with [POC], while
                                                                                  −           3−

                                  [NO− 3 +NO  −
                                              2 ] and  [ PO3−
                                                           4  ] were negatively correlated with L. chlorophorum cell, [TEP] and [POC]. In our PCA
                                  analysis, [NH+ 4 ] was the variable most correlated with Dim2. For strains RCC1489 and KL1C4, PCA provided a

Scientific Reports |   (2021) 11:4795 |                https://doi.org/10.1038/s41598-021-84253-2                                                  5

                                                                                                                                             Vol.:(0123456789)
www.nature.com/scientificreports/
Figure 4. HPSEC profiles (with UV and RI detectors) of culture supernatants obtained for three L.
chlorophorum strains, at three growth times, under non-axenic (NA) conditions: (A) RCC1489, (C) KL1C4, (E)
MAR1D2 and pseudo-axenic (PA) conditions: (B) RCC1489, (D) KL1C4, (F) MAR1D2 [Astra 6.1 Software
(WYATT TECHNOLOGY)].
L. chlorophorum strains
RCC1489 KL1C4 MAR1D2
Condition NA PA NA PA NA PA
Mean ɳ (%)
Lag ± S.D 2.1 ± 0.4 0.8 ± 0.4 2.7 ± 0.4 1.6 ± 0.2 0.6 ± 0.5 1.1 ± 0.4
Exponential ± S.D 2.7 ± 0.4 1.6 ± 0.3 1.6 ± 1.1 2.6 ± 0.4 2.7 ± 0.5 0.1 ± 0.2
Stationary ± S.D 2.0 ± 0.4 2.4 ± 1.6 2.0 ± 0.4 2.4 ± 0.8 0.8 ± 0.3 0.8 ± 0.3
Table 2. Mean relative excess viscosity ɳ (%) during each growth phase under non-axenic (NA) and pseudo-
axenic (PA) conditions (n = 9) for the three studied L. chlorophorum strains (RCC1489, KL1C4 and MAR1D2).
clear distinction between samples under NA and PA conditions (Fig. 5). Indeed, NA conditions were positively
associated with higher concentrations of bacteria and ammonium, in particular during the stationary phase of L.
chlorophorum growth. In contrast, PA conditions were positively associated with lower bacterial concentrations
and higher L. chlorophorum cell concentrations (Fig. 5). [TEP] and [POC] were similar under NA and PA condi-
tions. Relative viscosity excess, used as an illustrative variable, was not correlated with any culture condition. For
strain MAR1D2, PCA did not provide a clear distinction between samples under NA and PA conditions because
initial bacterial concentrations were lower than those of other strains under NA condition.
Scientific Reports | (2021) 11:4795 | https://doi.org/10.1038/s41598-021-84253-2 6
Vol:.(1234567890)www.nature.com/scientificreports/
Figure 5. PCA, applied on the dataset (see Supplementary Table S2), summarising the similarities and
differences between non-axenic (NA) and pseudo-axenic (PA) samples. Dim1 and Dim2 together describe
79.6% of the total variance. Black arrows are quantitative variables used to calculate PCA: bacterial cell
concentration ([bacteria] in bacteria cells mL−1: Dim1 = 0.65; Dim2 = 0.61); dinoflagellate cell concentration
L−1: Dim1 = 0.70; Dim2 = − 0.60); TEP concentration ([TEP] in mg Xeq L
([Cell] in cells m −1: Dim1 = 0.89;
−1
Dim2 = 0.03); particulate organic carbon concentration ([POC] in mg L : Dim1 = 0.96; Dim2 = − 0.03);
nitrogen ([NO3+NO2] in µM: Dim1 = − 0.92; Dim2 = 0.31), phosphate ([PO4] in µM: Dim1 = − 0.85; Dim2 = −
0.07) and ammonium concentrations ([NH4] in µM: Dim1 = 0.39; Dim2 = 0.64). Dashed blue arrows are
illustrative variables: time ([Days] in numbers) and relative excess viscosity ([Viscosity] in percentage). Strains
were represented as follows: RCC1489 (blue circles), KL1C4 (green squares) and MAR1D2 (orange triangle)
under NA (filled symbols) and PA conditions (open symbols). Larger symbols (barycentre of each group) and
confidence ellipses (95% confidence interval) allowed to distinguish NA (black ellipse) and PA (grey ellipse)
conditions.
Discussion
Interactions between phytoplankton and heterotrophic bacteria can be mutualistic, competitive or p arasitic46–49
and can be regulated by algicidal a ctivities50. Our results show that similar rates (ranging from 0.24 to 0.31 day−1)
and any limitation by nutrients characterised the growth of L. chlorophorum under both NA and PA conditions.
However, L. chlorophorum maximum abundances were twice as high in PA than in NA conditions. The antibi-
otic treatment under PA condition at the beginning of our experiment did not affect the photo-physiological
capacities of L. chlorophorum, since (Fv/Fm) values remained sufficiently high (> 0.55) throughout the experi-
ment without any variation between PA and NA conditions. Indeed, penicillin and streptomycin, used in our
treatment, had already shown that an effective bacteriostatic effect did not affect phytoplankton growth51–54. We
suggest that in our culture conditions, bacteria might have negatively affected L. chlorophorum growth, reducing
the maximal cell concentrations reachable by our L. chlorophorum strains. Indeed, bacteria can strongly affect
the growth rate and the maximal biomass reached at the stationary phase of microalgae55–57. Guerrini et al.58
observed an 80% decrease in the cell density of Cylindrotheca fusiformis in the presence of bacteria. The algicide
effect on microalgae might be caused by the bacterial production of active molecules, as previously reported,
such as thermostable benzoic acid produced by the bacterium Thalassospira sp. ZR-2 against the dinoflagellate
Karenia mikimotoi59, chitinase from Chitinimonas prasina LY03 on Alexandrium tamarense60 and deinoxanthin
produced by Deinococcus xianganensis Y35, inhibiting the dinoflagellate A. tamarense61. Furthermore, Lovejoy
et al.62 observed that unarmoured gymnodinoid dinoflagellates (including Gymnodinium catenatum) were more
sensitive to algicidal bacteria than armoured dinoflagellates (Alexandrium minutum and A. catenella). For L.
chlorophorum as well, the absence of theca could facilitate the negative effect of algicidal bacteria. Our study
Scientific Reports | (2021) 11:4795 | https://doi.org/10.1038/s41598-021-84253-2 7
Vol.:(0123456789)www.nature.com/scientificreports/
TEPmax
Species, strain Class (mg Xeq L
−1) References
Chaetoceros affinis, CCMP 159 1.1 Passow11
Chaetoceros sp., NS isolate Bacillariophyceae 2.8 Passow11
Chaetoceros sp., UNC 1201 ~ 1.1 Burns et al.25
Coscinodiscus granii, AS isolate Bacillariophyceae 13.2 Fukao et al.37
Skeletonema sp., AS isolate Bacillariophyceae 22.4 Fukao et al.37
Eucampia zodiacus, AS isolate Bacillariophyceae 16.9 Fukao et al.37
Melosira nummuloides, NS isolate Bacillariophyceae 0.3 Passow11
Nitzschia sp., SBC isolate Bacillariophyceae 3.2 Passow11
Rhizosolenia calcar-avis, CCMP 1518 0.4 Passow11
Bacillariophyceae
Rhizosolenia setigera, AS isolate 23.5 Fukao et al.37
Stephanopyxis turris, CCMP 815 Bacillariophyceae 9.3 Passow11
Thalassiosira nordenskioeldii, OW isolate 1.5 Nosaka et al.24
Thalassiosira pseudonana, CCMP 1335 ~ 0.8 Burns et al.25
Thalassiosira rotula, Meunier, NS isolate Bacillariophyceae 0.6 Passow11
Thalassiosira sp., UNC 1203 ~ 0.7 Burns et al.25
Thalassiosira weissflogii, CCMP 1336 0.4 Gärdes et al.23
Emiliania huxleyi, non-calcifying strain, PML 92d Prymnesiophyceae 0.7 Passow11
Phaeocystis globosa, CCMP 2754 Prymnesiophyceae ~ 0.5 Burns et al.25
Gonyaulax polyedra, CCMP 406 Dinophyceae 0.3 Passow11
Tetraselmis suecica, NS isolate Chlorodendrophyceae 0.9 Passow11
Prochlorococcus marinus, RCC 0156 Cyanophyceae 1.5 Iuculano et al.29
Table 3. Maximum TEP concentration (TEPmax; mg Xeq L−1) produced by different phytoplankton species
grown in cultures (mostly non-axenic). CCMP Provasoli-Guillard National Center for Culture of Marine
Phytoplankton, PML Plymouth Marine Laboratory, UNC University of North Carolina, RCCRoscoff Culture
Collection, NS North Sea isolate, SBC isolated from the Santa Barbara Channel, off California, AS Ariake
Sound isolate (Japan), OW Oyashio Waters (Japan).
contributes to the understanding of the interactions between dinoflagellate and bacteria, evidencing a complex
relationship between the dinoflagellate L. chlorophorum and its associated bacterial consortia. However, before
concluding on this relationship, varied culture conditions, bacterial isolation and specific observation of the
dinoflagellate phycosphere should be investigated.
Total TEP concentrations were similar under both NA and PA conditions for the three L. chlorophorum culti-
vated strains throughout the dinoflagellate growth phases. The SEP yields were higher under PA than under NA
conditions. If bacteria had contributed to the EPS production in our culture conditions, we would expect to find
higher TEP and SEP concentrations in NA conditions. Hence, our study suggests that L. chlorophorum was the
main producer of EPS in this dinoflagellate-bacteria consortium. In this study, the maximal TEP concentration
produced by L. chlorophorum was about 17.4 mg Xeq L −1, one of the highest concentrations ever measured in
monospecific phytoplankton cultures (Table 3). Moreover, similar maximum TEP concentrations were observed
for all strains, suggesting that TEP production was not dependent on intraspecific variability. However, the three
strains had been isolated on the French Atlantic coast, while L. chlorophorum has been observed in other coun-
tries in E urope63 as well as in Chile64, California65 and Australia66. Therefore, the variation in TEP production
among strains could be due to biogeographical issues. To answer this question, strains from different environ-
ments, localities and latitudes should be analysed.
In NA conditions, L. chlorophorum cell abundances were lower and the TEP amount produced per dinoflag-
ellate cell was higher. This suggests that bacteria, in addition to having an algicidal effect on L. chlorophorum
growth, induce the overproduction of TEP. In vitro data from this study confirm the observations reported by
Passow11 that bacteria do not generate significant amounts of TEP in situ, but that high bacterial concentrations
may induce high TEP production rates by phytoplankton67,68. For example, bacteria may contribute to the genera-
tion of TEP by enzymatic hydrolysis of diatom surface mucus69. Therefore, bacterial activity may stabilise TEP
and increase accumulation rates69. In order to establish a carbon footprint in L. chlorophorum, TEP produced
per cell (mg Xeq c ell−1) was converted to carbon, following the work of Engel and P assow70. These conversions
allowed the estimation of the percentage of carbon which was excreted in the form of TEP under NA and PA
conditions. Conversion factors of 0.8 and 0.7, respectively, were calculated for NA and PA conditions according to
Engel and Passow equations70. Under the NA condition, 62–76% of carbon were excreted in the form of TEP for
the three strains at day 9 of the cell culture. This result corroborates the percentage found by Claquin et al.9 who
measured, in non-axenic conditions, that for the RCC1489 strain, 70.8% of carbon were excreted as TEP. Under
PA conditions, only 43–61% of carbon were excreted as TEP for all three strains. This result suggests that a higher
proportion of the carbon fixed by photosynthesis would be allocated to TEP excretion under NA conditions.
Scientific Reports | (2021) 11:4795 | https://doi.org/10.1038/s41598-021-84253-2 8
Vol:.(1234567890)www.nature.com/scientificreports/
For the first time, we characterised SEP produced by L. chlorophorum, which were mainly composed of pro-
teins and exopolysaccharides, namely sulphated galactan. The total amount of analysed molecules was limited to
a maximum of 30% (w/w) of the dry mass. The analysis of non-purified samples always gives incomplete results.
Indeed, gas chromatography analysis of the sugar composition involves a hydrolysis step and a derivatization
step to make the compounds volatile. Therefore, the hydrolysis might be incomplete, driving under-evaluated
amounts. In addition, the presence of macromolecules in the water-soluble extracts, especially the polyanionic
ones, might hinder the total elimination of salt. Nevertheless, galactose represented the main monosaccharide
component with proteins and sulphur. The composition of the SEP produced by dinoflagellates is still poorly
known. Some studies have focused more specifically on the composition of exopolysaccharides. The presence
of Gal residues seems to be a common feature of dinoflagellate exopolysaccharides. Hasui et al.71 demonstrated
that the marine dinoflagellate Margalefidinium polykrikoides (cited as Cochlodinium polykrikoides) produced
sulphated exopolysaccharides mainly composed of Man, Gal, Glc and uronic acid. Yim et al.72 characterised the
exopolysaccharide produced by the marine dinoflagellate Gyrodinium impudicum KG03 and found that it was
highly sulphated and mainly composed of Gal residues. In 2011, Mandal et al.73 showed that the toxic dinoflagel-
late Amphidinium carterae produced an exopolysaccharide composed of Gal and Glc residues. Our results suggest
that L. chlorophorum could also produce a sulphated exopolysaccharide composed mainly of Gal, suggesting that
galactose-based exopolysaccharide is a common characteristic among dinoflagellates.
It is questionable whether the high production of EPS, and in particular of TEP, could bring biological and/
or ecological benefits to L. chlorophorum or if this production is a signal of cellular stress. The TEP production
by phytoplankton has been classically described as a consequence of nutrient s tress11,39,40. However, dinoflagel-
late cells were not limited by nutrients in our culture condition or in those previously tested on this s pecies9.
The experimentation in nutrient-depleted cultures is needed to verify if the higher EPS production results from
nutrient stress in L. chlorophorum culture. In addition, for a given species, the amount of TEP produced strongly
depends on other abiotic parameters, especially temperature9,38 and partial CO2 pressure41. Light and temperature
were constant during our experiment, and pH did not vary between the two culture conditions, suggesting that
the evolution of partial C O2 pressure was similar under NA and PA conditions. The mucoid phase could protect L.
chlorophorum cells against algicidal compounds produced by bacteria. Indeed, EPS can protect cells against toxic
substances and can serve as energy and carbon source in stress responses32. This hypothesis seems to follow the
higher production of TEP per cell that we measured for L. chlorophorum in the presence of bacteria. Waiting for
new experiments in cellular stress conditions, we can conclude so far that the EPS production by L. chlorophorum
is a response to a potential algicidal effect of bacteria present in cultures of the dinoflagellate. Nevertheless, in
order to validate our hypothesis, culture experiments under axenic condition are needed.
Recent studies have shown that exopolymers produced by phytoplankton can strongly increase the viscosity
of seawater17,74,75. In situ, Seuront et al.76 demonstrated that the increase in viscosity ranged from 8.8% before
the appearance of Phaeocystis globosa to 259% during a bloom of this species. The mucus secreted by P. globosa
and the subsequent increase in seawater viscosity may be an environmental engineering strategy that P. globosa
uses to dampen turbulence and to protect colony integrity77. In addition, the exudates released by P. globosa and
the subsequent increase in viscosity might be considered as an antipredator adaptive strategy that ensures the
completion of its life cycle in highly turbulent environments77. Therefore, biologically increased seawater viscos-
ity might have significant impacts on a range of ecological processes78. Indeed, TEP provide physical structure
to microhabitats by retaining trace elements and organic-rich matter. They may also act as barriers to diffusion
and create patchiness in chemical properties. These microzones would affect the chemotactic behaviour of pro-
tozoa and their predation rate11. Despite the high TEP concentrations measured in L. chlorophorum cultures,
no increase in viscosity was observed under any condition tested. The physicochemical properties of EPS are
attributed to their diverse and complex chemistry and change with species diversity, age and growth conditions21.
Physical factors, such as turbulence regime, may have an impact on the formation and persistence/dispersal of
TEP in situ, as shear enhances the coagulation of TEP-precursors11,69,79 and can modify seawater viscosity. Our
culture conditions were carried out in a steady turbulence regime, and thus, our experiments can be hardly
extrapolated to in situ conditions. We can neither conclude on the effect of turbulence on TEP production
in situ nor on the potential ecological impact and effect of this production on bloom phenology. Measurements
of seawater viscosity and bacterial concentration during a bloom of L. chlorophorum are needed to verify the
experimental hypothesis advanced in this study.
In situ analyses could also contribute to elucidate the effect of excreted TEP on bivalves. Indeed, TEP aggre-
gations tend to accelerate the sedimentation of organic matter from the surface to the seabed14–16. The rapid
sedimentation of this high quantity of organic carbon could accentuate hypoxia and therefore contribute to the
mortalities of natural or cultivated bivalve populations. The large amount of TEP excreted by L. chlorophorum
could also enhance remineralisation processes in the water column and close to the water–sediment interface. As
shown in our study, TEP production was associated with high POC concentrations. In addition, this dinoflagellate
is not an edible prey by oysters on the basis of Dynamic Energy Budget (DEB) m odelling80,81. It remains to be
demonstrated that the non-palatability of this prey by oyster could depend on TEP production. In situ coupled
to in vitro experiments focused on the interaction between L. chlorophorum and oysters could complete the
analyses on the ecological and eventually harmful impact of this dinoflagellate. Beyond our specific case, this
study could provide an example of how an environmental impact could be addressed integrating cellular biology,
physiological and ecological approaches.
Scientific Reports | (2021) 11:4795 | https://doi.org/10.1038/s41598-021-84253-2 9
Vol.:(0123456789)www.nature.com/scientificreports/
Methods
Microalgal strains and culture conditions. Three strains of L. chlorophorum were used in this study:
(1) RCC1489 (RCC: Roscoff Culture Collection; http://roscoff-culture-collection.org/) isolated in the Seine Bay
(Normandy, France) in 2005, (2) KL1C4 (IFR CC 18-001, RCC6910) isolated in the Douarnenez Bay (Northern
Brittany, France) in 2018 and (3) MAR1D2 (IFR CC 19-001, RCC6911) isolated in the Vilaine Bay (Southern
Brittany, France) in 2019. The three strains were maintained in culture in L1 medium82 without Si, at 20 °C under
a 12:12 h light: dark cycle, with 90 μmol photon m−2 s−1 illumination.
All strains were genetically identified by Sanger sequencing using the Large Sub Unit (LSU) (28S) region of
the ribosomal DNA (rDNA). Extraction of L. chlorophorum strains DNA and PCR amplification were carried
out using the PCRBIO Rapid Extract PCR Kit (PCR BIOSYSTEMS LDT. London). The DNA was extracted from
a 20-µL aliquot at the exponential growth phase following the manufacturer´s recommendations, except for the
dilution step, where 190 μL of nuclease-free water (instead of 900 μL) were added in the protease deactivation
step. The PCR was performed using primers D1R-D3B83,84. The PCR cycling comprised an initial 2 min heating
step at 95 °C, followed by 40 cycles of 95 °C for 15 s, 56 °C for 15 s and an extension at 72 °C for 30 s. The PCR-
amplified products were analysed on a 1% agarose TAE gel (ethidium bromide; BET 1X) and purified using the
ExoSAP-IT PCR Product Cleanup reagent (AFFYMETRIX, Cleveland, OH, USA). The Big Dye Terminator
v. 3.1 Cycle Sequencing Kit (APPLIED BIOSYSTEMS, Tokyo, Japan) and ABI PRISM 3130 Genetic Analyzer
(APPLIED BIOSYSTEMS) were used for amplicon sequencing. Sequences were verified on the National Center
for Biotechnology Information website (https://www.ncbi.nlm.nih.gov/) using Nucleotide Blast. Sequences
of strains KL1C4 and MAR1D2 were deposited on GenBank under the accession numbers MT850080 and
MT850081.
Antibacterial protocol. To reduce the abundance of bacteria in L. chlorophorum cultures, an antibacte-
rial protocol was applied as follows. For each strain, 40 mL of cultures were sampled at the exponential growth
phase. Samples were gently filtered through 3-µm polycarbonate membrane filters (WHATMAN Nuclepore
Track-Etched Membrane). The filtrates were discarded and the cells rinsed with 40 mL sterile L1 medium. The
solution containing the cells was then centrifuged (1000g for 10 min at 20 °C). This washing step was repeated
three times. Finally, the pellets were re-suspended in sterile L1 medium for further axenization. To eliminate
epiphytic bacteria of the dinoflagellate cell wall, samples were incubated with Tween-80 (0.005%) at 20 °C for
10 min. Thereafter, samples were washed twice in a row with sterile L1 medium. Finally, based on a specific
mix of antibiotics (X100, CORNING, 30-002-CI), 100 IU penicillin and 100 µg streptomycin per mL of culture
were added. To confirm the effect of this axenization protocol on L. chlorophorum cultures, heterotrophic bac-
teria were enumerated following Marie et al.85, using an Accuri C6 flow cytometer (BECTON DICKINSON)
equipped with blue (488 nm) and red (640 nm) lasers, detectors of forward (FSC) and side (SSC) light scatter,
and four fluorescence detectors: 530 ± 15 nm (FL1), 585 ± 20 nm (FL2), > 670 nm (FL3) and 675 ± 12.5 nm (FL4).
Briefly, bacteria were stained with SYBR Green I, then counted based on plots of red fluorescence versus green
fluorescence and of side scatter versus green fluorescence.
Experimental set‑up for L. chlorophorum cultures. The three strains of L. chlorophorum were culti-
vated for 16 days in non-axenic (NA) and pseudo-axenic (PA) batch cultures at 20 °C under a 12:12 h light: dark
cycle, with 90 μmol photon m −2 s−1 illumination. For PA cultures, antibiotics were added at the beginning of the
experiment (day 0) to maintain the lowest abundance of bacteria during the experiment. Nine 500 mL flasks
were inoculated with 2000 cells m L−1 for each strain under both NA and PA conditions. In three of these flasks,
subsamples were collected every 2 days to evaluate L. chlorophorum and bacterial concentrations over time. At
three selected phases of cellular growth (lag phase on day 2, exponential growth on day 9 and stationary phase
on day 16), culture subsamples were collected from three flasks per growth phases. This strategy was chosen to
obtain sufficient biomass allowing analyses in triplicate of maximum photochemical efficiency of the photosys-
tem (II), inorganic nutrients concentrations, POC and TEP concentrations and viscosity. Analyses of SEP were
performed on the pooled biomass remaining from triplicate samples of each growth phase.
Biological, biochemical and chemical analyses. To quantify L. chlorophorum cells, 1.5-mL triplicates
were fixed with acidic Lugol’s solution (1% final concentration) and stored at 4 °C until analysis. Cell enumeration
was performed in a 1-mL Sedgewick Rafter Counting Cell under an inverted microscope (LEICA DMI3000B).
Growth rate (µ) was calculated during exponential growth using the least-squares regression m ethod86. For bac-
terial cell determination, 1-mL triplicates were fixed with glutaraldehyde (0.1% final concentration) (SIGMA-
ALDRICH) and stored at -80 °C until analysis. Enumeration was carried out using an Accuri C6 flow cytometer.
The photo-physiological status of L. chlorophorum cells during the experiment was verified by measuring the
maximum quantum efficiency of the photosystem II (Fv/Fm) at 450 nm, using an Aquapen-C 100 fluorimeter
(PHOTON SYSTEMS INSTRUMENTS). Three mL triplicates were maintained in the dark for 15 min, following
standard protocols87, before measurements.
To follow nutrient concentrations of L. chlorophorum cultures during the experiments, 7 mL (× 2) were sam-
pled from three flasks, for three different growth phases, and stored directly at − 20 °C for the determination of
dissolved inorganic nitrogen (i.e. N = NO− 3 +NO2 +NH4 ) and phosphate concentrations (PO4 ). Triplicates were
− + 3−
analysed with an auto-analyser (SEAL ANALYTICAL AA3) following standard protocols88. Limits of quantifica-
tion were 0.5 µM for NO− 3 +NO2 , 0.05 µM for NO2 , 0.05 µM for PO4 and 0.05 µM for NH4 .
− − 3− +
EPS determination: TEP and SEP analyses. For the three different growth phases, the concentra-
tion of TEP was determined using a semi-quantitative method based on the colorimetric determination of the
Scientific Reports | (2021) 11:4795 | https://doi.org/10.1038/s41598-021-84253-2 10
Vol:.(1234567890)www.nature.com/scientificreports/
amount of dye complexed with extracellular particles (Claquin et al.9 adapted from Passow and A lldredge22).
Culture subsamples of 5–20 mL were gently filtered through 0.4 µm polycarbonate membrane filters (WHAT-
MAN Nuclepore Track-Etched Membrane) and stored at − 20 °C until analysis. Particles retained on the filters
were stained with 5 mL of 0.02% Alcian blue (SIGMA) in 0.06% acetic acid (pH 2.5). Alcian blue is a hydrophilic
cationic dye that complexes anionic molecules bearing negative substituents such as carboxyl or sulphate groups.
After centrifugation at 4000g for 30 min, supernatants were removed and filters were further centrifuged several
times with 5 mL of MilliQ water until all excess dye was removed from the pellet. After one night of drying at
50 °C, 6 mL of 80% H 2SO4 were added, and 2 h later, the absorption of the supernatant was measured using a
spectrometer at 787 nm (SHIMADZU UV-2600). Alcian blue absorption was calibrated using a solution of Xan-
than gum (X). The TEP concentrations are expressed in mg Xeq L−1.
To characterise SEP, approximately 900 mL of culture biomass were centrifuged (4000g for 30 min at 20 °C).
Supernatants were concentrated and desalted by using an ultra-filtration system (PELLICON MILLIPORE)
with a 5-kD cut-off membrane and freeze-dried. Pellets were fixed for 1 h at 20 °C with a solution of 5% formol/
ethanol (w/w), dialysed against water (3.5 kD porous membrane) to eliminate salts and freeze-dried. Pellets
were then solubilised in water for 1 h at 60 °C to recover SEP eventually associated with L. chlorophorum cells.
Supernatants recovered after centrifugation (4000g for 15 min) were freeze-dried. Prior to analyses, all samples
were solubilised in water at 3 mg/mL. The protein content was estimated according to the bicinchoninic-acid
protein assay (BCA), and Bovine Serum Albumin was used as s tandard89. Monosaccharide composition was
determined by gas chromatography (GC) analysis of trimethylsilyl derivatives after acid methanolysis90. Briefly,
supernatants were hydrolysed using MeOH/HCl for 4 h at 100 °C. Myo-inositol was used as internal standard. The
methyl glycosides thus obtained were then converted to trimethylsilyl derivatives using N,O-bis(trimethylsilyl)
trifluoroacetamide and trimethylchlorosilane (BSTFA:TMCS) 99:1 (MERCK). Gas chromatography (GC-FID,
AGILENT TECHNOLOGIES 6890N) was used for separation and quantification of the per-O-trimethylsilyl
methyl glycosides formed. The sulphur content was determined by elementary analysis performed at the BioCIS-
UMR 8076 (Châtenay-Malabry, France). The molecular weights of proteins and polysaccharides were determined
by HPSEC (High Performance Size-Exclusion Chromatography, HPLC Prominence SHIMADZU Co, Kyoto,
Japan) coupled on-line with a multiangle light scattering detector MALS (Dawn Heleos-II, WYATT TECH-
NOLOGY, Santa Barbara, CA, USA), a differential refractive detector (RI) (Optilab WYATT TECHNOLOGY,
Santa Barbara, CA, USA) and a UV detector at 280 nm. Samples with concentrations from to 2 to 3 mg mL−1
were solubilised and filtered on a 0.45 µm syringe filter; 100 µL were injected on a PL aquagel-OH mixed, 8 μm
(AGILENT) guard column (U 7.5 mm × L 50 mm), and a PL aquagel-OH mixed (AGILENT) separation col-
umn. Elution was carried out at 1 mL min−1 with 0.1 M ammonium acetate. The chromatogram was further
processed with Astra 6.1 Software (WYATT TECHNOLOGY). The refractive index increments used were dn/
dc = 0.145 mL g for polysaccharides and 0.185 mL g for proteins. Polyacrylamide and agarose gel electrophoresis
was applied to refine the polymer composition. The SDS-PAGE with a 10% polyacrylamide separating gel was
prepared following the common method of Laemmli91. Briefly, 25 µL of each sample were loaded on a gel; 1%
agarose gel was prepared in TAE (40 mM Tris base, 1.1 mL/L acid acetic, 2 mM EDTA). Samples were mixed
4:1 (v/v) with a sample loading buffer (0.5 M Tris HCl pH 6.8, glycerol, 0.5 M EDTA, 0.5% w/v bromophenol),
and 10 µL of the sample were loaded onto a gel. Gels were run in TAE buffer at 150 V. After migration, gels were
stained with Stains-All to detect anionic polysaccharides as previously described92. Carbohydrates were also
revealed by Schiff staining93, while proteins were detected by Sypro Ruby staining (Sypro Ruby protein gel stain,
INVITROGEN). The Escherichia coli strain O111:B4 lipopolysaccharide, Bovine Serum Albumin, and different
polysaccharides (galactan sulphate with 7.7% sulphur content, dextran sulphate sodium salt from Leuconostoc
spp. (MW 500 000 with 16.0–19.0% sulphur and MW 50 000 with 16.0–19.0% sulphur; SIGMA-ALDRICH, Saint
Quentin Fallavier, France)) were used as references.
POC determination. To estimate the amount of particulate carbon due to the entire TEP produced by L.
chlorophorum and/or associated bacteria, 10–20 mL triplicates (from three different flasks) were gently filtered
onto combusted GF/F filters (WHATMAN Nuclepore; for 4 h at 450 °C) and stored at − 20 °C until analysis.
After removal of carbonates with phosphoric a cid94, filters were treated using a CHN element analyser (Flash
2000, THERMO FISHER SCIENTIFIC, USA) to measure POC concentration. To estimate the carbon enrich-
ment due to antibiotics addition in Pseudo-Axenic (PA) cultures, POC concentration was measured on three
replicates of L1 medium with antibiotics and the mean value was subtracted.
Viscosity measurements. Viscosity measurements were conducted on 2-mL triplicate samples using an
Ubbelohde viscometer and following the procedure described by Seuront et al.77. The measured viscosity ηm
(cP) is the sum of a physically controlled viscosity component ηT,S (cP) and a biologically controlled viscosity
component ηBio (cP):
ηm = ηT,S + ηBio (1)
For non-axenic and pseudo-axenic conditions, the physically controlled components ηT,S were estimated from
viscosity measurements conducted respectively on sterile L1 medium or sterile L1 medium with antibiotics.
The biologically induced viscosity excess ηBio (cP) was subsequently defined for each water sample as:
ηBio = ηm − ηT,S (2)
The relative viscosity excess η (%) was then calculated as follows:
Scientific Reports | (2021) 11:4795 | https://doi.org/10.1038/s41598-021-84253-2 11
Vol.:(0123456789)www.nature.com/scientificreports/
(ηm − ηT,S )
η= (3)
ηT,S
Viscosity measurements were conducted at constant temperature. A thermometer (DOSTMANN ELEC-
TRONIC P655) and conductometer (HACH CDC401) were used to measure temperature and salinity,
respectively.
Statistical analyses. Data are presented as triplicate means with standard deviation (S.D.). The number of
samples per group of variables was small (n < 10), which implies that the hypotheses of normal distribution (Sha-
piro–Wilk test) and homoscedasticity of residuals (Bartlett test) were not verified. Therefore, non-parametric
tests of Kruskal–Wallis and post hoc multiple comparison were carried out to check the statistical significance
of the differences observed among the data of the three strains and the three different growth phases. Wilcoxon
signed-rank test was applied to check differences between non-axenic (NA) and pseudo-axenic (PA) conditions.
Statistical analyses were performed using the R s oftware95. A Principal Components Analysis (PCA), conducted
with the FactoMineR package96, was applied to assess differences and similarities between samples under NA and
PA conditions. Dinoflagellate and bacterial cell abundances, concentrations of TEP and POC as well as nutrient
concentrations were used as quantitative variables. Time (in days) and excess of viscosity (in percentage) were
used as illustrative variables. The representation of confidence ellipses (95% confidence interval) around the
barycentre of each condition allowed to distinguish data group.
Received: 21 August 2020; Accepted: 3 February 2021
References
1. Siano, R. et al. Citizen participation in monitoring phytoplankton seawater discolorations. Mar. Policy 117, 1–11. https://doi.
org/10.1016/j.marpol.2018.01.022 (2018).
2. Elbrächter, M. & Schnepf, E. Gymnodinium chlorophorum, a new, green, bloom-forming dinoflagellate (Gymnodiniales, Dino-
phyceae) with a vestigial prasinophyte endosymbiont. Phycologia 35, 381–393 (1996).
3. Hansen, G., Botes, L. & De Salas, M. Ultrastructure and large subunit rDNA sequences of Lepidodinium viride reveal a close
relationship to Lepidodinium chlorophorum comb. Nov. (=Gymnodinium chlorophorum). Phycol. Res. 55, 25–41. https://doi.org/1
0.1111/j.1440-1835.2006.00442.x (2007).
4. Gavalás-Olea, A. et al. 19,19′-diacyloxy signature: An atypical level of structural evolution in carotenoid pigments. Org. Lett. 18,
4642–4645. https://doi.org/10.1021/acs.orglett.6b02272 (2016).
5. Jackson, C., Knoll, A. H., Chan, C. X. & Verbruggen, H. Plastid phylogenomics with broad taxon sampling further elucidates the
distinct evolutionary origins and timing of secondary green plastids. Sci. Rep. 8, 1523. https://doi.org/10.1038/s41598-017-18805
-w (2018).
6. Kamikawa, R. et al. Plastid genome-based phylogeny pinpointed the origin of the green-colored plastid in the dinoflagellate
Lepidodinium chlorophorum. Genome Biol. Evol. 7, 1133–1140. https://doi.org/10.1093/gbe/evv060 (2015).
7. Chapelle, A., Lazure, P. & Ménesguen, A. Modelling eutrophication events in a coastal ecosystem. Sensitivity analysis. Estuar.
Coast. Shelf Sci. 39, 529–548. https://doi.org/10.1016/S0272-7714(06)80008-9 (1994).
8. Sournia, A. et al. The repetitive and expanding occurrence of a green, bloom-forming dinoflagellate (Dinophyceae) on the coast
of France. Cryptogam. Algol. 13, 1–13 (1992).
9. Claquin, P., Probert, I., Lefebvre, S. & Veron, B. Effects of temperature on photosynthetic parameters and TEP production in eight
species of marine microalgae. Aquat. Microb. Ecol. 51, 1–11. https://doi.org/10.3354/ame01187 (2008).
10. Alldredge, A. L., Passow, U. & Logan, B. E. The abundance and significance of a class of large, transparent organic particles in the
ocean. Deep-Sea Res. 40, 1131–1140. https://doi.org/10.1016/0967-0637(93)90129-Q (1993).
11. Passow, U. Transparent exopolymer particles (TEP) in aquatic environments. Prog. Oceanogr. 55, 287–333. https: //doi.org/10.1016/
S0079-6611(02)00138-6 (2002).
12. Verdugo, P. et al. The oceanic gel phase: A bridge in the DOM-POM continuum. Mar. Chem. 92, 67–85. https://doi.org/10.1016/j.
marchem.2004.06.017 (2004).
13. Azam, F. & Malfatti, F. Microbial structuring of marine ecosystems. Nature 5, 782–791. https://doi.org/10.1038/nrmicro1747
(2007).
14. Bittar, T. B., Passow, U., Hamaraty, L., Bidle, K. D. & Harvey, E. L. An updated method for the calibration of transparent exopolymer
particle measurements. Limnol. Oceanogr. Methods. 16, 621–628. https://doi.org/10.1002/lom3.10268 (2018).
15. Mari, X., Passow, U., Migon, C., Burd, A. B. & Legendre, L. Transparent exopolymer particles: Effects on carbon cycling in the
ocean. Prog. Oceanogr. 151, 13–37. https://doi.org/10.1016/j.pocean.2016.11.002 (2017).
16. Passow, U. et al. The origin of transparent exopolymer particles (TEP) and their role in the sedimentation of particulate matter.
Cont. Shelf. Res. 21, 327–346. https://doi.org/10.1016/S0278-4343(00)00101-1 (2001).
17. Jenkinson, I. R. Oceanographic implications of non-newtonian properties found in phytoplankton cultures. Nature 323, 435–437.
https://doi.org/10.1038/323435a0 (1986).
18. Alldredge, A. L. & Gotschalk, C. C. Direct observations of the mass flocculation of diatom blooms: Characteristics, settling veloci-
ties and formation of diatom aggregates. Deep-Sea Res. 36, 159–171. https://doi.org/10.1016/0198-0149(89)90131-3 (1989).
19. Schapira, M., McQuaid, C. D. & Froneman, P. W. Free-living and particle-associated prokaryote metabolism in giant kelp for-
ests: Implications for carbon flux in a sub-Antarctic coastal area. Estuar. Coast. Shelf. Sci. 106, 69–79. https://doi.org/10.1016/j.
ecss.2012.04.031 (2012).
20. Schapira, M., McQuaid, C. D. & Froneman, P. W. Metabolism of free-living particle-associated prokaryotes: Consequences for
carbon flux around a Southern Ocean archipelago. J. Mar. Syst. 90, 58–66. https://doi.org/10.1016/j.jmarsys.2011.08.009 (2012).
21. Bhaskar, P.V. & Bhosle, N.B. Microbial extracellular polymeric substances in marine biogeochemical processes. Curr. Sci. 88, 45–53.
http://drs.nio.org/drs/handle/2264/89 (2005).
22. Passow, U. & Alldredge, A. L. A dye-binding assay for the spectrophotometric measurement of transparent exopolymer particles
(TEP). Limnol. Oceanogr. 40, 1326–1335. https://doi.org/10.4319/lo.1995.40.7.1326 (1995).
23. Gärdes, A., Iversen, M. H., Grossart, H. P., Passow, U. & Ullrich, M. S. Diatom-associated bacteria are required for aggregation of
Thalassiosira weissflogii. ISME J. 5, 436–445. https://doi.org/10.1038/ismej.2010.145 (2011).
Scientific Reports | (2021) 11:4795 | https://doi.org/10.1038/s41598-021-84253-2 12
Vol:.(1234567890)You can also read