Global trends in marine nitrate N isotopes from observations and a neural network-based climatology - Biogeosciences
←
→
Page content transcription
If your browser does not render page correctly, please read the page content below
Biogeosciences, 16, 2617–2633, 2019
https://doi.org/10.5194/bg-16-2617-2019
© Author(s) 2019. This work is distributed under
the Creative Commons Attribution 4.0 License.

Global trends in marine nitrate N isotopes from observations and a
neural network-based climatology
Patrick A. Rafter1 , Aaron Bagnell2 , Dario Marconi3 , and Timothy DeVries2
1 Department of Earth System Science, University of California, Irvine, CA, USA
2 Department of Geography, University of California, Santa Barbara, CA, USA
3 Department of Geosciences, Princeton University, Princeton, NJ, USA

Correspondence: Patrick A. Rafter (prafter@uci.edu)

Received: 8 January 2019 – Discussion started: 11 January 2019
Revised: 15 March 2019 – Accepted: 23 April 2019 – Published: 5 July 2019

Abstract. Nitrate is a critical ingredient for life in the ocean    1   Introduction
because, as the most abundant form of fixed nitrogen in the
ocean, it is an essential nutrient for primary production. The      In contrast to other marine nutrients (e.g., phosphate and
availability of marine nitrate is principally determined by bi-     silicate), the inventory of nitrate (NO−   3 ) and other fixed ni-
ological processes, each having a distinct influence on the         trogen (N) is mediated by biological processes, where the
N isotopic composition of nitrate (nitrate δ 15 N) – a prop-        main source is N2 fixation by diazotrophic phytoplankton
erty that informs much of our understanding of the marine           and the main sink is denitrification (via microbial consump-
N cycle as well as marine ecology, fisheries, and past ocean        tion in oxygen deficient waters and sediments) (Codispoti
conditions. However, the sparse spatial distribution of nitrate     and Christensen, 1985). Biological processes also determine
δ 15 N observations makes it difficult to apply this useful prop-   the distribution of marine nitrate throughout the water col-
erty in global studies or to facilitate robust model–data com-      umn, with phytoplankton assimilating nitrate in the surface
parisons. Here, we use a compilation of published nitrate           ocean and microbes degrading organic matter in the subsur-
δ 15 N measurements (n = 12 277) and climatological maps            face (i.e., remineralization). The latter involves the multi-step
of physical and biogeochemical tracers to create a surface-         process of ammonification (organic matter → NH+         4 ) and ni-
to-seafloor, 1◦ resolution map of nitrate δ 15 N using an en-       trification (NH+ 4 →  NO  −
                                                                                              2 →   NO   −
                                                                                                         3 ). By regulating the global
semble of artificial neural networks (EANN). The strong cor-        inventory and distribution of marine nitrate, these N cycling
relation (R 2 > 0.87) and small mean difference (< 0.05 ‰)          processes control global net primary productivity, the trans-
between EANN-estimated and observed nitrate δ 15 N indi-            fer of nutrients to higher trophic levels and the strength of
cate that the EANN provides a good estimate of climato-             the ocean’s biological carbon pump (Dugdale and Goering,
logical nitrate δ 15 N without a significant bias. The magni-       1967).
tude of observation-model residuals is consistent with the             Each of these biologically mediated N transformations af-
magnitude of seasonal to interannual changes in observed ni-        fects the N isotopic composition of nitrate in unique ways
trate δ 15 N that are not captured by our climatological model.     (Fig. 1a and b), adjusting the relative abundance of 15 N and
                                                                    14 N in oceanic nitrate relative to the atmosphere. (δ 15 N =
The EANN provides a globally resolved map of mean nitrate
δ 15 N for observational and modeling studies of marine bio-        (15 N/14 Nsample /15 N/14 Nstandard ) − 1, multiplied by 1000 to
geochemistry, paleoceanography, and marine ecology.                 give units of per mil (‰); see Sigman and Casciotti, 2001, for
                                                                    simplified equations from Mariotti et al., 1981.) Nitrate δ 15 N
                                                                    measurements have become a powerful tool for understand-
                                                                    ing the “biogeochemical history” of marine nitrate (Rafter
                                                                    et al., 2012), which includes nitrate assimilation by phyto-
                                                                    plankton (Miyake and Wada, 1967; Wada and Hattori, 1978),
                                                                    nitrogen fixation (Carpenter et al., 1997; Hoering and Ford,

Published by Copernicus Publications on behalf of the European Geosciences Union.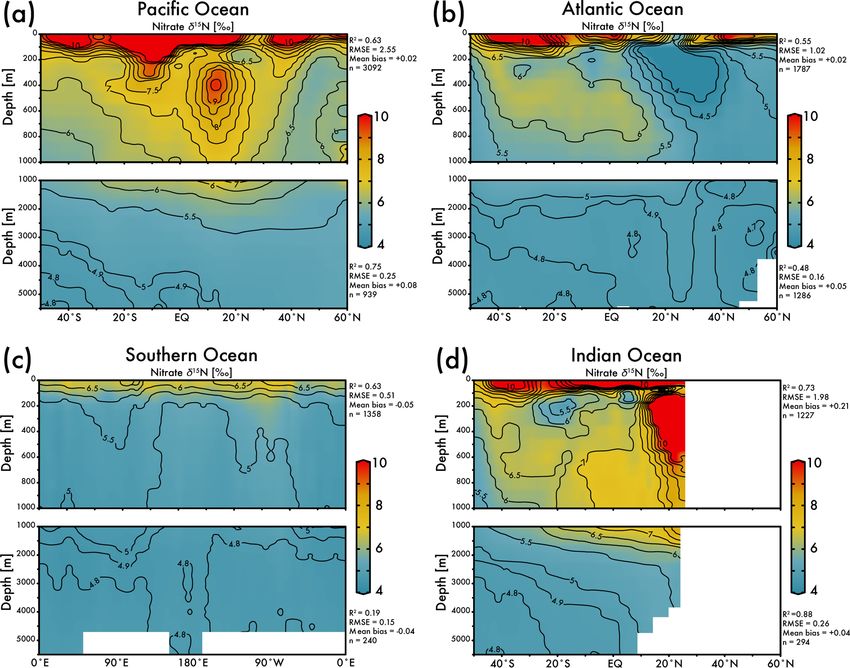
2618                                                                    P. A. Rafter et al.: Global trends in marine nitrate N isotopes

Figure 1. (a) A comparison of influences on average deep-sea ni-            Figure 2. The location of global nitrate δ 15 N observations used to
trate (circle; concentration and δ 15 N estimated here by EANN re-          constrain the ensemble of artificial neural networks are shown as
sults in Table 1) including the isotope effects of assimilation (yel-       red circles. Observations used as an “external validation dataset”
low arrow), water column and sedimentary denitrification (red and           (those withheld from training the EANN) are shown in blue. Inset
gray arrows), and the addition of nitrate via remineralization of or-       figure shows the number of observations versus depth. Contours are
ganic matter with higher and lower δ 15 N (brown and purple arrows)         surface nitrate concentrations for October–December from World
(modified from Galbraith et al., 2008). (b) An example of N isotopic        Ocean Atlas (Garcia et al., 2010).
fractionation during nitrate assimilation on nitrate and organic mat-
ter biomass in eastern equatorial Pacific surface waters (from Rafter
and Sigman, 2016). These calculations are based on isotopic frac-              Because of nitrate’s place at the base of the marine ecosys-
tionation equations of Mariotti et al., (1981) simplified in Sigman         tem, nitrate δ 15 N is also useful for understanding the life-
and Casciotti (2001) with an isotope effect (ε) as shown in (a). The        cycles of higher trophic level organisms such as fish (Gra-
variable f is the initial nitrate concentration.
                                                                            ham et al., 2007; Tawa et al., 2017) and fishery productivity
                                                                            (Finney et al., 2002, 2000). The δ 15 N of whole sediment and
                                                                            microfossils provides insight by proxy of past ocean nitrate
1960), denitrification (Liu, 1979), and nitrification (Casciotti            transformations (Altabet and Francois, 1994a; Kienast et al.,
et al., 2013). For example, the consumption of nitrate by den-              2008; Ren et al., 2009; Robinson et al., 2004; Sigman et al.,
itrification (red line in Fig. 1a) has a larger impact on the               1999b) – work that places important constraints on modern
residual nitrate δ 15 N than partial nitrate assimilation by phy-           ocean N cycling (Altabet, 2007; Eugster et al., 2013; Ren
toplankton (yellow line in Fig. 1), and thus very high δ 15 N               et al., 2017). With an understanding of the N transforma-
values serve as a fingerprint of denitrification. Nitrate δ 15 N            tions described above and their influences on the N isotopic
is also influenced by the addition of nitrate via remineraliza-             composition of nitrate, we can begin using nitrate δ 15 N mea-
tion of organic matter. The exact influence of remineraliza-                surements to trace the biogeochemical history of marine ni-
tion depends on the isotopic composition of the organic mat-                trate. However, identifying basin- and global-scale trends in
ter, and could result in higher or lower nitrate δ 15 N (Fig. 1a).          nitrate δ 15 N is challenged by the limited spatial extent of ni-
Nitrate introduced into the water column by the remineral-                  trate δ 15 N observations (Fig. 2). Here, we compile a global
ization of organic matter formed by N2 -fixing phytoplankton                database of nitrate δ 15 N measurements (Fig. 2) and use an
has an isotopic composition close to that of air (0 ‰–1 ‰)                  ensemble of artificial neural networks (EANN) to produce
(Carpenter et al., 1997; Hoering and Ford, 1960) and serves                 a map of the global nitrate δ 15 N distribution at 1◦ spatial
to lower the mean ocean nitrate δ 15 N (Fig. 1b). On the other              resolution. We find that the mapped nitrate δ 15 N climatol-
hand, organic matter formed from nitrate assimilation in re-                ogy matches the observations well and should be a valuable
gions where the plankton use most of the available nitrate                  tool for estimating mean conditions and for constraining pre-
can be isotopically heavy, and its remineralization will in-                dictive nitrate δ 15 N models (Somes et al., 2010; Yang and
crease the δ 15 N of ambient nitrate (Fig. 1b). The actual value            Gruber, 2016). Below we briefly discuss how the EANN was
of organic matter δ 15 N formed from nitrate assimilation is                used to produce global maps of nitrate δ 15 N (Sect. 2), ad-
mostly determined by the following: (1) the δ 15 N of nitrate               dress the ability of the EANN to match the measured δ 15 N
delivered to the euphotic zone (the subsurface source), which               (Sect. 3), and examine the EANN-mapped δ 15 N climatology
in turn is dependent on the degree of water column deni-                    and global compilation of nitrate δ 15 N in the context of pub-
trification and (2) the degree of nitrate consumption at the                lished work (Sect. 4).
ocean surface, with heavier values associated with greater
nitrate consumption (Fig. 1b). Accordingly, changes in or-
ganic matter δ 15 N (and therefore sediment δ 15 N used for pa-
leoceanographic work) can reflect variability of the source
nitrate δ 15 N and variability of the degree of nitrate consump-
tion (e.g., see Rafter and Charles, 2012).

Biogeosciences, 16, 2617–2633, 2019                                                               www.biogeosciences.net/16/2617/2019/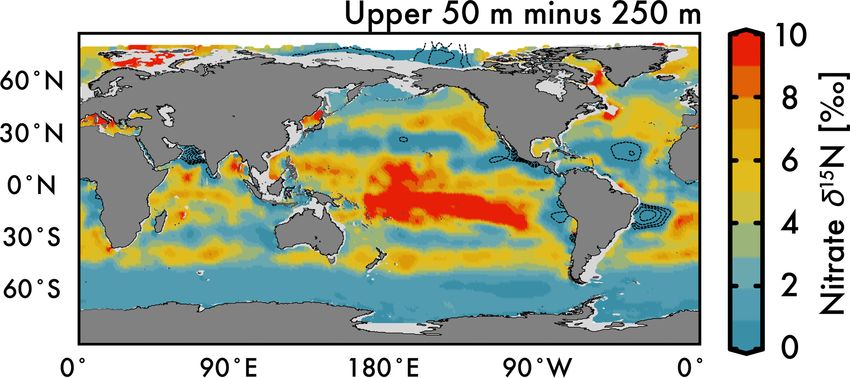
P. A. Rafter et al.: Global trends in marine nitrate N isotopes                                                               2619

2     Methods                                                       OC5/WOA09/woa09data.html, last access: 1 January 2017)
                                                                    at 1◦ resolution. Additionally, daily chlorophyll data from
2.1     Data compilation                                            Modis Aqua for the period 1 January 2003 through 31 De-
                                                                    cember 2012 are averaged and binned to the WOA09 grid
Nitrate δ 15 N observations (Fig. 2; references and region of       (as described in Step 1) to produce an annual climatological
measurement in Appendix) were compiled from studies dat-            field of chlorophyll values, which we then log transform to
ing from 1975 (Cline and Kaplan, 1975) to 2018 (Fripiat et          reduce their dynamic range.
al., 2018), including data from the GEOTRACES intermedi-               The choice of these specific input features was dictated
ate data product (Schlitzer et al., 2018). Whenever possible,       by our desire to achieve the best possible R 2 value on our
the data were acquired via the original author, but in other        internal validation sets (Step 4). Additional inputs besides
cases the data were estimated from the publication directly.        those we included, such as latitude, longitude, silicate, eu-
All observations were treated equally, although the failure to      photic depth, or sampling depth either did not improve the
remove nitrite when using the “denitrifier method” may bias         R 2 value on the validation dataset or degraded it, indicating
the nitrate δ 15 N to low values (Rafter et al., 2013). These       that they are not essential parameters for characterizing this
measurements have been identified as “nitrate + nitrite” in         system globally. By opting to use the set of input features that
the dataset to acknowledge this potential biasing, which pre-       yielded the best results for the global oceans, we potentially
dominantly affects observations in the upper 100 m (Kemeny          overlooked combinations of inputs that perform better at re-
et al., 2016; Rafter et al., 2013).                                 gional scales. However, given the scarcity of δ 15 N data in
                                                                    some regions, it is not possible to differentiate the impact of
2.2     Building the neural network model                           input features from the impact of available δ 15 N data, which
                                                                    may not be representative of the region’s climatological state,
We utilize an ensemble of artificial neural networks (EANN)
                                                                    to the model performance in these regions.
to interpolate our global ocean nitrate δ 15 N database (Fig. 2),
producing complete 3-D maps of the data. The artificial neu-        2.2.3   Training the ANN (Step 3)
ral network (ANN) is a machine learning approach that iden-
tifies nonlinear relationships between a target variable (the       The architecture of our ANN consists of a single hidden
isotopic dataset) and a set of input features (other available      layer, containing 25 nodes, that connects the biological and
ocean datasets), and extrapolates these relationships to pro-       physical input features (discussed in Step 2) to the target ni-
duce global coverage of nitrate δ 15 N.                             trate isotopic variable (as discussed in Step 1). The role of
                                                                    the hidden layer is to transform input features into new fea-
2.2.1    Binning target variables (Step 1)                          tures contained in the nodes. These are given to the output
                                                                    layer to estimate the target variable. The number of nodes in
We binned the nitrate δ 15 N observations (red symbols in           this hidden layer, as well as the number of input features, de-
Fig. 2) to the World Ocean Atlas 2009 (WOA09) grid with a           termines the number of adjustable weights (the free parame-
1◦ spatial resolution and 33 vertical depth layers (0–5500 m)       ters) in the network. Because there is a danger of over-fitting
(Garcia et al., 2010). When binning vertically, we use the          the model, which occurs when the ANN is over-trained on
depth layer whose value is closest to the observation’s sam-        a dataset so that it cannot generalize well when presented
pling depth (the first depth layer has a value of 0 m, the sec-     with new data, it is a good practice to have a large number
ond of 10 m, and the third of 20 m, so all nitrate isotopic data    of training data (we have 7170 binned data points) relative to
sampled between 0 and 5 m fall in the 0 m bin; between 5            the number of free parameters (we have 201 free parameters)
and 15 m they fall in the 10 m bin, etc.). An observation with      (Weigend et al., 1990). To create a nonlinear system, an ac-
a sampling depth that lies right at the midpoint between depth      tivation function transforms the product of the weights and
layers is binned to the shallower layer. If more than one raw       input features and creates the values assigned to nodes in the
data point falls in a grid cell we take the average of all those    hidden layer. These act as new features for estimating the tar-
points as the value for that grid cell. Certain whole ship tracks   get δ 15 N data. Our model utilizes the hyperbolic tangent as
of nitrate δ 15 N data were withheld from binning to be used        its activation function between the input and hidden layer, as
as an independent validation set (see Sect. 2.2.4).                 well as between the hidden and output layer, due to its speed
                                                                    and general performance (Thimm and Fiesler, 1997).
2.2.2    Obtaining input features (Step 2)
                                                                       The values of nodes in the hidden layer (H) can be defined
Our input dataset contains a set of climatological values           as
for physical and biogeochemical ocean parameters that form          H = a(I · W1 + b1 ),                                        (1)
a non-linear relationship with the target data. We use six
input features including objectively analyzed annual-mean           where H is an array containing the values of the hidden
fields for temperature, salinity, nitrate, oxygen, and phos-        nodes, and a is the activation function. I is a 7170 × 6 ar-
phate taken from the WOA09 (https://www.nodc.noaa.gov/              ray containing the values of the input features at the loca-

www.biogeosciences.net/16/2617/2019/                                                       Biogeosciences, 16, 2617–2633, 2019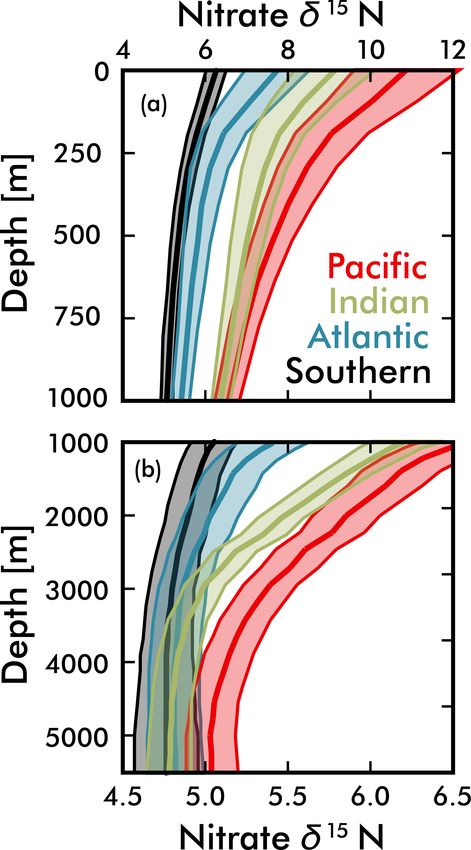
2620                                                               P. A. Rafter et al.: Global trends in marine nitrate N isotopes

tions of the binned observations (there are 7170 binned ob-            external validation dataset from areas where the model has
servations and six input parameters). W1 is a 6 × 25 array of          not “learned” anything about nitrate δ 15 N provides a more
weights that connect input features to hidden nodes, and b1 is         rigorous test of the model than would be provided by a ran-
a 7170×25 array of weights (25 unique values repeated 7170             domly selected validating dataset.
times) that connects a bias node to the hidden nodes. The fac-
tor of 25 represents the number of nodes in the hidden layer,          2.2.5    Forming the ensemble (Step 5)
chosen by experimentation to find the maximum number of
effective parameters (Foresee and Hagan, 1997), i.e., where            The ensemble is formed by repeating Steps 3 to 4 (using
adding new parameters no longer improves performance on                a different random 10 % validation set) until we obtain 25
an internal validation set (Step 4). The bias node acts as an          trained networks for the nitrate δ 15 N dataset. A network is
offset term, similar to a constant term in a linear function,          admitted into the ensemble if it yields an R 2 value greater
and has a value that is always one.                                    than 0.81 on the internal validation dataset. Using an EANN
   At the output layer, the network produces a prediction of           instead of any single network provides several advantages.
the target nitrate isotopic data (δ 15 Npred ). Similar to how         For example, the random initialization of the weight values
nodes in the hidden layer are a function of the inputs and             in each network as well as differences in the training and in-
a set of weights, δ 15 Npred is a function of the hidden nodes         ternal validation sets used across members make it possible
and an additional set of weights. The predicted values can be          for many different networks to achieve similar performance
defined as                                                             on their respective validation set while generalizing to areas
                                                                       with no data coverage differently. By performing this type of
δ 15 Npred = a(H · W2 + b2 ),                               (2)        data subsampling and taking an ensemble average, similar to
                                                                       bootstrap aggregating (Breiman, 1996), this approach on av-
where H (size 7170 × 25) has been previously defined, W2               erage improves the robustness of the generalization in areas
(size 25 × 1) is a matrix of weights that connect features in          without data coverage compared to a single randomly gen-
the hidden layer to nodes in the output layer, and b2 (size            erated ensemble member. Compared to each of its members,
7170 × 1) is an array of weights (all of the same value) that          our ensemble mean sees improved performance on all inter-
connects a bias node to the output layer.                              nal validation sets and has a higher R 2 and lower root mean
   The ANN learns by comparing δ 15 Npred to the actual δ 15 N         square error on the independent validation set compared to
data (δ 15 Ndata ), attempting to minimize the value of the cost       19 of the 25 members. The range of values given by the en-
function                                                               semble also provides a measure of the uncertainty for our
                                                                       estimations of δ 15 N.
         n                                   2
               δ 15 Npred i − δ 15 Ndata i
         P
         i=1
cost =                                                      (3)        3     Results
                          n
by iteratively adjusting the weights using the Levenberg–              3.1     Global nitrate δ 15 N observations
Marquardt algorithm (Marquardt, 1963) as a way of prop-
agating the errors between δ 15 Npred and δ 15 Ndata backwards         The global compilation of nitrate δ 15 N includes 1180 stations
though the network (Rumelhart et al., 1986).                           from all major ocean basins and some minor seas (Fig. 2) giv-
                                                                       ing a total of 12 277 nitrate δ 15 N measurements. Within this
2.2.4    Validating the ANN (Step 4)                                   dataset, 1197 nitrate δ 15 N measurements were withheld from
                                                                       the EANN and used to validate the EANN results (the “exter-
To ensure good generalization of the trained ANN, we ran-              nal” validation dataset; blue symbols in Fig. 2, see Sect. 2).
domly withheld 10 % of the δ 15 N data to be used as an in-            With observations from the surface to as deep as 6002 m
ternal validation set for each network. These are data that the        (Rafter et al., 2012), we find that nitrate δ 15 N ranges from
network never sees, meaning it does not factor into the cost           ≈ 1 ‰ in the North Atlantic (e.g., Marconi et al., 2015) to
function, so it works as a test of the ANN’s ability to gen-           68.7 ‰ in the eastern tropical South Pacific (Bourbonnais et
eralize. This internal validation set acts as a gatekeeper to          al., 2015). Nitrate δ 15 N of ≈ 1 ‰ was also irregularly ob-
prevent poor models from being accepted into the ensemble              served in the shallow North and South Pacific (Liu et al.,
of trained networks (see Step 5). A second, independent or             1996; Yoshikawa et al., 2015). These latter observations were
“external” validation set (blue symbols in Fig. 2), composed           included in the training dataset, although we should note that
of complete ship transects from the high- and low-latitude             measurements using the “Devarda’s alloy” method (Liu et
ocean, was omitted from binning in Step 1 and used to estab-           al., 1996) are thought to be biased towards low values (Al-
lish the performance of the entire ensemble (Sect. 3.2). Our           tabet and Francois, 2001). Similarly, the inclusion of nitrite
rationale for using complete ship transects is to have a vali-         during “denitrifier method” nitrate δ 15 N measurements can
dating observational dataset that is not highly correlated ge-         bias the measurement towards lower values (Kemeny et al.,
ographically with the data used to train the ANN. Using an             2016; Rafter et al., 2013).

Biogeosciences, 16, 2617–2633, 2019                                                         www.biogeosciences.net/16/2617/2019/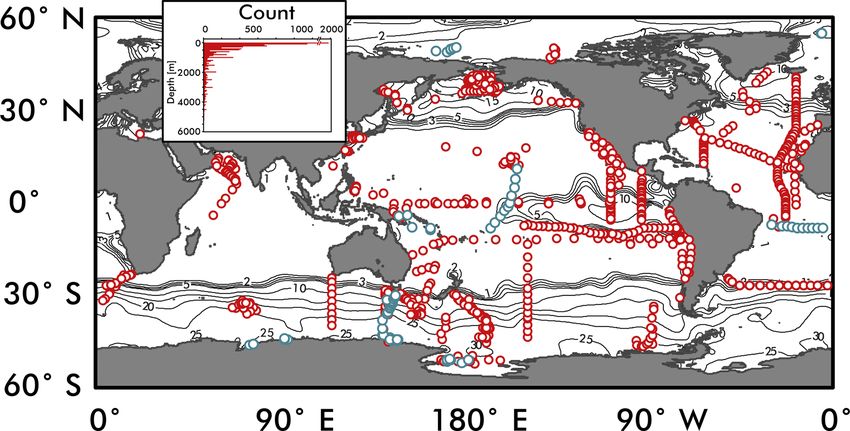
P. A. Rafter et al.: Global trends in marine nitrate N isotopes                                                                      2621

3.2   Marine nitrate δ 15 N observations model
      comparison

The observed and EANN-predicted nitrate δ 15 N measure-
ments are distributed around a 1 : 1 line in Fig. 3a (all data),
with considerably less scatter for the values > 1000 m depth
(Fig. 3b). The correlation coefficient of determination for the
observations versus the model nitrate δ 15 N gives an R 2 =
0.75 for the raw and unbinned observations used to train the
EANN (see Fig. 3a) and an R 2 of 0.78 for the external val-
idation dataset (not shown). The model matches the obser-
vations even better for depths > 1000 m with an R 2 = 0.83
(values used in model; Fig. 3b) and R 2 = 0.78 for the ex-
ternal validation dataset (not shown). We can also examine
the performance of the EANN with the nitrate δ 15 N “resid-
ual” or the difference between observed and modeled δ 15 N
(Fig. 3c), which indicates a mean residual or “mean bias”
value of −0.03 ‰ and +0.18 ‰ for the model training and
external validation datasets, respectively.
   Examining the observation-EANN residuals via the root
mean square error (RMSE; Fig. 3d), we find an RMSE of
                                                                    Figure 3. The observed versus EANN-predicted nitrate δ 15 N are
1.94 ‰ for the data used to train the EANN and an RMSE of           shown for all data at all depths in (a) and for > 1000 m in (b). The
1.26 ‰ for the external validation dataset. There is a clear re-    colors indicate the number of comparisons on the World Ocean At-
lationship between the residual mean, the RMSE and depth,           las grid (legend in b; gray = 1 observation). The anomalously high
with significantly higher values for the upper 500 m (Fig. 3c       observed nitrate δ 15 N values (> 30 ‰) in (a) are exclusively from
and d). Comparing these with dissolved oxygen concentra-            the eastern tropical South Pacific waters (Bourbonnais et al., 2015;
tions (color in Fig. 3c), we find that the largest residuals and    Casciotti et al., 2013; Rafter et al., 2012; Ryabenko et al., 2012).
RMSE are associated with high oxygen concentration near             The difference (or residual) between the observations and EANN
the surface and low oxygen concentrations at about 250 m.           nitrate δ 15 N is shown for all depths and the upper 1000 m in (c) with
   The RMSE patterns in Fig. 3c and d are to be expected            colors representing the dissolved oxygen content. Note the largest
                                                                    offsets between 100 and 500 m in (c) are associated with lowest
given the natural variability in nitrate δ 15 N driven by assim-
                                                                    oxygen content. Similarly, the mean residual (black) and root mean
ilation in the upper ocean and denitrification in the shallow
                                                                    square error (RMSE; red) with depth (d) are highest in the upper
subsurface – variability which is not captured by the clima-        500 m. Dashed lines in (d) demonstrate the same statistics, but for
tological EANN. The only available nitrate δ 15 N time-series       the external validation dataset (blue in Fig. 2).
is by Rafter and Sigman (2016) in the eastern equatorial Pa-
cific, and it shows that variability of nitrate assimilation pro-
duces seasonal-to-interannual deviations of δ 15 N of ±2.5 ‰,       able to capture because it is trained on climatological data.
which is similar to the magnitude of the RMSE in the sur-           In the deep ocean where temporal variability is smaller, the
face ocean (2.2 ‰). Although there are no nitrate δ 15 N time       observation-EANN residuals of 0.2 ‰ are the same magni-
series measurements from the subsurface oxygen-deficient            tude as the δ 15 N analytical errors, further emphasizing the
zone (ODZ) waters where denitrification occurs, nitrate δ 15 N      ability of the model to match climatological average condi-
in ODZs presumably have similar seasonal-to-interannual (or         tions.
longer timescale) variability due to changes in the rate and
extent of water column denitrification (Deutsch et al., 2011;
Yang et al., 2017). For example, a larger-than-average rate of      4   Discussion
water column denitrification could explain the extreme δ 15 N
values at the bottom right of Fig. 3a – observations that all       The EANN’s skillful estimate of climatological nitrate δ 15 N
come from the ODZ waters of the eastern tropical South Pa-          will be useful for studies of the marine nitrogen cycle. The
cific (Bourbonnais et al., 2015; Casciotti et al., 2013; Rafter     zonal average view of EANN nitrate δ 15 N for each major
et al., 2012; Ryabenko et al., 2012). Some of these very high       ocean basin (Fig. 4) includes statistics comparing the obser-
nitrate δ 15 N values are associated with nitrate concentra-        vations to the EANN results above and below 1000 m. These
tions < 1 µmol kg−1 (Bourbonnais et al., 2015), values much         region-specific statistics show a weaker correlation between
lower than those within our climatology for the subsurface          EANN and observed nitrate δ 15 N in the deep Atlantic and
eastern tropical South Pacific. These values thus represent         Southern Ocean, despite a low RMSE and negligible mean
episodic denitrification events that the EANN will not be           bias. This weak correlation is due to the overall limited vari-

www.biogeosciences.net/16/2617/2019/                                                          Biogeosciences, 16, 2617–2633, 2019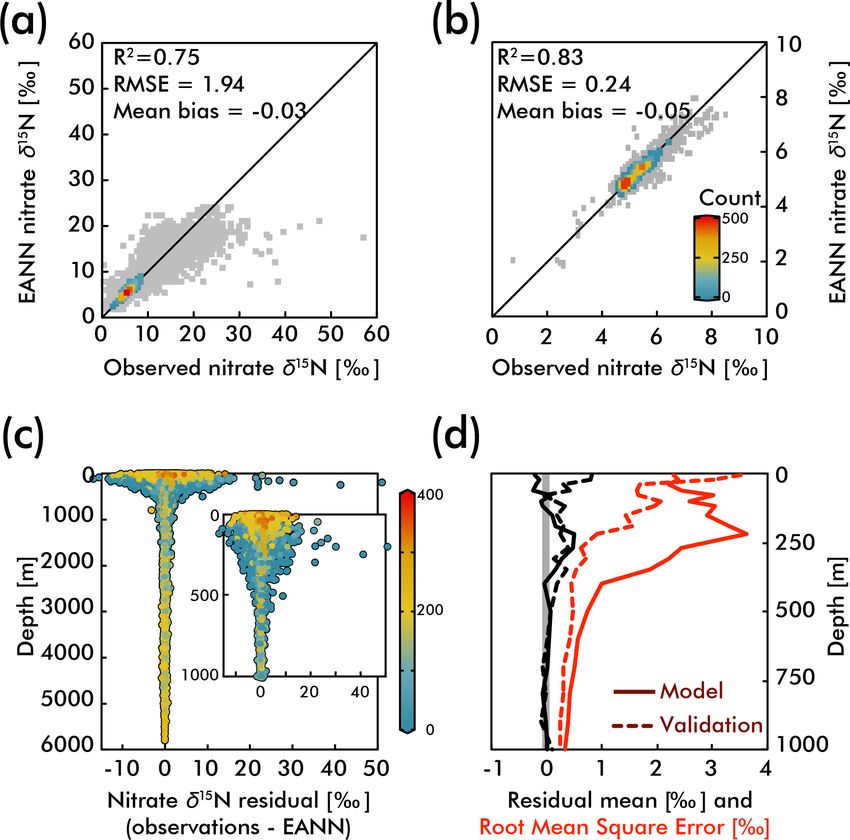
2622                                                                P. A. Rafter et al.: Global trends in marine nitrate N isotopes

ability of deep nitrate δ 15 N (±0.1 ‰) in these basins, which          to occur in the tropics (Marconi et al., 2017) followed by
is within the noise (analytical error) and the model cannot be          the advection of this remineralized nitrate to the North At-
expected to fit this variability (see Fig. 5d).                         lantic. This contrasts with numerical models arguing for high
   The nitrate δ 15 N sections in Fig. 4 show elevated values for       N2 fixation rates in the North Atlantic (Ko et al., 2018) and
the low latitude, upper mesopelagic Pacific Ocean (Fig. 4a),            South Atlantic (Wang et al., 2019). Similar local minima of
and Indian Ocean (Fig. 4d) where water column denitrifica-              subsurface δ 15 N appear in all the subtropical gyres (Fig. 5b),
tion raises the residual nitrate δ 15 N (Fig. 1a). Viewing this         which is consistent with observations (Casciotti et al., 2008;
elevated nitrate δ 15 N at the 250 m depth horizon (Fig. 5) bet-        Yoshikawa et al., 2015) and presumably indicates the impor-
ter reveals the spatial heterogeneity of the observations and           tance of N2 fixation in these regions (e.g., Ko et al., 2018)
EANN results. (It is because of this intra-basin heterogene-            and others. The N2 fixation δ 15 N signal in the Pacific Ocean
ity, and the fact that many observations are biased towards             (lowering in situ nitrate δ 15 N via remineralization of organic
the areas of denitrification, that we did not plot the observed         matter with lower δ 15 N) will be counteracted by the influ-
nitrate δ 15 N within the zonally averaged Fig. 4 views.) The           ence of water column denitrification in that basin (raising the
EANN error for the Fig. 5 depth intervals (Fig. 5e–h) is the            δ 15 N of residual nitrate), which imparts a high-δ 15 N signal,
standard deviation of the 25 ensemble members of the EANN               but a local minimum in δ 15 N can still be seen in the Pacific
and shows a decrease in ensemble variability with depth – a             subtropical gyres (Fig. 4a).
trend that is consistent with the overall decrease in observed             Nitrate assimilation by phytoplankton in the upper ocean
nitrate δ 15 N variability with depth (Figs. 4 and 5).                  is influenced by both the subsurface source nitrate δ 15 N and
   Below we inspect the observed and EANN-predicted ni-                 the degree of nitrate assimilation (Miyake and Wada, 1967;
trate δ 15 N and discuss the consistency of these results with          Wada and Hattori, 1978) (Fig. 1b). This gives the expectation
our understanding of published work. This analysis begins               that average nitrate δ 15 N values for the upper 50 m (Fig. 5a)
with the spatial distribution of nitrate delivered to the upper         will be consistently higher than those at 250 m (Fig. 5b).
ocean. We then discuss the impacts of upper ocean nitrate as-           However, the highest observed and estimated values in the
similation on organic matter δ 15 N and consider the influence          upper 50 m are not found above the ODZ regions, but are on
of organic matter remineralization on subsurface nitrate.               the edges of high nitrate concentration upwelling zones in the
                                                                        Southern Ocean, equatorial Pacific, and subarctic gyres (con-
4.1    Subsurface and surface nitrate δ 15 N                            tours in Fig. 2). Circulation in these “edge” regions allows for
                                                                        nitrate to be advected along the surface, lengthening its time
The nitrate δ 15 N distribution at 250 m depth (Fig. 5b) offers a       in the surface ocean and allowing more utilization to elevate
view of nitrate at a depth that is negligibly influenced by ni-         the residual nitrate δ 15 N pool. In other words, the degree of
trate assimilation, and therefore provides a qualitative view           nitrate utilization appears to play a more important role in
of spatial trends in nitrate delivered to the surface ocean. Ni-        determining surface nitrate δ 15 N than the initial value. (This
trate δ 15 N at this depth is highest in the northeastern and           is not the case for the organic matter δ 15 N produced from this
southeastern tropical Pacific and the Arabian Sea (Fig. 5b),            nitrate, which will be discussed more below.)
due to the influence of water column denitrification in the                Despite our expectation of higher nitrate δ 15 N in the up-
ODZs in these regions (Altabet et al., 2012; Bourbonnais et             per 50 m versus 250 m (Fig. 5a vs. b), we identify three types
al., 2015; Ryabenko et al., 2012), which preferentially uses            of regions where this difference is negative (Fig. 6): above
the light isotope and leaves the residual nitrate enriched in           ODZ waters, in subtropical Atlantic gyres, and north of the
15 N. A notable difference between the EANN and earlier                 Bering Strait. The explanation for the negative values above
model estimates of nitrate δ 15 N (Somes et al., 2010) is that          the ODZ regions is that the nitrate δ 15 N at 250 m must be
the EANN captures the much higher nitrate δ 15 N in the Ara-            much higher than the nitrate δ 15 N upwelled to the surface.
bian Sea relative to the Bay of Bengal (a relationship that is          This is consistent with elevated ODZ nitrate δ 15 N having
consistent with observed active denitrification in the Arabian          an indirect path to waters outside of ODZ regions (Peters
Sea).                                                                   et al., 2017; Rafter et al., 2013). The subtropical gyres also
   Lowest δ 15 N values of subsurface 250 m nitrate are found           have modeled nitrate δ 15 N in the upper 50 m that is less
in the Southern Ocean and in the North Atlantic. The North              than 250 m, but this finding is difficult to test with obser-
Atlantic subtropical gyre in particular has the lowest δ 15 N           vations because of low nitrate concentrations. That said, the
values in any basin (Fig. 5b; also see Marconi et al., 2015,            model predicts a lower nitrate δ 15 N in the upper ocean rela-
2017; Fawcett et al., 2011; Knapp et al., 2005, 2008), which            tive to that at 250 m, which is consistent with N2 fixation in
has been attributed to the remineralization of low-δ 15 N or-           these regions. Our estimated nitrate δ 15 N north of the Bering
ganic matter originating from N2 fixation, which produces               Strait suggests a previously unobserved elevation of subsur-
organic matter with a δ 15 N between 0 and −1 ‰ (similar to             face values relative to the surface.
atmospheric N2 ; see Fig. 1b; Carpenter et al., 1997; Hoering              Our discussion above highlights the difficulty of distin-
and Ford, 1960). Earlier work argues that this nitrate δ 15 N           guishing between the competing influences of the subsurface
lowering requires the bulk of Atlantic N2 fixation (≈ 90 %)             source nitrate δ 15 N and the degree of nitrate utilization on

Biogeosciences, 16, 2617–2633, 2019                                                          www.biogeosciences.net/16/2617/2019/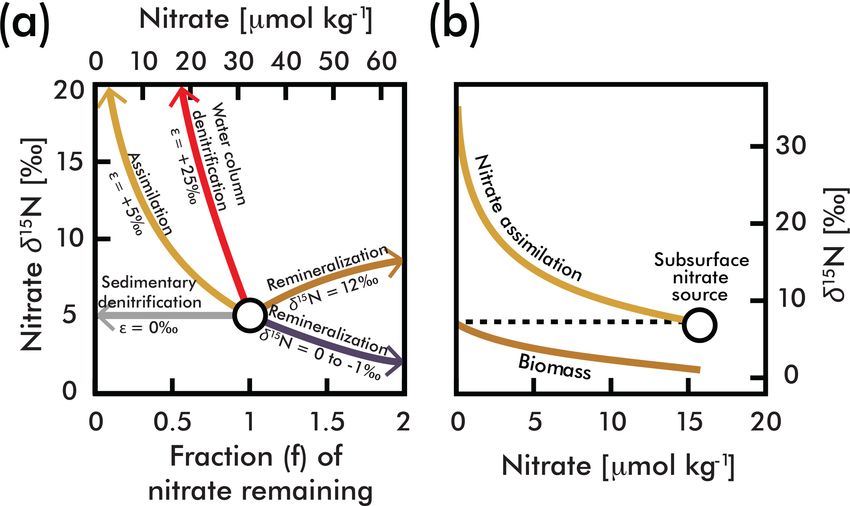
P. A. Rafter et al.: Global trends in marine nitrate N isotopes 2623
Figure 4. Zonal average of model nitrate δ 15 N versus latitude or longitude for the (a) Pacific Ocean, (b) Atlantic Ocean, (c) Southern Ocean,
and the (d) Indian Ocean. White bars indicate no data because of land. The R 2 , RMSE, mean bias, and total number (n) of observed versus
EANN nitrate δ 15 N are shown on the right for each region and depth range. White indicates regions of no data coverage. Note that these
zonally averaged views obscure zonal gradients in nitrate δ 15 N (see Fig. 5).
residual nitrate δ 15 N. Clearly a static depth does not reflect 4.2 Intermediate-depth nitrate δ 15 N variability
the subsurface source of nitrate delivered to the surface and
a more robust method for estimating this subsurface source Waters at “intermediate” depths (here shown as the 750 m
needs to be developed. However, some generalizations can surface in Fig. 5c) are important because they are part of a
be made regarding the organic matter δ 15 N produced in these large-scale circulation that originally upwells in the South-
regions and its potential influence (via remineralization) on ern Ocean and resupplies nutrients to the low-latitude ther-
subsurface nitrate throughout the water column via the ex- mocline (Palter et al., 2010; Sarmiento et al., 2004; Togg-
port and remineralization of organic matter (Sigman et al., weiler et al., 1991; Toggweiler and Carson, 1995). Within
2009a). For example, a local minimum in δ 15 N visible at the context of this overturning, the nitrate δ 15 N upwelling
250 m depth in the eastern equatorial Pacific (Fig. 5b; also in the Southern Ocean begins at ≈ 5 ‰ (Figs. 4c and 5c)
discussed in several studies; Rafter et al., 2012; Rafter and and is elevated ≈ 1 ‰ by partial nitrate assimilation in the
Sigman, 2016) is caused by the remineralization of organic Southern Ocean surface waters as they are advected equator-
matter with a low δ 15 N due to partial nitrate consumption at ward (see Figs. 5a and 6; Rafter et al., 2012). Deep winter-
the surface. Below we discuss these and other influences on time mixing in the subantarctic Pacific converts these South-
intermediate-depth nitrate δ 15 N. ern Ocean surface waters into mode and intermediate waters
(Herraiz-Borreguero and Rintoul, 2011), introducing nitrate
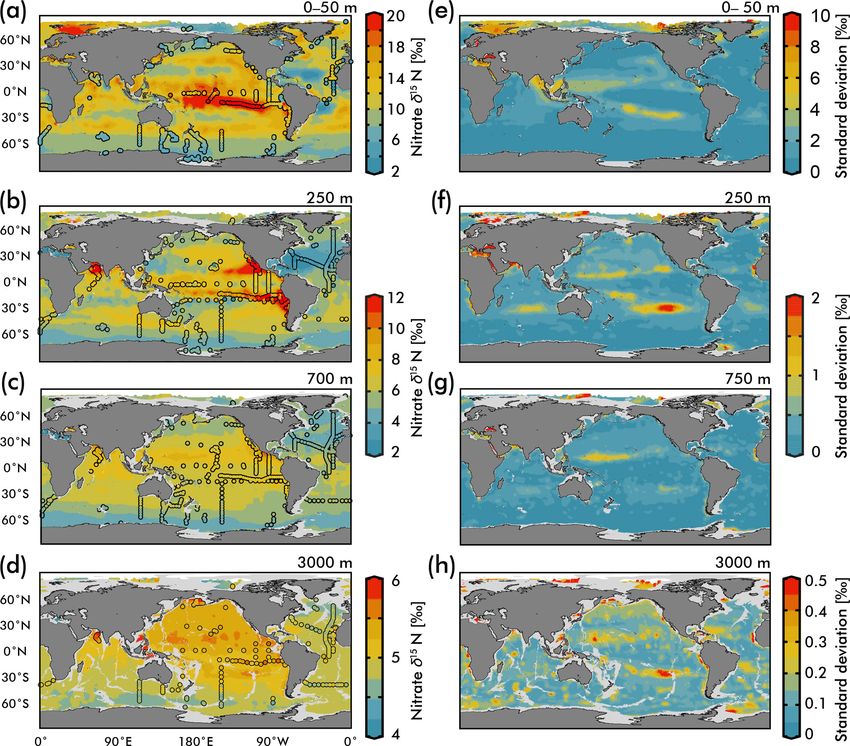
www.biogeosciences.net/16/2617/2019/ Biogeosciences, 16, 2617–2633, 20192624 P. A. Rafter et al.: Global trends in marine nitrate N isotopes Figure 5. (Left) Map view of nitrate δ 15 N from our EANN and our observations (circles) for the (a) average over the 0–50 m depth as well as the (b) 250 m, (c) 700 m, and (d) 3000 m depth surfaces. (Right) Map views of nitrate δ 15 N error from the EANN model nitrate δ 15 N for the same depth surfaces on the left. with a “preformed” δ 15 N of ≈ 6 ‰ into the intermediate- of ≈ 7 ‰ (Peters et al., 2017; Rafter et al., 2012, 2013). depth South Pacific and South Atlantic (Rafter et al., 2012, Similar processes likely elevate lower latitude intermediate- 2013; Tuerena et al., 2015) at depths between ≈ 600 and depth nitrate δ 15 N in the Indian Ocean. The Pacific and In- 1200 m (between ≈ 40◦ S and 20◦ N)(Fig. 4b). dian basins contrast with the Atlantic, where the subsurface Intermediate-depth nitrate δ 15 N increases from the South- source nitrate δ 15 N is generally lower (Fig. 6b), N2 fixation is ern Ocean toward the Equator in the Pacific Ocean and the enhanced, and the remineralization of organic matter lowers Indian Ocean, but less so in the Atlantic Ocean (Fig. 5). subsurface nitrate δ 15 N (Marconi et al., 2017). This contrast in intermediate-depth nitrate δ 15 N is likely caused by differences in δ 15 N of organic matter remineral- 4.3 Deep-sea nitrate δ 15 N trends ized in these regions. The increase in intermediate-depth ni- trate δ 15 N from the subantarctic to the tropical Pacific ap- Our discussion above suggests that the basin-scale balance pears to result from the remineralization of organic matter of N2 fixation and water column denitrification is a major with a δ 15 N increased by elevated source nitrate δ 15 N. Previ- contributor to inter-basin nitrate δ 15 N gradients in the upper ous work suggests that direct mixing with denitrified waters ocean (< 1000 m; see Fig. 5), lowering values in the Atlantic represents only a small fraction of the change from the pre- Ocean compared to the Pacific and Indian oceans. By aver- formed high-latitude value (≈ 6 ‰) to tropical nitrate δ 15 N aging EANN nitrate δ 15 N with depth for each ocean basin Biogeosciences, 16, 2617–2633, 2019 www.biogeosciences.net/16/2617/2019/
P. A. Rafter et al.: Global trends in marine nitrate N isotopes                                                                    2625

Figure 6. Difference between the average nitrate δ 15 N in the upper
50 m and 250 m depths in Fig. 5. Dashed contours in low-latitude
ODZ regions and subtropical gyres indicate regions where nitrate
δ 15 N at 250 m is greater than the upper 50 m nitrate δ 15 N.

(Fig. 7), we find that these basin-scale nitrate δ 15 N differ-
ences also persist into the deep sea (here defined as ≥ 3000 m
and below). Note that the inter-basin EANN nitrate δ 15 N gra-         Figure 7. Mean EANN nitrate δ 15 N (solid line) and 1σ standard
dients in Fig. 7a are smaller than the corresponding inter-            deviation (envelope) with depth for each ocean basin. Note change
basin gradients in observed δ 15 N, because the observations           in vertical and horizontal axes between (a) and (b).
are spatially biased towards areas of water column denitrifi-
cation in the Pacific and Indian oceans (see Fig. 2).
   The remineralization of organic matter is one process that          is consistent with annually averaged sinking organic matter
can – and has been used to – explain both the elevation of             δ 15 N of ≈ 0.9 ‰ to 1.6 ‰ in the open Antarctic zone (Lourey
deep Pacific nitrate δ 15 N (Peters et al., 2017; Rafter et al.,       et al., 2003), although published sediment trap results from
2013; Sigman et al., 2009a) and lowering of deep Atlantic              the iron-fertilized Kerguelen Plateau region are predictably
nitrate δ 15 N (Knapp et al., 2008; Marconi et al., 2017; Tuer-        higher because of increased nitrate utilization at the surface
ena et al., 2015) relative to the deep ocean mean. Here we             (Trull et al., 2008). The much lower Southern Ocean sinking
provide two additional pieces of evidence that argue for the           organic matter δ 15 N is consistent with partial consumption
remineralization of organic matter as the key driver of these          of nitrate at the surface (see Fig. 1b), which works export
deep-sea nitrate δ 15 N differences. Our first piece of evidence       nitrate with elevated δ 15 N to intermediate waters throughout
is that the average subsurface source of nitrate to the Pacific        the Southern Hemisphere (see discussion above and Rafter
Ocean and Indian Ocean surfaces has a significantly higher             et al., 2012, 2013). Based on this evidence, it appears that
δ 15 N (by 2 ‰ at the 250 m depth surface) than the Atlantic           global patterns of sinking organic matter δ 15 N are consistent
and Southern Ocean (Figs. 5b and 7). Nitrate δ 15 N at 250 m           with the remineralization of this organic matter driving sub-
is an admittedly imprecise estimate for the nitrate upwelled           tle, but significant differences in deep-sea nitrate δ 15 N.
to the surface, but even a slight elevation in Pacific source ni-         An alternative explanation for the deep-sea nitrate δ 15 N
trate δ 15 N and near-complete nitrate utilization at the surface      differences in Fig. 7 and Table 1 is that they reflect the lateral
will translate into higher sinking organic matter δ 15 N (i.e.,        (along isopycnal) advection of elevated nitrate δ 15 N from
see Fig. 1b).                                                          the shallower Pacific and Indian Ocean ODZ regions. How-
   Our second piece of evidence that the export and rem-               ever, we can easily dismiss this explanation by looking at
ineralization of organic matter drives the inter-basin differ-         the meridional trends in deep-sea nitrate δ 15 N – following
ences in deep nitrate δ 15 N comes from sediment trap mea-             the deep waters from their entrance in the south and move-
surements. Averaging published sediment trap organic matter            ment northward. What we find is that deep EANN nitrate
δ 15 N from the subtropical and tropical Pacific gives a value         δ 15 N (Fig. 5d) is lowest in the Southern Ocean and increases
of 8.5 ± 2.9 ‰ (Knapp et al., 2016; Robinson et al., 2012),            equatorward in the Pacific (Table 1). Average deep-sea ni-
which is significantly higher than measured in traps from              trate δ 15 N for the global ocean is 5.0±0.3 ‰, but average ob-
the Atlantic (4.5 ± 1.5 ‰) (Freudenthal et al., 2001; Holmes           served nitrate δ 15 N below 3000 m increases from 4.7±0.1 ‰
et al., 2002; Lavik, 2000; Thunell et al., 2004). Given ob-            in the Pacific sector of the Southern Ocean to 4.9 ± 0.2 ‰
served Southern Ocean nitrate characteristics (Rafter et al.,          in the deep South Pacific, 5.4 ± 0.2 ‰ in the deep tropi-
2013), we estimate an even lower typical sinking organic               cal Pacific, and 5.2 ± 0.2 ‰ in the deep North Pacific (Ta-
matter δ 15 N of +1.5 ‰ for this region, which assumes ini-            ble 1). This is consistent with elevated organic matter δ 15 N
tial nitrate values equal the upper circumpolar deep water             being produced at the surface and remineralized at depth in
and final values from the open Antarctic zone. This value              the lower-latitude Pacific Ocean. This is also consistent with

www.biogeosciences.net/16/2617/2019/                                                           Biogeosciences, 16, 2617–2633, 2019
2626                                                               P. A. Rafter et al.: Global trends in marine nitrate N isotopes

Table 1. Average EANN nitrate δ 15 N ≥ 3000 m for each ocean re-       5   Conclusions
gion (tropical being between 23.5◦ N and 23.5◦ S).
                                                                       We find that an ensemble of artificial neural networks
                               Indian     Pacific    Atlantic          (EANN) can be trained on climatological distributions of
                                                                       physical and biogeochemical tracers to reproduce a global
          North                n/a      5.4 ± 0.2   4.8 ± 0.1          database of nitrate δ 15 N observations (Fig. 2) with good fi-
          Tropical       5.1 ± 0.2      5.2 ± 0.2   4.9 ± 0.1
                                                                       delity (Fig. 3). We used the EANN to produce global cli-
          South          4.8 ± 0.1      5.0 ± 0.2   4.8 ± 0.1
                                                                       matological maps of nitrate δ 15 N at 1◦ resolution from the
                         Southern         Global                       surface to the seafloor. This climatology reveals large-scale
                         4.8 ± 0.1      5.0 ± 0.3                      spatial patterns in nitrate δ 15 N (Figs. 4–6) and quantifies
                                                                       regional and basin-average oceanic values of nitrate δ 15 N
        n/a – not applicable                                           (Fig. 7 and Table 1). Major differences between the observed
                                                                       and EANN-predicted nitrate δ 15 N appear to be caused by
                                                                       temporal variability of nitrate δ 15 N in the upper ocean and in
the known increase in nitrate concentrations and lowering of           ODZs associated with variable nitrate uptake and denitrifica-
deep oxygen concentrations from the deep South Pacific to              tion rates, respectively. Additional measurements of nitrate
tropical and North Pacific (e.g., see Fig. 4e in Rafter et al.,        δ 15 N will help to develop seasonally resolved maps that can
2013). This contrasts with the Atlantic, where there is with           improve upon the climatological mean map provided here.
no significant change in deep nitrate δ 15 N, despite the ex-
port of slightly elevated nitrate δ 15 N into intermediate-depth
Atlantic (see above and Tuerena et al., 2015). In summary,             Data availability. Observations can be obtained at https://doi.org/
inter-basin differences in sinking organic matter δ 15 N best          10.1575/1912/bco-dmo.768627.1 (Rafter et al., 2019a). Model out-
explains the inter-basin differences in the deep-ocean δ 15 N          put and code can be obtained at https://doi.org/10.1575/1912/
climatology. Diapycnal mixing from the low-latitude Pacific            bco-dmo.768655.1 (Rafter et al., 2019b).
ODZ regions may also play a part in the south-to-north ele-
vation of deep Pacific nitrate δ 15 N – a contribution that can
be quantified by integrating the climatological nitrate δ 15 N
fields with ocean circulation models.

Biogeosciences, 16, 2617–2633, 2019                                                          www.biogeosciences.net/16/2617/2019/
P. A. Rafter et al.: Global trends in marine nitrate N isotopes 2627
Appendix A
Table A1. Contributing analysts and references for citing original
data sources.
Region Analyst Institution Citation
Pacific North – Subarctic Mark Altabet U of Massachusetts, Dartmouth Altabet and Francois (1994b)
Pacific North – Subarctic Eitaro Wada JAMSTEC Wada (1980)
Pacific North – Subarctic Eric Galbraith McGill University Galbraith (2006)
Pacific North – Subarctic Jinping Wu U of British Columbia Wu et al. (1997)
Pacific North – Subarctic Moritz Lehmann University of Basel Lehmann et al. (2005)
Pacific North – Bering Sea Julie Granger U of Connecticut Granger et al. (2011, 2013)
Pacific North – Okhotsk Chisato Yoshikawa JAMSTEC Yoshikawa et al. (2006)
Pacific North – Kuroshio Kon-Kee Liu (deceased) National Central University, Taiwan Liu et al. (1996)
Pacific North – South China Sea George Wong Old Dominion University Wong et al. (2002)
Pacific North Julie Granger U of Connecticut J. Granger (unpublished data)
Pacific North Julie Granger U of Connecticut Umezawa et al. (2014)
Pacific North – Gulf of California Mark Altabet U of Massachusetts, Dartmouth Altabet et al. (1999)
Pacific North – Tropical Daniel Sigman Princeton University Sigman et al. (2005)
Pacific North – ALOHA Daniel Sigman Princeton University Sigman et al. (2009b)
Pacific North – ALOHA Karen Casciotti Stanford University Casciotti et al. (2008)
Pacific North Angela Knapp Florida State University Knapp et al. (2011)
Pacific North – Tropical Jay Brandes Skidaway Institute of Oceanography Brandes et al. (1998)
Pacific North – Tropical Maren Voß (Voss) Leibniz Institute for Baltic Sea Research Voss et al. (2001)
Pacific North – Tropical Moritz Lehmann University of Basel Kienast et al. (2008)
Pacific North – Tropical Nadine Lehmann Dalhousie University Lehmann et al. (2018)
Pacific North – Tropical Karen Casciotti Stanford University Casciotti and McIlvin (2007)
Pacific – Tropical Patrick Rafter UC Irvine Rafter et al. (2012), Rafter and Sig-
man (2016)
Pacific South – Tropical Kon-Kee Liu (deceased) National Central University, Taiwan Liu (1979)
Pacific South – Tropical Ricardo de Pol-Holz Centro de Investigación GAIA-Antártica De Pol-Holz et al. (2009)
Pacific South – Tropical Evgeniya Ryabenko GEOMAR Ryabenko et al. (2012)
Pacific South – Tropical Brian Peters Stanford University Peters et al. (2017)
Pacific South – Tropical Angela Knapp Florida State University Knapp et al. (2016)
Pacific South – Tropical Karen Casciotti Stanford University Casciotti et al. (2013)
Pacific South – Tropical Annie Bourbonnais University of South Carolina Bourbonnais et al. (2015)
Pacific South Chisato Yoshikawa JAMSTEC Yoshikawa et al. (2015)
Pacific South – Tasman Sea Patrick Rafter UC Irvine P. Rafter and D. Sigman (unpub-
lished data)
Pacific South – Tropical Patrick Rafter UC Irvine Rafter et al. (2012)
Pacific South – Chilean Margin Patrick Rafter UC Irvine Rafter et al. (2013)
Southern Ocean – Pacific Mark Altabet U of Massachusetts, Dartmouth Altabet and Francois (2001)
Southern Ocean – Pacific Daniel Sigman Princeton University Sigman et al. (1999a)
Southern Ocean – Pacific Preston Kemeny Cal Tech Kemeny et al. (2016)
Southern Ocean – Indian Karen Casciotti Stanford University Trull et al. (2008)
Southern Ocean – Indian Daniel Sigman Princeton University Sigman et al. (1999a)
Southern Ocean – Indian Peter DiFiore Princeton University DiFiore et al. (2006)
Southern Ocean – Atlantic Sandi Smart Stellenbosch University Smart et al. (2015)
Atlantic North – Subarctic Patrick Rafter UC Irvine P. Rafter and D. Sigman (unpub-
lished data)
Atlantic North – Subarctic Dario Marconi Princeton University Marconi et al. (2017)
Atlantic North – Subarctic Maren Voß (Voss) Leibniz Institute for Baltic Sea Research Voss (1991)
Atlantic North Annie Bourbonnais University of South Carolina Bourbonnais et al. (2009)
Atlantic North Karen Casciotti Stanford University Schlitzer et al. (2018)
Atlantic North Angela Knapp Florida State University Knapp et al. (2005)
Atlantic North Angela Knapp Florida State University Knapp et al. (2008)
Atlantic North Dario Marconi Princeton University Marconi et al. (2015)
www.biogeosciences.net/16/2617/2019/ Biogeosciences, 16, 2617–2633, 20192628 P. A. Rafter et al.: Global trends in marine nitrate N isotopes Table A1. Continued. Region Analyst Institution Citation Atlantic Tropical Martin Frank IFM-Geomar Schlitzer et al. (2018) Atlantic South Robyn Tuerena University of Edinburgh Tuerena et al. (2015) Mediterranean Julian Sachs University of Washington Sachs and Repeta (1999) Mediterranean Silvio Pantoja University of Concepción Pantoja et al. (2002) Indian North Birgit Gaye Universität Hamburg Gaye et al. (2013) Indian – Arabian Sea Mark Altabet U of Massachusetts, Dartmouth Altabet et al. (1999) Indian – Arabian Sea Jay Brandes Skidaway Institute of Oceanography Brandes et al. (1998) Indian – Arabian Sea Taylor Martin Stanford University Martin and Casciotti (2017) Indian – Arabian Sea Patrick Rafter UC Irvine DeVries et al. (2013) Indian South Kristen Karsh CSIRO Karsh et al. (2003) Indian South Frank Dehairs Vrije Universiteit Brussel Dehairs et al. (2015) Arctic Ocean Julie Granger U of Connecticut J. Granger (unpublished data) Arctic Ocean Francois Fripiat Université Libre de Bruxelles Fripiat et al. (2018) Biogeosciences, 16, 2617–2633, 2019 www.biogeosciences.net/16/2617/2019/
P. A. Rafter et al.: Global trends in marine nitrate N isotopes                                                                           2629

Author contributions. Data compilation was done by PAR. The              Bourbonnais, A., Altabet, M. A., Charoenpong, C. N., Larkum, J.,
ANN was developed by AB and TD. Coding and statistics were                  Hu, H., Bange, H. W., and Stramma, L.: N-loss isotope effects in
done by AB and PAR. All authors contributed to writing the                  the Peru oxygen minimum zone studied using a mesoscale eddy
manuscript.                                                                 as a natural tracer experiment, Global Biogeochem. Cy., 29, 793–
                                                                            811, https://doi.org/10.1002/2014GB005001, 2015.
                                                                         Brandes, J. A., Devol, A. H., Yoshinari, T., Jayakumar, D. A., and
Competing interests. The authors declare that they have no conflict         Naqvi, S. W. A.: Isotopic composition of nitrate in the cen-
of interest.                                                                tral Arabian Sea and eastern tropical North Pacific: A tracer for
                                                                            mixing and nitrogen cycles, Limnol. Oceanogr., 43, 1680–1689,
                                                                            1998.
Acknowledgements. We thank Mark Altabet, Karen Casciotti,                Breiman, L.: Bagging predictors, Mach. Learn., 24, 123–140,
Alyson Santoro, Benoit Pasquier, J. J. Becker, two anonymous                https://doi.org/10.1007/BF00058655, 1996.
reviewers, and Markus Kienast, as well as Julie Granger and              Carpenter, E. J., Harvey, H. R., Fry, B., and Capone, D. G.: Biogeo-
Daniel Sigman for (at-the-time) unpublished data. A complete list           chemical tracers of the marine cyanobacterium Trichodesmium,
of references can be found in the Appendix. Many figures were               Deep-Sea Res. Pt. I, 44, 27–38, https://doi.org/10.1016/s0967-
made using Ocean Data View software (Schlitzer, 2002). Custom-              0637(96)00091-x, 1997.
made color palettes are available via https://prafter.com/ (last ac-     Casciotti, K. L. and McIlvin, M. R.: Isotopic analyses of nitrate
cess: 1 January 2019). Timothy DeVries acknowledges support                 and nitrite from reference mixtures and application to East-
from NSF grant OCE-1658392.                                                 ern Tropical North Pacific waters, Mar. Chem., 107, 184–201,
                                                                            https://doi.org/10.1016/j.marchem.2007.06.021, 2007.
                                                                         Casciotti, K. L., Trull, T. W., Glover, D. M., and Davies, D.:
                                                                            Constraints on nitrogen cycling at the subtropical North Pa-
Review statement. This paper was edited by Perran Cook and re-
                                                                            cific Station ALOHA from isotopic measurements of nitrate
viewed by two anonymous referees.
                                                                            and particulate nitrogen, Deep-Sea Res. Pt. II, 55, 1661–1672,
                                                                            https://doi.org/10.1016/j.dsr2.2008.04.017, 2008.
                                                                         Casciotti, K. L., Buchwald, C., and McIlvin, M.: Implications of ni-
                                                                            trate and nitrite isotopic measurements for the mechanisms of ni-
References                                                                  trogen cycling in the Peru oxygen deficient zone, Deep-Sea Res.
                                                                            Pt. I, 80, 78–93, https://doi.org/10.1016/j.dsr.2013.05.017, 2013.
Altabet, M. A.: Constraints on oceanic N balance/imbalance               Cline, J. D. and Kaplan, I. R.: Isotopic fractionation of dissolved
  from sedimentary 15 N records, Biogeosciences, 4, 75–86,                  nitrate during denitrification in the eastern tropical North Pacific
  https://doi.org/10.5194/bg-4-75-2007, 2007.                               Ocean, Mar. Chem., 3, 271–299, https://doi.org/10.1016/0304-
Altabet, M. A. and Francois, R.: Sedimentary nitrogen isotopic ra-          4203(75)90009-2, 1975.
  tio as a recorder for surface ocean nitrate utilization, Global Bio-   Codispoti, L. and Christensen, J.: Nitrification, denitrification and
  geochem. Cy., 8, 103–116, 1994a.                                          nitrous oxide cycling in the eastern tropical South Pacific
Altabet, M. A. and Francois, R.: The use of nitrogen isotopic ratio         ocean, Mar. Chem., 16, 277–300, https://doi.org/10.1016/0304-
  for reconstruction of past changes in surface ocean nutrient uti-         4203(85)90051-9, 1985.
  lization, in Carbon Cycling in the Glacial Ocean: Constraints on       Dehairs, F., Fripiat, F., Cavagna, A.-J., Trull, T. W., Fernandez, C.,
  the Ocean’s Role in Global Change, Vol. 117, 281–306, Springer-           Davies, D., Roukaerts, A., Fonseca Batista, D., Planchon, F., and
  Verlag Berlin Heidelberg, 1994b.                                          Elskens, M.: Nitrogen cycling in the Southern Ocean Kerguelen
Altabet, M. A. and Francois, R.: Nitrogen isotope biogeochemistry           Plateau area: evidence for significant surface nitrification from
  of the antarctic polar frontal zone at 170◦ W, Deep-Sea Res. Pt.          nitrate isotopic compositions, Biogeosciences, 12, 1459–1482,
  II, 48, 4247–4273, 2001.                                                  https://doi.org/10.5194/bg-12-1459-2015, 2015.
Altabet, M. A., Murray, D. W., and Prell, W. L.: Climatically linked     De Pol-Holz, R., Robinson, R. S., Hebbeln, D., Sigman, D.
  oscillations in Arabian Sea denitrification over the past 1 m.y.:         M., and Ulloa, O.: Controls on sedimentary nitrogen isotopes
  Implications for the marine N cycle, Paleoceanography, 14, 732–           along the Chile margin, Deep-Sea Res. Pt. II, 56, 1100–1112,
  743, 1999.                                                                https://doi.org/10.1016/j.dsr2.2008.09.014, 2009.
Altabet, M. A., Ryabenko, E., Stramma, L., Wallace, D. W.                Deutsch, C., Brix, H., Ito, T., Frenzel, H., and Thompson, L.:
  R., Frank, M., Grasse, P., and Lavik, G.: An eddy-stimulated              Climate-Forced Variability of Ocean Hypoxia, Science, 333,
  hotspot for fixed nitrogen-loss from the Peru oxygen minimum              336–339, https://doi.org/10.1126/science.1202422, 2011.
  zone, Biogeosciences, 9, 4897–4908, https://doi.org/10.5194/bg-        DeVries, T., Deutsch, C., Rafter, P. A., and Primeau, F.: Marine den-
  9-4897-2012, 2012.                                                        itrification rates determined from a global 3-D inverse model,
Altabet, M. A., Pilskaln, C., Thunell, R., Pride, C., Sigman, D.,           Biogeosciences, 10, 2481–2496, https://doi.org/10.5194/bg-10-
  Chavez, F., and Francois, R.: The nitrogen isotope biogeochem-            2481-2013, 2013.
  istry of sinking particles from the margin of the Eastern North        DiFiore, P. J., Sigman, D. M., Trull, T. W., Lourey, M. J., Karsh, K.,
  Pacific, Deep-Sea Res. Pt. I, 46, 655–679, 1999.                          Cane, G., and Ho, R.: Nitrogen isotope constraints on subantarc-
Bourbonnais, A., Lehmann, M. F., Waniek, J. J., and Schulz-Bull,            tic biogeochemistry, J. Geophys. Res.-Oceans, 111, C08016,
  D. E.: Nitrate isotope anomalies reflect N2 fixation in the Azores        https://doi.org/10.1029/2005jc003216, 2006.
  Front region (subtropical NE Atlantic), J. Geophys. Res., 114,
  C03003, https://doi.org/10.1029/2007JC004617, 2009.

www.biogeosciences.net/16/2617/2019/                                                               Biogeosciences, 16, 2617–2633, 2019
You can also read