Variability of NO2 concentrations over China and effect on air quality derived from satellite and ground-based observations - Recent
←
→
Page content transcription
If your browser does not render page correctly, please read the page content below
Atmos. Chem. Phys., 21, 7723–7748, 2021
https://doi.org/10.5194/acp-21-7723-2021
© Author(s) 2021. This work is distributed under
the Creative Commons Attribution 4.0 License.

Variability of NO2 concentrations over China and effect on air
quality derived from satellite and ground-based observations
Cheng Fan1,3 , Zhengqiang Li1 , Ying Li2 , Jiantao Dong4 , Ronald van der A5,6 , and Gerrit de Leeuw1,5,6,7
1 StateEnvironment Protection Key Laboratory of Satellite Remote Sensing, Aerospace Information Research Institute,
Chinese Academy of Sciences, Beijing 100101, China
2 China Academy of Culture and Tourism, Beijing International Studies University, Beijing 100024, China
3 University of Chinese Academy of Sciences, Beijing 100049, China
4 School of Surveying and Land Information Engineering, Henan Polytechnic University, Jiao Zuo, China
5 Royal Netherlands Meteorological Institute (KNMI), R&D Satellite Observations, 3731GA De Bilt, the Netherlands
6 Nanjing University of Information Science and Technology (NUIST), School of Atmospheric Physics, No. 219,

Ningliu Road, Nanjing, Jiangsu, China
7 China University of Mining and Technology (CUMT), School of Environment Science and Spatial Informatics,

Xuzhou, Jiangsu 221116, China

Correspondence: Ying Li (liying20190063@bisu.edu.cn)

Received: 21 October 2020 – Discussion started: 5 November 2020
Revised: 11 March 2021 – Accepted: 23 March 2021 – Published: 20 May 2021

Abstract. The variation of NO2 concentrations in mainland         use of weekly concentrations is more accurate than the use
China is analyzed on different timescales, from decadal to        of monthly values, and the effects of long-term trends and
weekly, using both satellite data and data from ground-based      their reversal needs to be taken into account for the separa-
monitoring networks. TROPOMI (TROPOspheric Monitor-               tion of effects of the lockdown and the Spring Festival. Ne-
ing Instrument) data were used to study the spatial variations    glecting the possible reversal of the trends leads to overes-
of tropospheric NO2 vertical column densities (TVCDs) over        timation of the lockdown effect in the south and underesti-
the study area during 16–20 weeks after the Chinese Spring        mation in the north. The ground-based data confirm earlier
Festival (25 January 2020). These data were used to select        reports, based on satellite observations, that the expected im-
11 regions for more detailed analysis of the variation of NO2     provement of air quality due to the reduction of NO2 con-
TVCDs on a decadal timescale. In this analysis, monthly           centrations was offset by the increase of the concentrations
and annual averaged NO2 TVCDs derived from OMI (Ozone             of O3 and the different effects of the lockdown measures on
Monitoring Instrument) observations were used for the years       PM2.5 , as well as effects of meteorological influences and
2011 to 2019. The results show the NO2 TVCD trends for            heterogeneous chemistry. The AQI seems to be mostly influ-
different regions, all decreasing in response to emission re-     enced by PM2.5 rather than NO2 . A qualitative comparison
duction policies but with a different onset and a possible halt   between time series of satellite and ground-based NO2 ob-
of the decrease in recent years; trends and period in the south   servations shows both similarities and differences. The study
of the study area are different from those in the north. Vari-    further shows the different behaviors in city clusters in the
ations of NO2 TVCDs on shorter timescales, monthly and            north and south of China, as well as inland in the Sichuan
weekly, were analyzed using TROPOMI data. In addition,            and Guanzhong basins. Effects of other holidays and events
the variations of weekly-averaged ground-based NO2 con-           are small, except in Beijing where the air quality in 2020 was
centrations in 11 major cities were analyzed together with        notably better than in previous years. This study was under-
those for O3 and PM2.5 . In particular these data were used       taken for China, but the methodology and results have conse-
to determine their effect on the air quality as expressed by      quences for air quality studies in other areas, and part of the
the air quality index (AQI). For quantitative estimates, the      conclusions are generally applicable.

Published by Copernicus Publications on behalf of the European Geosciences Union.
7724                             C. Fan et al.: Variability of NO2 concentrations over China and their effect on air quality

1   Introduction                                                    densities (NO2 TVCDs) derived from satellite observations
                                                                    using the Ozone Monitoring Instrument (OMI) from 2011
Concentrations of aerosols and trace gases in the atmosphere        to 2019, which provides insights into the effects of pollu-
over China have been increasing in response to industrial           tion control strategies in different parts of China during re-
development and urbanization and are among the highest              cent years. The sudden reduction of the concentrations of
worldwide. However, during the last decade, air pollution           NO2 and other atmospheric constituents due to the unfortu-
control strategies were implemented as part of a series of          nate lockdown following the COVID-19 outbreak in China
government plans to reduce the concentrations of pollutants         provided another way to look at emission reductions and
(Jin et al., 2016; van der A et al., 2017; Zheng, 2018) and         the recovery of the concentrations when the lockdown was
thus improve air quality. Indeed, the concentrations of SO2 ,       gradually relaxed. The latter extends earlier work presented
NO2 and aerosols decreased and the trends, from the onset           in Fan et al. (2020a) on the concentrations of trace gases
of the reduction until recent years, have been quantified us-       and aerosols during the Chinese Spring Festival (25 January
ing satellite observations (Krotkov et al., 2016; Koukouli et       2020) and the initial phase of the lockdown during the fol-
al., 2016; van der A et al., 2017; de Leeuw et al., 2018; So-       lowing month. It is noted that the lockdown started during
gacheva et al., 2018; Zhao et al., 2017; Zhang et al., 2018).       the Spring Festival holidays, during which concentrations of
In addition, an unprecedented reduction of the concentra-           trace gases and aerosols usually change in response to chang-
tions of NO2 was observed at the end of January 2020, by            ing socioeconomic conditions during 1–2 weeks. This Spring
the TROPOspheric Monitoring Instrument (TROPOMI), on                Festival holiday effect was enhanced and extended over a
board the Copernicus Sentinel-5 Precursor satellite, follow-        longer period of time due to the lockdown. In the current
ing the nationwide lockdown in response to the COVID-19             study we focus on the variations of NO2 concentrations both
outbreak (e.g., Fan et al., 2020a; Liu et al., 2020; Bauwens et     in the years before the 2020 Spring Festival and during an
al., 2020). The decrease of anthropogenic NO2 emissions in          extended period of 16–20 weeks thereafter, for reasons ex-
early 2020 was quantified by, for example, Ding et al. (2020)       plained below.
and Zhang et al. (2020a). In response to the reduction of              In Fan et al. (2020a) we considered all species contribut-
the NO2 emissions, observations at ground-based monitoring          ing to the air quality index (AQI; see Appendix A for def-
stations showed the increase of O3 concentrations (e.g., Fan        inition), a measure used in air quality management. How-
et al., 2020a; Shi and Brasseur, 2020; Le et al., 2020), indicat-   ever, air quality, or the AQI, was not directly considered
ing the increase of the oxidizing capacity of the atmosphere        in Fan et al. (2020a), so we only looked at the change of
(e.g., Huang et al., 2020; Diamond and Wood, 2020; Le et al.,       the concentrations of PM2.5 , PM10 , NO2 , SO2 , CO and O3
2020; Zhao et al., 2020). The increased oxidizing capacity of       due to the lockdown. For all species, we used satellite data
the atmosphere resulted in the increase of secondary aerosol        (TROPOMI), except for tropospheric O3 which is not avail-
formation which in part explains the increase of the aerosol        able over China from TROPOMI, and ground-based moni-
optical depth (AOD) over the North China Plain (NCP),               toring observations. TROPOMI data were used for 2019 and
observed from satellites (e.g., Fan et al., 2020a; Huang et         2020 as monthly averages for the period before and after the
al., 2020; Le et al., 2020; Diamond and Wood, 2020), and            Spring Festival in these years. The changes resulting from
the concentrations of PM2.5 observed in situ by ground-             reduced anthropogenic activities during the Spring Festival
based monitoring networks (e.g., Fan et al., 2020a; Shi and         holidays in 2019 were used as reference to separate the lock-
Brasseur, 2020; Le et al., 2020). Over the NCP, aerosol for-        down effect from the overall reduction during the period in-
mation was further promoted by meteorological conditions            cluding both the Spring Festival and the lockdown in the win-
like low wind speed and high relative humidity, which is con-       ter of 2020. We concluded that the use of 30 d averages leads
ducive to the formation of haze (e.g., Zhao et al., 2020). Fur-     to underestimation of the Spring Festival effect and overesti-
thermore, aerosol emissions were much less affected by the          mation of the COVID-19 lockdown effect and that for more
lockdown than NO2 (Diamond and Wood, 2020). Hence, dif-             reliable estimates shorter periods should be used. Therefore,
ferent species contributing to air pollution were affected by       in the current study, weekly maps of tropospheric NO2 ver-
the lockdown in different ways. Several authors concluded           tical column densities (NO2 TVCDs) were produced as a
that, in spite of the strong reduction of anthropogenic emis-       compromise between increased time resolution, showing the
sions, pollution still occurred over China due to the combi-        progressive decrease of the concentrations, and data qual-
nation of meteorological influences, economic impacts and           ity. In Fan et al. (2020a) we concluded that the TROPOMI
complex chemistry (e.g., Shi and Brasseur, 2020; Huang et           SO2 data showed the reduction of SO2 , but the signal was
al., 2020; Diamond and Wood, 2020; Le et al., 2020; Zhao et         too noisy to deduce a clear quantitative effect, while we also
al., 2020; Li et al., 2020).                                        showed that the lockdown did not have a clear effect on the
   In the current study we examine the evolution of the             CO TVCDs (except in the south of China). Therefore, and
concentrations of tropospheric NO2 in China over the last           because of the interactions between NO2 , O3 and aerosols,
10 years, until mid-2020. To this end, we extend satellite-         the current study focuses on these three species, using both
derived time series of tropospheric NO2 vertical column             satellite data and ground-based data from air quality moni-

Atmos. Chem. Phys., 21, 7723–7748, 2021                                              https://doi.org/10.5194/acp-21-7723-2021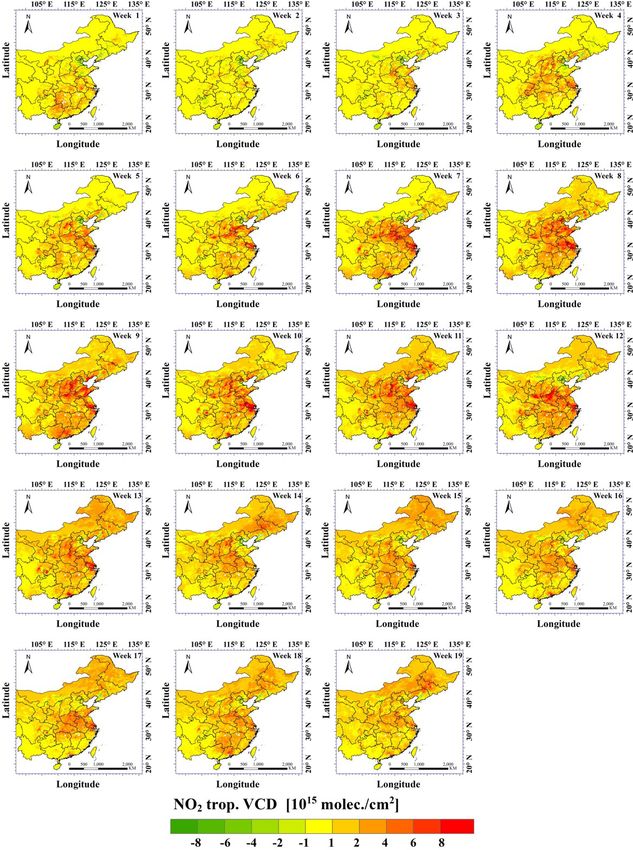
C. Fan et al.: Variability of NO2 concentrations over China and their effect on air quality                                   7725

toring stations. Instead of the 26 provincial capitals, 11 areas   to as Party Congress hereafter) took place in Beijing (21–28
in different parts of China were selected where satellite data     May). How did these events influence the air quality?
showed large changes in the NO2 TVCDs.                                These objectives are addressed by studying satellite mea-
   When the lockdown measures were gradually relaxed, the          surements of NO2 TVCDs and ground-based monitoring
emissions and thus air pollution increased. Several studies        data of PM2.5 , NO2 and O3 , as well as the air quality in-
reported that air quality was “back to normal” after 40 d          dex (AQI). Differences between satellite observations and
(Bauwens et al., 2020; Filonchyk et al., 2020; Wang and            ground-based monitoring NO2 data are discussed based
Su, 2020). In the current study we address the question of         on weekly time series during early 2020. Time series of
what is “normal”, using satellite observations over the last       monthly-averaged NO2 TVCDs for the period 2011–2020
decade over selected regions, extending to 16–20 weeks af-         are used, as well as weekly averages in 2020. The study
ter the 2020 Spring Festival. In addition to satellite data, we    focuses on 11 regions in China, mainly around provincial
use ground-based observations from the Chinese air quality         capitals, selected based on the NO2 TVCD levels at about
monitoring network, providing detailed information in differ-      3 months after the 2020 Spring Festival. It is noted that the
ent regions, and compare those for 2020 with similar obser-        methodology and part of the ensuing results have generally
vations in the last 5 years (2015–2019). The reason for this       applicability and do not only apply over China.
study is the gradual decrease of NO2 TVCDs and AOD dur-
ing extended periods in the last decade, as mentioned above,
in response to policy measures by the Chinese Government           2     Methods
to reduce emissions and improve air quality. In the estimates
of the lockdown effects on air pollution such trends were ac-      2.1    Study area
counted for by comparison of 2020 with the previous year or
years. However, the NO2 TVCDs in early 2020, before the            In the current study we focus on the part of mainland China
Spring Festival, were much lower than those in 2019, and           east of the Hu line (Fig. 1), further referred to in this pa-
the question of whether the trends derived in earlier studies      per as east China, where 94 % of the Chinese population
were continued in more recent years arose. In other words,         lives (Chen et al., 2016). This part of China is one of the
how well can the expected baseline concentrations, serving         most polluted regions in the world, for which the air qual-
as reference to determine the reduction of the concentrations      ity was much improved during the COVID-19 lockdown. To
during the lockdown period with respect to the normal situa-       monitor the rebound of the concentrations when the lock-
tion, be determined?                                               down measures were gradually released, maps were used of
   Another question was whether air quality (AQ) was really        weekly averages of NO2 TVCDs derived from TROPOMI
improved, in spite of the enormous reduction of NO2 as ob-         (see Sect. 3.1.2, Fig. 5) and their differences with respect to
served by satellites and confirmed by ground-based monitor-        week 0, i.e., the Spring Festival week from 25 to 31 January,
ing networks. As discussed above, in response to the reduced       2020 (week numbers are listed in Table A1; difference maps
NO2 concentrations shifting the oxidizing capacity, surface        are presented in Fig. A3). The difference map for week 12
O3 concentrations increased, and also aerosol concentrations       is shown in Fig. 1 (week 12 was somewhat arbitrarily se-
were affected or even increased over the NCP. Taking into          lected at the end of a period of 5 weeks when concentrations
account the different behavior of NO2 , O3 and PM2.5 , the         seemed to be stabilized and undisturbed by other festivals,
question arose what the effect of the lockdown was on the          as discussed in Sect. 3.1.2). The yellow background in this
air quality, as expressed by the air quality index and how AQ      map indicates no changes with respect to week 0, red indi-
or AQI reacted to the gradual release of the socioeconomic         cates an increase and green indicates a decrease of the NO2
restrictions.                                                      TVCD. Based on the occurrence of a strong increase or de-
   The objectives of the current study are thus (1) to extend      crease, 11 regions were selected for the study on regional
the time series from previous studies to evaluate whether          differences in which satellite data are complemented with
earlier trends continued and can be used to determine base-        ground-based data. The names of the regions shown in Fig. 1
line concentrations; (2) to determine whether the air qual-        are listed in Table 1, together with their geographical loca-
ity was indeed improved as much as anticipated from the re-        tions. These regions include well-known centers such as the
duction of NO2 TVCDs deduced from satellite observations;          Beijing–Tianjin area, Shijiazhuang in west Hebei, and Jinan
and (3) to evaluate whether the pollutant concentrations had       in Shandong, all in the North China Plain (NCP); Shanghai
returned to normal levels during the study period of 16–20         in the Yangtze River Delta (YRD); Guangzhou in the Pearl
weeks after the COVID-19 outbreak, i.e., during the gradual        River Delta (PRD); Chongqing and Chengdu; and Wuhan.
relaxation of the lockdown measures when socioeconomic             Each region includes a large city for which monitoring data
life returned to normal. During these 19 weeks, two signifi-       are available for comparison with the satellite data (Fan et al.,
cant events occurred in China: the Tomb-Sweeping Festival          2020a). The selected regions provide a reasonable geograph-
(4–6 April) and the May holidays (1–5 May). In addition the        ical spread across the study area with the NCP, the YRD and
National Congress of the Chinese Communist Party (referred         the PRD, as well as mountain areas with large basins such as

https://doi.org/10.5194/acp-21-7723-2021                                            Atmos. Chem. Phys., 21, 7723–7748, 2021
7726                               C. Fan et al.: Variability of NO2 concentrations over China and their effect on air quality

                                                                        instrument/index.php, last access: 30 January 2021). With
                                                                        a 2600 km wide swath, OMI provides daily global cover-
                                                                        age in 14 orbits. In this study the OMI Quality Assurance
                                                                        for Essential Climate Variance (QA4ECV) version 1.1 prod-
                                                                        uct (https://doi.org/10.21944/qa4ecv-no2-omi-v1.1) with a
                                                                        13 km×24 km spatial resolution is used (Boersma et al.,
                                                                        2018). This product was validated by, for example, Lorente
                                                                        et al. (2017) and Zara et al. (2018). The measurement of
                                                                        NO2 is one of the explicit objectives of the Aura OMI mis-
                                                                        sion. The monthly-mean tropospheric NO2 column density
                                                                        data are derived from satellite observations based on slant
                                                                        column NO2 retrievals with the differential optical absorp-
                                                                        tion spectroscopy (DOAS) technique and the KNMI com-
                                                                        bined modeling/retrieval/assimilation approach (Boersma et
                                                                        al., 2011). NO2 TVCDs for the years 2011–2019 were
                                                                        downloaded from the following website: http://www.temis.
                                                                        nl/airpollution/no2.html (last access: 30 January 2021).
Figure 1. Study area showing the NO2 TVCD difference map for
week 12 (i.e., NO2 TVCD for week 12 minus NO2 TVCD for week             2.2.2    TROPOMI
0). The 11 focus regions are indicated with numbers, corresponding
to their names and coordinates which are listed in Table 1. The black   TROPOMI is a passive hyperspectral nadir-viewing imager
diagonal line is the Hu line (Chen et al., 2016).                       on board the Sentinel-5 Precursor satellite (also known as
                                                                        Sentinel-5P) launched on 13 October 2017 (Veefkind et al.,
                                                                        2012). Sentinel-5P is a near-polar orbiting Sun-synchronous
the Chongqing/Sichuan and the Guanzhong basins, all with
                                                                        satellite flying at an altitude of 817 km in an ascending node
high pollution levels, high population density and high level
                                                                        with an Equator-crossing time at 13:30 LT and a repeat cy-
of industrialization but with different climatological and me-
                                                                        cle of 17 d. The swath width is approximately 2600 km, re-
teorological influences on air quality.
                                                                        sulting in daily global coverage, with an along-track reso-
                                                                        lution of 7 km (Veefkind et al., 2012). TROPOMI products
2.2     Satellite data
                                                                        used in this study are L3 offline (OFFL) version products
Two satellite products were used in this study, i.e., the tropo-        (see http://www.TROPOMI.eu/data-products/ for more de-
spheric NO2 vertical column densities (NO2 TVCDs) from                  tail), in particular tropospheric NO2 vertical column density
OMI and TROPOMI. These products are briefly discussed in                data for the period around the 2020 Spring Festival. The spa-
the following subsections. The OMI NO2 TVCDs were used                  tial resolution at nadir for most products used in this study
for time series analysis over the period 2011–2019, during              is 1 km (https://developers.google.com/earth-engine/guides/
most of which TROPOMI data were not yet available. The                  scale; last access: 30 January 2021).
TROPOMI NO2 TVCDs, with better spatial resolution, were                    The operational validation results are reported ev-
used to visualize weekly-averaged spatial variations and cal-           ery 3 months at the S5P-MPC-VDAF website (http://
culate time series over selected regions, which together show           mpc-vdaf.TROPOMI.eu/, last access: 30 January 2021). The
the evolution of NO2 TVCDs over the study area. OMI and                 TROPOMI/S5P tropospheric NO2 column is operationally
TROPOMI products thus provide complementary informa-                    validated by the S5P-MPC-VDAF (S5P – Mission Perfor-
tion for different periods of time and were used for different          mance Centre – Validation Data Analysis Facility) using
purposes.                                                               the Pandora NO2 total columns from the Pandonia Global
                                                                        Network (PGN). The comparison shows a negative bias of
2.2.1    OMI                                                            roughly 30 %.

The Ozone Monitoring Instrument (OMI) on board NASA’s                   2.3     Ground-based data
Aura satellite was launched in July 2004 (Schoeberl et al.,
2006; Levelt et al., 2018). Aura is in a Sun-synchronous polar          The ground-based data used in this study were downloaded
orbit with an Equator-crossing time at 13:30 LT (local time).           from http://www.pm25.in/ (last access: 30 January 2021),
The OMI instrument employs hyperspectral imaging in a                   which is the National Real-time Air Quality Publishing Plat-
push-broom mode to observe solar radiation backscattered                form public website for air quality monitoring data main-
by the Earth’s atmosphere and surface at 740 wavelengths                tained by the China National Environmental Monitoring
over the entire range from 270 to 500 nm with a spectral reso-          Center (CNEMC) of the Ministry of Ecology and Environ-
lution of about 0.5 nm (https://projects.knmi.nl/omi/research/          ment of China (MEE; see http://www.mee.gov.cn/, last ac-

Atmos. Chem. Phys., 21, 7723–7748, 2021                                                  https://doi.org/10.5194/acp-21-7723-2021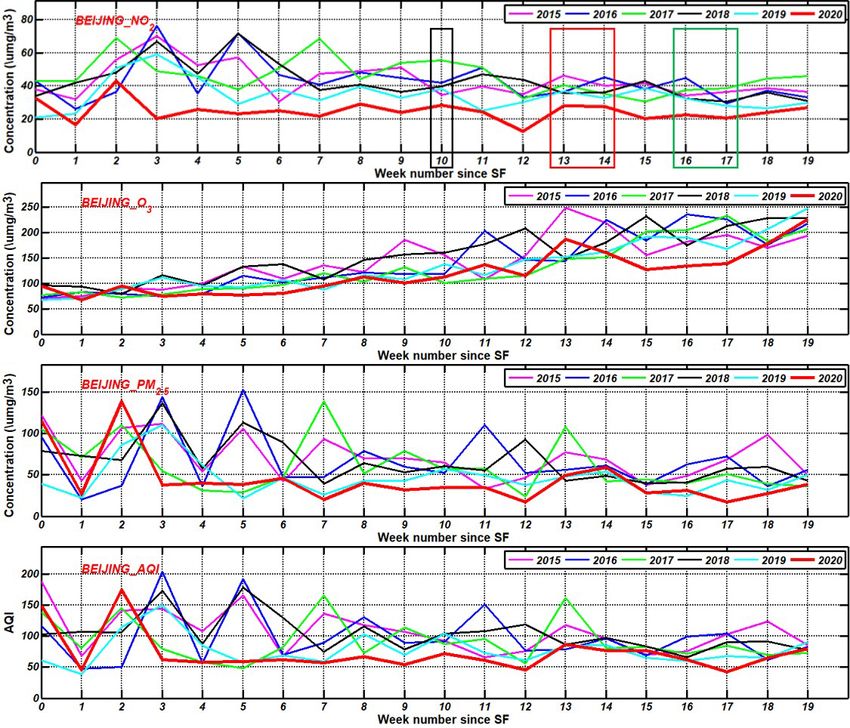
C. Fan et al.: Variability of NO2 concentrations over China and their effect on air quality                                             7727

Table 1. Focus regions of the current study. The locations corresponding to the numbers in the first column are shown on the map in Fig. 1.
Coordinates in columns 3 and 4 are for the upper left corner of each region; the size around the corner of each region is indicated in columns
5 and 6. Regions are indicated with the name of the central city.

                             No.    Name                Latitude (◦ )   Longitude (◦ )   1Lat (◦ )   1Long (◦ )
                             1      Beijing–Tianjin             35.0            108.0         1.5            1.5
                             2      Shijiazhuang                39.0            114.0         2.5            1.5
                             3      Jinan                       37.5            117.0         1.5            2.0
                             4      Zhengzhou                   35.5            112.0         1.5            2.0
                             5      Shanghai                    32.0            119.5         2.0            2.0
                             6      Guangzhou                   24.0            112.5         2.0            2.0
                             7      Nanchang                    29.0            115.0         1.5            1.5
                             8      Wuhan                       31.5            113.0         1.5            2.0
                             9      Xi’an                       35.0            108.0         1.5            1.5
                             10     Chongqing                   30.0            106.0         1.5            1.5
                             11     Chengdu                     31.5            103.0         1.5            2.0

cess: 30 January 2021, for more detail). This website pro-                in the winter and shallow minima in the summer. The win-
vides PM2.5 , PM10 , SO2 , NO2 , O3 and CO hourly and 24 h                ter TVCD maxima were about a factor of 5 larger than the
moving averages for each site or city. Measurement tech-                  summer minima, with the ratio varying somewhat by region,
niques used at the stations, reliability of the data and quality          with higher values in Shijiazhuang (7.2) and Zhengzhou (6.0)
control were briefly described by Silver et al. (2018) and Zhai           and lowest values of about 2.5 in Guangzhou and Chengdu.
et al. (2019); see also Ministry of Environmental Protection              These numbers are in reasonable agreement with the factor of
of People’s Republic of China (MEE, 2012). The data from                  3 reported by Shah et al. (2020) for the NO2 TVCD averaged
these websites are provided by local governments and have                 over central-east China.
been used in several studies related to air pollution, air qual-             On a monthly scale, the TVCD maximum varies a little
ity and other aspects in China (Xue et al., 2020; Fan et al.,             between regions and years, but in general the peaks occur
2020a, b) (http://www.pm25.in/sharer, last access: 30 Jan-                in the winter. For the study of lockdown effects (Sect. 3.1.2),
uary 2021). For the current study, we collected hourly PM2.5 ,            the fast decrease of the NO2 TVCDs from December/January
NO2 and O3 data for the large cities in the 11 study regions              toward the summer implies that, if there would be no restric-
indicated in Sect. 2.1 (Fig. 1, Table 1), for up to 20 weeks              tions, the NO2 TVCDs would have decreased by a factor of
after the Spring Festival during the years 2015–2020. In the              2.5–7, depending on the region, from the pre-lockdown pe-
current study, the data collected at different locations in each          riod to the time when all measures were released. This needs
city were averaged to get a spatially representative number               to be taken into account in any study on the effect on air
for the whole city, as daily (24 h) averages, which subse-                quality during different stages of the COVID-19 lockdown.
quently were averaged to weekly values.
                                                                          Trends of annually-averaged tropospheric NO2 TVCDs
3     Results
                                                                          Figure 2 shows an overall decrease of the winter-peak
3.1     Satellite observations                                            TVCDs between 2012 and 2017, whereas in the years 2017–
                                                                          2019 they are of similar magnitude, i.e., the decrease seems
3.1.1    NO2 TVCD time series and trends for different                    to have come to a halt. Similar behavior is observed in the
         regions between 2011 and 2019                                    summer months. However, the time series suggest that the
                                                                          period of decreasing NO2 TVCDs and the occurrence of
Monthly-mean NO2 TVCD time series                                         the maximum and minimum values was not the same for
                                                                          all regions. To further investigate trends in different regions
Time series of monthly-mean TVCDs for tropospheric NO2                    and the differences between them, the time series were de-
derived from OMI data over the 11 regions defined in Ta-                  seasonalized using a centered moving average with a period
ble 1 are presented in Fig. 2, for the period from 1 Jan-                 of 12 months, and, to reduce effects of variations due to other
uary 2011 until 31 December 2019. The NO2 TVCDs varied                    influences than the seasonal effects (e.g., due to meteorolog-
strongly by region, with the highest TVCDs in Shijiazhuang,               ical conditions), the de-seasonalized data were averaged to
Zhengzhou and Jinan (in 2012), although the relative differ-              annual mean NO2 TVCDs. Time series of annual mean NO2
ences changed from year to year. For each region, the time                TVCDs are presented in Fig. A1. The data in Fig. A1 show
series show the strong seasonal variations with sharp peaks               a grouping with high NO2 TVCDs in the north of the study

https://doi.org/10.5194/acp-21-7723-2021                                                    Atmos. Chem. Phys., 21, 7723–7748, 2021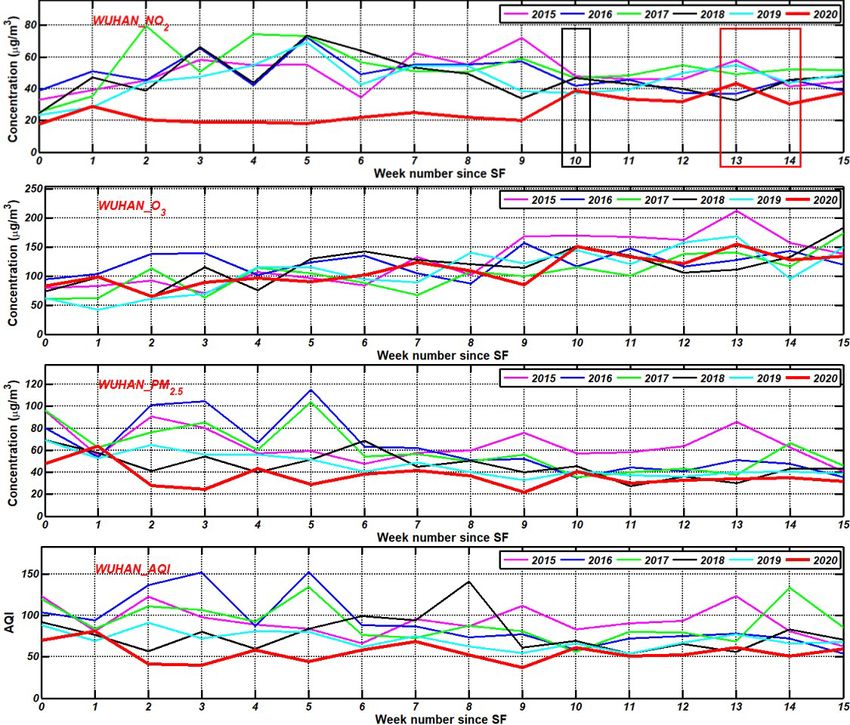
7728 C. Fan et al.: Variability of NO2 concentrations over China and their effect on air quality
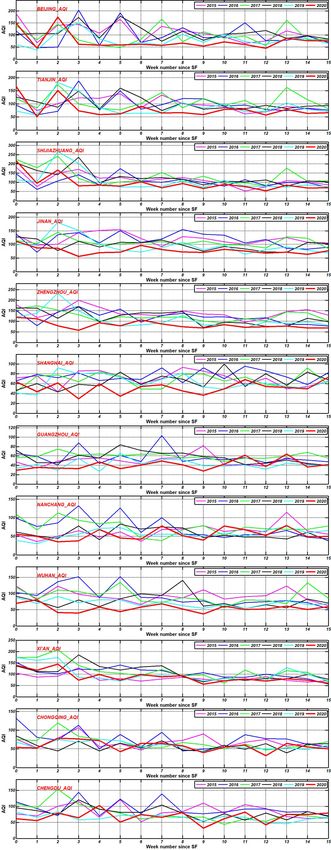
Figure 2. Time series of monthly-mean NO2 TVCDs derived from OMI data, for 11 regions from January 2011 to December 2019. The
NO2 TVCDs are plotted on a logarithmic scale to better visualize the differences between different regions as well as the gradual variation
of the TVCDs during the summer months.
area and Shanghai and a clear separation from the other re-
gions where the TVCDs are lower, as also expected from the
maps in, for example, Fig. 4a. Another noticeable difference
between the regions is the clear distinction between the tem-
poral behavior in the north and in the south. In each of the
regions in the north, i.e., in the NCP (Shijiazhuang, Beijing,
Jinan and Zhengzhou), the TVCDs were similar in 2011,
2012 and 2013; from 2013 they decreased exponentially un-
til 2018. In the other regions, i.e., Shanghai and those in the
south and west, the TVCDs decreased exponentially from
2011 until they reached a minimum value in 2015 or 2016
after which they remained low (e.g., Shanghai, Nanchang,
Xi’an) or even increased somewhat (Chongqing). Overall, af-
ter 2016 the TVCDs in these regions fluctuated from year to
year but remained within 10 % of the values in 2015 (except
in Chongqing). In view of these differences, trend lines fitted
to the annual mean NO2 TVCD data in regions in the north
were fitted for the years 2013–2018, whereas for the other
regions trend lines were fitted for the years 2011–2015 or
2016. The trend lines were added to Fig. A1, and the result
is presented in Fig. 3. The trend lines were plotted for the
whole period 2011–2019 rather than only for their period of
Figure 3. Time series of annual mean NO2 TVCDs, derived from
validity, to illustrate that beyond the fit interval the TVCDs de-seasonalized monthly OMI data, for each of the 11 regions,
do not follow the trend for the region under consideration which are plotted on a semilogarithmic scale and fitted with expo-
and level off as discussed above. The trends are presented in nential trend lines (solid lines, y = a × ebt ). The periods and trends
Table 2, where the trend (yr−1 ) describes an exponential de- are listed in Table 2. The data points for each region are connected
crease of the TVCDs following the relationship y = a × ebt , with dashed lines for easy identification. Note that the trend lines
where y = TVCD, a is the intercept (TVCD in first year of strictly apply only to the different periods as described in the text
the fitting period, i.e., year1 = 2011 or 2013), b is the trend and listed in Table 2 but were plotted over the whole period 2011–
(yr−1 ) and t is the number of years after year1. Coefficients 2019 to demonstrate the deviations from the trends beyond the pe-
of determination (R 2 ) are all high and the trend lines in Fig. 3 riod of validity.
show the good fit.
Atmos. Chem. Phys., 21, 7723–7748, 2021 https://doi.org/10.5194/acp-21-7723-2021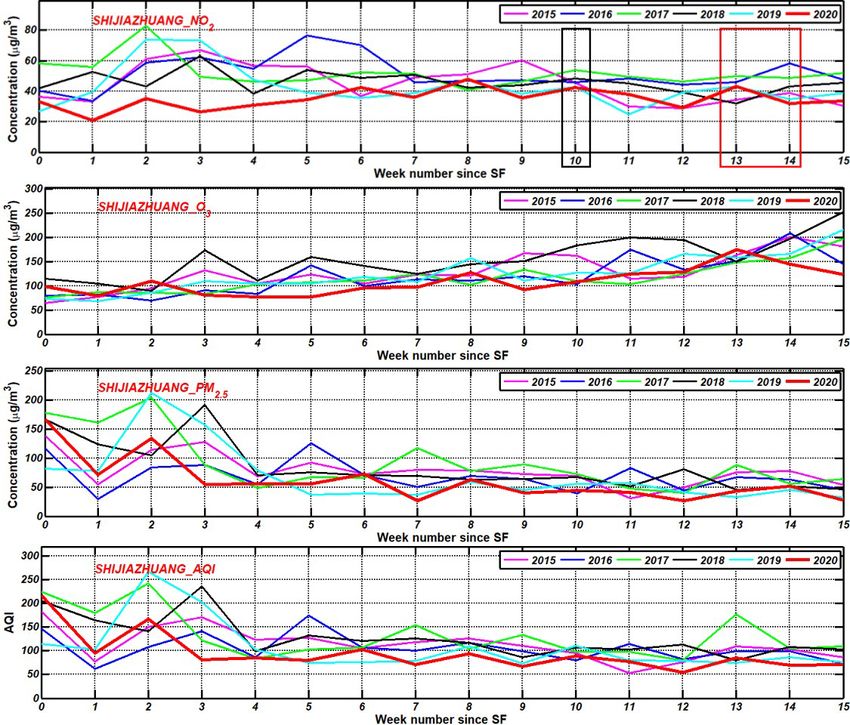
C. Fan et al.: Variability of NO2 concentrations over China and their effect on air quality 7729
Table 2. NO2 TVCD trends determined for the period indicated 3.1.2 Evolution of NO2 spatial distributions after the
in the third column. Trends are determined using exponential fits 2020 Spring Festival
(y = a × ebt ) to time series of the annual mean NO2 TVCDs as
shown in Fig. 3 and described in the text. For the evaluation of the spatial distributions and the
short-term time series of NO2 TVCDs over small regions,
Number Region Period Trend (yr−1 ) R2 TROPOMI data were used because of their improved spatial
1 Beijing–Tianjin 2013–2018 −0.08 0.99 resolution as compared to OMI data (Sect. 2.2). NO2 TVCDs
2 Shijiazhuang 2013–2018 −0.11 0.93 derived from TROPOMI observations, averaged over 30 d
3 Jinan 2013–2018 −0.11 0.93 before and after the 2020 Spring Festival, are presented
4 Zhengzhou 2013–2018 −0.12 0.84 in Fig. 4. Figure 4 shows the large difference in the NO2
5 Shanghai 2011–2016 −0.09 0.94
6 Guangzhou 2011–2015 −0.06 0.98
TVCDs before and after the 2020 Spring Festival, similar to
7 Nanchang 2011–2015 −0.06 0.80 those used in Fan et al. (2020a) for all China to illustrate
8 Wuhan 2011–2016 −0.08 0.96 and analyze the effect of the COVID-19 containment policy
9 Xi’an 2012–2016 −0.11 0.99 measures. Fan et al. (2020a) concluded that the use of 30 d
10 Chongqing 2011–2016 −0.08 0.90 averages leads to underestimation of the Spring Festival ef-
11 Chengdu 2011–2016 −0.05 0.88 fect and overestimation of the COVID-19 lockdown effect
and that for more reliable estimates shorter periods should
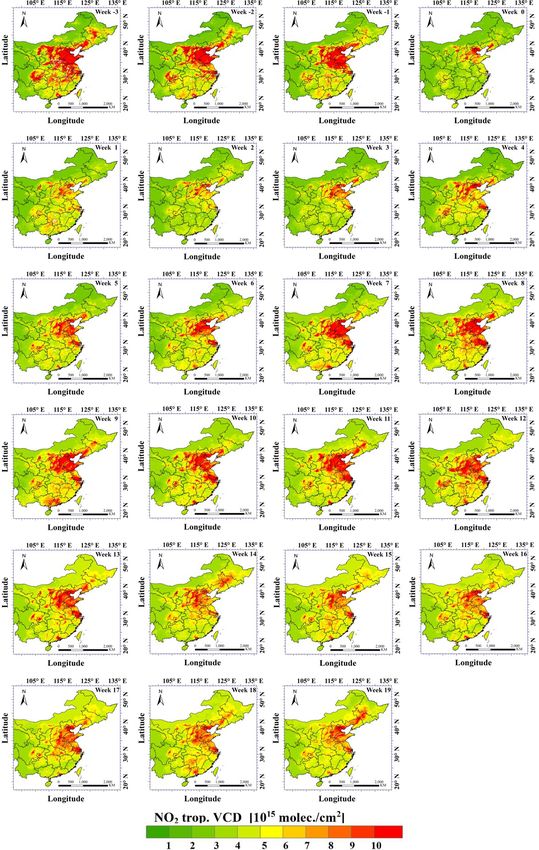
be used. Therefore, in the current study, weekly NO2 TVCD
Tropospheric NO2 TVCD time series during the winter maps were produced as shown in Fig. 5. Here week num-
months bers relate to the Spring Festival which was on Saturday
25 January 2020, i.e., week 0 is 25–31 January, week 1 is
Having established that the annually-averaged TVCDs de- 1–7 February, etc. (see Table A1 for an overview of week
crease exponentially during a certain period of time and numbers and dates). Weeks −1 to −3 are included as ref-
change little during more recent years (after 2015/2016, in erences for the NO2 TVCDs during the period before the
the southern regions) or the last year (2019, in the northern Spring Festival. The comparison of the monthly TVCDs in
regions), we need to determine whether these conclusions Fig. 4 with the weekly TVCDs in Fig. 5 (top row, weeks −3
also apply to shorter periods of time during which effects to −1) clearly illustrates the advantage of using better time
of the lockdown on the concentrations of atmospheric trace resolution to show the advancing decline of the NO2 TVCDs
gases are studied. As a compromise between high time reso- in east China before the Spring Festival. The first lockdown
lution and reducing meteorological effects on concentration in Wuhan was on 23 January, toward the end of week −1;
differences, monthly-averaged NO2 TVCDs were selected therefore, the decline was mainly due to the decreasing eco-
and plotted as time series for the 11 study areas. Because nomic activity associated with the Spring Festival. The com-
in China the lockdown started in the winter and ended on bined effects of the Spring Festival and progressive lockdown
8 April 2020, and because the signals in the summer months in east China (Bao and Zhang, 2020) is visible in weeks 1–3,
are relatively weak, this was only done for the winter months. when the NO2 TVCDs were lowest. The slight recovery in
Furthermore, to exclude the effect of the Spring Festival week 2 in the south of the study area may reflect the progres-
on the NO2 TVCDs, January and February were not used. sive nature of the lockdowns in different areas in China, i.e.,
This left November, December, March and April for 2011– toward the end of the Spring Festival holidays when people
2019, and the results are presented in Fig. A2. The data in traveled back to their work places when it was still possible.
Fig. A2 show the overall decline of the NO2 TVCDs, fol- The maps in Fig. 5, and the difference plots with respect
lowing the yearly trends and variations of the annual mean to week 0 in Fig. A3, show that overall the NO2 TVCDs
TVCDs in Figs. A1 and A3 and the differences between the remained low over the whole study area during the first
11 regions for different periods. Overall, the periods when 2 weeks. Also in week 3 the NO2 TVCDs were low, although
the NO2 TVCDs decreased are similar to those indicated in some increase occurred over industrialized and populated ar-
Table 2. For Beijing and Shijiazhuang, a strong minimum eas north of the Yangtze River and in the Guangzhou area,
is observed in 2014 which may be associated with emis- which intensified every week from week 4 until week 8. In
sion reduction because of the Asia-Pacific Economic Coop- week 8 the NO2 TVCDs reached high values and the spa-
eration (APEC) meeting in Beijing in November 2014 and tial distributions and concentrations changed little during the
the China Victory Day Parade in September 2015. Interan- next 5 weeks, except in week 10 when the NO2 TVCDs were
nual variability is stronger in the monthly-mean data than in lower (although not in the YRD and Guangzhou). These re-
the annual means, as expected. Because of these variations, duced concentrations may be a sign of reduced emissions
trend lines for monthly-mean NO2 TVCDs were not com- during the Tomb-Sweeping Festival on 4–6 April. In week
puted. The main message is that the TVCDs follow the ten- 13 the NO2 concentrations were substantially lower than
dencies in the annual means with leveling toward the end of in the weeks before, and this continued in week 14. These
the study period. weeks encompass the May festival holiday (1–5 May), an-
https://doi.org/10.5194/acp-21-7723-2021 Atmos. Chem. Phys., 21, 7723–7748, 2021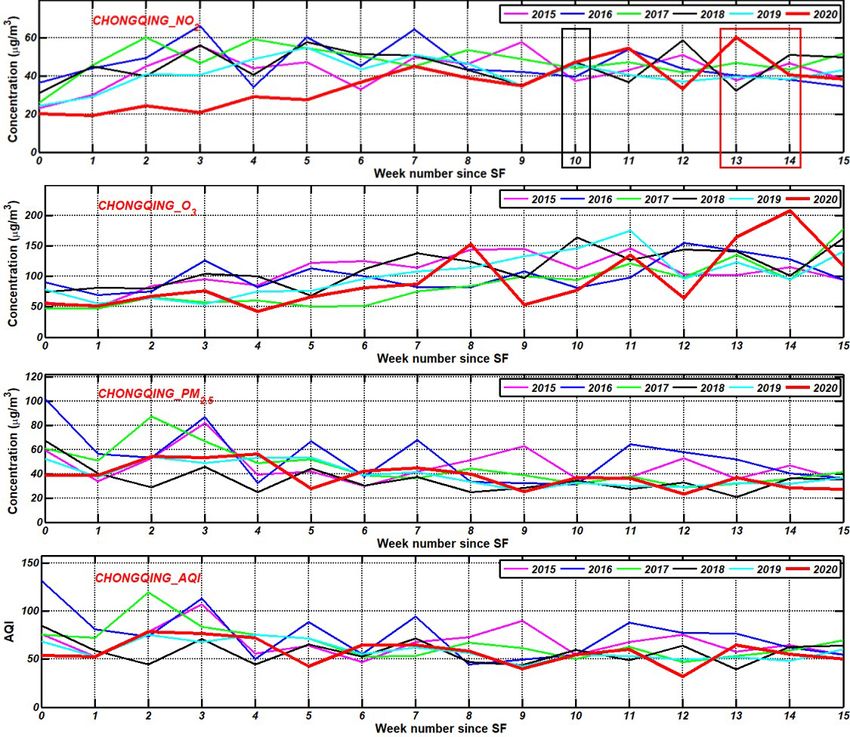
7730                             C. Fan et al.: Variability of NO2 concentrations over China and their effect on air quality

other very large national festival in China when many people        of the plume. Except in the first 3 weeks, the AQI is smaller
travel home to their families: the associated change in so-         than 100, indicating good air quality. For group 2, the AQI
cioeconomic activities may explain the lower NO2 concen-            fluctuated, and the values indicate excellent to good AQ until
trations during that time. After week 14 the NO2 TVCDs in-          week 10 when the AQI moved into the plume or occasion-
creased in the southern provinces like Hunan and Guizhou as         ally above (Guangzhou) but still indicating good AQ. For
well as in the east around Shanghai, Jiangsu and Shandong,          group 3, the AQI indicated good AQ, except in Xi’an (mod-
whereas in the northeast the NO2 TVCDs first decreased and          erate) and decreased somewhat (Xi’an became “good”) but
then decreased in week 18. Overall, the spatial patterns dur-       remained in the plume throughout the whole study period.
ing these weeks were similar, but the TVCDs changed, likely         In other words, the AQI did not indicate better AQ for these
due to changes in economic activity and meteorological in-          cities in response to COVID-19 containment measures.
fluences, but they did not reach values similar to those before
the Spring Festival. However, this would not be expected as         3.2.2   Time series of aerosols and trace gases affecting
discussed in Sect. 3.1.1.                                                   air quality

3.2     Effects on air quality: ground-based observations           With the AQI determined by the pollutant with the highest
                                                                    AQI, which may not necessarily be the species observed from
3.2.1    Time series of air quality index for 11 regions            satellites such as NO2 , the behavior of individual pollutants
                                                                    contributing to the AQI will be considered using time series
The air quality index (AQI) is based on the mass concentra-         similar to those for the AQI. As discussed in the Introduction
tions of PM2.5 , PM10 , NO2 , SO2 , CO and O3 as described          section, we focus here on NO2 , O3 and PM2.5 as the species
in Appendix A. AQI is determined by only one pollutant,             which were most affected by the lockdown. Time series of
i.e., the pollutant with the highest AQI. Time series for the       the weekly-averaged concentrations of these species in Shi-
AQI in the 11 cities identified in Table 1 were plotted for the     jiazhuang, Wuhan and Chongqing are presented in Figs. 6,
first 16 weeks (weeks 0–15) after the Spring Festival in 2020.      7 and 8, respectively. Note that for some species the ver-
Tianjin was added as a second megacity in the metropolitan          tical scales may be different between the three cities. The
agglomeration because of its potentially different air quality      concentrations during the five reference years (2015–2019)
due to large industrial activities as opposed to the capital city   (further referred to as the plume) are used as reference to
(Beijing). AQI time series for the same weeks in the five pre-      determine how the concentrations in 2020 were influenced
vious years (2015–2019) were plotted to form a plume which          by the lockdown. Overall, the concentrations of most pollu-
serves as reference for the 2020 time series. The results are       tants in the plume were higher in Shijiazhuang than in Wuhan
presented in Fig. A4, which shows that there are large varia-       and Chongqing. This applies to PM2.5 (as well as for PM10 ,
tions between the years and that there is no specific ordering,     SO2 and CO which are not shown here) but not for NO2 and
indicating a systematic temporal variation (tendency). Hence        O3 for which the concentrations in the plumes in these three
the plume is representative of the range of variations that can     cities were similar. This is remarkable because the satellite
be expected in 2020 from other factors influencing the AQI          NO2 TVCDs in 2016 were about a factor of 3 higher in Shi-
than the lockdown, such as meteorological factors (provided         jiazhuang than in Wuhan, which in turn were about 30 %
that 2020 is not an exceptional year in regard to these other       higher than in Chongqing (Figs. 2 and 3), whereas in 2019
factors). It is noted that the AQI values are weekly averages       the NO2 TVCDs were a factor of 2.3 higher in Shijiazhuang
over all measurements in each city, created from 24 h aver-         than in the other two regions where the TVCDs were similar.
ages at each site.                                                  However, for an adequate comparison between satellite data
   Figure A4 shows the similarity between the AQI time              and surface concentrations, and thus effects on AQ, factors
series in the five cities in the NCP (Beijing, Tianjin, Shi-        influencing the relation between near-surface concentrations
jiazhuang, Jinan and Zhengzhou); for the cities Shang-              and TVCDs need to be accounted for, such as meteorologi-
hai, Guangzhou, and Wuhan; and for Nanchang, Xi’an,                 cal factors driving vertical mixing. Also long-term trends, in-
Chongqing, and Chengdu. In view of these similarities, one          terannual variations, seasonal variations, local emissions and
city was selected to represent each group for further anal-         meteorological effects influencing (photo)chemical reactions
ysis, i.e., Shijiazhuang represents the first group (group 1),      determining the overall concentrations need to be considered.
Wuhan represents group 2 and Chongqing represents group             However, such detailed quantitative comparison is out of the
3. It is noted that in the selection of these cities not only the   scope of the current study; a qualitative comparison between
AQI was considered but also time series of six individual pol-      TROPOMI-derived NO2 TVCDs and surface concentrations
lutants (see below). The AQI time series for these three cities     of NO2 will be presented in Sect. 3.3.
are included in Figs. 6–8.                                             In all three cities the surface NO2 concentrations are over-
   In 2020, the AQI in the cities in group 1 fluctuated in the      all decreasing during the study period, following the seasonal
first 3 weeks and then stayed low until week 9; they increased      variation which is also observed in the satellite data (Fig. 2).
toward the plume in week 10 and then stayed at the bottom           However, in the satellite data the decrease is largest when

Atmos. Chem. Phys., 21, 7723–7748, 2021                                               https://doi.org/10.5194/acp-21-7723-2021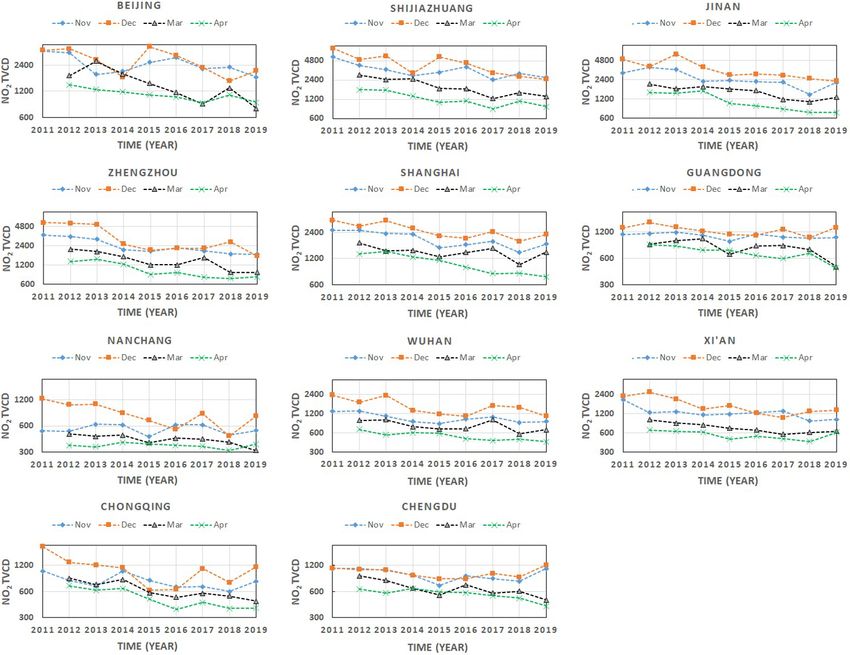
C. Fan et al.: Variability of NO2 concentrations over China and their effect on air quality 7731
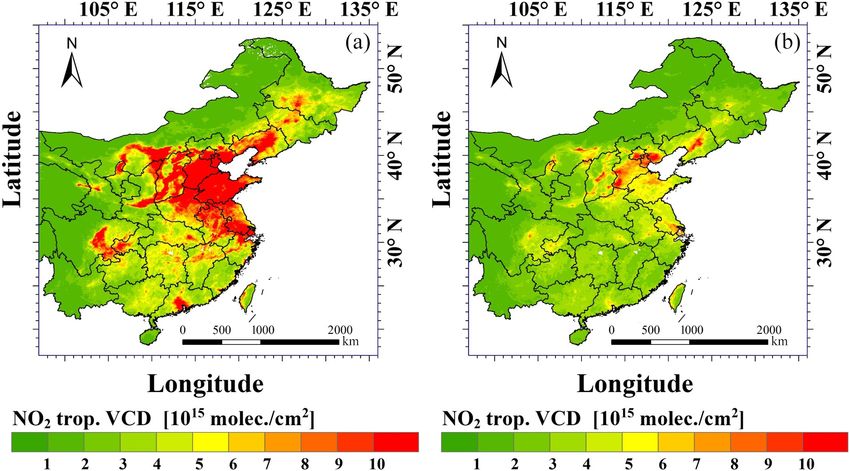
Figure 4. NO2 tropospheric vertical column densities derived from TROPOMI data over east China, averaged over 30 d before (a) and after
(b) the 2020 Spring Festival. The 2020 Spring Festival was on 25 January 2020 and thus the 30 d period before started on 26 December 2019
and the 30 d period after ended on 24 February 2020.
concentrations are highest, but, as discussed above, for the For aerosols, the situation was different than for the trace
ground-based data the concentration differences between the gases. The data in Fig. 6 show that in Shijiazhuang PM2.5
three cities are not large. Yet, the seasonal effect seems more was relatively high during the first 3–4 weeks during all 5
pronounced in Shijiazhuang compared to Wuhan and more years, and those in 2020 were well inside the plume. There-
pronounced in Wuhan compared to Chongqing. This is also after the PM2.5 concentrations dropped and, apart from some
different from the satellite data (see Fig. 2) and may be a fluctuations, remained low (on average about half of those in
lifetime effect related to lower temperatures in Shijiazhuang the first weeks), and those in 2020 were almost every week
than in Wuhan and Chongqing. near the bottom of the plume. It is noted that the PM2.5 con-
Another difference between the three cities is the effect centrations in 2017 and 2019 were substantially higher than
of the lockdown on the evolution of the surface NO2 con- in other years. In contrast, the 2020 concentrations of PM2.5
centrations. In Shijiazhuang the plume decreased after week in Wuhan were lower in weeks 2 and 3 than in any other
3, whereas the 2020 concentrations increased steadily from week during the study period and also lower than in all 5
week 0, and the curve joined the plume in week 6 although years before (about 1/3 of the plume average). In Chongqing
remaining near the bottom of the plume. In Wuhan the the PM2.5 concentrations were well inside the plume (around
2020 concentrations were far below the plume (20 vs. 40– the average), and the plume decreased gradually as expected
60 µg m−3 ) until week 9 after which they suddenly increased from the common seasonal behavior of PM2.5 . Hence in
in week 10 to remain just below the plume (∼ 40 µg m−3 ). Chongqing the COVID-19 lockdown measures did not have
In Chongqing the NO2 concentrations were low (20 µg m−3 ) an evident effect on the aerosol concentrations, in spite of the
during the first 3 weeks, then increased and remained close strong reduction of NO2 concentrations. The PM2.5 concen-
to the plume in weeks 6 to 9 and merged into the plume from trations in week 0 were 150 µg m−3 in Shijiazhuang, 50 µg
week 10. m−3 in Wuhan and 40 µg m−3 in Chongqing.
When NO2 concentrations decreased, O3 concentrations
increased as observed for all three cities. However, there was 3.3 Comparison of satellite and ground-based weekly
no substantial difference between the temporal variation of observations in 2020 (NO2 )
the O3 concentrations in 2020 and the other years. The 2020
concentrations were inside the plume during the whole study For the comparison of the temporal evolution of the
period, and no anomalous behavior was observed in spite of TROPOMI NO2 TVCDs (Fig. 5) to ground-based obser-
the reduced NO2 concentrations during the first 6–10 weeks. vations (Figs. 6–8), the satellite data over each of the 11
Rather, in Shijiazhuang and Chongqing both the NO2 and O3 selected regions were spatially and temporally integrated
concentrations were low in the plume. The O3 concentrations to weekly values. The results for the three representa-
in Shijiazhuang and Wuhan were similar and a bit higher than tive regions discussed above, i.e., Shijiazhuang, Wuhan and
in Chongqing. Chongqing, are plotted in Fig. 9a as time series for week −3
to week 20 (where week 0 is the Spring Festival in 2020,
as above and in Table A1). Beijing data, which are discussed
https://doi.org/10.5194/acp-21-7723-2021 Atmos. Chem. Phys., 21, 7723–7748, 2021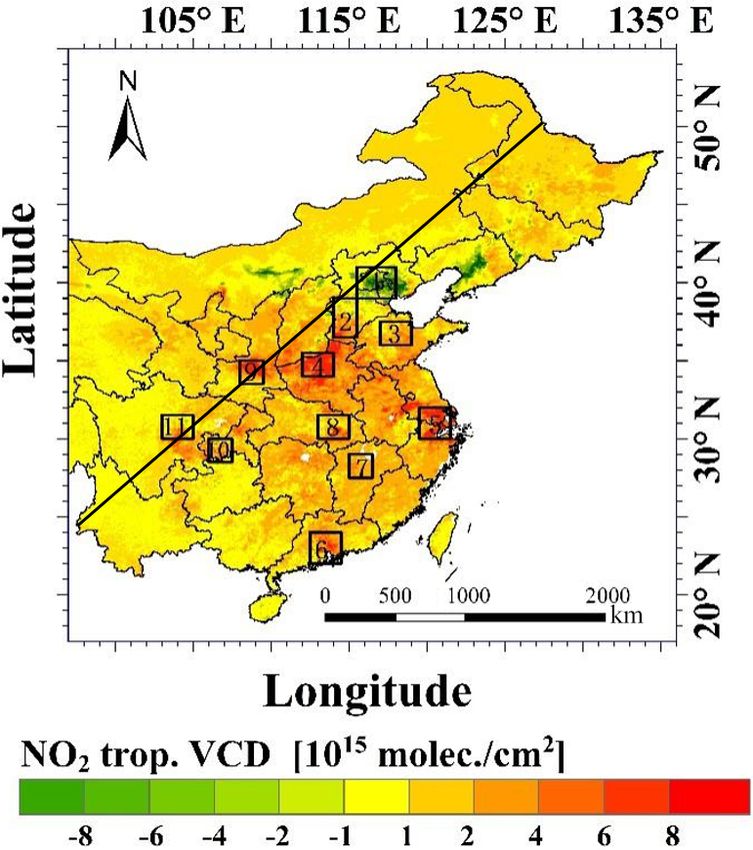
7732                              C. Fan et al.: Variability of NO2 concentrations over China and their effect on air quality

Figure 5. Maps of weekly averages of NO2 TVCDs derived from TROPOMI data, for weeks −3 to −1 and week 0 (top row) and weeks
1–19 in the following rows. Note that week number refers to the 2020 Spring Festival, i.e., week 0 starts on Saturday 25 January 2020 (see
also Table A1).

Atmos. Chem. Phys., 21, 7723–7748, 2021                                                   https://doi.org/10.5194/acp-21-7723-2021
C. Fan et al.: Variability of NO2 concentrations over China and their effect on air quality                                            7733

Figure 6. Time series of the concentrations of NO2 , O3 and PM2.5 in Shijiazhuang for weeks 0 to 15 starting from the Spring Festival in
2020 (red line), together with time series for these pollutants for the same weeks in 2015–2019. See legend for identification. Rectangles in
the NO2 time series were added for easy identification of the Tomb-Sweeping Festival (4 and 5 April, in week 10; red) and the May festival
(1–5 May, in weeks 13–14; black) which are discussed in the text. The Spring Festival date and thus week 0 is determined by the Lunar
Calendar, therefore these dates apply only to 2020, and in the other years they may fall in different weeks.

below and presented in Fig. 10, are included as well. For easy           fore the Spring Festival (for the ground-based data contin-
comparison, the weekly-averaged concentrations of NO2 in                 uing another week in Shijiazhuang and Beijing), followed
2020 are replotted from Figs. 6–8 and 10, in Fig. 9b, and                by an overall increase. However, where the satellite data
the time series was extended to cover the same period as                 show different concentrations before the Spring Festival, the
the satellite data. The data in Fig. 9a and b represent differ-          ground-based concentrations were similar, except in Shiji-
ent quantities, i.e., column integrated vs. near-surface local           azhuang where they were a factor of 2 higher, and the fac-
concentrations of NO2 which experience different influences              tors by which the concentrations were reduced are also dif-
of, for example, meteorological conditions (cf. Sect. 4.2) and           ferent. The satellite data for Shijiazhuang show a reduction
thus cannot be quantitatively compared. Hence the compar-                to a value of 33 % from the maximum before the Spring
ison here is merely meant to qualitatively discuss the use of            Festival, whereas the ground-based data show a reduction
satellite data to evaluate the reduction of concentrations near          to 24 %. For Beijing, these values are 55 % and 35 %, for
the surface, where they are most important for air quality.              Wuhan they are 77 % and 40 %, and for Chongqing they are
   The data in Fig. 9a and b show that overall the temporal              53 % and 43 %. Hence, overall, the reductions derived from
behavior of the satellite NO2 TVCDs and the surface NO2                  satellite data are stronger than those from local monitoring
concentrations in 2020 was similar, with a strong drop be-               measurements. However, effects of varying meteorological

https://doi.org/10.5194/acp-21-7723-2021                                                   Atmos. Chem. Phys., 21, 7723–7748, 2021
7734                             C. Fan et al.: Variability of NO2 concentrations over China and their effect on air quality

Figure 7. As Fig. 6 but for Wuhan.

conditions are not included in these estimates, and these ef-    remaining near the lowest values until week 10. However, af-
fects may be different for satellite observations than for lo-   ter the end of the lockdown, the satellite data in Wuhan show
cal ground-based measurements. It is further noted that these    a very modest increase, whereas the ground-based data show
numbers reflect the combined effect of the Spring Festival       a sudden increase by about a factor 2. Also in other regions,
and the COVID-19 lockdown.                                       post-lockdown large differences are observed in the satellite-
   After the Spring Festival, both the satellite and ground-     derived and ground-based time series.
based data show that the concentrations increased, with sim-        It is noted that the earlier-observed separation in behavior
ilar rates in Shijiazhuang (factor of 2 between week 0 and       of long-term NO2 TVCD time series between the north and
week 9) but with much stronger fluctuations in the surface       the south of the study area (Sect. 3.1.1) is also reflected in the
concentrations. However, in other regions the different types    weekly time series in early 2020; i.e., there is a separation be-
of observations show quite different behavior. For instance,     tween the NO2 TVCD values over Beijing and Shijiazhuang
in Chongqing the ground-based observations behaved sim-          (north) and those over Wuhan and Chongqing (south). This
ilar to those in Shijiazhuang, whereas the satellite observa-    separation is also reflected in the temporal behavior but to a
tions show a very small increase. The reverse is true for        lesser extent. However, although in the ground-based time
Beijing, with a rather small increase in the surface concen-     series a separation can also be observed, it is rather due
trations as opposed to a larger increase in the satellite ob-    to stronger industrialization (Shijiazhuang and Chongqing)
servations. In Wuhan, both types of observations show the        than in the capital city of Beijing. The time series in Wuhan
strong effect of the strict lockdown with NO2 concentrations     may have been influenced by the strict lockdown during 10

Atmos. Chem. Phys., 21, 7723–7748, 2021                                            https://doi.org/10.5194/acp-21-7723-2021
C. Fan et al.: Variability of NO2 concentrations over China and their effect on air quality                               7735

Figure 8. As Fig. 6 but for Chongqing.

weeks, whereas after its release many activities suddenly in-      4.1   Estimation of lockdown effects: effects of temporal
creased which is reflected in the doubling of the ground-                resolution
based NO2 concentrations.
                                                                   Many studies on the COVID-19 lockdown effect on atmo-
4   Discussion                                                     spheric concentrations are based on comparison of a period
                                                                   before and after the start of the lockdown or on compari-
The satellite data on tropospheric NO2 VCDs and ground-            son with the same period in previous years. The lockdown
based monitoring data for the concentrations of NO2 , O3 ,         occurred during the Spring Festival holidays during which
PM2.5 and AQI all indicate the different behavior of atmo-         the concentrations of NO2 , often used in studies on the ef-
spheric composition in the north and south of China, and the       fect of the COVID-19 lockdown, were substantially reduced.
selected regions have been grouped to discuss the character-       Hence, in many studies the Spring Festival effect was sep-
istic behavior within each group. This relates both to long-       arated from the total effect to determine the effect of the
term variations (trends in the satellite data) and the influence   lockdown only. One way to do this was presented in Fan et
of the COVID-19 lockdown. Hence the answers to the ques-           al. (2020a) for tropospheric NO2 VCDs. In contrast, AOD
tions we set out for this study at the end of Sect. 1 will be      was observed to increase. The AOD increase was anticipated
different for each of the regional clusters which emerged in       to be due to meteorological factors conducive to the forma-
the course of the study.                                           tion of haze. Also the ratio of the PM2.5 concentrations be-
                                                                   fore the Spring Festival to those thereafter was higher than

https://doi.org/10.5194/acp-21-7723-2021                                           Atmos. Chem. Phys., 21, 7723–7748, 2021
7736 C. Fan et al.: Variability of NO2 concentrations over China and their effect on air quality
4.2 Long-term trends, trend reversal and
meteorological influences on the estimation of
lockdown effects
Decadal time series of monthly- and annual-mean NO2
TVCDs for the 11 regions and the annual trends derived from
these were presented in Sect. 3.1.1 (Figs. 2, 3 and A1, Table
2). For the calculation of the baseline concentrations in 2020,
i.e., the concentrations expected if there would not have been
a lockdown, the seasonal variation needs to be taken into ac-
count. However, monthly trend lines are difficult to deter-
mine with some accuracy due to interannual variations and
due to the Spring Festival effect which occurs at different
dates in the solar calendar. Therefore, trends for January and
February were not considered. Furthermore, as Figs. 2 and 3
show, the decline in the NO2 TVCDs seems to level off in
recent years, i.e., from 2015/2016 in the south of China and
possibly after 2018 in the north. The years when the trends
were changing are similar for the monthly and annual mean
data. Hence the baseline could be determined using an av-
erage over the years after the trend change. The uncertainty
in these averages is about 10 % (Fig. 3). Ignoring the trend
change, i.e., assuming that the trend would continue to 2020,
would result in an underestimation of the baseline for 2020.
Figure 9. Time series of weekly averages of (a) TROPOMI-derived Extrapolation of the trend for Wuhan to 2020 would result
NO2 TVCDs (1013 molec. cm−3 ) over Shijiazhuang, Wuhan,
in an estimated baseline of 4.4 × 10¹⁵ molec. cm−2 and for
Chongqing and Beijing for weeks −3 to 19 and (b) surface con-
Chongqing 3.6 × 10¹⁵ molec. cm−2 , whereas using the av-
centrations of NO2 (µg m−3 ) over these cities, plotted together in
one plot from Figs. 6–8 and 10. erage over 2016–2019 for 2020, i.e., assuming that the de-
crease has halted as suggested by the data in Fig. 3, would
provide a baseline of 6.6 × 10¹⁵ molec. cm−2 for Wuhan and
in previous years (in Beijing PM2.5 even increased by a fac- 5.6×10¹⁵ molec. cm−2 for Chongqing. In other words, ignor-
tor of 2.2), and these ratios were higher in northern China ing the trend change would result in a baseline lower by about
than in the south. In their estimates of the lockdown effects 35 % and thus in an overestimation of the lockdown effect on
from satellite data, Fan et al. (2020a) (and others) used av- the NO2 TVCD. Similar considerations may apply to Shiji-
erages over the months before and after the Spring Festival. azhuang, but considering that a change in the annual trend
The current study clearly shows that during the weeks be- did not occur until 2018, the variation in following years is
fore the lockdown the NO2 TVCDs gradually decreased and difficult to estimate.
varied also after the lockdown. The post-Spring Festival vari- In view of this discussion, the use of a climatology over
ations are also observed in the surface concentrations of NO2 recent years for comparison with the 2020 concentrations
which varied by more than a factor of 2. This also applies to may be a good strategy for regions in the south of China,
aerosols and to a lesser extend to O3 . Hence the actual effect whereas for the north, where concentrations were decreas-
of the lockdown on the concentrations of aerosols and trace ing until 2018, the climatological concentrations may be too
gases will be influenced by the separation from the Spring high. The use of ground-based data leads to larger uncertain-
Festival effect, the temporal resolution chosen for the data ties. As the ground-based data in Figs. 7 and 8 for Wuhan and
analysis, and the correction for meteorological and other fac- Chongqing show, the NO2 concentrations in the plumes vary
tors such as reduction of emissions and related concentration strongly from week to week, and the plume width is there-
trends, as well as chemistry. The influence of emissions and fore rather large, with an uncertainty which is much larger
the impact of the lockdown on different economic sectors on than the 10 % uncertainty in the trend since 2015/2016.
NO2 and aerosol concentrations was discussed by Diamond Meteorological influences may be twofold. Meteorologi-
et al. (2020). cal conditions may be conducive to the formation of haze in
stagnant air as often observed in northern China during the
winter (e.g., Li et al., 2018; Wang et al., 2019, 2018a, 2020a).
On the other hand, large-scale weather systems influence the
transport of air masses from different origins transporting ei-
ther clean air or pollution contributing to local air quality
Atmos. Chem. Phys., 21, 7723–7748, 2021 https://doi.org/10.5194/acp-21-7723-2021C. Fan et al.: Variability of NO2 concentrations over China and their effect on air quality 7737
(e.g., Wang et al., 2019; Li et al., 2018; Hou et al., 2020). high due to meteorological conditions and complex chemi-
Another aspect to be considered are the influences of air tem- cal influences, and later the O3 concentrations exceeded the
perature, humidity and radiation on chemistry, which affects limiting values. However, the latter were not reflected in the
NO2 , O3 and aerosols, in particular for the situation during AQI, which followed the variations in PM2.5 but remained
the COVID-19 lockdown with the strong reduction of NO2 low when O3 concentrations were high. In fact, for all cities
concentrations. A reduction of NO2 (or NOx = NO + NO2 , in the NCP the AQI was below or just inside the plume dur-
where NO is only a small fraction of NOx ) leads to an in- ing the whole study period, whereas the NO2 concentrations
crease in O3 , as observed in the ground-based data. The en- moved into the plume toward the end, except in Beijing. The
hanced O3 concentrations result in the increase of the oxidiz- relatively low NO2 concentrations might be expected based
ing capacity of the atmosphere which in turn leads to the pro- on both the decreasing trends in the NO2 TVCDs until 2018
duction of secondary organic aerosol (SOA) as explained in, in the north of China and from the seasonal decrease. With
for example, Diamond et al. (2020) and Le et al. (2020). The these considerations, it is hard to determine whether the pol-
increased aerosol concentrations result in the attenuation of lutant concentrations in the NCP returned to their normal lev-
solar irradiation due to more scattering and absorption which els, which in regard to seasonal variations are expected to be
in turn may further influence the meteorology (Zhong et al., lower than before the lockdown and in regard to their de-
2018) and photochemical reactions. creasing trends are expected to be lower than in other years
In view of the decisive role of meteorology in haze forma- or, considering that the trends level off, similar to those in the
tion in northern China (Le et al., 2020), it is surprising that last couple of years.
both Le et al. (2020) and Diamond et al. (2020) used meteo- For the group 2 cities, Shanghai, Guangzhou and Wuhan,
rological data averaged over 1 month (February 2020). Haze the AQI during the lockdown varied, and AQ was good until
occurs episodically and less than 25 % of the episodes last week 10, with the largest effect in Wuhan. NO2 concentra-
longer than 4 d (Wang et al., 2018b, 2020b). tions in Wuhan were very low with 20 µg m−3 during the first
9 weeks (3 times lower than the plume average). In Shanghai
4.3 Lockdown effect on air quality and rebound and Guangzhou the concentrations were initially similar but
increased slowly. In all three cities the NO2 concentrations
The similarity in the temporal behavior of the air qual- merged into the plumes after week 10, more or less coinci-
ity index (Fig. A4) was the basis for the subdivision of dent with the end of the lockdown after 76 d, on 8 April 2020.
the regions in three groups. In group 1 (NCP), the AQI PM2.5 was not reduced as much as NO2 but was also below
fluctuated in the first 3 weeks and reached a peak value the plume and overall traced the NO2 concentrations, mov-
in week 2 and then remained low. The peak was highest ing into the plume after week 10. Being further south than the
(170, moderately polluted) in Beijing where it exceeded the NCP, O3 concentrations were close to the air quality standard
value of previous years. Obviously, this was due to a haze of 100 µg m−3 and exceeded that limit around week 5, as in
episode with strongly enhanced PM2.5 with respect to the the NCP. Hence, also in the group 2 cities the reduction of
period before the Spring Festival (Fan et al., 2020a) and other pollutant concentrations was offset by the increase of
a concentration of ca. 140 µg m−3 , almost double the 24 h O3 which is not reflected in the AQI. The rebound at the end
class 2 (for cities) air quality standard in China specified of the lockdown period is clear with all indicators returning
in GB 3095-2012 (https://www.transportpolicy.net/standard/ to levels similar to those in the earlier years, i.e., inside or
china-air-quality-standards/, last access 30 January 2021). In close to the plume.
other cities in group 1 (not shown), the peak values were Group 3 includes three cities in the Sichuan/Chongqing
lower, decreased with distance to Beijing, and were also and Guanzhong basins and Nanchang. In these cities the
lower than in 2017 and 2019. Only in Jinan and Zhengzhou AQI was not substantially affected by the lockdown, ex-
the PM2.5 values were within the 24 h class 2 (for cities) air cept in the very beginning when it was low inside (or even
quality standard. After week 3 the PM2.5 concentrations were below) the plume but overall remained inside the plume.
within air quality standard limits, and the AQI was between Yet, the NO2 concentrations were around 20 µg m−3 during
50 and 100 (good) and lower than in the previous years, for the first 3 weeks, initially some 40 %–60 % lower than the
all cities in group 1. However, closer inspection shows that plume for which the concentrations actually increased dur-
the O3 concentrations exceeded the air quality standard of ing these 3 weeks and then gradually decreased. Between
100 µg m−3 (1 h mean value) between weeks 5 (in the south week 3 and 7 the NO2 concentrations in 2020 increased in
of the NCP) and 7 (in the north). Furthermore, in all cities in all 4 cities to about 50 µg m−3 in week 7, close to the plume,
the NCP the O3 concentrations in 2020 were well inside the and later merged into the plume. PM2.5 was not much differ-
plume. Hence, in the NCP the strong emission reduction dur- ent from the plume throughout the whole period and in all
ing the lockdown and the strong decrease of NO2 concentra- three cities. Decreasing somewhat in the basins and fluctuat-
tions, observed both from space and from the surface mon- ing around 40 µg m−3 in Nanchang. O3 concentrations were
itoring network, were offset by the increase of other pollu- lower than 100 µg m−3 (50 µg m−3 in Chongqing) and grad-
tants. Early in the lockdown the aerosol concentrations were ually increased to above 100 µg m−3 around week 7. Overall,
https://doi.org/10.5194/acp-21-7723-2021 Atmos. Chem. Phys., 21, 7723–7748, 2021You can also read