China and IMO 2020 - Oxford Institute for Energy
←
→
Page content transcription
If your browser does not render page correctly, please read the page content below
December 2019

                  China and IMO 2020

OIES PAPER: CE1                Michal Meidan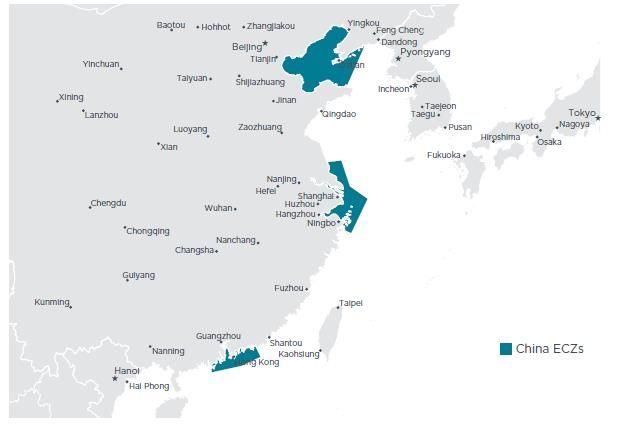
The contents of this paper are the author’s sole responsibility. They do not
         necessarily represent the views of the Oxford Institute for Energy Studies or any of
                                            its members.

                                          Copyright © 2019
                               Oxford Institute for Energy Studies
                                  (Registered Charity, No. 286084)

This publication may be reproduced in part for educational or non-profit purposes without special
permission from the copyright holder, provided acknowledgment of the source is made. No use of this
publication may be made for resale or for any other commercial purpose whatsoever without prior
permission in writing from the Oxford Institute for Energy Studies.

                                     ISBN : 978-1-78467-154-9

                           DOI: https://doi.org/10.26889/9781784671549

                                                                                                  2
Contents
Contents ................................................................................................................................................. 3
Introduction ........................................................................................................................................... 2
I. Background: IMO 2020 .................................................................................................................. 3
II. China: Tough government policies to tackle shipping emissions… ....................................... 5
III. ...but a relatively muted response from refiners ..................................................................... 7
a. A tale of two bunker markets ........................................................................................................ 8
b. The domestic market is dominated by blenders… ....................................................................... 9
c. …and the bonded market is dominated by imports ................................................................... 10
IV. China’s refiners gear up for IMO 2020 ................................................................................... 12
a. Large distillate and resid production capacity… ........................................................................ 12
b. …but China’s refiners are focusing on VLSFO .......................................................................... 14
V. New tax scheme and FTZs support VLSFO production and exports ..................................... 18
VI. LNG bunkering—the next frontier .......................................................................................... 19
Conclusion ........................................................................................................................................... 22
Figures and Tables
Figure 1: Map of China’s ECZs ............................................................................................................... 6
Figure 2: China’s bunker demand, mt ..................................................................................................... 8
Figure 3: Diesel demand by sector, mb/d ............................................................................................... 8
Figure 4: Fuel oil demand by sector, mb/d.............................................................................................. 9
Figure 5: Freight traffic, billion mt ............................................................................................................ 9
Figure 6: Fuel oil prices in Shandong, yuan/Mt..................................................................................... 10
Figure 7: Export quotas, mt ................................................................................................................... 11
Figure 8: China diesel and gasoline yields, % ...................................................................................... 12
Figure 9: China jet and fuel oil yields, % ............................................................................................... 12
Figure 10: Shandong diesel yields, %, runs, mb/d ............................................................................... 13
Figure 11: China’s diesel production, mb/d ........................................................................................... 13
Figure 12: Diesel production by region 2017, % ................................................................................... 14
Figure 13: Diesel exports by region 2017, % ........................................................................................ 14
Figure 14: Fuel oil production by region, mb/d...................................................................................... 15
Figure 15: Gas demand by sector, bcm ................................................................................................ 22
Table 1: Sinopec and PetroChina refineries producing IMO-compliant VLSFO ................................... 16
Table 2: Subsidies for inland LNG ships, $ millions .............................................................................. 19
3Introduction
Shippers and refiners have been actively preparing for the International Maritime Organization (IMO)
transition to very low sulphur fuel oil (VLSFO), engaging in a lively debate on how it would play out
and, since the second half of 2019, making active preparations for it. Chinese refiners, however,
seem to have been less preoccupied with it than their Western peers. This may seem surprising given
that China holds the world’s second largest refining capacity behind the US, is home to six of the ten
largest container ports globally, and is an early adopter of tighter shipping fuel emission standards
domestically.
One key reason is that China’s domestic bunker market is small relative to its refining capacity and to
other Asian hubs. At 20 million tonnes (mt), China’s sales were equivalent to just 40 per cent of the
bunkering volumes sold at the port of Singapore alone (about 50 mt) in 2018. Of this 20 mt, domestic
bunkering accounted for 6–7 mt and bonded 1 bunkering represented an additional 13 mt. Yet the
domestic tax system, which adds both consumer and value-added tax (VAT) to bunker fuels, even for
bonded sales,2 makes refinery-based bunker fuels uncompetitive. It leaves blenders, who generally
import about 90 per cent of their raw material, mainly from Singapore and Malaysia, to dominate
supplies.
However, this may be changing. IMO 2020 presents an opportunity for refiners, and the government’s
efforts to promote China as a bunkering hub on a par with Singapore is heralding a change. China’s
state-owned refiners started gearing up to produce VLSFO in 2019, having announced plans to
produce close to 20 mt of VLSFO in 2020. Expectations that the government will offer tax rebates on
VLSFO exports have boosted refiners’ enthusiasm for the fuel, while the Free Trade Zone (FTZ) at
Zhoushan port, where the government has relaxed restrictions on imports of marine fuels and
blendstocks, is also supporting the nascent market.
Eventually, China will be able to supply the full volume of compliant bunkers in its ports without
imports. And even though refiners can also produce compliant marine gasoil (MGO), the high
consumption tax levied on it and restrictive export quotas suggest it will struggle to compete with
VLSFO. At the same time, higher VLSFO output will require some refiners to shift their crude slate to
sweeter crudes, which are currently commanding a premium, and squeeze production of clean
products. With excess refining capacity and weakening gasoline demand growth, these adjustments
are unlikely to be a problem for China’s refining system and over time Chinese refiners are likely to
emerge as growing suppliers of low-sulphur bunker fuels.
Yet even though the immediate focus is on VLSFO, the government’s medium- and long-term plans
emphasize liquefied natural gas (LNG) in shipping. Use of LNG for bunkering in China’s inland
waterways has been part of government plans to switch to low-sulphur fuels since 2013, but the lack
of LNG vessels as well as refuelling and bunkering infrastructure has limited its growth, with shipping
estimated to account for only 1.5 billion cubic metres (bcm) of China’s 280 bcm of natural gas
demand in 2018. In late 2018 the government announced a stronger policy focus on developing LNG
in shipping through to 2025, and therefore the state-owned oil and gas companies, as well as
shippers, are increasingly setting their sights on LNG in shipping for both domestic and international
bunkering. These developments in China’s bunkering market are set to weigh on diesel use,
benefitting fuel oil in the near term and LNG, at the margins, from 2025. At the same time, the state-
owned oil and gas majors are set to recapture market share from blenders as they develop supplies
of both VLSFO and LNG.
I would like to thank Adi Imsirovic, Chris Le Fevre, Jack Sharples and Bassam Fattouh for their additions, edits and comments
which have greatly enriched my analysis. Any errors or omissions, however, remain my own.
1 Provision of fuel sold tax-free to ships travelling between countries across international waters.
2 China imposes a consumption tax of CNY 1,218 (about $175) per tonne plus 13 per cent VAT (over $70) for LSFO.
2In this paper, we analyse these developments and their implications for China’s oil and gas majors.
The first section provides a brief overview of the IMO 2020 regulations and their global impact. The
second part reviews the Chinese government’s policies to tackle maritime pollution, before assessing,
in the third section, how the prohibitive domestic tax regime and restrictive export quotas have made
Chinese refiners relatively passive participants in both China’s domestic bunkering market and the
global IMO transition. The fourth section takes stock of China’s refining capacity and ability to produce
IMO-compliant fuels, both MGO and VLSFO. In the fifth section, we analyse the upcoming changes to
the tax system, which are set to support refiners’ production and export of VLSFO, as well as
developments in the Zhoushan FTZ, which is attracting China’s blenders from the domestic market
and relocating competition with the refiners offshore. Finally, even though VLSFO is emerging as the
short-term fuel of choice for Chinese refiners, Beijing’s emphasis on natural gas in shipping through to
2025 suggests that both domestic shippers as well as the gas majors will increasingly focus on
developing the nascent LNG bunkering market, which we review in the sixth and final section.
I. Background: IMO 2020
IMO regulations to reduce emissions of sulphur oxides (SOX) from ships first came into force in 2005,
under Annex VI of the International Convention for the Prevention of Pollution from Ships (known as
the MARPOL Convention). Since then, the limits on SOX have been progressively tightened and from
1 January 2020 the limit for sulphur content of exhaust emissions from ships operating outside
designated emission control areas will be reduced to 0.5 per cent m/m (mass by mass), from 3.5 per
cent currently.
On the basis of current technology, shippers have three main options to meet the new requirements:
They can run on LNG.
They can switch from high-sulphur fuel oil (HSFO), the main bunkering fuel currently in use, to
a lower-sulphur fuel such as MGO or a new type of residual fuel known as VLSFO.
Finally, they can continue to use HSFO and process air emissions through an exhaust gas
cleaning system more commonly called ‘scrubbers’ which must be retrofitted on board the
ship, along with dedicated tanks to hold and treat resulting wastewater from the process.3
For shippers, each option has its costs and benefits, but before the new regulations kick in, markets
are still struggling to price in the cost of each option. Investing in an LNG engine makes sense for
shippers from a long-term perspective, especially if the global IMO cap is later extended to cover
nitrogen oxides (NOX)4 or greenhouse gases more widely (in addition to SOX emissions, which are the
main focus currently), as LNG used in bunkering is low in both SOX and NOX emissions. Current
economics are certainly encouraging as the LNG fuel equivalent is at least 30 per cent cheaper than
fuel oil. 5 Over time, however, LNG will remain appealing only as long as natural gas prices stay
3 Adi Imsirovic and Ben Pryor, ‘IMO 2020 and the Brent-Dubai Spread’, Oxford Energy Comment, September 2018,
https://www.oxfordenergy.org/wpcms/wp-content/uploads/2018/09/IMO-2020-and-the-Brent%E2%80%93Dubai-
Spread.pdf?v=79cba1185463; Antoine Halff, Lara Younes andJack Sharples, “LNG Supply Chains and the Development of
LNG as a Shipping Fuel in Northern Europe”, OIES Paper, NG 140, January 2019, https://www.oxfordenergy.org/wpcms/wp-
content/uploads/2019/01/LNG-supply-chains-and-the-development-of-LNG-as-a-shipping-Fuel-in-Northern-Europe-NG-
140.pdf?v=79cba1185463; Antoine Halff, Lara Younes, Tim Beorsma, ‘The likely implications of the new IMO standards on the
shipping industry’, Energy Policy, Vol. 126 (2019), pp. 277–286; ‘IMO 2020: What every shipper needs to know’, HISIHS
Whitepaper, March 2019, https://www.joc.com/sites/default/files/u45421/Whitepapers/GeminiSeaburyWP_24pages.pdf.
4 NOx is capped globally, but at a level that effectively allows a business as usual model. A more stringent cap applies to
vessels built from 2016 onwards in the North American ECA and will apply to newbuild vessels in Northern Europe from 2021.
But it is far from clear if and when these more stringent limits may be applied globally. See Jack Sharples, “LNG Supply Chains
and the Development of LNG as a Shipping Fuel in Northern Europe”, OIES Paper, NG 140, January 2019
https://www.oxfordenergy.org/publications/lng-supply-chains-development-lng-shipping-fuel-northern-
europe/?v=79cba1185463, page 5 for more details.
5 0.5 per cent fuel oil $554 v $377 LNG equivalent, Platts Bunkerwire 4/12/19 (9.75 Mmbtu (million British thermal units)).
3relatively low 6 and would entail significant losses if natural gas prices rallied and oil-based fuel
differentials narrowed. Meanwhile, the LNG and scrubber options both entail multimillion-dollar up-
front capital expenditures, including the capital cost of new processing units and storage tanks (for
LNG or wastewater), in addition to the one-off loss of revenue from laying up ships in dry dock for
weeks to be retrofitted, and the permanent cost of losing deck space and loading capacity to the new
equipment.
In the short term then, switching to low-sulphur fuel will spare shippers the up-front cost of a scrubber
or LNG engine, but it would be a loss-making proposition if VLSFO premiums were to rise. Scrubber
costs are likely to depend on technological developments, so for shippers the decision depends on
both scrubber costs, potential restrictions on the disposal of wash water, and the price of HSFO, with
HSFO prices now beginning to plummet as the transition approaches.7
Refiners have also faced considerable uncertainty, struggling to assess the redistribution of demand,
but fundamentally, their options include:
Switching crude slates to prioritize low-sulphur feedstocks;
Altering refinery configuration to maximize gasoil production at the expense of fuel oil and
naphtha—if they assume the response to IMO 2020 will be an uptick in MGO demand at the
expense of fuel oil.
Investing in cokers and hydrocrackers to crack the heavier fuel oil molecules into lighter
components.
Blending HSFO with alternative low-sulphur fuels, to produce a product that is compliant.
Refiners’ choices will be informed not only by the availability of low-sulphur feedstock (and more
precisely, crudes with low-sulphur residue cuts) and their refining upgrade plans, but also storage
availability for clean fuels. Also, while refiners decide which low-sulphur fuel to prioritize, they will also
need to find an alternative home for some existing HSFO. Wide inter-product spreads and higher
VLSFO–HSFO differentials should gradually incentivize refineries to reduce HSFO output, but that, in
turn, would make its availability a problem for the ships with scrubbers. Yet scrubber uptake and
refinery upgrades will, in time, narrow these product spreads suggesting that for both shippers and
refiners, forecasting bunker fuel supply and demand remains a moveable feast.8
Consensus has held until recently that the industry will initially rely on MGO, given that it is already
familiar to many shippers and the quality will be consistent in ports around the world. However, at the
time of writing, VLSFO demand seems set to eclipse MGO use 9, at least in the first few months of the
IMO transition in 2020. This is because shippers simply opt for a cheaper compliant fuel. However,
this has resulted in the premium shrinking substantially, making MGO only marginally more
expensive. With up to 10 mt of IMO-compliant marine fuel currently stored in floating storage and
landed terminals in and around Singapore and Malaysia, the industry seems well prepared for now.
The emerging question is increasingly, will there be enough VLSFO beyond Q1 20 and if not, when
will distillate markets begin to price in the response? Fundamentally, however, MGO and VLSFO both
trade at a premium to HSFO, so shippers have limited incentive to use these higher-cost fuels until
required.10
6 M. Acciaro, ‘Real option analysis for environmental compliance: LNG and emission control areas’, Transp. Res. Part D:
Transp. Environ., Vol. 28 (2014), pp. 41–50.
7 In theory, shippers installing scrubbers could hedge this investment by hedging in the derivatives market. However, with the
IMO changes, liquidity in the HSFO paper market has dried up, while LSFO derivatives have not taken off yet. In the meantime,
the quality of the available assessments may be an issue.
8 Adi Imsirovic and Ben Pryor, ‘IMO 2020 and the Brent-Dubai Spread’, Oxford Energy Comment, September 2018,
https://www.oxfordenergy.org/wpcms/wp-content/uploads/2018/09/IMO-2020-and-the-Brent%E2%80%93Dubai-
Spread.pdf?v=79cba1185463.
9 In addition, because MGO is lighter, it does not have the same lubricating properties as VLSFO. The latter is closer in
consistency to the high sulphur fuel oil hat is currently being used.
10 At the time of writing, the VLSFO–HSFO spread in Singapore is $233/Mt. A laden VLCC (very large crude carrier) can save
up to $0.5 million on a typical Persian Gulf to China (TS3c) voyage.
4II. China: Tough government policies to tackle shipping emissions…
With severe air pollution episodes occurring increasingly in China in the early 2000s, the Chinese
government began adopting tougher ambient air quality standards and implementing a series of
measures to improve air quality. Most of these new policies targeted road transport and emissions
from freight trucks, with port cities and provinces only gradually focusing on emissions from ships and
port activities. Hong Kong was the first to strictly enforce the use of low-sulphur fuel (500 parts per
million (ppm), or 0.5 per cent sulphur content) by local vessels in 2014, followed by Shenzhen, which
announced a comprehensive list of measures for cleaning up ships, trucks, and port equipment. Other
port cities and regions, including Shanghai, Qingdao, Guangdong, Jiangsu, and Shandong, followed
suit, gradually promoting shore power, electrification of port equipment, and the use of electric or
natural gas-powered trucks.
As the urgency to tackle pollution rose, regional governments began responding. For example, the
port of Shanghai, one of the world’s busiest ports, accounted for 12 per cent of the City of Shanghai’s
total SOX emissions, 9 per cent of its NO X, and more than 5 per cent of its particulate matter (PM)
emissions in 2010. In Shenzhen, shipping was found to contribute about two-thirds of SOX, 14 per
cent of NOX, and 6 per cent of PM emissions. Efforts to regulate shipping emissions therefore gained
momentum and in April 2015 China’s Ministry of Transport (MoT) initiated the national Green Port
Programme, which assessed and certified the overall environmental performance of a port and,
starting on 1 January 2016, issued tighter standards for PM emissions. The government subsequently
designated the MoT to implement regional emission control zones and introduced national-level
legislation, the Law on the Prevention and Control of Air Pollution,11 to frame and support the MoT’s
efforts, also introducing specific requirements for ships concerning fuel quality, engine standards, and
shore power adoption.
In August 2015, the MoT released a Ship and Port Pollution Prevention Special Action Plan
(SPPPSAP 2015–2020),12 which included targets to reduce emissions from 2015 levels by 2020 in
the Pearl River Delta (PRD), the Yangtze River Delta (YRD), and the Bohai Rim (Beijing-Tianjin-
Hebei, Figure 1). Specifically, the SPPPSAP issued the following targets:
reduce SOX emissions by 20 per cent
cut NOX emissions by 65 per cent
reduce PM emissions by 30 per cent.
The plan also sets a target for 90 per cent of working vessels in these areas, including at container
and cruise terminals, to use shore power when berthing by 2020, to encourage ships to turn off their
diesel engines while at berth. Finally, the plan actively promotes the use of LNG as a primary marine
fuel. The benefit of LNG is that it not only reduces SOX emissions to zero, but also reduces NOX and
CO2 emissions, the latter being a part of the IMO 2050 carbon limits (to be firmed up by 2023).
11 http://www.gov.cn/ziliao/flfg/2005-08/05/content_20945.htm.
12 ‘Notice regarding the publication of the Ministry of Transport’s ship and port pollution prevention Special Action Plan (2015–
2020)’ (Chinese) http://www.gov.cn/gongbao/content/2016/content_5038094.htm, August 2015; ‘Provisions of the People’s
Republic of China on the prevention and control of ship pollution in inland waters (Chinese),
http://www.gov.cn/gongbao/content/2016/content_5059093.htm.
5Figure 1: Map of China’s ECZs
Note: ECZs = emission control zones.
Source: ICCT.
Building on the SPPPSAP, in December 2015 the MoT released an implementation plan for domestic
ECZs,13 laying out a more detailed roadmap for achieving the emissions reduction targets within the
SPPPSAP and designating 11 ‘key’ ports14 within the PRD, YRD, and Bohai Rim.
According to the December roadmap:
As of 1 January 2017, all ships 15 calling at the eleven ports in China are required to use fuel
with no more than 0.5 per cent sulphur while at berth. The regulation states that ships must
switch to compliant fuels within one hour of arriving at their berth and burn compliant fuels
until not more than one hour prior to departure.
A year later, starting 1 January 2018, the at-berth fuel-switching requirement is extended to all
ports in the three Chinese port regions (PRD, YRD, and the Bohai Bay). This second step
was significant given that these ports together handled more than one-fifth of containers
shipped around the world in 2014.16
Then, effective 1 January 2019, the clean fuel requirement is further extended to cover all
ships operating anywhere within the ECZs in the three port regions, also covering their
territorial waters (12 nautical miles off the coastline), making it the first such mandate outside
the EU and North America.
13 PRD, YRD, and Bohai Rim (Beijing-Tianjin-Hebei) waters, http://www.gov.cn/xinwen/2015-12/04/content_5019932.htm.
14 These include Shenzhen, Guangzhou, and Zhuhai in the PRD; Shanghai, Ningbo-Zhoushan, Suzhou, and Nantong in the
YRD; and Tianjin, Qinhuangdao, Tangshan, and Huanghua in the Bohai Rim area.
15 The regulation applies to all ships navigating, anchoring, and operating within the ECZs with the exception of military ships,
fishing boats, and ships/boats used for sporting purposes.
16 Barbara Finamore, ‘China acts to control shipping air pollution and greenhouse gas emissions’, NRDC Blog, 8 December
2015, https://www.nrdc.org/experts/barbara-finamore/china-acts-control-shipping-air-pollution-and-greenhouse-gas-emissions.
6 In addition, the plan allowed the 11 ‘key’ ports to enforce the regulation before 1 January
2017. As a result, the YRD introduced the at-berth requirement earlier, on 1 April 2016, and
the Shenzhen port in the PRD introduced the mandate on 1 October 2016.
In its 2015 roadmap, the MoT also required a review by the end of 2019 to determine if stricter fuel
quality requirements should be imposed. The review took place in late 2018 and created a single
domestic emission control area (DECA), expanding coverage of the 2019 requirement from the three
port regions to China’s entire coastline effective 1 January 2019, 12 months ahead of schedule. This
DECA still extends to 12 nautical miles (vs 200 nautical miles in North America), but also includes two
stricter emissions control areas in inland waterway systems, the Yangtze River and the Pearl River.
The ports of Shanghai, Ningbo-Zhoushan, and Suzhou in the YRD imposed the new caps earlier than
this new schedule, implementing them on 1 October 2019.17
In addition, the 2018 review phased in emission standards for NOX which were absent from the
December 2015 roadmap but required under the SPPPSAP, and set out tighter emissions standards
for all China-flagged new-build or rebuilt ships. Finally, unlike the IMO ECA regulations, the 2018
review introduced additional requirements on the installation and use of onshore power, stating that
all cruise ships must plug into shore-side electric power beginning on 1 January 2021 if they dock at
berths that are shore-power capable. Similarly, shore-power capable ships must be connected to
shore-side electricity if they dock at equipped berths starting from 1 July 2019.18 Estimates suggest
China will have 493 such berths by 2020.
By expanding the reach of the tighter fuel specifications from regional ECZs to a national DECA,
China has effectively become an early adopter of the IMO 2020 sulphur cap while also piloting a 0.1
per cent sulphur requirement for all ships on inland waterways and for ships entering waters off
Hainan island, with the latter starting 1 January 2022. 19 In addition, the 2018 review lays out the
potential to introduce more stringent sulphur requirement to the entire national DECA coverage area
starting in 2025.20
III. ...but a relatively muted response from refiners
Despite the changes in domestic regulations, and even though shippers and refiners globally have
been active participants in the preparations for the IMO transition and much of the debate on how it
would play out, Chinese refiners have seemed less preoccupied with it than their Western peers. This
is surprising to some extent. Given that China holds the world’s second largest refining capacity
behind the US, is home to six of the ten largest container ports globally, and, as detailed above, is an
early adopter of tighter shipping fuel emission standards domestically, it should be well ahead of its
global peers in its readiness for IMO 2020 and in its ability to supply global markets with IMO-
compliant fuels.
While the domestic bunker market has already started its transition to lower sulphur fuels, refiners
have played a relatively limited role in supplying that demand. This is in part due to high taxes and
onerous export quotas. As a result, a massive outflow of bunker fuels from China is unlikely, at least
in the near term. Indeed, the country’s MGO production, although plentiful, will struggle to compete
internationally due to high consumption taxes on distillates and limited export quotas. And barring a
radical change in taxes and export policies, any uptick in Asian diesel cracks related to higher MGO
demand may well end up incentivising diesel production and exports, at the expense of MGO.
Instead, VLSFO is emerging as the fuel of choice in China. State-owned refiners have announced
17 ‘Chinese ports bring forward marine fuel sulphur cap’, Argus, 12 September 2018.
18 Freda Fung and Jingtao Shan, ‘China taking further steps to clean up shipping pollution’, NRDC blog, 10 January 2019,
https://www.nrdc.org/experts/barbara-finamore/china-taking-further-steps-clean-shipping-pollution.
19, ‘Action plan for establishing China’s National Emissions Control Area’, ICCT Policy Update, March 2019,
https://theicct.org/sites/default/files/publications/DECA_China_policy_update_20190304.pdf.
20 ‘Action plan for establishing China’s National Emissions Control Area’, ICCT Policy Update, March 2019,
https://theicct.org/sites/default/files/publications/DECA_China_policy_update_20190304.pdf.
7plans to develop close to 20 mt of VLSFO production capacity in 2020, and have started producing
these fuels through 2019, although to date volumes have been minimal, estimated at under 1 mt.
So changes are now underway in China’s domestic bunkering market and in its refiners’ ability to
compete in international bunkering, thanks to a combination of favourable tax incentives at ports and
a tax rebate on VLSFO exports—which is widely expected in the coming months. In the near term,
higher VLSFO output will require some refiners to shift their crude slate to sweeter crudes, which are
currently commanding a premium, and squeeze production of clean products, including diesel and
gasoline. In 2020, as refiners experiment with VLSFO and seek to establish their position as market
leaders, they will continue producing VLSFO even with relatively unappealing economics. Refiners
located in coastal provinces and close to the emerging bunkering ports will be best placed to benefit
from the IMO transition. As the government continues to ease restrictions on trade in oil products,
Chinese refiners and bunkering hubs will emerge as increasingly competitive players in the global
bunkering market.
a. A tale of two bunker markets
The changes domestic regulations have impacted bunker fuel use within the country, although
assessing the extent of the change is complicated by limited data. The National Bureau of Statistics
(NBS) does not release monthly or quarterly demand data, publishing only lagged annual data, and
does not seem to have incorporated demand for MGO in its assessments.21
Anecdotal data from the Chinese oil majors and consultancies peg domestic bunker demand at 20 mt
in 2018,22 of which 13 mt consisted of bonded bunker sales at Chinese ports, and an additional 6-7 mt
consumed on inland waterways (Figure 2). But unpacking the fuel composition (fuel oil, distillate, and
LNG) is extremely challenging given the abovementioned data limitations, exacerbated for refined
products by obscure domestic blending practices.
Figure 2: China’s bunker demand, mt Figure 3: Diesel demand by sector, mb/d
Sources: CNPC, Sinochem, OIES. Note: mb/d = million barrels per day.
Sources: NBS, CNPC, OIES.
21 Interviews with industry insiders, Beijing, March 2018.
22 ‘An introduction to China’s fuel oil industry chain’ (Chinese), Donghai Futures report, August 2019,
http://www.qh168.com.cn/Upload/file/20190828/20190828083459185918.pdf; ‘2018 Fuel oil market report’ (Chinese), CNPC,
January 2019,
https://www.cnpc.com.cn/ypxx/yjnb/201901/14eaa5f21a914773b7d7b2a09d960cfc/files/092a5b5b00a84b74bc917fa44a045950
.pdf; ‘Why does China import large volumes of bonded fuel oil?’ (Chinese), China Petroleum News, March 2019,
http://news.cnpc.com.cn/system/2019/03/08/001722310.shtml.
8The existing publicly available data sets give a limited sectoral breakdown; so as a result, even
though NBS demand data clearly show that the bulk of diesel (Figure 3) and fuel oil (Figure 4) in
China are consumed in the transport sector, without a further breakdown between freight and
shipping, there are limited ways to gauge changes in fuel oil and MGO demand in domestic
bunkering.
Figure 4: Fuel oil demand by sector, mb/d Figure 5: Freight traffic, billion mt
Sources: NBS, OIES. Sources: NBS, OIES.
Fuel oil use in transport has been gradually falling since 2014, when the government began levying
consumption tax on it (see below), making it uncompetitive with blended bunker fuels. And while
diesel demand in transport has continued to grow, this is due to a combination of higher freight use
(from trucks, see Figure 5) and bunkering demand. Unpacking which one has contributed the most to
demand growth is challenging.
b. The domestic market is dominated by blenders…
Refiners claim that only a small percentage of the oil-based bunker fuels are actually produced at
refineries, with a large chunk emanating from domestic blending activities. 23 This is because
domestically produced fuel oil incurs a consumption tax of CNY 1,218/tonne ($173/tonne)24 in addition
to VAT at 13 per cent25 (Figure 6), making it by and large uncompetitive.
23 ‘2018 Fuel oil market report’ (Chinese), CNPC, January 2019,
https://www.cnpc.com.cn/ypxx/yjnb/201901/14eaa5f21a914773b7d7b2a09d960cfc/files/092a5b5b00a84b74bc917fa44a045950
.pdf; ‘Why does China import large volumes of bonded fuel oil?’ (Chinese), China Petroleum News, March 2019,
http://news.cnpc.com.cn/system/2019/03/08/001722310.shtml.
24 Based on the exchange rate in late November 2019 of CNY 7.03 to the USD.
25 VAT was 17 per cent until 2018, when the government reduced it to 16 per cent. Effective 1 April 2019 it was cut once more
to 13 per cent.
9Figure 6: Fuel oil prices in Shandong, yuan/Mt
Note: ‘LS resid and consumption tax’ excludes VAT; cst = centistokes; LS = low-sulphur
Source: Oilchem, OIES
This has allowed an active bunker blending market to flourish. In order to achieve the marine fuel oil
standard in China, GB 17411-2015, which is reportedly similar to ISO 8217,26, domestic blenders can
use a variety of components, mixing residue streams (including slurry and asphalt) with various cutter
stocks and by-products, such as paraffin and coal-based liquids, in order to produce competitively -
priced fuels. It is also common to blend one part jet fuel with three parts light cycle oil (LCO) in south
and east China to produce bunker fuels or gasoil.27
For now, therefore, domestic bunkering seems to rely more heavily on refinery-produced distillates
than on fuel oil—likely due to tax evasion that makes them more competitive. But as China is shifting
to 0.1 ppm in inland waterways on 1 January 2020 and the government is cracking down on tax
evasion, fuel oil demand could rise, given also that shippers are increasingly finding MGO viscosity
unsuitable28.
In the interim, with tighter fuel specifications and more stringent enforcement (of both fuel quality and
tax rules), it will become harder for blenders to operate and the state-owned refiners are likely to
regain market share in domestic bunkering. As the majors increase production of VLSFO, and some
use HSFO as an intermediate product, they will sell less HSFO and other blending components to
domestic blenders. Moreover, as the government is also encouraging LNG in shipping (see below on
LNG bunkering), demand for distillate-based bunker fuels is likely to fall further, leaving the
competition between LNG and resid-based bunker fuels down to the state-owned majors’
development strategies, as they are likely to emerge as the main suppliers of both VLSFO and LNG.
c. …and the bonded market is dominated by imports
The high costs of producing bunker fuels for the domestic market have also made them uncompetitive
in China’s bonded market, with the export quota system further hindering outflows. The government
manages product exports with two different licensing schemes: ‘tolling’ quotas and ‘general trade’
quotas. Under the former, refiners import crude explicitly in order to process it and re-export the
products, so refiners are exempted from import taxes on the crude oil as well as from export duties on
the oil products. But they are allocated a fixed volume and time slots to export, both under the tight
26 China’s diesel fuel specifications can be found here:, https://www.dieselnet.com/standards/cn/fuel.php.
27 ‘New refineries eye marketing options’, Argus, 1 March 2019.
28 ‘“Shippers must prepare as China shifts to 0.1 ppm fuels in inland waterways’waterways” (Chinese), Hyqfocus,
https://www.hyqfocus.com/jsp/model.jsp?id=1685&modelType=2.
10scrutiny of the Chinese customs administration, which has reportedly made this system inflexible and
onerous.29 Under the ‘general trade’ category, state-owned refiners are free to export regardless of
whether the feedstock is domestic or imported and, since 2016, refiners are refunded tax after exports
are completed or receive a tax waiver on fuel exports. As such, up until 2017 the bulk of the export
quotas were under the tolling route, but since 2017 the government has reduced the tolling quotas
significantly, favouring the general trade route (Figure 7). Bonded bunker fuels are therefore
essentially imported fuel and blendstock, which tend to be more competitive than domestic fuels.30
Figure 6: Export quotas, mt
Sources: MOFCOM, OIES.
Exports of gasoline, diesel, and jet are determined by the quotas, which are typically issued on a
quarterly basis, with any unused quotas rolled over to the next quarter, but not to the following year.
Fuel oil exports are not regulated, but under the ‘tolling’ system, refiners also have a small percentage
earmarked for ‘other products’ which typically includes fuel oil. Refiners can therefore export small
volumes of fuel oil tax-free, but as volumes of ‘tolling’ quotas have fallen, so have the favourable tax
conditions for selling fuel oil internationally.
As a result, China’s bonded bunker market relies heavily on imports—almost 90 per cent of bunker
fuel imports in 2018 were 380cst HSFO, alongside more limited volumes of MGO, as well as 180cst
and 500cst HSFO. But only an estimated 0.6 mt (or around 10–15 thousand barrels per day (kb/d)) of
MGO were sold that year from bonded storage tanks.31 Indeed, distillate-based bunker fuels face
similar constraints. Domestically produced MGO incurs an even higher consumption tax than fuel oil,
at CNY 1,411/tonne ($200/tonne), and so any exports would need to be competitive from that price
point, especially since MGO exports would also eat away at refiners’ distillate export quotas.
A combination of changing domestic dynamics—including the ongoing tax crackdowns and more
stringent enforcement of tighter fuel specifications domestically—alongside the state-owned refiners’
efforts to increase their production of VLSFO, will make China a more active participant in the
international bunkering market. The government is widely expected to announce tax rebates for
VLSFO exports in the coming months, although these are likely to be governed by an export quota
system to begin with. Nonetheless, refiners anticipate that the tax rebates will make their VLSFO
more competitive, effectively breaking the tax barrier standing between them and the global bunkering
29 While this has been an appealing tax-saving method for Sinopec, which relies on imported crude, it has been less
advantageous for PetroChina, which relies more heavily on domestic crudes for its refineries.
30 http://www.xindemarinenews.com/m/view.php?aid=10860.
31 ‘Chinese ports bring forward marine fuel sulphur cap’, Argus, 12 September 2018.
11market. At the same time, the advent of FTZs may encourage blenders to move their activities to
these bonded zones, shifting competition with state-owned refiners producing VLSFO away from the
domestic market. Refiners, however, also have considerable distillate production capacity and even
though the current export quota system makes it hard for them to respond quickly to Asian price
signals, should diesel cracks surge in 2020, they will be able to capitalize on an MGO-led IMO
transition, albeit at the margins. In the next section, we discuss domestic product output and the
implications of the IMO transition for refiners.
IV. China’s refiners gear up for IMO 2020
China has ample capacity, at least in theory, to produce IMO compliant fuels. The country’s
nameplate refining capacity in 2019 is estimated at 16.7 mb/d, with an additional 0.4-0.5 mb/d of new
crude distillation units planned for 2020. 32 China’s refining system has traditionally been geared
toward producing industrial fuels, using medium and heavy crudes as feedstock. As a result, diesel
yields at their peak in 2006 reached 40 per cent, and have since fallen to around 33 per cent, while
fuel oil yields peaked in the late 1990s at close to 10 per cent, dropping subsequently to under 4 per
cent in 2018.
As China’s domestic economic structure began moving away from its reliance on industrial production
to a growing demand for consumer goods, so too has demand for oil products shifted from the middle
and bottom of the barrel toward light ends. In light of this, the government and state-owned refiners
have long been targeting a reduction in diesel yields in favour of gasoline (Figure 8), given
expectations that rising car ownership would support gasoline demand and a gradual shift away from
industrial activity as the mainstay of the Chinese economy would weaken demand for diesel.
Similarly, fuel oil demand in industry and power has declined, while jet fuel yields have grown to
service the country’s growing air transport needs (Figure 9).
Figure 7: China diesel and gasoline yields, % Figure 8: China jet and fuel oil yields, %
Sources: NBS, OIES. Source: NBS.
a. Large distillate and resid production capacity…
It is important to note that even as diesel yields have fallen, China’s overall installed refining capacity
has increased, so diesel output has continued to grow, rising from 2.3 mb/d in 2005 to 3.6 mb/d in
2018 according to the NBS. That said, domestic product output and runs data have been skewed,
32 Assuming that not all plants start up and run at full capacity. Planned additions include the following: Rongsheng is starting
up its second 0.20 mb/d crude distillation unit in H1 20; Sinopec is starting up its 0.20 mb/d Zhanjiang plant (Zhongke) in H2 20
as well as a 40 kb/d expansion to its Luoyang refinery; Sinochem is planning an additional 60 kb/d at Quanzhou; while a
number of independents are planning close to 0.20 mb/d of new capacity.
12especially between 2016 and 2018, as the Shandong independent refiners misreported their crude
throughputs for tax evasion purposes. 33 During these years, Shandong runs were most likely
understated, with estimates of the misreporting ranging from 0.3 mb/d to as much as 0.8 mb/d.
Starting in 2018 the government reformed its tax collection system, 34 and by introducing an online tax
platform has eliminated the use of fake invoices, suggesting that runs reporting has become more
accurate. In response, as the market for fake invoices for crude dried up, parts of the products market
have moved outside of the tax system, with refiners selectively issuing invoices for products sold to
private retailers at the refinery gate,35 especially for off-road diesel and potentially bunker fuels, given
that these customers do not require invoices but do favour lower costs.
The clearest manifestation of this latest discrepancy in product output has been the collapse of diesel
yields in Shandong, home to many of China’s independent refiners. Indeed, diesel yields plummeted
from an average of 47 per cent in 2017 to 34 per cent in 2018 and then to 23 per cent in 2019, even
as provincial runs continued to rise (see Figure 10).
Figure 9: Shandong diesel yields, %, runs, mb/d Figure 10: China’s diesel production, mb/d
Note: Includes adjustment for underreported diesel output
Sources: NBS, OIES. Source: NBS.
A number of reports and conversations with independent refiners suggest that diesel yields have not
fallen dramatically and some refiners note that they actually raised diesel yields in 2019, in response
to strengthening prices.36 Assuming historical average diesel yields in Shandong province of 43 per
cent and applying them to 2019, suggests that some 0.4 mb/d of diesel production is underestimated
by official data in China. So, when accounting for underreported runs and output, diesel yields are still
in decline, but domestic output is growing (Figure 11). Chinese refiners clearly have the capacity to
produce distillate-based bunker fuels, but only output in Liaoning province and in the YRD have easy
access to export markets. A third of the total diesel produced in China is in the northern parts of the
country (North ex-Shandong and North East in Figure 12) and an additional 21 per cent is produced in
Central and Western China. Oil product transport and distribution infrastructure in these provinces has
been built to encourage flows of crude and products from coastal areas further inland, rather than
33 See: Michal Meidan, ‘China’s independent refiners: A new force shaping global oil markets’, Energy Insight 12, May 2017,
https://www.oxfordenergy.org/wpcms/wp-content/uploads/2017/05/Chinas-Independent-Refiners-A-New-Force-Shaping-Global-
Oil-Markets-OIES-Energy-Insight.pdf?v=79cba1185463; Erica Downs, ‘The rise of China’s independent refineries’, Center on
Global Energy Policy working paper, September 2017,
https://energypolicy.columbia.edu/sites/default/files/CGEPTheRiseofChinasIndependentRefineries917.pdf.
34 Oceana Zhou, ‘Beijing charges ahead with administrative reforms to eliminate oil tax loopholes’, S&P Global Platts, 1 March
2018, https://blogs.platts.com/2018/03/01/beijing-reforms-eliminate-oil-tax-loopholes/.
35 ‘China NBS data take a turn for the worse’, Argus, 26 July 2019.
36 ‘Demand revision suggests little slowdown for diesel’, Argus, 28 August 2019.
13from these areas to export markets, and therefore land-locked refiners traditionally prioritize their local
markets. In 2017, for example, diesel exports out of Beijing-Tianjin-Hebei accounted for only 6 per
cent of the national total (North ex-Shandong in Figure 13).
The largest diesel-producing province is Shandong at 0.9 mb/d, or 25 per cent of total diesel
production in China in 2017, where the independent refiners tend to sell off-road diesel to industrial
users, domestic blenders and the majors’ sales arms. As they have limited retail outlets and no export
quotas (for now), the independents would need to rely on the majors for export logistics to tap into the
international bunker market, and this would be likely to incur even higher costs. As a result, Shandong
province accounted for only 7 per cent of the country’s total diesel exports in 2017. One of the largest
export provinces is Liaoning, where diesel production reached 0.4 mb/d in 2018, or 12 per cent of
domestic output. Given these refiners’ proximity to a large bunkering hub in Dalian, in 2017 they
accounted for a quarter of total diesel exports.
Finally, refiners near the country’s main waterways have large production volumes that could be
diverted inland or overseas. In the YRD (Shanghai, Jiangsu and Zhejiang), refiners accounted for 11
per cent of diesel output and 22 per cent of diesel exports in 2017. In Guangdong (9 per cent of
domestic production), at the mouth of the PRD, refiners accounted for 12 per cent of China’s diesel
exports in 2017.
Figure 11: Diesel production by region 2017, % Figure 12: Diesel exports by region 2017, %
Note: Includes adjusted for underreported diesel output. Note: Customs stopped publishing detailed export data in 2018.
Sources: NBS, OIES. Sources: China Customs, Argus, OIES.
The geographic mismatch between production and export infrastructure has constrained diesel
exports historically and is therefore likely to act as a barrier to large volumes of MGO exports. If Asian
diesel cracks supported it, however, China’s coastal refiners should be able to produce MGO for
export, but the diesel export market is far bigger and more profitable, and so using export quotas for
that makes more sense than for MGO.
b. …but China’s refiners are focusing on VLSFO
For now, given high demand and prices (VLSFO prices are not far below those for MGO), fuel oil is
emerging as state-owned refiners’ favoured option in response to the opportunities that the new IMO
regulations present. Output in the YRD—mainly in Zhejiang province, where the Zhoushan FTZ and
bunkering hub is located—has been picking up substantially in recent months (Figure 14). The vast
majority of fuel oil production remains in Shandong, although the independent refiners’ enthusiasm for
producing bunker fuels has been muted, to date.
14Figure 13: Fuel oil production by region, mb/d
Source: NBS.
Contrary to diesel, China’s fuel oil production has been relatively flat at around 0.45 mb/d between
2013 and 2018, while imports have dropped as demand started slowing. But the arrival of IMO 2020
is leading to a tentative reversal in fuel oil’s fortunes. Here too, there is no official data on VLSFO
production as a share of total fuel oil output, but there are plenty of announcements from the state-
owned refiners suggesting they will increasingly emphasize VLSFO:
Sinopec has announced it will have 10 Mt of VLSFO capacity by 2020, increasing to 15 Mt by
2023 from ten refineries (Table 1).
PetroChina is gearing up for 4 Mt of VLSFO output in 2020 from eight plants, doubling that
production capacity in 2021.
CNOOC plans to produce 3.6 Mt in 2020, and is reportedly capable of producing 1.7 Mt
already, increasing its output to 6 Mt in 2022.
Finally, Sinochem is planning 0.55 Mt of output in 2020 from its Quanzhou refinery, rising to
1 Mt in 2021.
Combined, therefore, China’s state-owned majors aim to produce just over 18 Mt of VLSFO in
2020,37 which falls only slightly short of overall demand within the country, before increasing
to close to 23 Mt in 2021, 25 Mt in 2022 and a massive 30 Mt by 2023.
37 Huatai Futures report (Chinese), 29 September 2019,
https://www.htfc.com/wz_upload/png_upload/20190930/15697737151693aafab.pdf.
15Table 1: Sinopec and PetroChina refineries producing IMO-compliant VLSFO
Refinery Location Name- Resid VLSFO Supply Crude slate
name plate hydro volume start date
kb/d kb/d (mt)
Sinopec Refineries
Shanghai Shanghai 320 78 6,000 Jan 19 Light, medium imports
Petrochemical
Jinling Jiangsu 380 70 8,000 May-19 Sour imports
Petrochemical
Zhenhai Zhejiang 460 50 (50 Ready to Sour imports
Refining in Dec start
19)
Qilu Shandong 370 52 Tested Aug 2019 Middle East, WAF
Petrochemical stability imports
Tianjin Tianjin 300 26 2020 Local Dagang (sweet),
sweet crude imports
Qingdao Shandong 100 26 5,000 Nov 2019 Sour imports
Petrochemical
Zhanjiang Guangdong 100 2020 Imports from Angola,
Dongxing Gabon, Ghana
Maoming Guangdong 470 40 (80 Ready to Sour crudes, Middle
in 2020) start East
Hainan Hainan 160 2,200 Feb 2019 Imports, Middle East,
Refining and Angola
Chemical
Zhanjiang Guangdong 200 H2 2020 Kuwaiti crude
(Zhongke)
PetroChina refineries
Liaohe Liaoning 100 4,500 Apr 2019 Domestic sweet
Petrochemical crudes
Liaoyang Liaoning 200 3,200 Nov 2019 Domestic, Russian
crude
Dalian Liaoning 410 60 3,500 Jun 2019 Daqing, WAF
Petrochemical
Dalian Liaoning 200 40 Sour imports
WEPEC
Jinzhou Liaoning 180 (30 in Ready to Domestic sweet,
Petrochemical 2020) start imports Chad, Russia
Guangxi Guangxi 240 80 3,000 Aug 2019 Light sweet
Petrochemical
Dagang Tianjin 100 Domestic Dagang
Jinxi Liaoning 130 Ready to Domestic
Petrochemical start
Notes: Resid hydrotreating capacity in brackets denotes additional unit capacity; WAF = West Africa; WEPEC =
West Pacific Petrochemical Co.
Sources: Company reports, SCI, Argus, OIES.
16Of these plants, eight have already produced VLSFO and sold it to bunkering hubs. Given these
refiners’ different levels of complexity and crude slates, their VLSFO production strategies will vary,
but most that have now started producing VLSFO need to tweak their crude slates and product yields,
without requiring substantial secondary unit upgrades. Chinese refiners hold an estimated 5.5 mb/d of
hydrotreating capacity, more than half at Sinopec refineries, which are also well equipped with residue
hydrotreating units, allowing them to produce low-sulphur slurry oil for use in bunkering (see Table 1).
Sinopec’s Jinling, Zhenhai, Hainan, and Qilu refineries, as well as PetroChina’s Guangxi refinery, are
seeking to sweeten their crude slates, which will give them a steady source of low-sulphur vacuum
gasoil (VGO) to blend into VLSFO.38 Sinopec’s Zhanjiang Dongxing Petrochemical and PetroChina’s
Liaohe Petrochemical already run sweet crudes. Zhanjiang Donxing relies on imports from Angola,
Gabon, and Ghana, allowing it to blend slurry oil, vacuum residue, and catalytic gasoil to produce on-
spec VLSFO. Liaohe Petrochemical processes sweet domestic crudes that are well suited to
producing IMO-compliant VLSFO.
Overall, PetroChina refineries that run on domestic low-sulphur crudes will be able to produce VLSFO
without substantial unit upgrades. Liaohe crude, for example, has a sulphur content of 0.34 per cent
while Daqing has 0.11 per cent and Daqing Blend has 0.18 per cent.39 CNOOC refineries also run
low-sulphur crudes from offshore fields in the Bohai Sea. So, while some refiners will need to tweak
their crude slates, for most others the main issue will be the loss of intermediates, including VGO and
residue oil, which will squeeze output of other high-value refined products such as gasoline and gasoil
in favour of VLSFO.
Estimates peg the loss of gasoil and diesel—for production of 10 mt of VLSFO—at 5 mt combined,40
with gasoline accounting for over 3 mt of that reduction. Considering that in 2018 China produced 140
mt of gasoline and 170 mt of diesel, a 5 mt loss overall would have a limited impact on product
supply. However, given that fewer than 20 refineries (out of over 150 in the country) will shoulder this
loss, the economic upside for these refiners will need to be significant over time. To be sure, in the
first few months, as these plants seek to experiment with VLSFO output and establish themselves as
market leaders, they will pursue VLSFO production with limited regard for the economics—especially
since VLSFO production volumes have thus far been limited (under 1 mt), and therefore the loss of
clean product is also limited. In Q4 19, losing some output will not an issue as domestic gasoline
demand weakens seasonally, but in Q1 20, peak transport fuel season, the decision to prioritize
VLSFO output may be more complicated, especially since the Shandong teapots and the new mega-
refineries could look to produce more gasoline and diesel at the expense of the majors.
The Shandong independents could also test their mettle in low-sulphur bunker fuels, but most of them
will need to invest in additional secondary units. They have added an estimated 70 kb/d of residue
hydro treating capacity and plan to add close to 0.2 mb/d through 2020. But in recent years most of
their unit additions have been delayed cokers, reformers, hydrocrackers as well as gasoline and
diesel hydrotreaters. 41 Given the majors’ dominance of the VLSFO market and uncertainty
surrounding MGO demand, and in light of the current domestic credit squeeze and their dire finances,
they may hold off additional investment plans. That said, the Shandong independents also fear that
the sweet crude imports they favour will become increasingly costly post-2020, so retooling their
plants to run sourer crude may become a more appealing option in 2020. Currently, Shandong
refiners are biased toward deep conversion, with 23 per cent coking relative to primary capacity
compared with an average of 13 per cent in the rest of China. This absorbs large amounts of residue,
but leaves petroleum coke. The Shandong teapots also sell some of their fuel oil as bunkering
38 In spite of high premiums for these crudes, the economics are compelling: in early December 2019, 0.5 per cent sulphur
marine fuel was fetching a $284/mt premium to Platts 380 cst HSFO, up from $44.50/mt on 2 January 2019 when Platts started
assessing cargoes of IMO-compliant bunker fuels (Bunkerwire, 4 December 2019).
39 According to SCI.
40 This view is also echoed by domestic shippers: ‘The fuel oil export rebate policy offers opportunities and challenges for
domestic refiners’ (Chinese); Argus China Petroleum, November 2019, p. 6.
41 ‘Bunker rules spur Shandong residue rethink’, Argus, 30 November 2018.
17You can also read