Hotels & Chains in Italy 2018 - 5 YEARS OF ACCURATE HOSPITALITY STATISTICS - Horwath HTL
←
→
Page content transcription
If your browser does not render page correctly, please read the page content below

Hotels & Chains in Italy
                  2018

    5 YEARS OF ACCURATE HOSPITALITY STATISTICS
This year the census was made even more accurate and reliable thanks to the gentle support provided by development
analysts, managers and directors of:

9 HOTEL COLLECTION                      DELPHINA                                LUNGARNO COLLECTION
A&O HOTELS & HOSTELS                    DIMHOTELS                               MANDARIN ORIENTAL HOTEL GROUP
ACAMPORA                                DORCHESTER COLLECTION                   MARRIOTT INTERNATIONAL
ACCOR                                   DUETORRIHOTELS                          MEININGER
AEROVIAGGI                              EDEN                                    MELIA HOTELS INTERNATIONAL
ALLEGROITALIA HOTELS & CONDO            FAMILY HOTELS ITALIA                    MINIHOTEL
ALPITOUR                                FATTAL                                  MITHOS HOTELS
AMAN RESORTS                            FERIENVEREIN                            MONRIF
AMAPA GROUP                             FLORENTIA HOTELS & RESIDENCES           NH HOTELS
AMT HOTELS                              FMTG                                    PALLADIUM
ARS HOTELS                              FOUR SEASONS                            PLANETARIA HOTELS
AURUM                                   GARIBALDI HOTELS                        PLATENO GROUP
AZZURRO CLUB VACANZE                    GB THERMAE HOTELS                       PREMIER HOTELS
B&B                                     GENIESSER                               PRIM HOTELS
BARCELO' HOTELS                         GREENBLU HOTELS                         RESIDENCE HOTELS
BELMOND                                 GROUPE VALADIER                         RIMINI HOLIDAYS
BEST WESTERN                            GRUPPO MIRAGE                           RIMINI RESIDENCE
BIANCHI HOTELS                          GRUPPO STUDIO VACANZE                   RIZZANTE HOTELS
BIANCONI                                GRUPPO UNA                              ROCCO FORTE
BLUSERENA                               H 10 HOTELS                             ROSEWOOD
BOSCOLO                                 HILTON                                  SD HOTELS
CARLSON REZIDOR                         HNH HOTELS & RESORTS                    SHANER
CAROLI HOTELS                           HRE                                     SHANTI HOSPITALITY
CATALONIA HOTELS                        IH HOTELS                               SINA HOTELS
CDS HOTELS                              IHG                                     STARHOTELS
CERINI HOTELS                           INC HOTELS GROUP                        TH RESORTS
CHC                                     ITALIANA HOTELS & RESORTS               THE FAMILY COPPOLA HIDEWAYS
CHOICE HOTELS                           ITALICA HOTEL                           TIMBERS RESORTS
CIMINO HOTELS                           ITI HOTELS                              TOWN
CLAP HOTELS                             JSH HOTELS & RESORTS                    TREVI
CLUB ESSE                               LDC HOTEL & RESORTS                     TRIANON GROUP
CLUB FAMILY HOTELS                      LEONARDI                                TUI
CLUB MED                                LHP HOTELS                              VERATOUR
COMPAGNIE DES HOTELS                    LOAN                                    VIP HOTELS
CONCERTO                                LOUVRE                                  WYNDHAM

Thank you All.
Hotels & Chains in Italy 2018 – The Report
EXECUTIVE VERSION
© All rights reserved 2018

Author:
Giorgio Ribaudo
HORWATH HTL

Main contributors:
Alessio Franzese
HORWATH HTL
Valeria di Claudio
ASSOCIAZIONE ITALIANA CONFINDUSTRIA ALBERGHI
Maddalena Terraneo
HORWATH HTL
Luca Usai
UNIVERSITY OF CAGLIARI
Burak Darici
HORWATH HTL

Graphics & Web design:
Gianluca Franzese
Efisio Farci

Edited in January 2018 by Horwath HTL and Associazione Italiana
Confindustria Alberghi in partnership with Cassa depositi e prestiti.
Printed on February 2018 in Rome by Associazione Italiana Confindustria
Alberghi, Roma.
All data on hotel chains as of December 31st , 2017.
5th edition. Executive Version

Scanning and photocopying prohibited – Please, ask us for extracts from
this Report or the previous editions at italy@horwathhtl.com
This version of the Report is distributed for free.
We have tried our best to correctly report information and data on hotel
chains and have directly contacted hotel chains responsible persons
prior to distribution for data check, in order to improve accuracy.
Nevertheless, omissions and minor errors may occur as
methodologically accepted for any census.
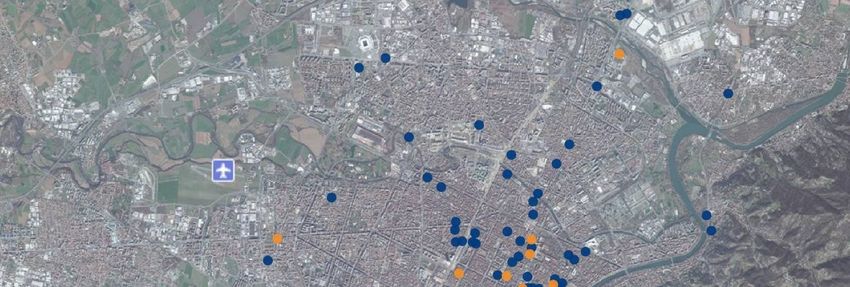
Table of Contents
Foreword, by Associazione Italiana Confindustria Alberghi 6
Foreword, by CDP Investimenti SGR 7
Five years of census, by Horwath HTL 8
Markets, chains and the research agenda, by the editor 9
HOTEL INDUSTRY IN EUROPE AND ITALY
Contribution of tourism to economic growth 12
Italy and the European arena 14
A full cycle of hotel demand in Italy 16
A full cycle of hotel supply in Italy 18
Recent trends & performances 20
HOTEL CHAINS IN ITALY
Chain’s growth and Europe 24
Key evidences from 2017 26
Chain Hotels by number and size – 5 years 28
Chain Hotels by scale 30
Chains by type of destination 32
Chains’ footprint 34
Focus: Chains’ footprint in Lombardy 35
Chains’ footprint growth 2013-2017 36
Business models 38
Top 30 Chains and Brands in 2017 40
Top 20 Brands by business model in 2017 41
Top 20 Brands by scale in 2017 43
Top 10 Brands by destination type 45
Hotel chains growing in 2017 47
Italian chains’ international footprint 48
Pipeline by scale 50
Pipeline, re-branding and destinations 51
Brands’ Country of origin 52
2020 competitive landscape for chains 53
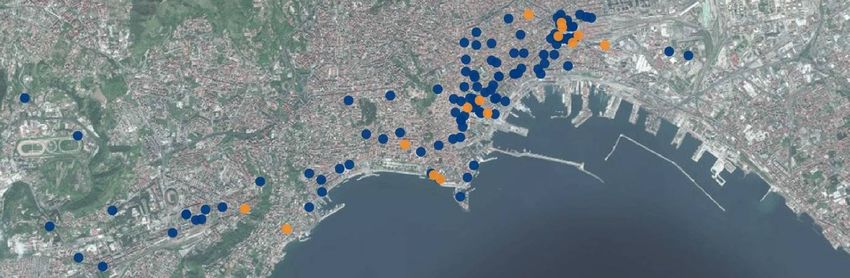
Hotels & Chains in Bologna 54
Hotels & Chains in Genoa 56
Hotels & Chains in Matera 58
Hotels & Chains in Naples 60
Hotels & Chains in Turin 62
FOCUS ON CHAIN HOTELS FACILTIES & SERVICES
Innovative hotel concepts and chains 66
Food & Beverage 67
Wellness & SPA 68
Swimming Pools 70
Leisure & Business facilities 72
Sport & Games 74
Methodology 77
Legenda 78
About the Authors 79
4 Hotels & Chains in Italy 2018 © - 5th edition
Foreword
The international tourism demand is constantly on the increase: according to the latest UNWTO figures, in 2017
international tourist arrivals increased by 7% compared to 2016, thus reaching a total of 1.32 billion.
In Italy, Eurostat figures confirm this growing trend: in the first 10 months of 2017 international arrivals recorded a +
4.7% compared to the same period in 2016. The role of tourism as a key sector of our economy is consolidating: if in
2011 the sector contributed to 8.6% of the Italian GDP and 9.7% of employment, by 2027 these figures will rise to 11.9%
of GDP and 14.5% of employed people, according to WTTC estimates. Also, tourism export is bound to increase from
the current EUR 37.2 bn to EUR 47.8 bn in 2027.
These results are determining an increase in the interest of international operators and real estate fund managers
towards our Country and in particular our hospitality sector.
What is the consequence of this? Firstly, the process of repositioning the offer towards more qualified segments
continues: already in 2016 there was an increase in the capacity of 4 and 5-star hotels that now account for 37% of the
rooms, while in 2007 they accounted for 29% of the total Italian hotels. The average size of the hotels is steady at about
33 rooms, a figure below the European average of 36 rooms, but not too much.
The chained-brand hotels are growing but with different business models and brands compared to the past: the
development model based on the purchase of buildings continues to be the prevailing model, but in 2017 there was a
strong surge in leasing. The other management models - contract management and franchising - are also growing, but
at lower rates than the others, probably because they are typical models for the development of international chains
which, compared to domestic ones, are still a minority. On the other hand, the increase in the number of brands is a
sign of greater specialization on well-identified client targets or of the desire to diversify the business also in favour of
forms of hospitality other than hotels.
In addition to these changes, today clients have different needs and look for something new - experience has become
the key word in these latest years. Indeed, there are an increase in competitors from different sectors - and this proves
the ‘profitability’ of the industry in Italy - various distribution channels, and last but not least, the impact of
digitalization that unstoppably accelerated these transformations.
Two are the keywords: innovate and reinvent, as quickly as possible. We live in a very hectic world, where emerging
trends can rapidly spread and become a consolidated expectation of an ever-growing group of clients. Those who,
chains or independent hotels, will be able to anticipate the new trends, will succeed.

Giorgio Palmucci,
Presidente Associazione Italiana Confindustria Alberghi

Hotels & Chains in Italy 2018 © - 5th edition                5

Foreword
The Italian hospitality market, as highlighted by the 2017 data, will be driven in 2018 by growing hotel chains
penetration, increasing real estate transactions volume and evolution of operators’ business model.
About the first trend, finally there is a clear evidence that the Italian market is slowly but constantly year after year
filling the gap with other European countries in terms of hotel chains penetration by number of hotels (4,5% in 2017 vs
3,9% in 2013). The current evolution to a more professional and high-quality offer by hotel chains is driven by the
growing number of international arrivals and new generations of tourists (e.g. millennials) accustomed to easily
compare and choose different travel experiences among different continents and a wide range of international
destinations.
In terms of hotel transactions, according to the latest data from, an international consultancy firm, the Italian hotel
market registered a record high volume of around €1.6 billion for 2017 up from €1.5 billion in the previous year, driven
by cross-border investments mainly from private equities groups. The investor sentiment is expected to remain
positive, thanks to a mix of different fundamentals: the recent long-awaited internal economic recovery, growing
international tourists’ inflows and solid market conditions that are driving the attention of foreign and domestic
operators in the direction of the main Italian cities (i.e. Rome, Milan, Florence and Venice). In addition, an increasing
number of market players are seeking exposure to leisure destinations in southern Italy as a result of the stronger
appeal of Italy for international travellers due to the geopolitical instability in other Mediterranean markets like North
Africa, Turkey and part of the Middle East.
“Asset light” vs “asset ownership”: concerning the third market driver of 2018, for the first time data show that in Italy
the number of rooms operated in leased hotels is larger than the number of rooms operated in owned hotels (Lease:
64.429 vs Owned: 62.050). In the Italian hospitality sector, Cassa depositi e prestiti (CDP) is promoting this evolution of
the business model supporting the spin-off of real estate assets from the hotel management operations (also through
sales and leaseback transactions). This strategy allows hotel chains and sector operators to unlock relevant amount of
capital and reinvest the proceeds to fund expansion plans and core operations (e.g. FF&E - furniture, fixtures &
equipment, on-line booking, human resources, marketing & branding etc.).
CDP, in its role of National Promotional Institution, recognizing the tourism industry as a key part of the national
economy, has recently established – through CDP Investimenti SGR – a real estate investment platform called “FIT -
Fondo Investimenti per il Turismo” with the specific mission to attract domestic and foreign investments for the
renewal and upgrade of the Italian hospitality real estate infrastructure. CDP is eager to work and co-operate with all
market players to strengthen the competitiveness of the Italian tourism sector improving the quality of the national
hospitality real estate infrastructure while supporting hotel chains and national operators to create lasting value for
their guests, employees, stakeholders and local communities.

Marco Sangiorgio,
General Manager CDP Investimenti SGR

                                                            6                   Hotels & Chains in Italy 2018 © - 5th edition
Five years of census
Dear Readers,

six years have passed and 5 Reports have been produced since we started our research in the field of hotel chains. A
census which has demonstrated to be a trustable source of information on chains in Italy in these years and today it
renovates its contribution to the industry with this 5th edition.
A lot has changed since the very first edition: today we can track the evolution of the presence of chains in the country
and understand how they evolved in terms of business models, geography, scale and their presence.
At the beginning of 2018, there are almost a thousand and five hundred chain hotels in Italy. A figure which
demonstrates a certain increase compared to 2013 (+13.8%) which is reflected in an even higher increase in the chains’
room stock (+14.1%). The number of brands has significantly grown, confirming that the attention international
investors and brands put today on our country is kept high.
At the end of the year, we counted 227 corporate brands corresponding to 165 chains, clearly excluding networks,
consortia and light brands in general. Their countries of origin are more differentiated than ever: not only Italy, USA,
France and Spain, but also Germany, Austria, UK, Belgium, Israel, Taiwan, Canada, Turkey and many other countries.
While expanding their global footprint, international chains are effectively struggling to have at least one property in
Italy.
No surprise international brands continued to look at Italy with special interest in 2017: the latest available data
(Eurostat 2017) confirmed Italy is the second European country for international hotel arrivals (after Spain).
But even domestic hotel chains have grown significantly during last year and have expanded internationally. We
accounted for a well-structured panel of domestic chains: today Italian groups manage on average 900 rooms in 9
hotels in Italy (thus excluding their international portfolio).
Among them, white label operators continue their energetic growth. We recorded this year managed by a white label
operator are close to 70, while they were around 50 in 2013. This witnesses the growing importance of both leasing to
professional operators (most often domestic) while targeting international demand through global brands.
At the end of December 2016, along 470 destinations in Italy, we counted over 1,480 chain hotels for almost 165
thousand rooms, representing 15% of the Italian room stock. This is a net increase of over 60 hotels and 6 thousands
rooms on 2016, which indicates that the process of branding and de-branding results in increasing size of chains’
footprint in the country.
We do thank chains for their valuable support in improving market knowledge for Italy.
We hope you will enjoy the reading!

Zoran Bačić,
Senior Partner & Managing Director Horwath HTL

Hotels & Chains in Italy 2018 © - 5th edition              7
Markets, chains and the research agenda
The importance of hospitality for the overall Italian economy is growing, being this a stable and reliable industry.
If we look at this phenomenon with the hoteliers’ eyes and a global perspective, the curiosity for Italy as a hotel
destination continues and even accelerates. According to most recent data1 international hotel arrivals have grown
4.3% on 2016. It is an over the average result, considering the 60-year CAGR for this measure is 3.3%.
This deserved international success, which doesn’t come new, has a key impact on two main financial grounds:
first it supports a positive commercial balance, a real panacea for the Italian economic outlook and the robustness
of country economy,
second due to the larger and diversified portfolio of markets, it also lowers volatility of tourism contribution to GDP,
thus generating stability or lowering fluctuations.
Are hotel chains contributing to all this? Is there any positive correlation between the increase of chains presence and
the growth of international visibility?
We have long tried to study this potential correlation and finally tested it with the contribution of 22 brands, covering
overall 21 destinations: we have found that chain hotels attract more international demand than the average ability of
the destination. That, is, in general, per each destination and scale, chain hotels attract more international demand per
room (FmPAR – Foreign market Per Available Room) than the average of hotels in the same destination and scale. This
demonstrated to be true also for domestic chains, though to a minor extent.
Interesting to note that there is evidence, from the same study we conducted, that the home country of the brand will
significantly determine the feeding markets for the hotel.
Back to the evidence of the census, Italian hotel chains are growing faster than international ones. In the last 5 years
tens of Italian chains have flourished and reached the cut-off size of 5 properties. Domestic chains are very flexible in
the current competition landscape: they can now source from both equity and non-equity business models, although
domestic franchisor brands are very limited. They are prone to consider destinations outside tier 12 and manage even
seasonal resorts, targeting lower but steady profits.
How much space is there left for chains expansion, then? For the most diverse reasons, in an over-30-thousand-hotel
portfolio, the hotels in the melee are no more than 3 thousands. Half (1,488) is already taken.
These 5 years of census have taught that, in general, international operators will especially target destinations where
the international demand share is higher. Since the need to “consolidate and compete” is growing also among family
run businesses, franchisors will experience part of their expansion to be “pull” driven in the very next years.
The big challenge for domestic operators to grow is, instead, twofold: rejuvenate some of those tired hotels within the
mentioned 1,5 thousands, taking advantage of the frequent generational transition issues, or expand abroad. This latter
is a strategy someone is seriously taking into consideration.
Assuming markets and chains have something in common, will there be space for development abroad to attract
Italians?
Giorgio Ribaudo,
editor - Horwath HTL
1Eurostat figures for 2017 are available up to October: November and December data accounted as equivalent to 2016.
2Rome, Milan, Venice and Florence.
8 Hotels & Chains in Italy 2018 © - 5th edition
Hotel Industry in
Europe and Italy

HOTEL INDUSTRY IN EUROPE AND ITALY
Contribution of tourism to economic growth   12
Italy and the European arena                 14
A full cycle of hotel demand in Italy        16
A full cycle of hotel supply in Italy        18
Recent trends & performances                 20

Order the Hotels & Chains 2018 Full Edition
After 5 years of running the census in Italy we structured the most complete database on hotel chains, built
and updated by Italian analysts based in Italy, with corporate information on presence, pipeline and key
features of all the chain hotels in Italy.
Order the Full Edition to get over 100 pages of key
statistics on hospitality in Italy, including:
Extended rankings (+ 100 operators) by scale, size,
business models, history of the last 4 years
Top 50 brands complete outlook (list of properties
and aggregate facilities profile)
Top 50 brands market share and footprint history
(2013-2017)
Top 20 destinations complete outlook, including geo-
referencing of chain and independent hotels by scale
Complete pipeline 2018-2019
Key persons (+100) in the area of hotel development
and affiliation
Interviews with Italy experienced development
directors on hospitality business drivers 2018
Recently branded and recently de-branded hotels
…and much more.
The Full Editions transfers business intelligence value
from the database to any development function which
has Italy as target.
Request the table of contents and order the Full Edition Report at italy@horwathhtl.com
10Contribution of tourism to economic growth
Travel and Tourism contribution to Italian GDP stands at 11%, ahead of European average. Estimates predict
it will reach 12% in 10 years. The growth of employment created will be even higher.
Key tourism impact figures for Italy, France, Spain and Europe (2016 – 2027); Source: WTTC, Travel &Tourism Economic Impact 2017.
(Direct and total contribution to employment expressed in employees)
2016 2017 2027
Europe
€bn % of total Growth €bn % of total Growth
Direct contribution to GDP 624.3 3.5% 2.8% 816.9 3.9% 2.4%
Total contribution to GDP 1,758 9.9% 2.6% 2,280 10.9% 2.4%
Direct contr.to employment 13,962,000 3.7% 2.4% 17,009,000 4.5% 1.7%
Total contr. to employment 36,030,000 9.7% 1.7% 42,451,000 11.3% 1.5%
Visitor exports 447.3 6.1% 5.3% 683.0 7.0% 3.8%
Italy 2016 2017 2027
(8th for T&T impact on GDP) €bn % of total Growth €bn % of total Growth
Direct contribution to GDP 77.3 4.6% 2.6% 93.8 5.1% 1.7%
Total contribution to GDP 186.1 11.1% 2.4% 219.9 11.9% 1.4%
Direct contr. to employment 1,246,000 5.5% 3.1% 1,595,000 6.7% 2.2%
Total contr. to employment 2,867,000 12.6% 2.6% 3,455,000 14.5% 1.6%
Visitor exports 37.2 7.5% 5.3% 47.8 7.7% 2%
France 2016 2017 2027
(6th for T&T impact on GDP) €bn % of total Growth €bn % of total Growth
Direct contribution to GDP 80.7 3.6% 1.9% 100.5 3.9% 2%
Total contribution to GDP 198.3 8.9% 1.8% 240.5 9.4% 1.8%
Direct contr. to employment 1,180,500 4.2% 1.6% 1,429,000 4.9% 1.8%
Total contr. to employment 2,791,000 9.9% 1.4% 3,238,000 11.0% 1.4%
Visitor exports 41.9 6.5% 3.1% 64.0 7.1% 4.0%
Spain 2016 2017 2027
(9th for T&T impact on GDP) €bn % of total Growth €bn % of total Growth
Direct contribution to GDP 57,1 5.1% 3.5% 72.1 5.5% 3.5%
Total contribution to GDP 159.9 14.2% 3.8% 196.5 15.0% 1.8%
Direct contr. to employment 862,000 4.7% 2.9% 1,016,000 5.2% 1.4%
Total contr. to employment 2,652,500 14.5% 3.0% 2,981,000 15.3% 0.9%
Visitor exports 58.9 16.1% 4.5% 78.5 15.1% 2.5%
Hotels & Chains in Italy 2018 © - 5th edition 11Contribution of tourism to economic growth
Direct contribution of T&T to GDP as a % of total for Italy, France and Spain (2016 – 2027); Source: WTTC, Travel &Tourism Economic
Impact 2017.
6.00%
5.00%
4.00%
3.00%
2.00%
1.00%
0.00%
Italy France Spain
2016 2027
Tourism and hospitality is one of the most impacting industry for the Italian economy and its contribution to GDP is the
more and more evident: in 2011 the T&T sector generated 8.6% of the Italian GDP, while in 2016 it generated 11.1%
and this figure is expected to grow by 2.2% yearly for the next 10 years, nearly achieving 12% in 2027 (based on WTTC
estimates, the contribution of this sector to GDP would reach 219.9 bn Euros in 2027, equal to 11.9% of GDP).
Compared to the 185 countries which WTTC analyses, in 2016 Italy ranks 8th for overall value generated by the sector,
equal to 207.6 bn $ (186.1 bn Euros). This ranking is headed by the USA (1,509.2 bn $), China (1,000.7 bn $) and
Germany (376.7 bn $).
The sector’s impact is relevant on country employment as well: approximately 1.3 employees each 10 are working in
tourism, a ratio which, within 2027, is expected to raise to 14.5%.
In 2016 tourist accommodations have hosted about 117 mln tourists, demonstrating a growth of 3.1% on 2015, a year
which indeed was particularly performing for the sector, thanks to the visibility provided by EXPO 2015.
International demand continues to grow and today represents 48.5% of arrivals and 49.5% of overnight stays (in 2007,
international arrivals represented 43.7% of total, while international overnight stays represented 43.3% of total). The
increase in foreign demand affects the tourism payments balance: according to WTTC, in 2017 tourism has generated in
Italy 7.5% of overall exports, a share destined to grow by 2.2% yearly, from now to 2027.
12 Hotels & Chains in Italy 2018 © - 5th editionItaly and the European arena
Italy accounts for the highest hotel portfolio in Europe, the third in the world. Hotel stock is declining slowly,
though. Spain and Italy, besides being ranked as top destinations for hotel arrivals in Europe, report the
highest shares of international demand.
Top 10 European countries by number of hotels and rooms (rooms: ‘000) (2016); source: processing of EUROSTAT data
1,091
952 916
656
413
291
137 140 158 121
33,166
33,061
19,524
18,424
12,366
9,987
6,022
4,949
3,965
3,585
Hotels Rooms
Hotels average size in rooms in Top 10 European countries (2016) ; source: processing of EUROSTAT data
Czech Republic 23
Austria 24
Switzerland 28
Germany 29
Italy 33
Netherlands 34
Media EU 36
France 36
Poland 40
Greece 41
Spain 47
Italy, the first hotel portfolio in Europe
With something more than 33,200 hotels and 1.1 mln rooms, in 2016 Italy accounted for the biggest hotel portfolio in
Europe, followed by Germany (33 thousand hotels) and Spain (19.5 thousand hotels).
For the first time Italy surpasses Germany on the number of hotels and rooms.
Hotels & Chains in Italy 2018 © - 5th edition 13Italy and the European arena
Top 10 European countries by number of overall overnight stays among residents and non residents (in Mln) (2016); source: processing
of EUROSTAT data
450
400
350
300
250
200
150
100
50
0
Spain France Italy Germany UK Austria Greece Netherlands Croatia Poland
Residents Non residents
Top 10 European countries by number of overall arrivals among residents and non residents (in Mln) (2016); source: processing of
EUROSTAT data
160
140
120
100
80
60
40
20
0
Germany France Spain Italy UK Netherlands Austria Poland Sweden Greece
Residents Non residents
According to the last edition of the UNWTO World Tourism Barometer1, global tourism demand has grown further in
2017: international arrivals have grown by 7% on 2016, the highest growth rate recorded during the last 7 years,
reaching quota 1,322 mln.
In 2017, international arrivals to Europe have grown to 671.1 mln, showing a 8.4% increase on the year before.
European destinations of the Mediterranean have significantly contributed to this performance, since they have
recorded over 1/3 of overall international arrivals to Europe (222.8 mln in 2017), an increase of 12.6% on 2016.
Indeed, Eurostat data, as of October 2017, confirm a growth of tourism demand in major European countries: total
arrivals to France have grown by 5.9% YTD, Spain by 4.5%, Italy by 4% and Germany by 3.8%.
In the same period, international demand has played a key role: France +8.3%, Spain +6.6%, Germany +5.1% and Italy
+4.7%. It is worthwhile to mention that, while international demand for Spain and Italy accounts for half of their overall
demand, Germany and France still highly rely on domestic flows.
The analysis of the top 10 ranked destinations in Europe for arrivals and overnight stays highlights controversial results,
depending on the parameter used: if we consider total arrivals, during 2017 (as of October) the ranking of the first 10
countries is headed by Germany (approx. 148.5 mln, +3.8% on 2016 YTD), France (147.8 mln, +5,9%) and Spain (115
mln, +4.5%). If we consider overnight stays, the first 3 countries are Spain (over 425 mln; +3,7% on 2016 YTD), followed
by France (approx. 395.3 mln, +6.7%) and Italy, (395.2 mln; +5,5%) who compete on a very short distance.
1UNWTO World Tourism Barometer, Volume 16, Jen. 2018
14 Hotels & Chains in Italy 2018 © - 5th editionA full cycle of hotel demand in Italy
Demand volumes firmly relaunched after 2014 stagnation. Bed-nights grow faster than arrivals, a sign of
increased stays in S&B destinations during 2015 and 2016. Midscale and Upscale demand made the core of
Italian most recent performance.
Hotel arrivals and overnight stays in Italy (2008-2016, Mln); source: processing of ISTAT data
95 270
90 265
260
85
255
80
250
75
245
70 240
65 235
2008 2009 2010 2011 2012 2013 2014 2015 2016
Arrivals Overnight stays
Hotel overnight stays distribution by scale in 2016 (Mln); source: processing of ISTAT data
Residence 8 11
Budget 2 2
Economy 6 9
Midscale 45 61
Upscale 63 50
Upper Up. & Luxury 8 3
0 20 40 60 80 100 120
Non residents Residents
Domestic demand for hotels completely recovered
Hotels explain 76.2% of arrivals and 65.6% of overnight In 2014 and especially during the end of the year, an
stays spent in the overall lodging supply of Italy. initial change of trend is finally recorded: arrivals grew by
Having a broader look at the years considered in the 1.9% on 2013 while bed-nights recorded a positive 0,1%.
charts, the effects of the economic crisis are more The growth consolidated in the following years, dragged
evident along the period 2012-2013: such crisis have by the demand from the foreign component, which
determined a drop in hotels in terms of both arrivals and substituted the domestic one. A recovery of domestic
bed-nights. demand will only appear during the last months of 2016.
Hotels & Chains in Italy 2018 © - 5th edition 15A full cycle of hotel demand in Italy
Hotel total arrivals change (YoY) by scale (2008-2016); source: processing of ISTAT data
15.0
10.0
5.0
0.0
-5.0
-10.0
09/08 10/09 11/10 12/11 13/12 14/13 15/14 16/15
Hotel International arrivals change (YoY) by scale (2008-2016); source: processing of ISTAT data
20.0
15.0
10.0
5.0
0.0
-5.0
-10.0
-15.0
09/08 10/09 11/10 12/11 13/12 14/13 15/14 16/15
Residence Budget Economy Midscale Upscale Upper Up. & Luxury
International demand attracted by the upscale and
Alternate paths in the market luxury segment
The analysis of the trend of different segments of The positive performance recorded by the high-end
demand, in the period 2008-2016, puts the light on scales are mostly attributable to foreign demand, who is
alternate patterns. the more and more oriented towards these segments: in
In the upscale and luxury segments demand grew the period 2008-2016 international arrivals to 4 and 5 star
steadily: even during the crisis period, though at reduced hotels have continuously grown and largely replaced the
pace, the positive trend did not stop. As opposite, the drop of domestic demand. As opposite, this switch didn’t
segment of 1 and 2 star hotels continued to suffer a take place for the lowest segments, for which the
constant decrease of arrivals, which didn’t arrest even shortfall of domestic demand summed up to that of the
after 2014, a year of generally positive results. In the foreign component.
period considered in the charts, these segments recorded Between 2008 and 2016 foreign arrivals to hotels grew by
a fall of demand, from 8.3 mln arrivals in 2008 to slightly 54,4%, while they fell by 22.3% in hotels in the 1 and 2
more than 6 mln arrivals in 2016; meanwhile 5 and 4 star star ranks.
hotels recorded a 41.3% growth of arrivals. If we consider the overnight stays composition by origin,
the year 2016 highlights a clear predominance of foreign
demand in 5 star properties: in this scale demand reached
74.5% of overall overnight stays (56% in 4 star hotels),
while hotels in the 2 and 1 star ranks only recorded nearly
41% of international overnight stays.
16 Hotels & Chains in Italy 2018 © - 5th editionA full cycle of hotel supply in Italy
A cycle of 10 years during which hotel stock is rejuvenating and changing direction to the Upscale and
Luxury segments. Residence supply is constantly growing. 1 and 2 star supply fast decline is paralleled by
the impressive growth of non-hotel lodging formulas.
Italian hotel supply by scale in the period 2007-2016 (var. % YoY); source: processing of ISTAT data
12.5
15.0
9.2
8.6
10.0 5.8
5.8
5.6
4.7
4.4
4.3
4.1
4.1
3.6
3.3
3.1
5.0
2.8
2.6
2.4
2.1
2.1
1.9
1.9
1.5
1.3
1.2
0.7
0.7
0.5
0.5
0.5
0.3
0.3
0.1
0.0
0.0
-0.0
-0.3
-1.3
-1.6
-1.6
-1.7
-2.1
-2.2
-2.2
-3.3
-5.0
-3.9
-4.0
-4.0
-4.3
-4.4
-4.5
-4.8
-5.9
-6.2
-6.5
-7.3
-10.0
08/07 09/08 10/09 11/10 12/11 13/12 14/13 15/14 16/15
Residence Budget Economy Midscale Upscale Upper Up. & Luxury
Italy hotel stock further modernized Italy, the first hotel portfolio in Europe
The modernization and restructuring of the Italian hotel With something more than 33,200 hotels and 1.1 mln
supply continues: further in 2016, we observe an increase rooms, in 2016 Italy accounted for the biggest hotel
within the 4 and 5 star segment – both in terms of hotels portfolio in Europe, followed by Germany (33 thousand
(+2.2%) and rooms (+1.7%), which is paralleled by a drop hotels) and Spain (19.5 thousand hotels).
in the supply of hotels in the 1 and 2 star segments (-2.2%
For the first time Italy surpasses Germany on the number
hotels and -2.5% rooms). Essentially, 3 star hotels have
of hotels and rooms.
not moved and remained 15.4 thousand (46.3% of overall
hotel supply). This segment continues to be, at least in For Italy, as for Germany, the ongoing trend of decreasing
terms of number, the most relevant component of the hotel supply can be essentially attributed to the
Italian hotel stock. repositioning of hospitality offer. It is hard to benchmark
In the period 2007-2016, 4 and 5 star hotels have moved these countries with others, due to very incomparable
from 4.5 to 6.2 thousand, while in the same period the hotel rating systems, which is even, for some countries,
number of hotels in the 1 and 2 star segments have based on voluntary assessment.
decreased from 12 to nearly 9 thousand.
But, limiting the analysis on total hotels figures, a
common trend can be found (with the exception of
France): the total hotel supply for the 9 considered
countries continued to fall by -0.3% in the period
between 2007 and 2016, while the rooms stock, after
nine years of continued growth, suffers a first drop.
It is worth to underline that Germany, the first country in
Europe for hotel stock up to 2015, has lost approx. 3
thousand hotels, of which 3/4 in the last 5 years.
Hotels & Chains in Italy 2018 © - 5th edition 17A full cycle of hotel supply in Italy
Non-hotel supply in Italy in 2016; source: processing of ISTAT data
Campings
2%
B&B
22%
Other
accommodation
5%
Holiday houses
2% Rentings
56%
Farmhouses
13%
The presented hotel supply trends are paralleled, in Italy, by an explosion of other alternative forms of lodging: after
years of stability, between 2014 and 2015 the non-hotel supply has grown by 7.5% and by an additional 8% between
2015 and 2016. In 2016 the number of non-hotel lodging units rises to 145 thousand, a figure which is equal to 4.4 times
the number of hotel units.
The sharing economy lodging supply adds up to the former mentioned: according to a recent research by AirDNA, a
company which tracks the business of short stay rentals internationally, in September 2017 over 318 thousand
apartments were active on-line in Italy, demonstrating a growth of 22% on the year before.
These figures make Italy the second destination in Europe, after France, in the top ten rank for the number of
apartments proposed on-line.
It is a business which, for business model (64% of on-line promoted apartments belongs to multiple owners), price
range (130 Euros on average, +15% on 2016) and booking processes, stands in very strict competition with the hotel
industry.
18 Hotels & Chains in Italy 2018 © - 5th editionRecent trends & performances
The Italian summer peaks the highest attractiveness in Europe in 2017. July and August volumes surpass
Spain’s ones. Leisure demand highly prevails.
Monthly distribution of overnight stays (Mln) in hotels in top 5 Countries in Europe in 2017; source: processing of EUROSTAT data, Dec
based on 2016 data
50
40
30
20
10
0
Jan Feb Mar Apr May Jun Jul Aug Sep Oct Nov Dec*
Germany Spain France Italy United Kingdom
Overnight stays % change Nov YTD 2016/2017 ; source: processing of EUROSTAT data
+2.9% +2.8% +5.1% +5.8% +8.4%
Italy and Spain on the edge of global attractiveness in 2017
Recent Eurostat data (As of November 2017, December is based on 2016 figures) witness the 2017 momentum for both
Spain and Italy on global markets. Last year the bed-nights recorded in Italy during July and August peaked over the bed-
nights recorded in the rest of European countries, totalling nearly 50 mln in a month only.
Italian tourism volumes are yet too concentrated on summer, when the domestic component emerges and complement
the international one.
As we argued last year, the lack of international big events, trade fairs and exhibitions, together with the reduced appeal
of our business environment (with the exclusion of some top business hubs) may explain the lower performance of
April, May October and November, especially if compared to Germany.
*Dec 2017 based on 2016 data
Hotels & Chains in Italy 2018 © - 5th edition 19Recent trends & performances
Milan continues to grow after EXPO 2015 demonstrating solid demand fundamentals. The city runs its
sustained growth together with Lisbon, Warsaw and Prague, all recording a double digit RevPAR increase on
2016.
OR, ADR, RevPAR for selected european destinations in 2017 and percentage
change over 2016; source: processing of STR data.
Occupancy Rate (%), 2017 2017: Rome hotels maintain unchanged
8.0%
84
5.4% 0.1 sales volumes
3.8% 4.2%
82 2.5% 0.05According
80 -0.3% -0.1% 0.7% to STR Global data covering the
0.3%
78 0 Rome hotel panel, OR in 2017 was
76 maintained at a stable 70.1%, close to the
-0.05
81.7
Milan panel (70.6%).
80.1
74
78.8
77.6 -0.1Compared to a set of selected top capital
76.7
76.7
72
73.6
70 cities for tourism in Europe, as presented in
70.6
70.1
-0.15
68
the chart, these ratios are the lowest
66 -0.2
recorded.
Lisbon
Rome
Paris
Barcelona
Warsaw
Milan
London
Berlin
Prague
% Change
ADR (€), 2017 Europe: Lisbon panel records a successful
0.2
year for imposing higher rates
17.1%
230
11.6% 0.15The counterpart of lower OR is for both
8.2% 8.0% 0.1 Rome and Milan a high positioned ADR.
180
2.7% 2.3% -0.1% 1.8% 0.05Comparable to Barcelona but yet lower than
130
0 Paris and London, the two Italian cities
-1.9% -0.05recorded respectively 149 and 139 Euros
170
234
149
143
139
-0.1 ADR as overall 2017. A stable performance if
116
80
96
88
-0.15compared to 2016.
75
30 -0.2 Among the European magnets, Lisbon panel
Lisbon
Rome
Paris
Barcelona
Warsaw
Milan
London
Berlin
Prague
of hotels outperformed, with an increase on
2016 of over +17%.
% Change
RevPAR (€), 2017 Milan demonstrates solid market
22.0% fundamentals despite questionable
14.4% 0.2 increased capacity
12.3% 9.9%
8.2% 7.9%
0.1
2.0% 0.6% Milan, after all and after EXPO 2015, grows
-1.7% 0 on 2016, by almost 10% in terms of RevPAR,
172
a performance which explains the solidness
139
-0.1
110
of its market mix fundamentals.
104
98
90
-0.2During the same year, the Rome panel
74
70
59
accounted for stable revenues per available
-0.3
room.
London
Paris
Warsaw
Lisbon
Berlin
Prague
Rome
Barcelona
Milan
% Change
20 Hotels & Chains in Italy 2018 © - 5th editionHOTEL CHAINS IN ITALY HOTEL CHAINS IN ITALY Chain’s growth and Europe 24 Key evidences from 2017 26 Chain Hotels by number and size – 5 years 28 Chain Hotels by scale 30 Chains by type of destination 32 Chains’ footprint 34 Focus: Chains’ footprint in Lombardy 35 Chains’ footprint growth 2013-2017 36 Business models 38 Top 30 Chains and Brands in 2017 40 Top 20 Brands by business model in 2017 41 Top 20 Brands by scale in 2017 43 Top 10 Brands by destination type 45 Hotel chains growing in 2017 47 Italian chains’ international footprint 48 Pipeline by scale 50 Pipeline, re-branding and destinations 51 Brands’ Country of origin 52 2020 competitive landscape for chains 53 Hotels & Chains in Bologna 54 Hotels & Chains in Genoa 56 Hotels & Chains in Matera 58 Hotels & Chains in Naples 60 Hotels & Chains in Turin 62
Chain’s growth and Europe
There are no strides in chains’ presence in the map of the mature European destinations, with the
exception of a sparkling Germany. Cyprus, Croatia and Spain account for the biggest branded resorts in the
Mediterranean Europe in 2017.

Number of chains’ hotels and chains penetration by hotel in selected European Countries (2017); source: Horwath HTL Italy and other
                                                          European offices

                             3,538

                   8.5%

20.8%                                           17.7%                     2,065
                                                          620                                                13.7%
         171                                                                          10.3%                            317

                                                 3,819

                                                                                                      2.9%
                                                                             6.2%                                             12.5%
                                        21%                                                360
                                                                                                                134
                                                                  276
                                                                                                 24.4%
                                                                                                          167

                        2,351
                                                                                  4.5%
                                                                                            1,488
         12.1%                                                                                                                      1.4%

                                                                                                                       10

Not all country figures are updated to 2018. The Hotels & Chains Report 2017 wrongly reported 5,500 hotels for Spain. The correct
figure is the one reported in this map, 2,351 hotels for 12.1% of hotel penetration.
Hotels & Chains in Italy 2018 © - 5th edition                    23
Chain’s growth and Europe
Number of brands in selected European countries (as of April 2017; Italy as of 31st December 2017); source: Horwath HTL Italy and
other European offices
240
227
180
135
83 82
72
61 58
44
32
20
4
Average size of chain hotels and overall hotel stock in selected European countries (as of April 2017; Italy as of 31st December 2017);
source: Horwath HTL Italy and other European offices
760
Chain hotels Overall hotel stock
162
149
145
139
131
117
117
110
106
104
85
81
70
57
51
47
40
36
33
32
29
24
16
The European Chains Report, edited by Horwath HTL in April 2017, confirmed chains’ penetration in Italy (4.5% by
hotels) is modest when compared to France (21%), Spain (12.1%), Germany (10.3%). UK (8.5%) figures are pretty
uncertain, due to the lack of an official statistical coverage of hotel population in the country.
It is interesting to note that chains develop differently along Europe, as demonstrated by data on the size of hotels: it
would seem very often big S&B resorts in Croatia and Spain, franchised city hotels in UK and France.
Chain hotels are always much bigger than the average of countries’ hotel populations: over 3 times bigger in
Netherland, Italy, Switzerland and Austria.
During 2017 chains have expanded especially in Germany (+ 125 hotels), in Switzerland, with a major increase of 58
hotels, in Albania, with additional 5 properties and further expanding in 2019 with more than a couple of big pipeline in
the country.
24 Hotels & Chains in Italy 2018 © - 5th editionKey evidences from 2017
Chains’ growth in the country follows a steady pace. The recorded 5 year net growth stands at +45 hotels
per year. Penetration rate reaches 15% of rooms and 4.5% of hotels. The overall number of corporate
brands on the market is impressive: 227.
Key Evidences from the Horwath HTL 2017 Census of Chains’ Hotels in Italy
Key evidences of the last 5 years Growth % Growth %
census 2013 2014 2015 20163 2017 2017 vs 2017 vs
(Horwath HTL Italy) 2016 2013
Chains Hotels 1,308 1,330 1,360 1,424 1,488 4.5% 13.8%
Italian Hotels Stock (overall supply) 33,728 33,316 33,290 33,199 33,166 -0.1% -1.7%
Chain penetration % by Hotels 3.9% 4.0% 4.1% 4.3% 4.5% 4.6% 15.7%
Chains Rooms 143,968 144,956 148,963 158,043 164,196 3.9% 14.1%
Italian Rooms Stock (overall supply) 1,093,286 1,089,770 1,090,300 1,091,569 1,091,061 0.0% -0.2%
Chain penetration % by Keys 13.2% 13.3% 13.7% 14.5% 15.0% 3.9% 14.3%
Average Size per Chain Hotel in Rooms 110 109 110 111 110 -0.6% 0.3%
Average Size per Hotel in rooms 32.4 32.7 32.8 32.9 32.9 0.1% 1.5%
Total number of brands 148 170 196 207 227 9.7% 53.4%
Domestic Brands 87 98 110 127 137 7.9% 57.5%
International Brands 61 72 86 80 90 12.5% 47.5%
International Chains Hotels IDC 516 515 537 515 523 1.6% 1.4%
Domestic Chains Hotels IDC 860 882 890 974 1,034 6.2% 20.2%
International Chains Keys IDC 64,260 62,945 66,042 64,597 65,965 2.1% 2.7%
Domestic Chains Keys IDC 88,231 90,809 90,637 102,904 107,881 4.8% 22.3%
Top 10 Chain Groups (by Hotels) total
488 487 523 520 525 1.0% 7.6%
Hotels
Top 10 Chain Groups (by Rooms) total
63,078 61,964 62,848 66,475 66,662 0.3% 5.7%
Rooms
Top 10 Chain Groups Hotels % 37% 38% 42% 41% -3.5%
Top 10 Chain Groups Rooms % 43% 42% 37% 35% -3.4%
The 5th edition of the Report unveils several interesting truths about hotel chains in Italy, among which the most clear is
the unrested growth of their footprint.
Since the beginning of this census, last year (2016) and this year (2017) were the greatest net growth recorded, with
over 60 hotels and about 8 to 10 thousand rooms added per year.
Taking into account that greenfield projects are very rare in the country, these are figures accounted mostly among
branding deals, conversions from residential or office former use, relaunches.
While the number of brands with a least one flag in the country expands, the concentration among top players has not
increased significantly, indicating that the hospitality market is vibrant and not yet definitively consolidated.
32016 data reviewed in 2017.
Hotels & Chains in Italy 2018 © - 5th edition 25Key evidences from 2017
2017 New Entry chain Hotels with more than 200 keys, Horwath HTL 2017
Hotel Brand Group Scale Keys Location Region Project Type
Garden Calabria VALTUR VALTUR Upscale 580 Curinga CALABRIA Branding
Gioiosa
Hotel Capo Calavà TH RESORTS TH RESORTS Midscale 320 SICILIA Re-branding
Marea
A&O HOTELS & A&O HOTELS & Venice
AO Venedig Mestre Economy 319 VENETO Greenfield
HOSTELS HOSTELS Mestre
NYX HOTELS by
NYX Milan FATTAL Upscale 300 Milan LOMBARDIA Conversion
LEONARDO HOTELS
Villaggio Olimpico TH RESORTS TH RESORTS Upscale 295 Sestriere PIEMONTE Branding
Le Meridien Visconti MARRIOTT
LE MERIDIEN Upscale 240 Rome LAZIO Branding
Rome INTERNATIONAL
GRUPPO STUDIO Quartu S.
Sighientu Hotel & Spa STUDIO VACANZE Upscale 220 SARDEGNA Re-branding
VACANZE Elena
Hilton Garden Inn HNH HOTELS & Somma
GARDEN INN Upscale 207 LOMBARDIA Operator change
Milan Malpensa RESORTS Lombardo
Sheraton Donnafugata MARRIOTT Upper Up. &
SHERATON 202 Ragusa SICILIA Re-branding
Golf Resort INTERNATIONAL Luxury
Among them the year 2017 saw the entrance of some Have we finally reached our physiologic threshold with a
very big properties, such as the Garden Calabria by Valtur, room penetration rate of 15%, then? Some signs indicate
the Hotel Capo Calavà by TH Resorts, the A&O Venedig the answer should be “not yet”. Indeed, the pipeline we
Mestre by A&O, the Nyx Milan by Leonardo Hotels, all have recorded for projects in 2018-2020 accounts for over
over 300 rooms each, and many others. Overall 9 12,700 rooms and over 90 hotels. More projects will be
properties sized over 200 rooms entered the census in disclosed during the year 2018. Given the natural turn-
2017. over of branded and de-branded hotels it should turn out
to be a chain portfolio of around 175.000 rooms and
Nevertheless, the size of chain hotels remains stable and
1,600 hotels by 2020.
stick to 110 rooms, indicating that also small gems in the
center of art cities were still a target in 2017: The First In addition, we may assume that both the sentiment of
Hotel Rome by The Pavilions Hotels – Rome 29 rooms, optimism generated by impressive tourism performances
Venice Times Hotels by Mood Hotels – Venice 33 rooms, (2015-2017) and the massive amount of NPL hotels have
and many others. instilled in the investment funds a switch in their outlook
for hospitality from “watch” to “buy”. Investment funds
will be very active in 2018 and 2019 and this will facilitate
and accelerate chains growth for obvious reasons.
26 Hotels & Chains in Italy 2018 © - 5th editionChain Hotels by number and size – 5 years
The overall average size of chain hotels in Italy is about 110 rooms. It has not changed in years. International
chains hotels are bigger in all segments. Penetration rates vary significantly along scales, reaching 51% (by
rooms) in the Upper Upscale & Luxury segment.
Hotels overall average size among Domestic and International chains and by scale; Horwath HTL 2017
123
107
81
51
131.1
124.1
125.8
125.1
119.1
110.3
104.2
102.9
95.4
71.5
35.3
International
Domestic
Overall Chains
Economy Midscale Upscale Upper Up. & Luxury
Domestic International Overall chains
Chains’ hotels distribution among International, Domestic and Second Tiers; Horwath HTL 2017
Domestic International 29.7%
66% 33.6%
3.9% With Second Tier
Operators
Development in the Economy segment: a different
Domestic chains prevail in the Italian market approach
We replicate what we argued about the 2016 census, The historic difference between the size of international
saying there is few new under the sun about the chains and domestic chains hotels remains visible and
composition of corporate governance in the country even augment.
environment of “chained” hotels: 2/3 of the chains hotel Especially in the Economy segment there seems to be a
portfolio belongs to domestic chains. different approach to hotel development. International
International chains, including hotels branded but operators seek economies of scale with projects over 125
managed by second tier operators (or white label, usually rooms, while domestic operators still keep very small
domestic) cover 34% of the Italian chained portfolio, a properties within their portfolio. This significant
rate which is somehow stable in years or even difference may be originated by domestic operators
diminishing. initial approach to development and their initial family
core base of assets.
Hotels & Chains in Italy 2018 © - 5th edition 27Chain Hotels by number and size – 5 years
Italian hotels portfolio by scale in 2016 and chains penetration rate by rooms (%); Horwath HTL 2017, ISTAT 2016
51.1%
15,355
Italian hotel supply
Chains penetration by rooms, %
32.1%
5,911 5,726
5.8%
0.9%
2,853 2,861
460
Residence Budget Economy Midscale Upscale Upper Up. &
Luxury
Chains penetration rate (by rooms) by scale in the last 5 years ; Horwath HTL 2013-2017
55.0% 51.1%
50.0%
45.0%
40.0%
35.0% 32.1%
30.0% 28.0%
25.0%
20.0% 15.8%
15.0%
10.0% 5.8%
5.0% 0.2% 0.9% 1.6%
0.0%
Economy Midscale Upscale Upper Up. & Luxury
2013 2014 2015 2016 2017
More chains than independent hotels in the 5 star rank, ...and growing
Hotel chains penetration in Italy has grown in the last 5 years. At the end of the year the overall penetration rate is 15%
in terms of rooms and 4.5% in terms of hotels. Especially in the 4 and 5 star segments, since 2014, there has been a
consistent increase in the number of hotels managed or branded by a chain.
More than 1 hotel each 2 in the 5 star rank is a chain property, branded or managed. 1 each 3 in the 4 star segment.
Midscale recorded a steady growth of brands also, while in the Economy segment the absolute growth of chains hotels
is weak, though tangible.
28 Hotels & Chains in Italy 2018 © - 5th editionChain Hotels by scale
The upscale tier attracts over a hundred brands while chains presence in the economy scale is still very
limited, probably due to the lack of greenfield projects available on the market.
Chains’ hotels and brands distribution among Int.l and Dom.c chains and by scale; Horwath HTL 2017
180
International
668
Domestic
N. of brands
90
77
294
240
16
101 99
63
19
4
Economy Midscale Upscale Upper Up. & Luxury
Number of brand distribution among Int.l and Dom.c chains and by scale; Horwath HTL 2017
180
170
153
131
83 90
80
70
66 73 77
71
12 16
7 8
2014 2015 2016 rev 2017
Economy Midscale Upscale Upper Up. & Luxury
180 brands over 4 star hotels, only 16 on the Economy scale
The distribution of chains’ presence revealed by the 2017 census clearly explains current competitive environment for
Italy: the attractive and performing scales, Upscale and Luxury, are recording a growing crowd of brands. But while
penetration of new flags is slow in the Luxury tier, it has been very fast in the Upscale. Indeed, the majority of brands
continues to be concentrated on affiliating 4 star properties.
There are 90 brands operating in the Luxury tier, but yet a limited presence in the Budget and Economy scale.
Nevertheless, the growth of brands in such categories is a clear sign for the future: branded low priced hotels will grow
in Italy, even though current lack of greenfield projects still holds back this development.
It is worth to clarify that one brand covers more than 1 scale when it brands/operates hotels belonging to different star categories
Hotels & Chains in Italy 2018 © - 5th edition 29Chain Hotels by scale
Chains’ rooms growth and CAGR by scale; Horwath HTL 2013-2017
+30% +3% +3% +7%
118,140
115,248
106,328
27,559
25,928
24,156
17,324
13,078
16,111
1,173
406 756
Economy Midscale Upscale Upper Up. & Luxury
2013 2014 2015 2016 2017
5 years of growth for branded rooms in the Economy scale
Observing chains in their last 5 years in Italy provides a privileged point of view on segments’ perspectives.
As mentioned, there is, and will be, a wide space for growth in the Economy scale which already demonstrated a strong
increase YoY, with a CAGR of 30% in the last 5 years. Despite the need for efficient and modular structures, which can
be guaranteed most often by greenfield projects, conversions from offices or other asset class, in the second circles of
gateways cities, may be, in the next future, the most frequent development case for new Economy branded hotels.
The two extremes, the low cost segment and the highest segment, are growing the most in the period considered.
Midscale and Upscale segments have recorded the same compound growth in the period, but resulting in different
room volumes and penetration rates.
2016 and 2017 are the years where the highest absolute growth of chain room stock was recorded, respectively circa 10
and 8 thousand rooms of yearly increase. These figures were mostly explained by the Upscale segment.
30 Hotels & Chains in Italy 2018 © - 5th editionChains by type of destination
Out of the top 4 chains’ cities, development growth in the last 5 years appears very modest, with the
exceptions of Budoni where we recorded the growth of local groups. Rome and Milan recorded the highest
increase in 2017, for over 1 thousand rooms each.
Top 10 destinations by chain rooms in 2017; Horwath HTL 2017
Rooms Hotels Hotels Hotels Hotels Hotels
Rank Destination
2017 2017 2016* 2015 2014 2013
1 ROME 20,167 175 168 149 151 146
2 MILAN 14,924 115 108 116 127 123
3 VENICE 5,257 54 55 51 49 46
4 FLORENCE 4,627 60 58 62 59 58
5 BOLOGNA 3,188 24 23 23 26 27
6 NAPLES 2,354 16 15 15 16 16
7 TURIN 2,337 21 23 23 26 24
8 GENOA 2,039 19 19 20 19 21
9 BUDONI 1,924 11 12 6 6 6
10 TAORMINA 1,786 14 13 14 12 12
Distribution of chains’ hotels among regions; Horwath Top 10 destinations for new chain rooms in 2017;
HTL 2017 Horwath HTL 2017
Lombardy
220 Rank Destination New Rooms New Hotels
Rest of Italy
15%
396
27% 1 ROME 1,093 14
2 MILAN 1,036 11
194
Latium 3 CURINGA 580 1
13%
4 VENICE 520 3
5 DOMUS DE MARIA 423 1
87
6% 6 GIOIOSA MAREA 320 1
Sicily 170
7 SESTRIERE 295 1
118 11%
8% Veneto 8 SAN TEODORO 250 2
Sardinia 137 166 9 TURIN 242 2
9% 11%
10 MILANO MARITTIMA 235 3
Tuscany Emilia-Romagna
*2016 data reviewed in 2017.
Hotels & Chains in Italy 2018 © - 5th edition 31Chains by type of destination
Distribution of chains’ hotels among Dom.c and Int.l by type of destination and average size; Horwath HTL 2017
175
374
116 121
107 108
96
84
236
183
167
147 155
64 77
27 24
4 13 15 2
Art & Business Golf Other Ski Sun & Thermal
Business Focus Leisure Beach
International Domestic Avg. Size
Average size of chains’ hotels by scale in the first 5 destinations in Italy ; Horwath HTL 2017
Upper
Avg.
Destination Economy Midscale Upscale Upscale &
Destination
Luxury
ROME 28.3 69.8 128.6 129.4 115.2
MILAN 52.5 108.1 136.9 129.6 129.8
VENICE 174.0 32.4 94.4 127.7 97.4
FLORENCE 58.5 85.7 71.2 77.1
BOLOGNA 89.0 143.3 109.0 132.8
S&B and golf resorts the biggest chains’ properties
The 17 golf resorts we have counted in the branded population of hotels in 2017 are very big on average, 175 rooms,
bigger than S&B resorts (121 rooms).
The analysis by geography shows S&B destinations are by far those concentrating the most of hotels, the majority of
which under domestic brands. Art & Business cities are the second most relevant magnets attracting chains.
Interesting to note that Business focus destinations record more international chains than domestic, which might be
explained by the ease of expansion of USA chains in these environments, where their ability to make an impact (in
franchising / management) is highly recognized and sought after.
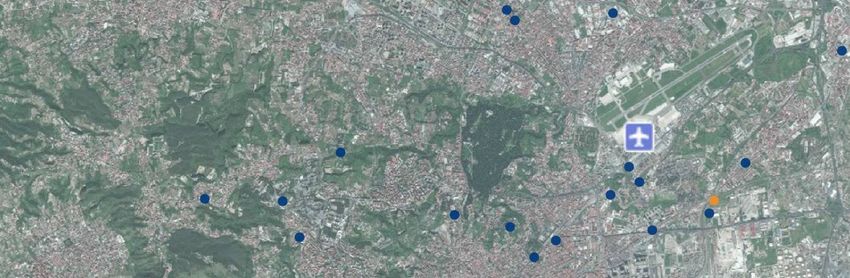
32 Hotels & Chains in Italy 2018 © - 5th editionChains’ footprint
Art cities, industrial and business clusters, S&B Riviera and lifestyle retreats are the magnets which make
hotel chains concentrate on certain areas of the countries. Nevertheless, with limited exceptions, chains
cover the overall provinces of Italy.
Distribution of chains’ rooms among
regions of Italy and chains’ hotels
geolocation; Horwath HTL 2017
Hotels & Chains in Italy 2018 © - 5th edition 33Focus: Chains’ footprint in Lombardy
34 Hotels & Chains in Italy 2018 © - 5th editionChains’ footprint growth 2013-2017
With the exception of Florence, who records a negative trend, most destinations accounted for a net
growth of chains presence in the last 5 years. Rome: over 1.5 thousand rooms. Venice and Verona over 700
rooms. Milan: over 600 rooms. San Teodoro: over 500 rooms.
Chains’ rooms and hotels net variation in 2017 over 2013 for a selection of Italian destinations; Horwath HTL 2017
+2
Var. n. Hotels
Trento +159
+11 +1 Var. n. Rooms
Milan +8 +1 Trieste
-2 Verona +78
+660 Venice
+702 +729
Turin
-14
+152
-2 +1 Bologna
Genoa
+1 -341 Rimini +8
-2
Sanremo +185
Florence
+83
-420
+32
Rome
+1,578 +2
+2 Bari
+4
+143
Naples
San Teodoro
+183 +2
+574
Otranto
+436
0 +1
Cagliari Isola Capo Rizzuto
0 +298
0
Palermo +2
+9 Taormina
+231
Hotels & Chains in Italy 2018 © - 5th edition 35You can also read