Supply chain control towers: Technology push or market pull-An assessment tool
←
→
Page content transcription
If your browser does not render page correctly, please read the page content below
Received: 2 March 2021

DOI: 10.1049/cim2.12040
                         - -Revised: 9 August 2021

O R I G I N A L R E S E A R C H PA P E R
                                                        Accepted: 11 August 2021

                                                                                              -   IET Collaborative Intelligent Manufacturing

Supply chain control towers: Technology push or market
pull—An assessment tool

John Patsavellas1                      | Rashmeet Kaur2                            | Konstantinos Salonitis1

1
 School of Aerospace, Transport and Manufacturing,       Abstract
Cranfield University, Cranfield, UK
                                                         As digital technology and connectivity advance rapidly, the premise of bringing supply
2
 Munjal Institute for Global Manufacturing, Indian       chain (SC) visibility across multiple tiers of supply, whilst facilitating the velocity to
School of Business, Hyderabad, India
                                                         achieve strategic business objectives, is gaining interest. The feasibility and timing for
Correspondence
                                                         successful adoption and implementation of such technology depend primarily on the
John Patsavellas, School of Aerospace, Transport         readiness level and specific needs of each organisation, making it imperative to exercise
and Manufacturing, Cranfield University, Cranfield,      insightful judgement as it can be expensive to acquire, develop and master. This research
Bedfordshire, MK43 0AL, UK.                              study examines the market pull versus technology push components of the functionalities
Email: john.patsavellas@cranfield.ac.uk
                                                         enabled by digital SC control towers and buildings on the outcome of an extensive survey
                                                         and expert interviews and proposes an assessment tool to aid decision making for the
                                                         consideration of their adoption.

                                                         KEYWORDS
                                                         computer integrated manufacturing, decision making, manufacturing industries, manufacturing systems, supply
                                                         chain control towers

1 | INTRODUCTION                                                                           management [3]. This has given rise to an increasing interest
                                                                                           for ‘Digital Twins’, that is, computerised models that represent
The Fourth Industrial Revolution (4IR)—characterised by the                                actual physical objects and processes in real time [4].
promise of fusing the digital, biological, and physical worlds                                 In contrast to the increasing hype around 4IR tools such as
through the growing utilisation of digital technologies, such as                           digital twins and SC control tower (SCCT), the on‐the‐ground
artificial intelligence (AI), cloud computing, robotics, 3D                                end‐to‐end (E2E) use cases are still very few and in a nascent
printing, the Internet of things (IoT), and advanced wireless                              phase. There is a need for a richer understanding among
connectivity—has ushered in a new era of economic disrup-                                  investing organisations regarding which 4IR technology tools
tion. Industry 4.0 is a trending term for the ongoing trans-                               should be combined and adapted for different parts of their
formation of manufacturing and supply chain networks                                       value chain. While there has recently been a lot of publicity
(SCNs). As part of Industry 4.0, the IoT enables manufacturers                             around the possibilities digital transformation brings into SCs,
to harness digitally connected, smart, and decentralised value                             the adoption of advanced digital technology is still low
chains so as to deliver greater competitiveness by acquiring the                           notwithstanding the blurred lines and overlapping features of
capability to respond and evolve as business conditions change                             many such digital tools. For adoption of any technology, or-
over time [1].                                                                             ganisations need to clearly understand the value proposition
     In the dynamic world of global manufacturing, 4IR tech-                               and innovation advantages as well as the deployment re-
nologies could facilitate the implementation of cyber‐physical                             quirements and readiness for implementation, so they can
integration across the borders of an organisation, deep into                               ascertain credible benefits that translate to compelling return
its supply chain (SC) [2]. To that end, digital inter‐connectivity                         on investment (ROI) [5]. Therefore, some important questions
and data analytics capabilities can be used to provide real‐time                           that organisations should ask before investing or even
supply‐demand scenario planning and dynamic exception                                      considering digital SC technologies are as follows:

      -
This is an open access article under the terms of the Creative Commons Attribution‐NonCommercial‐NoDerivs License, which permits use and distribution in any medium, provided the
original work is properly cited, the use is non‐commercial and no modifications or adaptations are made.
© 2021 The Authors. IET Collaborative Intelligent Manufacturing published by John Wiley & Sons Ltd on behalf of The Institution of Engineering and Technology.

290        IET Collab. Intell. Manuf. 2021;3:290–302.                                                                                         wileyonlinelibrary.com/journal/cim2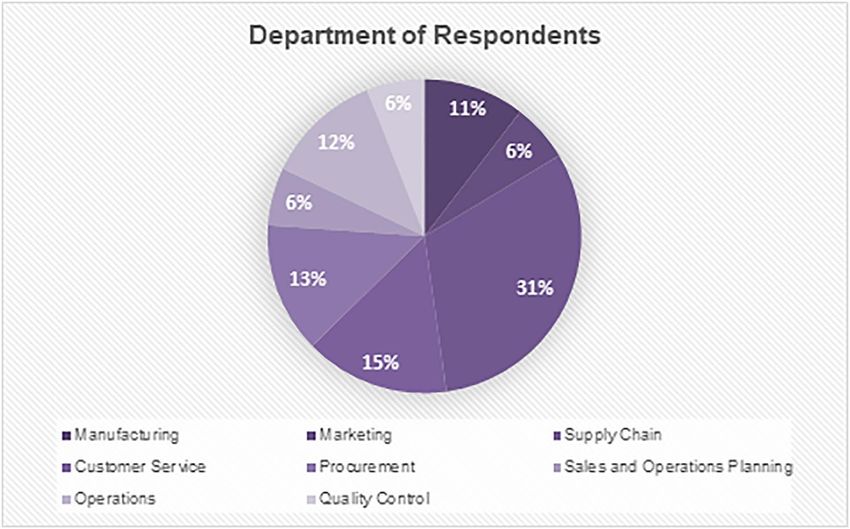
PATSAVELLAS     ET AL.
                                                                                                                                                              -   291

� What extra functionalities and advantages can the new                        cross‐organisational SC partners. Such SCCT hubs aggregate,
  technology unlock in supply chains?                                          correlate and distribute information for early detection of risks
� How and to what level does it optimise product, cash and                     and opportunities, providing so called ‘3M functionality’:
  information flows?                                                           Monitor, Measure and Manage.
� How can we assess our maturity and readiness for this                             Supply chain control tower can bring together organisa-
  technology investment?                                                       tions (people), systems, and processes to power high product
� What may be the best approach and timing for acquiring it?                   and process visibility through the value chain and easily con-
                                                                               nect the three types of goals of an organisation's SC, which are
     These questions are fundamental when considering the                      design, planning and management as shown in Figure 1.
‘Technology Push’ versus ‘Market Pull’ trade‐off concept.                           End‐to‐end SC visibility is a need that SCCTs can practically
Technology push is a new technological invention that is                       fulfil, acting as an inter‐organisational coordinating platform.
actively promoted through persistent sales and marketing ac-                   Such visible coordination is a catalyst for collaboration between
tivities, pushing the market for its adoption frequently without               all the stakeholders of an SC, which is an inherently tricky
considering whether or not it is fully mature, scalable, or able               concept fraught with the fears of asymmetry in relational power
to satisfy users' needs [6].                                                   and ‘leaks’ of proprietary information. Whether suppliers
     ‘Market pull’ is the scenario in which markets demand a                   cooperate with clients or not, depends to a great extent on the
specific product (or service) type or define an unmet need and                 nature and appeal of the collaborative mechanism. Despite the
producers respond by developing, producing, and delivering it.                 challenges, the value of pursuing collaborative vendor‐managed
A pertinent example is the life‐sciences industry's response in                replenishment programs has stood the test of time. Supply chain
2020–2021 to the need for an effective vaccine in combating                    collaboration can reduce bullwhip effect costs as well as overall
the SARS‐CoV‐2 virus pandemic, which gave rise to the cre-                     inventory and administrative costs for the whole chain. Retailers
ation, testing, licencing, and manufacturing of a number of                    can maintain operations without interruption, while upstream
different vaccines in record time‐to‐market.                                   suppliers can build loyalty and reduce costs through information
     This research work aimed to provide a structured approach                 sharing. Over time, inventory and labour costs are reduced
in assessing an organisation's state of readiness and re-                      which means suppliers can retain customers while reducing
quirements with regards to the utility of SCCT technology                      costs. Thus, it is important to gain a deeper understanding of
adoption and to offer a reflective approach on its imple-                      SCCT implementation issues, which could also be relevant to
mentation in order to enable better decision making by                         the research of how the benefits from collaboration may be
considering the technology push and a market pull factors.                     shared among SC members [8].
     The overall flow of the research work has been summarised                      At each SC goal level SCCT can bring different function-
in Table 1.                                                                    alities and benefits that can be grouped under the three broad
                                                                               categories of ‘See‐Plan‐Act’ as in Figure 2.

2 | SUPPLY CHAIN CONTROL TOWER–
CONCEPT NOTE                                                                   2.1 | See
Conceptually, a SCCT is a shared‐service centre that, like the                 � B2B Integration: Supply chain control tower can bring
digital twin of a traffic control tower, offers real‐time moni-                  together all the trading partners of the nucleus organisation,
toring of the status and performance of E2E activities in SCs                    making possible the smooth sharing of information in real
that extend beyond the boundaries of the nucleus organisation                    time, thus minimising the potential of any bullwhip effects
[7]. Supply chain control tower can therefore constitute a 4IR                   in the supply‐demand flow.
digital information hub serving as the ‘single access point of                 � End‐to‐End Mapping: Supply chain control tower are
truth’ for all decision makers, planners, buying teams and                       rooted on accurate mapping of the entire SCN which aids

TABLE 1           Overall flow of research work

 The structural flow of work
 Supply chain control towers                               Concept note, functionalities, benefits and barriers in implementation

 Literature review                                         Theoretical sensitivity around SC visibility, transparency, resilience, and agility to ascertain
                                                              technology push and market pull influences

 Assessment tool discussion                                Detailed discussion on the proposed SCCT adoption assessment tool. This section delves into
                                                              the evaluation of requirements, readiness, and SC maturity—that constitute the elements of
                                                              assessment tool

 Methodology                                               Detailed discussion on the methodology that was used to create the assessment tool. It focuses
                                                              on the step by step approach used to develop every element of the proposed assessment tool

Abbreviations: SC, supply chain; SCCT, SC control tower.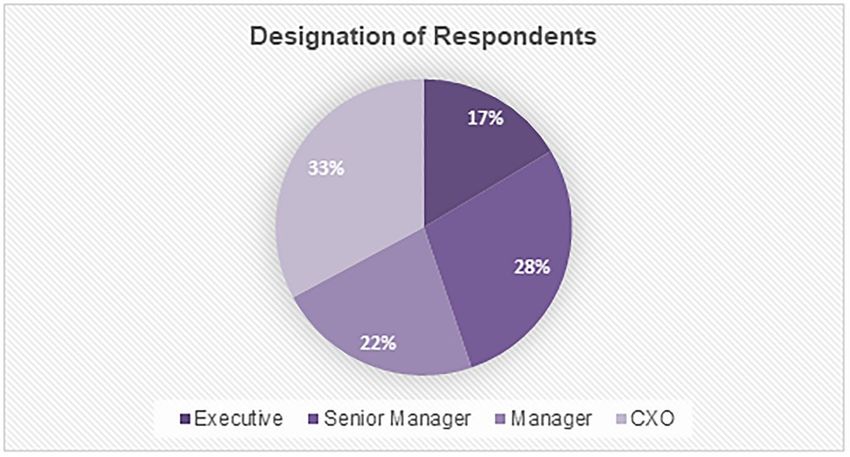
292
       -                                                                                                                  PATSAVELLAS   ET AL.

                                                                          techniques that enable businesses to organise, visualise and
                                                                          curate data [11].
                                                                              The five broad types of analytics powered by SCCT are as
                                                                          follows:

                                                                          �   Planning Analytics—What is our plan?
                                                                          �   Descriptive Analytics—What happened?
                                                                          �   Predictive Analytics—What will happen next?
                                                                          �   Diagnostic Analytics—Why did it happen?
                                                                          �   Prescriptive Analytics—What should be done about it?

FIGURE 1          Management of supply chain at all levels                2.3 | Act
                                                                          � Process automation: Multiple standard business processes
                                                                            in SCCT can be organised in a ‘landing’ schedule, so they
                                                                            can run automatically without manual human intervention.
                                                                            Such scheduling routines give better visibility of which
                                                                            business processes are executed when and facilitate perfor-
                                                                            mance measurement transparency.
                                                                          � Human–machine collaboration: Digital automation does
                                                                            not exclude human overseeing and interactivity. The busi-
                                                                            ness objective of this layer is to provide the means to
FIGURE 2          Functionalities powered by supply chain control tower     collaborate across multiple functional areas both within and
                                                                            outside the organisation to effectively respond to an event.
                                                                            This is achieved by
      visibility and is the precursor of any attempt to develop              i. Process management: This allows various teams to
      autonomous decision making.                                               leverage workflow capabilities to orchestrate an effec-
�     Real‐Time Monitoring: Improving customer service                          tive response to an event. For example, if a delivery is
      levels by tracking and recording data related to demand‐                  delayed then process management could trigger timely
      supply performance in real time. This functionality in-                   alerts to buyers, logistics managers, and transportation
      creases the cost‐effectiveness of planning for flexibility and            planners. These stakeholders can be empowered to
      responsiveness.                                                           provide feedback on a mobile‐enabled workflow tool
�     Granular Visibility: Along with order status tracking and                 for immediate response and proactive mitigation of
      tracing, the granularity of visibility increases by pulling               supply risks.
      through high levels of detail for multiple parameters.                ii. Integration: The SCCT tool can be integrated with
�     Data Management: Control towers can help to store,                        enterprise systems to automate certain types of response
      append and structure SC data. This can ensure that visual-                mechanisms when initiated by the control tower team
      isation is on‐point and accurate, which is critical for opti-             and/or its trusted algorithms.
      mum decision making, offering a stable baseline for further         � Exception‐based decision making: Supply chain control
      automation.                                                           tower can help in solving disruptions, cognitive risks and
�     Alert Generation: Supply chain control tower can send                 exception management even without human interventions.
      timely and relevant alerts to the right stakeholders about
      supply flow disruptions [9].                                            The four key benefits of SCCT as shown in Figure 3 are as
                                                                          follows:
                                                                              Cost savings: The SCCT uses natural language processing,
2.2 | Plan                                                                machine learning, and statistics to identify issues from un-
                                                                          structured data resulting in accurate decision making which
Information analysis is required for sound commercial de-                 helps in saving a lot of costs associated with reactive trial‐and‐
cisions. Therefore, data analytics can help improve the profit-           error actions.
ability of the business, increase market share and revenue, and               Increased efficiency: Once the SCN is visible to every
provide a better returns to shareholders [10]. In order to                stakeholder, it presents a shared optimisation opportunity that
improve their decision‐making abilities, organisations increas-           can enable collaborative efficiency improvement projects and
ingly rely on business analytics capabilities. Data analytics             enhanced demand support.
enable managers to make efficient and effective decisions that                Better customer experience: As all the SC partners can
are relevant to business and its related operations by using              be connected in the SCCT dynamically, customers can get
tools, techniques, and processes, including algorithms and                better, faster, and more effective responses.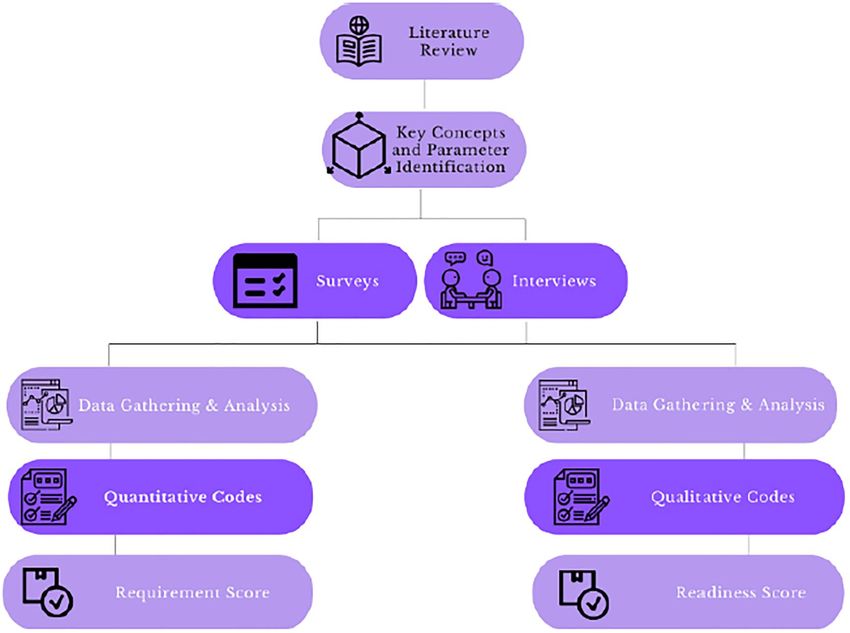
PATSAVELLAS   ET AL.
                                                                                                                                 -   293

    Improved organisational models: Supply chain control            3 | LITERATURE REVIEW
tower helps connect all the silos of the SC into one big
collaborative and compact network providing a ‘single source        3.1 | Supply chain visibility and transparency
of data truth’ that can be used to target complex strategic and
tactical goals of the organisation as a whole.                      The definition of SC visibility has been hitherto under refined.
    While there are multiple benefits of deploying an SCCT,         Even within the vast realm of SC literature, a consistent defi-
there are certain challenges that are stopping companies from       nition is elusive [13]. Supply chain visibility is often confused
implementing them as shown in Figure 4 [12].                        with information sharing whereas it is a broader capability that
                                                                    maps all the SC flows. Information sharing is one of the
� Lack of collaboration: End‐to‐end visibility requires             components of visibility that can be treated solely as an internal
  collaboration across trading partners. This collaboration         resource [14]. However, there is a need for seamless infor-
  gives birth to the challenge of transparency and data             mation integration between the linkages of the SC [15] across
  disclosure. A fully integrated SC provides the functionality      multiple echelons in a graphical way, depicting the flow of
  of adjusting production plans in situations of erratic de-        goods through trade lanes and partner facilities. This even
  mand. Some organisations might not be comfortable in              entails the monitoring of thousands of data streams that can be
  providing access to their partners to check their complete        outside the assumed boundaries of a SC per se, that is the
  schedule modification history. Similar transparency issues        weather forecasts, news feeds, social media trends, traffic re-
  can be anticipated in bill of material management, live in-       ports, exchange rates, commodity, and stock market indices etc.
  ventory status along with other information that is shared by     to quickly and proactively surface alerts [16].
  sales and operations planning teams with other stakeholders.           Prior research has conceptualised SC visibility as a capa-
� Accuracy and human intervention: The basic framework              bility [17] that may reduce the negative impacts of SC
  needed for ensuring true agility must maintain consistent         disruption [18].
  levels of accuracy throughout the SC. While the data                   Visibility is a key business enabler within the nucleus
  collected digitally ensure a certain level of accuracy, the       organisation and beyond its borders with affiliated stakeholders
  capability of the control towers to allow human intervention      and partners. It can be a source of competitive advantage by
  to update the data at multiple input points can have an           facilitating the maximisation of key business metrics such as
  impact on accuracy.                                               speed, flexibility, and cost [19].
� Integration challenges: One of the most prominent                      Lack of SC visibility at the process level is the main
  challenges in implementation is the financial, time, and skills   concern for about 79% of the 150 large companies surveyed
  resource commitment needed to successfully launch an              globally. This finding is in line with another recent survey of
  SCCT. Since integration must be done with all the trading         400 SC executives worldwide [20].
  partners at different levels of technological competency,              There is a direct correlation between visibility powered by
  delays and cost inflation risks may be high.                      information sharing and operational performance. Further-
� Budget and skillset constraint: The one‐time set‐up costs         more, SC visibility improves decision making [21] particularly
  of SCCT are very high. Therefore, few companies may be            in situations of contingency, thus enhancing resilience [22]. In
  able to raise the funds to complete the entire E2E                the last decade, it has become critical to develop inter and
  implementation.                                                   intra‐organisation collaboration in order to identify and miti-
                                                                    gate risks across whole SC systems. To achieve this, unfettered
                                                                    access and visibility of shared inter‐company demand infor-
                                                                    mation are crucial [23]. Fashion retailer Zara's production
                                                                    scheduling and inventory control systems support this point.
                                                                    Zara has achieved sector leadership with its ability to adjust
                                                                    multi‐plant and supplier production schedules daily on a real‐
                                                                    time basis, enabled by information sharing between each
                                                                    store and its headquarters on a daily basis. This has reduced the
FIGURE 3         Benefits of supply chain control tower             probability of stockouts or excess inventory [24].

F I G U R E 4 Barriers in supply chain control
tower implementation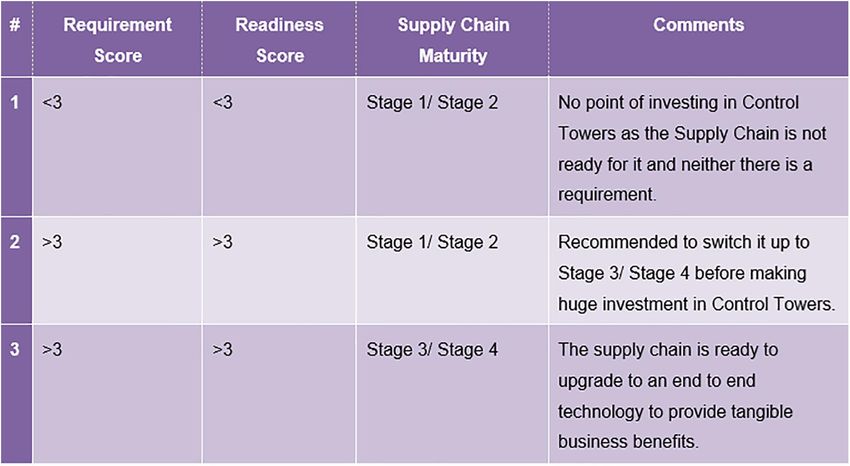
294
      -                                                                                                               PATSAVELLAS   ET AL.

     One of the major contributing factors for the lack of SC         and is increasingly seen as a source of competitive advantage.
visibility is the challenge of identifying the specific areas of      The most pertinent definition of resilience in this sense is given
priority for further capability development. Visibility can           by Ponomarov and Holcomb (2009) [37] who describe it as
positively affect manufacturing, transaction activities, planning,         The adaptive capability of the supply chain to prepare for
supplying, and evaluation [25] on both operational and stra-          unexpected events, respond to disruptions, and recover from
tegic choice levels. On an operational level, it can impact           them by maintaining continuity of operations at the desired
forecasting, planning, and scheduling efficiency, along with          level of connectedness and control over structure and func-
execution accuracy and speed [26].                                    tion. [37]
     This is an important consideration for companies that find            The biggest roadblock organisations face while building
themselves increasingly under pressure by the hard‐to‐control         resilience is the huge amount of resources that they perceive
complexities of the globalised nature of SCs. The enhanced            they may need to invest in order to increase it. The challenge is
visibility that enables global SC management to dynamically           not only associated with costs of risk mitigation but also with
monitor, predict, sense, adapt, and optimise for supply‐event         the way of establishing tangible ROI in disruption prevention.
exceptions, can provide a level of agility and resilience that        Some common approaches that are generally used to engineer
can ensure the reliability of supply and improved responsive-         resilience include building up redundancy in the supply
ness to market demand [27].                                           network by having multiple alternative sources of supply, safety
     The increasing need to respond to complexity at speed and        stocks, and overcapacity, all of which can be a burden on the
the realisation of the impact that increased visibility can have in   cash flow [16].
achieving strategic, tactical, and operational benefits, elevates          Globalisation has made SC more prone to disruption. The
the functionality offered by digital 4IR tools such as SCCT to        coronavirus outbreaks are a testimony to how the resilience of
market pull rather than just a technology push trend. SCCT is a       SC was put to the test with 94% of the Fortune 1000 com-
digital information hub serving as ‘digital twins’ of dynamic         panies' SC being disrupted [38]. Only organisations with
product and information flow, enabling SC management teams            established countermeasures in place have been able to survive
to reach higher levels of strategic, tactical, and operational        and eventually recover in this pandemic economy [39].
control and visibility [28].                                               In the era of global pandemics and emerging SC chau-
     Transparency, which is roughly defined as disclosure of          vinism, markets are experiencing an increased amount of
information, is a key concept of corporate sustainability [29].       disruption [40]. An additional reason for this is the shortening
Disclosure of information can be among other things about             life‐cycle of mass‐produced products. The overall demand for
supplier names, sourcing details, procurement and labour              standardised consumer products has fragmented among the
practices, and volumes of activity [30].                              various competitors in the global markets. This situation im-
     The globalised complexity in SC with the increasing              poses the challenge of adaptability and customisation while at
number of stakeholders being involved has rendered the                the same time ensuring affordable pricing [41]. Such compet-
transparency and authenticity of the information shared to be         itive forces in the global economy add further uncertainty to
even more critical for effectively managing risks and recalls, to     the overall business reality, making SC more vulnerable to
satisfy the rapidly changing consumer demand [31].                    shocks. The key to survival in such dynamic conditions is SC
     In addition, access to non‐distorted, factual, [32] relevant,    agility [42].
and timely SC information among all stakeholders including                 Agile SC respond flexibly and rapidly to changes in their
customers, helps promote trust and contributes significantly to       environment, even if those changes are short‐term and tem-
brand building [33].                                                  porary [43].
     However, the fear of unfettered access to easily shareable            Supply chain professionals are under constant pressure to
digital information remains the dominant cause of collabo-            ensure resilience in their networks of supply to keep up with
ration inertia. Therefore, the adoption of technologies that          the accelerating and unpredictable pace of change. Such
could enable SC transparency is still being perceived by              needs for speedy responsiveness are supported by consulting
enlarging to be a technology push rather than a market pull           companies and software providers that are constantly working
phenomenon [33].                                                      on providing technology tools to enhance business trading
                                                                      agility [44].
                                                                           The critical characteristics of an agile SC are [45]
3.2 | Supply chain resilience and agility
                                                                      a.   Market Sensitivity
Modern SCs operate in a world of volatility, uncertainty,             b.   Network‐Based flexibility
complexity, and ambiguity and that makes them vulnerable to           c.   Process Integration
disruptions [34]. This makes the designing of SCNs a critical         d.   Virtual
component for ensuring continuity of operations when
exposed to risks [35] and gives rise to the increasingly popular          These critical characteristics when combined together in a
concept of the resilience of supply. Supply chain resilience          controlled way, can afford fast dynamic efficiency to organi-
directly corresponds with a firm's dynamic capability to recover      sations, making their SC resilient and agile as described in the
operational stability swiftly from unforeseen disruptions [36]        following expression: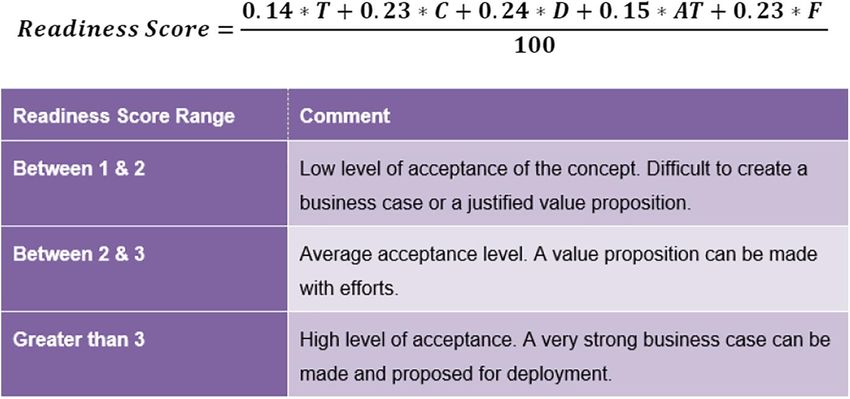
PATSAVELLAS   ET AL.
                                                                                                                                    -   295

     ‘Advanced Sensing + Flexibility + Co‐ordination +                      Each organisation can self‐evaluate itself on these five
Velocity = Agility’ [45]                                                qualitative codes on a scale of 1 to 5 (1 being the lowest and 5
     Companies and their major improvement initiatives tend to          being the highest). A weighted average can be calculated to give
focus more on the factors of velocity and cost‐effectiveness.           the readiness score. The value of the readiness score will always
What these organisations perhaps fail to realise is that cost‐          be between 1 and 5 as shown and based on its actual value as
effectiveness and velocity alone do not provide substantial             shown in Figure 5 organisations can self‐diagnose their state of
SC competitiveness as is normally expected [46]. While SC               readiness for SCCT adoption.
agility comes at a cost that is at times big enough to have a
direct impact on profitability, it is a critical business prerogative
to invest in, in order to ensure long‐term resilience [47].             4.2 | Requirement score
     Therefore, SCCT functionalities that make SCs more
resilient and agile can nowadays be considered a market pull            The requirement score for any organisation can be used to
factor rather than technology push forces.                              determine whether or not they have the pressing needs for a
                                                                        high‐end technology tool like control towers. This score uses
                                                                        the quantitative codes generated as a result of analysis of the
4 | ASSESSMENT TOOL DISCUSSION                                          survey conducted during the research. The five constituting
                                                                        components of the score are
4.1 | Readiness score
                                                                        � Visibility: Capability to see the E2E value chain in a 360°
Readiness Score for any organisation can be used to determine             glance along with sensing and tracking abilities across all
whether or not they are ready to introduce or even consider an            process levels, beyond the walls of the nucleus organisation.
E2E visibility technology like an SCCT. This score uses qual-           � Resilience: Measure of organisation's potential to bounce
itative codes generated as a result of the analysis of interviews         back from a situation of contingency or market singularity
conducted during the research. The five constituting compo-               without impacting the supply and production drastically.
nents of the score are                                                  � Agility: Measure of organisation's flexibility to changing
                                                                          business situations and capability to quickly adjust the
� Transparency: Nucleus organisation's willingness to pro-                supply and production accordingly.
  vide open access to information without any barriers across           � Automation: Organisation's emphasis on automating
  trading partners.                                                       different segments of their value chain.
� Collaboration: Willingness of suppliers and distributors in           � Velocity: Importance of shorter lead time of moving apart
  the value chain to come on board to implement this tech-                from one end of the value chain to another.
  nology E2E.
� Digitisation: Prioritisation given to create a digital SC to              Survey responses have been used to generate a prioritisa-
  make it more agile and resilient.                                     tion weights matrix.
� Autonomy: Businesses focus to use cognitive intelligence to               Each organisation can self‐evaluate themselves on these five
  create a sustainable SC utilising the industrial IoT.                 quantitative codes on a scale of 1 to 5 (1 being the lowest and 5
� Financing: Willingness to invest in technology to reap                being the highest) and a weighted average can be simulated to
  benefits in the future.                                               give the readiness score. The value of the requirement score will
                                                                        always be between 1 and 5 as shown in Figure 6. Based on the
   Responses from extensive interviews have been used to                value of the requirement score, organisations can make further
generate a prioritisation weights matrix.                               informed decisions on the merit of SCCT adoption.

FIGURE 5         Readiness score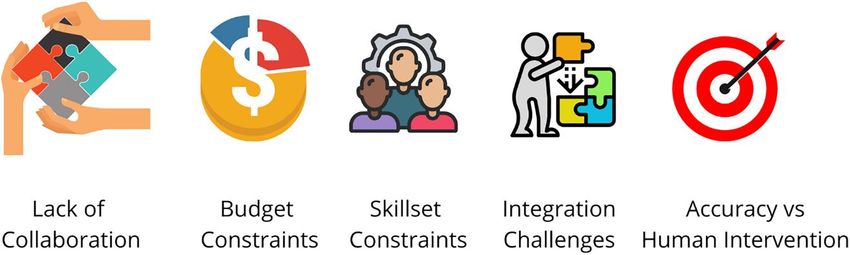
296
      -                                                                                                                 PATSAVELLAS   ET AL.

                                                                                               FIGURE 6        Requirement score

4.3 | Supply chain maturity                                                Forecasting, planning, and replenishment are fully inte-
                                                                           grated and visible. Technological improvements, knowl-
A SC can have different levels of maturity between the two                 edge, and real‐time information are shared with chain
extremes of simplicity and complexity. Most companies with                 partners.
established trading lanes and flows believe they have better
than the average SC maturity.                                              As shown in Figure 7, only organisations with both
     However, when put to the test with a disruption—natural          readiness score and requirement score greater than 3 and in
or man‐made disaster—it becomes clear that not all SCs are            either Stage 3/4 of the SC maturity level should proceed with
created equal.                                                        considering investing in SCCT. It is tempting to attempt to
     Best‐in‐class organisations' leverage real‐time intelligence     solve all problems in one big digital transformation project.
from their ecosystem of networked global trade partners to            But it can be prone to failure and difficult to manage. Or-
realise superior SC visibility and agility.                           ganisations should focus on incremental improvement once it
     An SC can be a simple chain with one strand, a complex           is detected that their current level of readiness or maturity
network, or any structure between these two extremes. SC              is low.
needs to guarantee a steady flow of supply striving to reduce
costs and the right chain structure can improve operating ef-
ficiency [48].                                                        5 | METHODOLOGY

                                                                      The grounded theory approach was used as a research
4.3.1 | Stages of SC management evolution                             methodology in this study because of its legacy of effective-
                                                                      ness on theoretical sensitivity and data synthesis, gathering,
There is a four‐stage model of SC management evolution                and analysis. The methodology encompasses a systematic
                                                                      literature review to understand the most prominent concepts
      Stage 1: Multiple Dysfunction                                   around a topic which are then repeatedly probed and evaluated
      This is a reactive SC that fulfils demand. It is perceived as   using surveys and interviews with stakeholders in the area of
      a cost centre with a minimal focus on competitiveness,          interest. The data gathered by this process is analysed to
      connectivity, and cost reduction.                               generate codes that can be either qualitative or quantitative
      Stage 2: Semi‐functional Enterprise                             depending on the nature of the data source. These codes can
      This is a reactive efficient SC that supports competitive       be used to generate their scores, models, frameworks, or
      positioning by focussing on being efficient, low cost, and      theories [47].
      integrated. Greater importance is placed on connectivity             From a holistic point of view, there are two major com-
      technology, automation to improve capacity and                  ponents of the grounded theory methodology that have been
      throughput.                                                     deployed in this study. The detailed step by step approach for
      Stage 3: Integrated Enterprise                                  the same is shown in Figure 8.
      This is a proactive, efficient SC. It focusses on reducing
      cost and complexity. This can be done via changing              a. Theoretical sensitivity–A thorough literature review on
      product designs or sharing information across functions,           the pertinent related concepts of visibility, resilience, agility,
      using integrated information systems.                              SCCT, 4IR technology enablers, benefits, and barriers to
      Stage 4: Extended Enterprise                                       implementation was carried out. The key core concepts and
      This is a strategic driver SC. Demand generation and               parameters for the analysis were identified as a result.
      fulfilment are fully integrated. Supply chain contributes to    b. Coding–Qualitative and quantitative codes were generated
      the development of the organisation's overall strategy.            using surveys and interviews. For surveys, the repertory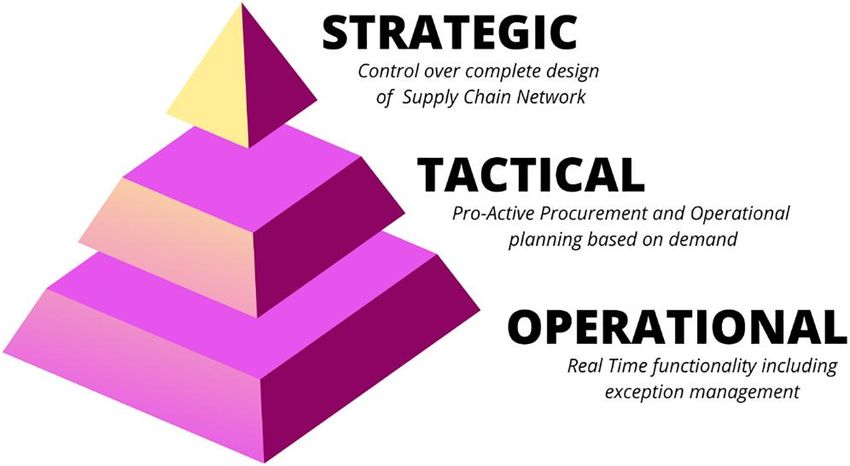
PATSAVELLAS   ET AL.
                                                                                                                   -   297

FIGURE 7         Decision making matrix

FIGURE 8         Step by step approach

   grid approach was used with mostly structured closed‐     responses in both surveys and interviews, thematic codes
   ended questions [47]. For interviews, a semi‐structured   were generated using open coding analysis. Open coding
   approach was used to obtain a detailed perspective on     in the grounded theory method is the analytic process by
   the current research performed on a fixed set of param-   which concepts to the observed data and phenomenon are
   eters under the key concepts observation lens. By using   attached during qualitative data analysis. It is one of the
   these two contrasting approaches, converging concepts     ‘procedures’ for working with text as characterised by
   were evaluated to gauge the similarity of responses and   Strauss and Strauss and Corbin [49]. Furthermore, this
   reflect on their coherence. By studying the pattern of    data was used to generate relative weights of the codes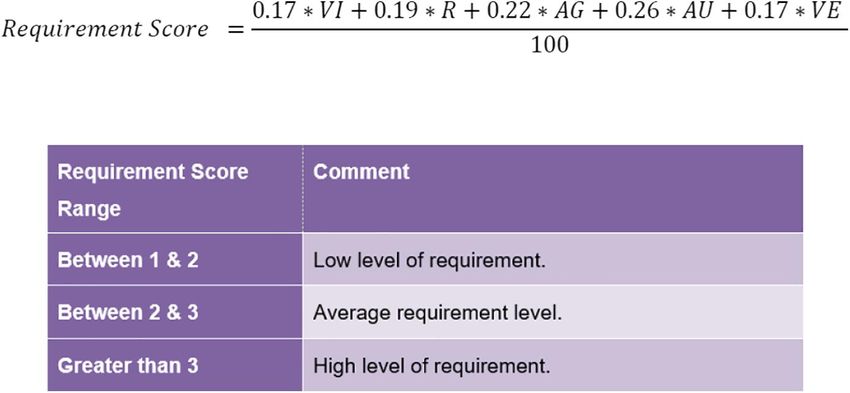
298
- PATSAVELLAS ET AL.
using the Analytical Hierarchy Process (AHP) which is a gauging respondents' understanding and awareness of the
structured technique for organising and analysing complex concept and respective technology providers.
decisions, based on mathematics and psychology [50]. The third section aimed to capture the respondents' per-
These were further tested for their reliability and validation ceptions about the capabilities and challenges of the technol-
using Cronbach's alpha and triangulation approach. ogy tool. It also included questions to get insights on the
Cronbach's alpha is a measure of internal consistency, that priorities and maturity level of their current SC.
is, how closely related a set of items are as a group. It is
considered to be a measure of scale reliability. Triangula-
tion is an important component of mixed‐method designs 5.2 | Survey results
which has its origins in attempts to validate research
findings by generating and comparing different types of In total 67 responses from across the industry were received.
data and different respondents' perspectives, on the topic The diversity of the respondents is shown below in Figures 9
under investigation [51]. and 10.
c. Value Creation–The codes generated were utilised to A thorough analysis of responses was carried out using an
derive two scores that help in the assessment of the SC as a open coding approach to shortlist the top five quantitative
preparation step towards control tower technology imple- codes essential to evaluate the overall requirement of SCCT as
mentation. A detailed implementation framework is pro- a technology tool. The importance and reliability of these codes
posed as an end deliverable. were verified by simulating the Cronbach's alpha value of these
parameters with the responses received. Cronbach alpha for
As this research relied on creating qualitative and quanti- quantitative codes is 0.655, which means the inter‐relation
tative Codes, the industry's response to the concept and and reliability of these parameters is 65%. Furthermore, the
introduction was critical to the creation of codes. The quan- data was used to determine the weights of importance of
titative codes were generated using the cross‐industry survey, these codes to each other using the AHP approach [49].
whereas the qualitative codes were generated using interviews Finally, a triangulation approach was used through member
with global SC Heads, business unit heads, and managing di- validation [51].
rectors across India and Asia. The final list of quantitative codes along with their weights
ratios are shown in Figure 11.
5.1 | Survey questionnaire design
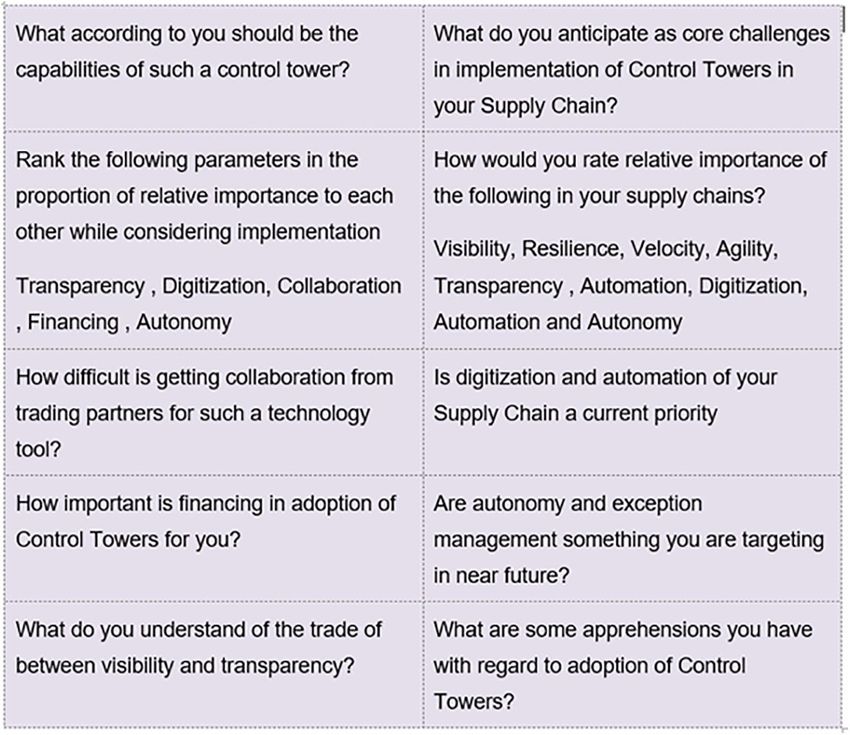
5.3 | Selection of interviewees and interview
The questionnaire was designed with mostly closed‐ended questions
questions distributed in three different sections.
The first section of the survey was created to put con- A semi‐structured and standardised approach to interviews
straints on the kind of respondents. It ensured that the re- was used. The interviews were conducted virtually using
spondents were working professionals with relevant industry technology bridges provided by Zoom and Microsoft Teams.
experience adding diversity to the sample set for analysis. Before the interview questions, an informational deck was
The second section, introduced the concept of SCCT along presented to set the tone of the conversation with details on
with a successful case study overview, to add context to the functionalities and features of SCCT. Examples of questions
questions that followed. The questions revolved around asked in the interview are shown in Figure 12.
FIGURE 9 Designation of respondents
PATSAVELLAS   ET AL.
                                                                                                                              -   299

FIGURE 10          Department of respondents

                                                                   to ensure accuracy each transcript was cross‐checked with the
                                                                   corresponding interviewees. Using an open coding approach
                                                                   initial coding was performed. The interviewee's views were
                                                                   divided into multiple categories of concepts and labelled to
                                                                   identify patterns. These patterns helped to develop common
                                                                   attributes from the raw data [52].
                                                                        The semi‐standardised answers obtained from interviews
                                                                   gave five concrete qualitative codes that show the readiness of
                                                                   an organisation to adopt CT for their SC. Furthermore, the
                                                                   data was used to determine the weights of importance of these
FIGURE 11          Quantitative codes                              codes to each other using the AHP followed by triangulation
                                                                   through member validation.
                                                                        The codes shown in Figure 13 were used further
   The interviewees were selected keeping in mind                  to generate readiness scores—a self‐assessment score that
                                                                   is indicative of the organisation's readiness to implement CT.
‐ Background relevance to the concept

‐ Work experience in the field                                     6 | CONCLUSION
‐ Familiarity with the concept                                     Beyond the COVID‐19 pandemic, organisations are focussing
                                                                   on the recovery of their SCs using traditional business process
‐ Industry and designation                                         re‐engineering (BPR) methods. There are two major steps
                                                                   involved in BPR, namely ‘rebuild’ and ‘strengthen’. While
    In total 11 interviews were conducted with executives          rebuilding has usually a short‐term focus on recovery,
based in the UK and India primarily working in multinational       strengthening becomes the desired long‐term goal of increased
organisations such as Siemens, Honda Cars, Nestle, Thou-           agile resilience which has emerged as a strong ‘market pull’
centric, Saint‐Gobain, and GSK among others.                       need. This long‐term focus brings the need for SC visibility
                                                                   enhancements to the forefront. Leaner and more agile SC
                                                                   operations can be achieved only if there is dynamic visibility
5.4 | Interview results                                            through the E2E system. Supply chain control towers is a
                                                                   technology tool that can be used for building this capability.
The interviews were audio‐taped with the explicit consent of       The feasibility and timing for introducing such technology,
the interviewees. Every transcript was checked and reviewed        however, depend on a thorough assessment of the current level
multiple times before using the data for analysis. Additionally,   of SC maturity, readiness, and specific requirements in order to
300
- PATSAVELLAS ET AL.
FIGURE 12 Interview questions
7 | FUTURE WORK
Supply chain digitisation is gathering pace and interest given
the changing global business and environmental conditions.
Supply chain control tower can bring together the com-
plete stack of 4IR tools for deployment across the whole value
chain and further opportunities that can be explored are
a. Management of reverse flows of products: Given the
capabilities of SCCT in the management of information
flows, the ‘reverse flows’ of products that include waste
FIGURE 13 Qualitative codes
mapping, recycling, end‐of‐life take‐back schemes and re-
pairs, could be a future research strand given the emer-
gence of the extended producer responsibility policy
navigate the ‘technology push–market pull’ impact on tech- trends.
nology adoption in the most optimum way. b. Cyber security risk management: Principally, SCCT
This research provides a comprehensive self‐assessment makes the SCs more resilient by facilitating risk prevention
tool that will and mitigation for the complete ecosystem. At the same
time, such a high level of digitisation imposes the challenge
� Calculate a readiness score on a scale of 1 to 5, which helps of cyber security risks. This needs further contemplation
to determine whether or not the organisation is ready to and work by exploring the feasibility of complementary
consider or introduce an E2E centralising technology stack technologies such as the permissioned blockchain tech-
in their SC extending beyond tier 1 levels. nology and AI integration with SCCT.
� Ascertain a required score on a scale of 1 to 5, to help c. Design of incentive schemes for effective collabora-
determine if there is a pressing need for a powerful tech- tion: Supply chain control tower can be successful in the
nology tool like SCCT in the SCN. truest sense only if all the trading partners come on board,
� The above two scores coupled with the current standardised collaborating for creating a sustainable ecosystem. Further
mapping of an organisation's stage of the SC maturity stage work needs to be done to compute and design an incentive
can help to guide the evaluation of push‐pull nuances in model that encourages small and medium enterprises to
SCCT investment considerations irrespective of sector and collaborate with global brands, taking SC relational power
size. asymmetry into consideration.PATSAVELLAS ET AL.
- 301
ACKN OW LE DG E ME N T 11. Dubey, R., et al.: Empirical investigation of data analytics capability and
None. organizational flexibility as complements to supply chain resilience. Int. J.
Prod. Res. 59(1), 110–128 (2021). https://doi.org/10.1080/00207543.
2019.1582820
CON FL ICT OF I N T ER E ST 12. The challenges of supply chain integration. Flexis. https://blog.flexis.
The authors whose names are listed above certify that they com/the‐challenges‐of‐supply‐chain‐integration (2017). Accessed 1 Jul
have no affiliations with or involvement in any organisation or 2021
entity with any financial interest (such as honoraria; educational 13. Francis, V.: Supply chain visibility: lost in translation? Supply Chain Manag.
grants; participation in speakers' bureaus; membership, 13(3), 180–184 (2008). https://doi.org/10.1108/13598540810871226
14. Gu, M., Yang, L., Huo, B.: The impact of information technology usage
employment, consultancies, stock ownership, or other equity on supply chain resilience and performance: an ambidexterous view. Int.
interest; and expert testimony or patent‐licencing arrange- J. Prod. Econ. 232, 107956 (2021). https://doi.org/10.1016/j.ijpe.2020.
ments), or non‐financial interest (such as personal or profes- 107956
sional relationships, affiliations, knowledge or beliefs) in the 15. Brandon‐Jones, E., et al.: A contingent resource‐based perspective of
supply chain resilience and robustness J. Supply Chain Manag. 50(3),
subject matter or materials discussed in this manuscript.
55–73 (2014). https://doi.org/10.1111/jscm.12050
16. The blueprint for supply chain agility. Forbes. https://www.forbes.com/
P ER MIS SI ON T O R EP ROD U CE M AT E R I A LS sites/stevebanker/2021/12/28/what‐we‐learned‐from‐covid‐19‐about‐the‐
F ROM O TH ER S OU RC ES blueprint‐for‐supply‐chain‐agility/?sh=438be3951b82 (2020). Accessed
None. 5 Jul 2021
17. Barratt, M., Oke, A.: Antecedents of supply chain visibility in retail supply
chains: a resource‐based theory perspective. J. Oper. Manag. 25(6),
DATA AVA IL AB I LI T Y STA T E ME N T 1217–1233 (2007). https://doi.org/10.1016/j.jom.2007.01.003
Data available on request from the authors. 18. Christopher, M., Towill, D.R.: Supply chain migration from lean and
functional to agile and customised. Supply Chain Manag. 5(4), 206–213
OR CID (2000). https://doi.org/10.1108/13598540010347334
John Patsavellas https://orcid.org/0000-0001-8363-7004 19. EY–Global: COVID‐19: why real‐time visibility is a game changer for
supply chains. https://www.ey.com/en_gl/consulting/covid‐19‐why‐real‐
Rashmeet Kaur https://orcid.org/0000-0001-5804-7539 time‐visibility‐is‐a‐game‐changer‐for‐supply‐chains (2020). Accessed 5 Jul
Konstantinos Salonitis https://orcid.org/0000-0003-1059- 2021
364X 20. Caroll, T.: The smarter supply chain of the future: insights from the
global chief supply chain officer study. IBM. https://www.ibm.com/
downloads/cas/AN4AE4QB (2010)
R E FE RE NCE S 21. Christopher, M., Lee, H.: Mitigating supply chain risk through improved
1. Ivanov, D., et al.: Researchers perspectives on Industry 4.0: multi‐ confidence. Int. J. Phys. Distrib. Logist. Manag. 34(5), 388–396 (2004).
disciplinary analysis and opportunities for operations management. Int. https://doi.org/10.1108/09600030410545436
J. Prod. Res. 59(7), 2055–2078 (2020) 22. Williams, B.D., et al.: Leveraging supply chain visibility for responsive-
2. Ivanov, D., Dolgui, A.: A digital supply chain twin for managing the ness: the moderating role of internal integration. J. Oper. Manag. 31(7–8),
disruption risks and resilience in the era of Industry 4.0. Prod. Plann. 543–554 (2013). https://doi.org/10.1016/j.jom.2013.09.003
Contr. 32(9), 775–788. https://doi.org/10.1080/09537287.2020.1768450 23. Managing risk to avoid supply‐chain breakdown. MIT Sloan Management
3. SupplyChainBrain: In 2020, supply chain digitization is no longer Review. https://sloanreview.mit.edu/article/managing‐risk‐to‐avoid‐
optional. https://www.supplychainbrain.com/blogs/1‐think‐tank/post/ supplychain‐breakdown/ (2004). Accessed 1 Jul 2021
31062‐in‐2020‐supply‐chain‐digitization‐is‐no‐longer‐optional (2020). 24. EY—Global: COVID‐19: why real‐time visibility is a game changer for
Accessed 5 Jul 2021 supply chains. https://www.ey.com/en_gl/consulting/covid-19-why-
4. Frank, A.G., Dalenogare, L.S., Ayala, N.F.: Industry 4.0 technologies: real-time-visibility-is-a-game-changer-for-supply-chains (2005). Accessed
implementation patterns in manufacturing companies. Int. J. Prod. Econ. 5 Jul 2021
210, 15–26 (2019). https://doi.org/10.1016/j.ijpe.2019.01.004 25. Lancioni, R.A., Smith, M.F., Oliva, T.A.: The role of the internet in
5. Lee, M.H., et al.: How to respond to the Fourth Industrial Revolution, or supply chain management. Ind. Mark. Manag. 29(1), 45–56 (2000).
the second information technology revolution? Dynamic new combi- https://doi.org/10.1016/s0019‐8501(99)00111‐x
nations between technology, market, and society through open innova- 26. Kulp, S.C., Lee, H.L., Ofek, E.: Manufacturer benefits from information
tion. J. Open Innov. Technol. Mark. Complex. 4(3), 21 (2018). https:// integration with retail customers. Manag. Sci. 50(4), 431–444 (2004).
doi.org/10.3390/joitmc4030021 https://doi.org/10.1287/mnsc.1030.0182
6. Brem, A.: Pull vs. push—strategic technology and innovation manage- 27. Ivanov, D., Schonberger, J.: Basics of supply chain and operations
ment for a successful integration of market pull and technology push management. APIC. 20(39), 120 (2017). https://doi.org/10.1007/978‐3‐
activities. In: The Boundaries of Innovation and Entrepreneurship. 319‐24217‐0
Gabler (2008) 28. World Economic Forum: Impact of the Fourth Industrial Revolution on
7. ReadWrite: How will Industry 4.0 impact supply chain network? https:// supply chains. https://www.weforum.org/whitepapers/impact‐of‐the‐
readwrite.com/2018/11/08/how‐will‐industry‐4‐0‐impact‐supply‐chain‐ fourth‐industrial‐revolution‐on‐supply‐chains (2017). Accessed 1 Jul
network/ (2018). Accessed 1 Jul 2021 2021
8. De Frutos, E.H., Trapero, J.R., Ramos, F.: A literature review on oper- 29. Doorey, D.J.: The transparent supply chain: from resistance to imple-
ational decisions applied to collaborative supply chains. PLoS One. 15(3), mentation at Nike and Levi‐Strauss. J. Bus. Ethics. 103(4), 587–603
1–29 (2020). https://doi.org/10.1371/journal.pone.0230152 (2011). https://doi.org/10.1007/s10551‐011‐0882‐1
9. Bleda, J., et al.: Prepare for takeoff with a supply chain control tower 30. Mol, A.P.J.: Transparency and value chain sustainability. J. Clean. Prod.
enabling technologies for supply chain control towers. Accenture (2014) 107, 154–161 (2015). https://doi.org/10.1016/j.jclepro.2013.11.012
10. Business analytics–meaning, importance and its scope. Management Study 31. Astill, J., et al.: Transparency in food supply chains: a review of enabling
Guide. https://www.managementstudyguide.com/business‐analytics.htm technology solutions. Trends Food Sci. Technol. 91, 240–247 (2019).
(2014). Accessed 1 Jul 2021 https://doi.org/10.1016/j.tifs.2019.07.024302
- PATSAVELLAS ET AL.
32. Wognum, P.M., et al.: Systems for sustainability and transparency of food Oper. Prod. Manag. 38(1), 129–148 (2018). https://doi.org/10.1108/
supply chains–current status and challenges. Adv. Eng. Inf. 25(1), 65–76 IJOPM‐04‐2016‐0173
(2011). https://doi.org/10.1016/j.aei.2010.06.001 44. Baird, N., Kilcourse, B.: Omni‐channel fulfillment and the future of retail
33. Smarter With Gartner: Gartner top 8 supply chain technology trends supply chain. Retail Syst. Res. 9, 255–296 (2011)
for 2018. https://www.gartner.com/smarterwithgartner/gartner‐top‐8‐ 45. Supply chain management: supply chain agility–is it for real? Infosys.
supply‐chain‐technology‐trends‐for‐2018/ (2018). Accessed 1 Jul 2021 https://www.infosysblogs.com/supply‐chain/2012/02/supply_chain_
34. Carvalho, H.: Supply chain redesign for resilience using simulation. agility_‐_is_it_f.html (2012). Accessed 1 Jul 2021
Academia.edu. https://www.academia.edu/35888376/Supply_chain_ 46. The triple–a supply chain. Harvard Business Review. https://hbr.org/
redesign_for_resilience_using_simulation (2012). Accessed 1 Jul 2021 2004/10/the‐triple‐a‐supply‐chain (2004). Accessed 1 Jul 2021
35. Sadghiani, N.S., Torabi, S.A., Sahebjamnia, N.: Retail supply chain 47. Hair, N., Rose, S., Clark, M.: Using qualitative repertory grid techniques
network design under operational and disruption risks. Transport. Res. E to explore perceptions of business‐to‐business online customer experi-
Logis. Transp. Rev. 75, 95–114 (2015). https://doi.org/10.1016/j.tre. ence. J. Cust. Behav. 8(1), 51–65 (2009). https://doi.org/10.1362/
2014.12.015 147539209x414380
36. Christopher, M., Peck, H.: Building the resilient supply chain. Int. J. 48. Supply Chain 24/7: The four levels of supply chain maturity. https://
Logist. Manag. 15(2), 1–14 (2004). https://doi.org/10.1108/095740 www.supplychain247.com/article/the_four_levels_of_supply_chain_
90410700275 maturity/supply_chain_optimization (2013). Accessed 1 Jul 2021
37. Ponomarov, S.Y., Holcomb, M.C.: Understanding the concept of supply 49. Passage Technology: What is the analytic hierarchy process (AHP)?
chain resilience. Int. J. Logist. Manag. 20(1), 124–143 (2009). https://doi. https://www.passagetechnology.com/what‐is‐the‐analytic‐hierarchy‐process
org/10.1108/09574090910954873 (2014). Accessed 1 Jul 2021
38. Coronavirus is proving we need more resilient supply chains. Harvard 50. What does Cronbach's alpha mean? SPSS FAQ. UCLA Statistical Consulting
Business Review. https://hbr.org/2020/03/coronavirus‐is‐proving‐that‐ Group. https://stats.idre.ucla.edu/spss/faq/what‐does‐cronbachs‐alpha‐
we‐need‐more‐resilient‐supply‐chains (2020). Accessed 5 Jul 2021 mean/ (2006). Accessed 1 Jul 2021
39. Ivanov, D., Dolgui, A.: Viability of intertwined supply networks: 51. Torrace, H.: Triangulation, respondent validation, and democratic
extending the supply chain resilience angles towards survivability. A participation in mixed methods research. J. Mix. Methods Res. 6(2),
position paper motivated by COVID‐19 outbreak. Int. J. Prod. Res. 111–123 (2012)
58(10), 2904–2915 (2020). https://doi.org/10.1080/00207543.2020. 52. Chun Tie, Y., Birks, M., Francis, K.: Grounded theory research: a design
1750727 framework for novice researchers. SAGE Open Med. 7, 205031211882292
40. Operations, McKinsey & Company: Building supply‐chain resilience. (2019). https://doi.org/10.1177/2050312118822927
https://www.mckinsey.com/business‐functions/operations/our‐insights/
building‐supply‐chain‐resilience (2020). Accessed 5 Jul 2021
41. Christopher, M.: Creating an agile supply chain: issues and challenges.
Dev. Logist. Supply Chain Manag. 1993(3), 11–19 (1993). https://doi. How to cite this article: Patsavellas, J., Kaur, R.,
org/10.1016/s0142‐0496(09)90131‐x Salonitis, K.: Supply chain control towers: Technology
42. Christopher, M.: The agile supply chain: competing in volatile markets. push or market pull—An assessment tool. IET Collab.
Ind. Mark. Manag. 29(1), 37–44 (2000). https://doi.org/10.1016/S0019‐
Intell. Manuf. 3(3), 290–302 (2021). https://doi.org/10.
8501(99)00110‐8
43. Dubey, R., et al.: Supply chain agility, adaptability and alignment: 1049/cim2.12040
empirical evidence from the Indian auto components industry. Int. J.You can also read