Strategies for increasing tsunami shelter accessibility to enhance hazard risk adaptive capacity in coastal port cities: a study of Nagoya city, Japan
←
→
Page content transcription
If your browser does not render page correctly, please read the page content below
Nat. Hazards Earth Syst. Sci., 19, 927–940, 2019
https://doi.org/10.5194/nhess-19-927-2019
© Author(s) 2019. This work is distributed under
the Creative Commons Attribution 4.0 License.

Strategies for increasing tsunami shelter accessibility to enhance
hazard risk adaptive capacity in coastal port cities:
a study of Nagoya city, Japan
Weitao Zhang1 , Jiayu Wu2,a , and Yingxia Yun1
1 School of Architecture, Tianjin University, Tianjin, 300072, China
2 College of Agriculture and Biotechnology, Zhejiang University, Hangzhou, 310058, China
a formerly at: College of Urban and Environmental Sciences, Peking University, Beijing, 100871, China

Correspondence: Weitao Zhang (zhangwt2015@outlook.com) and Yingxia Yun (yunyx@126.com)

Received: 16 September 2018 – Discussion started: 9 October 2018
Revised: 22 March 2019 – Accepted: 22 March 2019 – Published: 24 April 2019

Abstract. Coastal areas face a significant risk of tsunami af-       results show that tsunami shelter accessibility strategies, tar-
ter a nearby heavy earthquake. Comprehensive coastal port            geting hazard-product risk and hazard-affected risk, are sig-
cities often complicate and intensify this risk due to the           nificantly different in Nagoya. These different strategies are
high vulnerability of their communities and liabilities as-          needed to adapt to the risk.
sociated with secondary damage. Accessibility to tsunami
shelters is a key measure of adaptive capacity in response
to tsunami risks and should therefore be enhanced. This
study integrates the hazards that create risk into two dimen-
sions: hazard-product risk and hazard-affected risk. Specif-         1   Introduction
ically, the hazard-product risk measures the hazard occur-
rence probability, intensity, duration, and extension in a sys-      In coastal areas, a nearby maritime earthquake is typically
tem. The hazard-affected risk measures the extent to which           followed by a chain of onshore waves. Some of these waves
the system is affected by the hazard occurrence. This enables        have the potential to become a heavy tsunami, significantly
the study of specific strategies for responding to each kind         endangering the lives of the resident population. Comprehen-
of risk to enhance accessibility to tsunami shelters. Nagoya         sive coastal port cities are places that have maintained lead-
city in Japan served as the case study: the city is one of the       ing positions in both global urban and port systems (Lee et
most advanced tsunami-resilient port cities in the world. The        al., 2008; Cerceau et al., 2014) and both complicate and in-
spatial distribution of the hazard-product risk and hazard-          tensify risks from tsunami in the following ways. First, so-
affected risk was first visualized in 165 school district sam-       cioeconomic elements are clustered in a dense, dispropor-
ples, covering 213 km2 using a hot spot analysis. The re-            tionate, and interwoven land-use pattern (Daamen and Vries,
sults suggest that the rules governing the distribution of these     2013; Bottasso et al., 2014; Ng et al. 2014; Wang et al.,
two-dimensional (2-D) risks are significantly different. By          2015) along lowland and flat terrain (Mahendra et al., 2011).
refining the tsunami evacuation time–space routes, traffic-          This leads to communities having a nonlinear sensitivity to
location-related indicators, referring to three-scale traffic pat-   tsunami due to the extreme diversity of hazard-affected envi-
terns with three-hierarchy traffic roads, are used as accessi-       ronments. Second, port-industry land use and large disposal
bility variables. Two-way multivariate analysis of variance          infrastructures are prone to fire, explosion, and chemical
(MANOVA) was used to analyse the differences in these ac-            leakage in response to heavy surge waves. This exposes com-
cessibility variables to compare the 2-D risk. MANOVA was            munities to large-scale secondary damage, especially where
also used to assess the difference of accessibility between          huge port-industry complexes penetrate into residential and
high-level risk and low-level risk in each risk dimension. The       service zones.

Published by Copernicus Publications on behalf of the European Geosciences Union.
928                                                   W. Zhang et al.: Strategies for increasing tsunami shelter accessibility

   To reduce population loss during a tsunami, evacuation             With respect to tsunami evacuation roadways, qualitative
planning (Glavovic et al., 2010; Wegscheider et al., 2011)         studies have focused on roadway design, based on a city’s
in comprehensive coastal port cities should be consistent and      actual road situation (Yang et al., 2010). Recommendations
supported by an effective tsunami shelter layout (Dall’Osso        for modifying, enhancing, and extending city roads have also
and Dominey-Howes, 2010). Tsunami shelters are typically           been proposed to maximize effective access to shelters across
high-rises with many floors, a large volume, and a reinforced      regions during tsunami evacuation (León and March, 2014).
concrete structure. They are also generally antiseismic, fire-     In contrast, quantitative studies are more complicated and ap-
proof, and explosion-proof (Scheer et al., 2012; Suppasri et       ply overall planning models and computer techniques. These
al., 2013; Chocl and Butler, 2014). In most countries around       studies have focused on establishing an evacuation network
the world, tsunami shelters are in public service buildings        model to identify the optimal roadways to shelters while min-
(Disaster Prevention Plan of Tokyo Port Area, 2016; Faruk          imizing evacuation time and traffic cost and maximizing the
et al., 2017). These buildings provide short-term emergency        scale of evacuation (Shen et al., 2016). Furthermore, traffic
shelter and long-term shelter.                                     congestion that extends evacuation time, including road dam-
   Tsunami shelters are also effective shelters that protect       age and traffic accidents, has also been widely considered
against other surge and wind hazards caused by meteorolog-         in evacuation network modeling and is consistently incorpo-
ical factors that are intensified by climate change (Solecki et    rated in roadway optimization planning (Chen et al., 2012;
al., 2011), such as storm tides. The difference between these      Stepanov and Smith, 2009).
events is that the available time for tsunami evacuation is far       In addition to tsunami shelter accessibility studies related
shorter, generally ranging within 30 to 60 min after a heavy       to a specific evacuation traffic system, several studies have
earthquake (Atwater et al., 2006). This makes on-site evac-        used tsunami shelter accessibility as a key measure to as-
uation for tsunamis equally or more important than cross-          sess the vulnerability of coastal communities to tsunami
regional evacuation. (Cross-regional evacuation is the major       events. Population-at-risk scales can be obtained by mea-
evacuation route for other surge and wind hazards.) However,       suring the evacuation completion time, hazard zones, and
it can also lead to congested and disordered evacuation traf-      levels (Wegscheider et al., 2011). Meanwhile, other stud-
fic to tsunami shelters during an emergency. Therefore, maxi-      ies have emphasized the importance of evacuation guidance,
mizing accessibility from disaster areas to tsunami shelters is    early warnings, and route planning to respond to tsunami
a key principle, especially when determining the effect of the     risks (Goseberg et al., 2014). These studies have also quanti-
tsunami shelter layout in the evacuation planning of coastal       fied and explored evacuation modeling using computer tech-
cities.                                                            niques, such as geographic information system (GIS) analy-
   In general, studies on shelter accessibility have examined      sis and multiagent simulations.
a broad array of factors, including traffic location assessment       To summarize existing tsunami shelter accessibility stud-
using simple qualitative research and quantitative evaluation      ies, they closely connect integrated hazard risks from local
(Thanvisitthpon, 2017; Rus et al., 2018; Faruk et al., 2018),      to global scales. These studies are supported by multiple
facility location modeling (Ng et al., 2010; Kulshrestha et        evacuation-space scales and multiple traffic patterns. How-
al., 2014; Mollah et al., 2018) and route optimization plan-       ever, although all-round traffic conditions are considered in
ning (Campos et al., 2012; Goerigk et al., 2014; Khalid et al.,    tsunami shelter accessibility studies, few studies have corre-
2018) using complex overall planning modeling and com-             lated shelter accessibility and specific, disintegrated risk in
puter simulations. The studies specific to tsunami shelter ac-     an extended way.
cessibility have mainly focused on two aspects: evacuation            However, studies on hazard risk (and its evaluation) are
traffic system on a technical level and adaptive capacity with     increasingly popular (Balica et al., 2012; Yoo et al., 2011;
an environmental focus.                                            Huang et al., 2012). According to United Nations Office
   Evacuation traffic systems include traffic patterns, road-      for Disaster Risk Reduction (UNISDR), hazard risk refers
ways, and possible traffic congestion on roadways. With re-        to the products of hazards, as well as the vulnerability of
spect to traffic patterns, diverse simulations using an agent-     hazard-affected bodies (the system or monomer affected by
based model have assessed evacuations to tsunami shelters          hazards, such as residents, facilities, and assets) (Wamsler
on foot, in vehicles, or using a combination of both (Mas et       et al., 2013; Johnstone and Lence, 2012). Thus, hazard risk
al., 2014). Traffic flow models (Johnstone and Lence, 2012)        can be split into two dimensions: the hazard-product risk and
in a disaster scenario have also been done. These simulations      the hazard-affected risk. The hazard-product risk dimension
are applied to predict the refuge-related preferences of the       refers to the hydro-geographic system measurements of the
population or to recommend a tsunami evacuation traffic pat-       hazard occurrence probability, intensity, duration, and exten-
tern. To guide or verify theoretical studies, social survey and    sion factors (Preston et al., 2011; Goseberg et al., 2014).
questionnaire methods have been combined with statistical          The hazard-affected risk dimension covers both the socioe-
analyses using information from actual tsunamis that have          conomic and political–administrative systems (Felsenstein
occurred (Murakami et al., 2014).                                  and Lichter, 2014; Jabareen, 2013). This dimension is di-
                                                                   vided into exposure, sensitivity, and adaptive capacity factors

Nat. Hazards Earth Syst. Sci., 19, 927–940, 2019                            www.nat-hazards-earth-syst-sci.net/19/927/2019/
W. Zhang et al.: Strategies for increasing tsunami shelter accessibility 929
in studies on coastal area (Saxena et al., 2013) and climate
change (Frazier et al., 2010) (and its driven hazards) vulner-
ability assessments. Therefore, in a broad sense, the hazard-
affected risk is an comprehensive concept. Within this con-
cept, exposure and sensitivity are factors that are proportional
to the hazard-affected risk and the final integrated hazard
risk. In contrast, adaptive capacity refers to different mea-
sures taken by hazard-affected bodies to mitigate, prepare,
prevent, and respond to disasters and to recover from them
(León and March, 2014; Desouza and Flanery, 2013; Solecki
et al., 2011). However, when focusing on the narrow sense of
hazard-affected risk related to negative risk-related factors,
adaptive capacity becomes the major research object and can
be studied independently, outside of the hazard-affected risk
dimension.
Consistently with the significantly different factors eval-
uated for hazard-product risk and hazard-affected risk, dif-
ferent spatial distributions between this two-dimensional (2-
D) risk can be formed. Shelter accessibility can be used as
a key measure of adaptive capacity in responding to hazard
risk: this accessibility can be ensured and enhanced where
the hazard-product risk is large and in the case when the
hazard-affected risk is high in a different and separately tar-
geted way.
In summary, the main purpose of this study was to ex-
plore the correlation between shelter accessibility and both
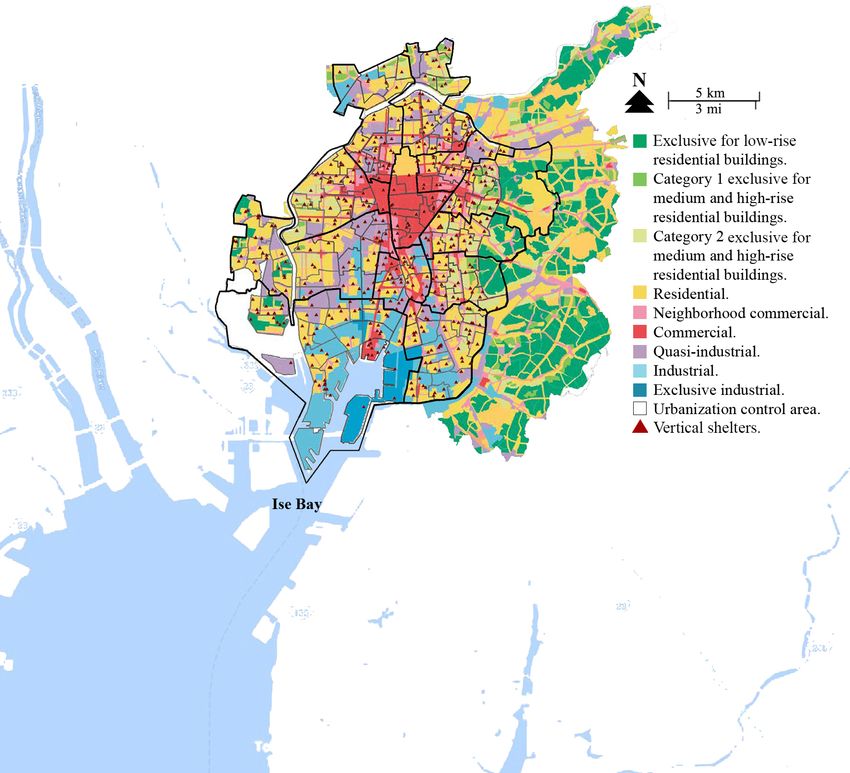
hazard-product risk and hazard-affected risk. The extreme Figure 1. The geological features of Nagoya. (Introduction of Out-
complexity of the tsunami hazard risk situation in compre- line Section of Planning for Nagoya, 2012. Accessed from the
hensive coastal port cities makes them interesting and valu- official website of Nagoya: http://www.city.nagoya.jp/jutakutoshi/
able to explore. As such, this study used the case study of page/0000045893.html, last access: April 2019.)
Nagoya in Japan, which is one of the most advanced tsunami-
resilient port cities in the world. The goal was to investigate
whether and how the tsunami shelter accessibility perfor- 2 Study area
mance of Nagoya shows positive but different intracity adap-
tive capacities to hazard-product risk and hazard-affected Nagoya is a central and industrial city in the Greater Nagoya
risk. The tsunami evacuation time–space routes reveal evac- metropolitan area facing the Ise Bay, where the Nagoya Port
uation directions, and route orders are sorted and refined. is located. The topography is generally flat, with gentle hills
Based on this, three traffic patterns with three-hierarchy road- to the east that connect to distant mountains. Three main
ways (mainly focusing on traffic location in a road system) rivers are positioned to the east of the fertile Nobi Plains,
are assessed separately to analyze shelter accessibility. facing Ise Bay to the south. The Shonai River flows from the
The main goals and steps of this study were (1) to investi- northeast of the city to the southwest, encircling the central
gate the 2-D spatial differentiation of risks by estimating the area where the Horikawa River flows (see Fig. 1). There are
spatial distribution of both hazard-product risk and hazard- 16 administrative regions in Nagoya. The 12 western regions
affected risk, as well as of risk levels in each risk dimension; include offshore locations and estuaries, with a low and flat
(2) to separately explore the different accessibility strategies terrain. There is significant a water network and traffic net-
that aim to enhance the adaptive capacity targeted at high work coverage. The port-driven land use and residential land
hazard risk in two risk dimensions. This involves analyzing use are mixed, with a high-density and diverse population
significant differences in tsunami shelter accessibility perfor- distribution. In contrast, the four eastern regions are in a low-
mance between hazard-product risk and hazard-affected risk, density and residential-development hilly area.
as well as between high-risk level and low-risk level in each Nagoya has learned lessons from the 2011 Great East
risk dimension. Japan Earthquake–Tsunami disaster. This learning has con-
tributed to significant progress in developing a tsunami-
resilient city. Nagoya’s Disaster Prevention City Develop-
ment Plan (DPCDP) was issued in 2015. It is based on the
scenario of a future maximum-impact earthquake–tsunami in
www.nat-hazards-earth-syst-sci.net/19/927/2019/ Nat. Hazards Earth Syst. Sci., 19, 927–940, 2019930 W. Zhang et al.: Strategies for increasing tsunami shelter accessibility
Table 1. List of data sets used for this study.
Data set Remark Resource
Tsunami inundation map Maximum Tsunami disaster risk assessment in DPCDP (2015)
Building collapse map possible Earthquake disaster risk assessment in DPCDP (2015)
Fire sprawl map situation Fire disaster risk assessment in DPCDP (2015)
Land use map Updated plan Initiatives in planning for Nagoya (2012)
Shelter map Updated plan Shelter definition and layout in DPCDP (2015);
Current situation official government website
Road system map Updated plan Initiatives in planning for Nagoya (2012); Disaster-relief roads
Current situation definition and layout in DPCDP (2015); OSM website
Population data Estimated in this Land use map (2012); planning for Nagoya outline (2012);
study statistical sketch of Nagoya (2015)
the Nankai Trough. This plan promoted the establishment of evacuate from these seismic shelters individually on foot to
a safe city (Dai, 2015). One major component of this plan nearby tsunami shelters. They will also be organized by res-
was improving the tsunami shelter layout to facilitate an easy cue authorities and sent by vehicles from the seismic shelters
evacuation in coastal high-impact hazard surroundings. to nearby or remote tsunami shelters. Moving to the seismic
shelter and then to tsunami shelters is the first transfer stage
after an earthquake but before a tsunami arrives.
3 Research design, variables, and method After the tsunami warning has been temporarily canceled
or after a tsunami has happened, a second tsunami transfer
3.1 Sample and data collection
stage is activated to prevent possible or secondary tsunami
School districts served as the study’s sample units. A “school damage or to move people away from the damaged shelters.
district” is a technical term in Japan and is defined as the In general, only tsunami shelters in inland and high terrain
most basic disaster prevention community unit by the local can support long-term safe sheltering. In contrast, shelters in
government. This study investigated 165 school districts in flooding-risk areas are appropriate for short-term emergency
the western 12 administrative regions of Nagoya city, which sheltering. Therefore, populations in these short-term shel-
included 474 tsunami shelters (see Fig. 2). The total study ters are organized in a way that allow them to be continuously
area covers 213 km2 . Table 1 lists the data sets used for this transferred by vehicles to inland or higher terrain.
study. There are also populations who have assembled in seismic
shelters and who have received tsunami warnings but who
3.2 Accessibility variables decide to return to their homes for different reasons, such as
to contact family and protect private property (Murakami et
According to disaster prevention plan documents from al., 2014; Suppasri et al., 2013). Then, they may again decide
Nagoya and other coastal cities in Japan, early during a heavy to individually walk or drive to nearby tsunami shelters or
earthquake, most populations are encouraged to immediately drive to tsunami shelters in inland and high terrain. These
evacuate to nearby seismic shelters (Dai, 2015). These seis- evacuation activities are all ordered through an emergency
mic shelters are usually public open spaces that can pro- plan by local governments. Based on these major evacuation
tect evacuees from earthquakes and fires (Hossain, 2014; Is- activities, the multiple tsunami evacuation time–space routes
las and Alves, 2016; Jayakody et al., 2018). However, they were refined for this study (see Fig. 3).
do not protect evacuees from surge waves and flood dam- Combined with a statistical research on evacuation traffic
ages. As such, populations evacuated to these seismic shel- patterns from the Great East Japan Earthquake (Murakami
ters should wait for tsunami warnings or evacuation orders. et al., 2014), three evacuation traffic patterns can be sorted
According to Japan’s coastal city disaster prevention docu- out in the multiple tsunami evacuation time–space routes:
ment and the Great East Japan Earthquake experience (Disas- on-site pedestrian evacuation (100 % pedestrian evacuation
ter Prevention Plan of Tokyo Port Area, 2016; Tanaka, 2017), in 2000 m), on-site vehicle evacuation (80 % vehicle evacua-
tsunami warnings are issued by administrative departments tion in 2000 m), and cross-regional vehicle evacuation (20 %
in 2 to 3 min after a heavy earthquake. And the tsunami will vehicle evacuation over 2000 m). Therefore, these three traf-
finally arrive in 30 to 60 min (Atwater et al., 2006). After re- fic patterns refer to tsunami shelter accessibility needs and
ceiving tsunami announcements, and based on the predicted are studied in this paper. They can be measured along with
available time for tsunami evacuation, the population will three-hierarchy roads and include a total of eight accessibil-
Nat. Hazards Earth Syst. Sci., 19, 927–940, 2019 www.nat-hazards-earth-syst-sci.net/19/927/2019/W. Zhang et al.: Strategies for increasing tsunami shelter accessibility 931 Figure 2. The school districts and tsunami shelters of the studied administrative regions in Nagoya city. (The authors combined the Nagoya city land use map from Initiatives in Planning for Nagoya, 2012. Accessed from the official website of Nagoya: http://www.city.nagoya.jp/ jutakutoshi/page/0000045893.html, last access: April 2019.) ity indicators. Each indicator is calculated based on the arith- shelters in enough time, mostly due to road congestion (Chen metic mean of tsunami shelters in each school district sample et al., 2012; Campos et al., 2012). This results from flooding (see Table 2). and destroyed roads, as well as chaos between people and On-site vehicle evacuation occurs on the main roads of the vehicles, triggering traffic accidents. Thus, this study applied city. Previous studies on evacuation practice have shown that traffic congestion indicators: the ratio of population number population-heavy occupied shelters are close to main roads to road length in each district sample and the ratio of pop- and their junctions after the disaster (Allan et al., 2013). ulation number to number of road junctions in each district Thus, two spatial indicators are studied: a shelter’s shortest sample. This approach is based on the critical cluster model distance to a main road to estimate the proximity to trans- created by Cova and Church (1997), wherein the possibility portation and a shelter’s shortest distance to a junction of of congestion can be measured using the ratio of the number main roads to estimate the connectivity in a transportation of people in a specific region to the overall capacity of exits network. Proximity provides a location advantage, ensuring across the region’s boundaries. A higher ratio generally indi- the quick activation of traffic and fast and organized evac- cates traffic congestion, which triggers other traffic accidents uation in a local area. Connectivity supports multidirection on the road or junctions around tsunami shelters. opportunities for local evacuations. Shelters with high con- Cross-regional vehicle evacuation relies on regional ex- nectivity may become a local evacuation hub. pressways to ensure mass, fast, and well-organized trans- Moreover, main roads in a local area are used for both ve- portation. Proximity and connectivity indicators are also im- hicle and pedestrian evacuations, leading to traffic problems. portant. Proximity supports efficient transfers in a single- Many studies have argued that the population cannot reach direction to remote safe areas if the local area is damaged www.nat-hazards-earth-syst-sci.net/19/927/2019/ Nat. Hazards Earth Syst. Sci., 19, 927–940, 2019
932                                                         W. Zhang et al.: Strategies for increasing tsunami shelter accessibility

Figure 3. Tsunami evacuation time–space routes with major evacuation activities.

Table 2. List of accessibility indicators for this study.

                     Spatial scale    Traffic tool    Roadway                     Indicator       Type      Measure
                     Cross-region                                             1   Dist_e                    Proximity
                                      Vehicle         Regional expressway                         Length
                     evacuation                                               2   Dist_junc_e               Connectivity
                                                                              3   Dist_m                    Proximity
                                                                                                  Length
                                                                              4   Dist_junc_m               Connectivity
                                      Vehicle         City main road
                     On-site                                                  5   C_m
                                                                                                  Ratio     Congestion
                     evacuation                                               6   C_junc_m
                                                                              7   Dens_a                    Proximity
                                      Pedestrian      All city road                               Ratio
                                                                              8   Dens_junc_a               Connectivity

by inundation and secondary disasters. Proximity also sup-                  The time–space impact of each hazard on the surrounding
ports the acceptance of regional evacuees from offshore areas               areas is very different. Before a tsunami, an earthquake has
with heavy flooding. Connectivity supports multiple-directed                a relatively even impact on the local area, lowering its com-
evacuation opportunities throughout a large region. Connec-                 parative risk (Chen et al., 2012). A tsunami results in differ-
tivity also allows shelters to provide the regional base with               ent inundations due to complex bathymetric and topographic
comprehensive disaster–response activities.                                 conditions (Xu et al., 2016), while the overall impact level
   Many studies have found that on-site pedestrian evacua-                  decreases progressively from the open sea and riverways to
tions involve all city roads (main roads and branch roads).                 inland. Explosions and fires are secondary hazards that oc-
Because of the extremely high-density grid-network branch                   cur with the earthquake and are generally intensified by the
roads in Nagoya, most tsunami shelters are located on the                   tsunami. Explosions have a concentrated point-shape impact
corners of city roads. As such, there is no need to measure the             around hazardous port-driven industry facilities, where the
proximity from shelters to city roads or junctions. We used                 hazard effects decrease with increased distance from the fo-
the density of all roads and the density of junctions of all                cal point, threatening the nearby communities with sudden
roads in each district sample to estimate the walking traffic               disruptions (Taveau, 2010; Christou et al., 2011). A fire haz-
coverage and connectivity in the vicinity of tsunami shelters.              ard shows a planarly sprawling impact due to inflammable
                                                                            material storage and nonfireproof construction sources.
3.3   Hazard risk variables                                                    With respect to the hazard-affected risk (see Table 3), the
                                                                            exposure factor refers to the extent to which a system at risk
This study evaluated hazard-product risk and hazard-affected                is exposed to a hazard. Daytime population density was se-
risk in Nagoya separately. Four main hazards are associated                 lected as the exposure indicator in this study, because pop-
with hazard-product risk in a tsunami scenario (see Table 3).

Nat. Hazards Earth Syst. Sci., 19, 927–940, 2019                                     www.nat-hazards-earth-syst-sci.net/19/927/2019/
W. Zhang et al.: Strategies for increasing tsunami shelter accessibility 933
Table 3. List of indicators computed in the hazard risk evaluation.
Dimension Indicator Risk level description (level) Data
situation
1 Tsunami Inundation 1–6: inundation map from 3 m inundation Existing
hazard final depth area (6) to 0.3 m inundation area (1).
Inundation 1–6: inundation map from 120 min inundation
arrival time area (6) to 720 min inundation area (1).
Intensity value: 1–4: buffers of port-industry
land or critical disposal facilities (4) by
250 m (3), 500 m (2), and 1000 m (1).
Hazard 2 Explosion hazard Hazard possibility coefficient: quasi-port indus- Mapped in
product try (50 %), common port industry land (80 %), this paper
exclusive port industry land (100 %), and dis-
posal facilities (100 %) (Multiply the possibility
coefficient by the intensity value.)
3 Fire hazard 1–4: fire sprawl map from 1000 building Existing
area (4) to 100 building area (1).
Building 1–5: building collapse map from 20 % building Existing
collapse area (4) to 5 % building area (1).
1–4: buffers of public service area by 250 m (1),
500 m (2), 1000 m (3), and over 1000 m (4).
Hazard 1 Sensitivity Urban Hazard possibility coefficient: central service Mapped in
affected service land (100 %) and adjacent service land (50 %) this paper
(Multiply the possibility coefficient by the in-
tensity value.)
2 Exposure Population Daytime population.
density
ulation is the hazard-affected body in a shelter accessibil- All study indicators were measured by summing the per-
ity analysis. The sensitivity explains how the system is sus- centages of specific risk-effect areas (divided by the total
ceptible to the forces and negatively impacts in association area of each district sample), multiplied by the corresponding
with a hazard. We selected sensitivity indicators with envi- risk-level value of the risk map (Prasad, 2016). Using Eq. (1),
ronmental attributes that may impede or support population we calculated both the hazard-product risk and the hazard-
evacuation. Environmental attributes can also indicate the be- affected risk in each district sample by adding the standard-
havioral abilities of the distributed population. Therefore, we ized indicators (Yoo et al., 2011) that each contained.
measured sensitivity using both a building collapse indicator
and an urban service indicator. The building collapse indi- X − Min
cator refers to a low-quality environment and old-standard Dimension index = (1)
Max − Min
construction. It also indicates the distribution of vulnerable
populations, especially low-income people. It has been sug- In this expression, X represents the value from each indica-
gested that low-income people consistently have less abil- tor, Min represents the minimum value, and Max represents
ity to respond to hazards in an efficient and timely way due the maximum value of the data set.
to less education, less available information, lack of per- Equations (2) and (3) assume that all indicators con-
sonal traffic tools, and poor facilities for disaster prevention tributed evenly to the final risk value. This assumption pro-
(Murakami et al., 2014). The urban service indicator can be vides significant flexibility with respect to the required in-
used to represent the location of humanized facilities with a put data and the practicability at a local level. An assump-
barrier-free design. That is because openness, fairness, and tion of equal weight is preferred because of its easy com-
security are key factors in public service use. Furthermore, prehensively, replicability, and calculability (Prasad, 2016;
public service building complexes provide a high-density Kontokosta and Malik, 2018). The tsunami hazard indicator
tsunami shelter area. was measured using the arithmetic mean of the inundation fi-
nal depth indicator and inundation arrival time indicator. The
sensitivity indicator was measured using the arithmetic mean
www.nat-hazards-earth-syst-sci.net/19/927/2019/ Nat. Hazards Earth Syst. Sci., 19, 927–940, 2019934 W. Zhang et al.: Strategies for increasing tsunami shelter accessibility
of the building collapse indicator and urban service indicator. 4 Results
4.1 Spatial differentiation of hazard-product risk and
hazard-affected risk
IDdep + IDtim
Riskproduct = IDtsunami + IDexplosion + IDfire =
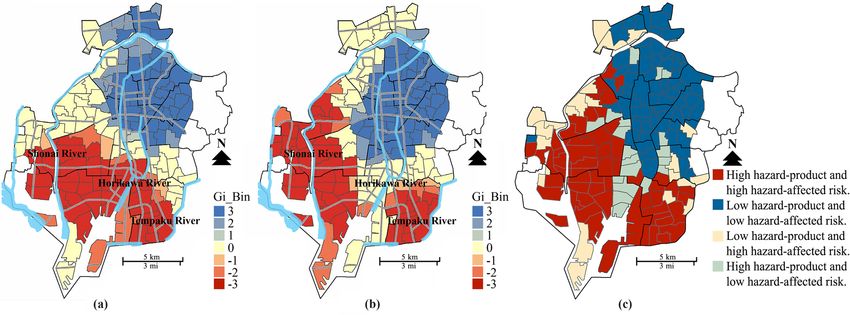
2 Hot spot analysis results showed that hazard-product risk and
+ IDexplosion + IDfire (2) hazard-affected risk exhibited considerably different spatial
IDcollapse + IDservice distributions in the 165 school district samples of Nagoya.
Riskaffected IDsen + IDexp = The results show that hazard-product risk is distributed in
2
+ IDpopulation (3) a relatively bipartite structure: offshore it shows high risk
and inland it shows low risk. Both these risks occur in a
planarly extended way, with a smooth interface between the
two risk areas (see Fig. 4a and c). The figures show that the
3.4 Analytical techniques hazard-affected risk distribution can also be simplified into a
bipartite structure. The high risk is along the fringe river (the
Shonai River and the Tempaku River); the risk diminishes in
First, we conducted a hot spot analysis (Getis-Ord Gi*) us- a direction from offshore to the inland. In contrast, the low
ing ArcGis 10.2 to visualize the global spatial distribution risk is along the central river (the Horikawa River), increas-
rule of the hazard-product risk and the hazard-affected risk ing from inland to offshore. Both risk directions extend in an
in Nagoya. A hot spot analysis is used to identify both high- axial way, and the interface between these two risk areas is
value (hot point) and low-value (cold point) spatial cluster- wedge-shaped (see Fig. 4b and c).
ing with statistical significance. The analysis outcome shows
that high-value areas are surrounded by high values. The re- 4.2 Tsunami shelter accessibility performance in
verse is also true: low-value areas are surrounded by low val- hazard-product risk and hazard-affected risk
ues. Therefore, a hot spot analysis can also visualize the spa-
tial distribution of the risk levels separately for the hazard- The multivariate test in MANOVA found that the reciprocal
product risk and hazard-affected risk. action between hazard-product risk and hazard-affected risk
After generating the spatial differentiation of both hazard- is statistically insignificant (see Table 4). This indicates that,
product risk and hazard-affected risk, we applied a two-way in Nagoya, the shelter accessibility in a specific area with a
multivariate analysis of variance (MANOVA), using SPSS specific hazard-affected risk will not significantly differ be-
23 for the accessibility analysis. This analysis checked the tween high hazard-product risk and low hazard-product risk
significance of the effects of the two factors in a multivariate and vice versa. Moreover, this shows that accessibility in-
factorial experiment with a two-way layout (Zhang and Xian, dicators significantly differ between two groups of hazard-
2012) and tested the null hypothesis of equal mean vectors affected risk, but not for hazard-product risk. This, in turn,
across all considered groups (Todorov and Filzmoser, 2010). indicates that the tsunami shelter accessibility performance
We used this to estimate the difference in tsunami shelter ac- is significantly different due to the spatial differentiation be-
cessibility between 2-D hazard risks and the differences be- tween building and environment quality. It also significantly
tween different levels in each dimensional hazard risk. differs based on population characteristics and distribution,
The choice of statistical approach was based on variable rather than based on the presence of tsunami, explosion, and
measurements. First, we set eight continuous accessibility fire hazard.
variables as dependent variables. We also converted two haz- The results of the intersubjectivity effect test indicate no
ard risk variables into a single two-category variable (with a significant reciprocal actions between hazard-product risk
high-risk group and a low-risk group) by dividing the sample and hazard-affected risk for any of eight dependent variables.
at the mean value as the independent variable. Second, we This allows us to directly analyze the main effect of each
confirmed that the data for analysis satisfied the following dimensional hazard-risk on the dependent variables (see Ta-
main conditions: (1) the variance of eight dependent vari- ble 5). Under the hazard-product risk and for cross-region
ables in each group should be homogeneous. If the variances vehicle evacuations, results show that the distance from shel-
are not homogeneous, a significant difference as a result of ter to expressway is only significantly shorter in high-risk
MANOVA cannot be confirmed as originating from the effect samples compared to low-risk samples. The differences in
of the independent variable or from the self-different vari- distance to the junction of an expressway are insignificant.
ance within each group. (2) A linear correlation should exist This indicates that the accessibility that enables fast and mass
between dependent variables. (3) Neither univariate outliers transfers in a single-directed but not multiple-directed way
nor multivariate outliers are found. (4) Dependent variables is more advanced in high hazard-product risk areas. The in-
follow the normal distribution. (5) No multicollinearity exists significant difference between vehicle and pedestrian evacu-
between dependent variables. ation compared to on-site evacuations may indicate that on-
Nat. Hazards Earth Syst. Sci., 19, 927–940, 2019 www.nat-hazards-earth-syst-sci.net/19/927/2019/W. Zhang et al.: Strategies for increasing tsunami shelter accessibility 935
Figure 4. Distribution of hazard risk: (a) hot spot analysis outcome of hazard-product risk; (b) hot spot analysis outcome of hazard-affected
risk; (c) high hazard-product/hazard-affected risk and low hazard-product/hazard-affected risk are divided by the average of the hazard-
product/hazard-affected value.
Table 4. List of multivariate tests. Df stands for degrees of freedom.
Effect Value F Suppose df Error df Significance
Hazard-product risk 0.910 1.501 10.000 152.000 0.144
Hazard-affected risk Wilks_Lambda 0.764 4.683 10.000 152.000 0.000∗
Hazard-product risk∗ 0.950 0.795 10.000 152.000 0.633
hazard-affected risk
∗ The mean difference is significant at the 0.05 level.
site evacuation accessibility does not have a significant ad- 5 Discussion
vantage in high hazard-product risk areas.
Under the hazard-affected risk, with respect to cross- 5.1 The formulation of spatial differentiation of
region vehicle evacuation, the distances from the shelter to hazard-product risk and hazard-affected risk
the expressway and from the shelter to the junction of the
expressway are both significantly longer in high-risk areas. This study of Nagoya suggests that, in a comprehensive
This means there are fewer advanced traffic locations for coastal port city with the co-development of urbanization and
shelters in cross-region evacuation. Similarly, in an on-site industrialization, the distributions of hazard-product risk and
vehicle evacuation, the distance to the junction of a main hazard-affected risk exhibit significant differences.
road in high-risk areas is significantly longer. Furthermore, For the hazard-product risk, the spatial bipartite struc-
in on-site pedestrian evacuation, the road density and road- tures with high risk offshore and low risk inland can be ex-
junction density are both similar when comparing high and plained in three ways. First, high-risk areas are located off-
low-risk samples. This indicates that all of the above aspects shore and in a large-scale area, because they lie in the sprawl-
(including cross-region, on-site vehicle, and on-site pedes- ing tsunami inundation range. This is because most modern
trian evacuation) provide a either a lower or equal advan- coastal port cities rely on accelerated seaward land reclama-
tage. However, both congestion indicators on the main-road tion (land that is only a few meters above sea level) to escape
scale are significantly lower in high-risk samples, as there is the spatial limitations of inland areas; however, this results
a lower possibility of congestion and other traffic accidents. in further and wider exposure to hydrologically disruptive
This outcome indicates that on-site evacuations reduce traffic events.
congestion in high hazard-affected risk areas. Second, the high risk extends inland, stemming from the
highly developed port-driven industry along the shore of
the city, broadly penetrating residential areas. Concentrated
and specialized port-driven industries are consistently con-
structed in this area, creating imbalances in social and en-
www.nat-hazards-earth-syst-sci.net/19/927/2019/ Nat. Hazards Earth Syst. Sci., 19, 927–940, 2019936 W. Zhang et al.: Strategies for increasing tsunami shelter accessibility
Table 5. List of paired comparisons.
Dimension Dependent Low High Mean value Standard Sig. 95 % confidence interval of difference
variable risk (I ) risk (J ) difference (I –J ) error Lower limit Upper limit
Dist_e 1 2 2.289∗ 0.926 0.015 0.460 4.118
Dist_junc_e 1 2 1.449 1.504 0.337 −1.522 4.419
Dist_m 1 2 −0.029 0.120 0.808 −0.266 0.208
Hazard- Dist_junc_m 1 2 −0.113 0.210 0.591 −0.529 0.302
product risk C_m 1 2 22.329 22.185 0.316 −21.483 66.140
C_junc_m 1 2 1.307 3.133 0.677 −4.880 7.494
Dens_c 1 2 0.028 0.094 0.762 −0.157 0.214
Dens_junc_c 1 2 −0.057 0.072 0.430 −0.199 0.085
Dist_e 1 2 −3.500∗ 0.926 0.000 −5.329 −1.671
Dist_junc_e 1 2 −5.287∗ 1.504 0.001 −8.257 −2.317
Dist_m 1 2 −0.108 0.120 0.368 −0.345 0.129
Hazard- Dist_junc_m 1 2 −.053∗ 0.210 0.012 −0.949 −0.119
affected risk C_m 1 2 91.709∗ 22.185 0.000 47.898 135.520
C_junc_m 1 2 9.637∗ 3.133 0.002 3.450 15.824
Dens_c 1 2 0.059 0.094 0.528 −0.126 0.245
Dens_junc_c 1 2 0.140 0.072 0.053 −0.002 0.282
∗ The mean difference is significant at the 0.05 level.
vironmental systems. While this maximizes the advantages Therefore, the spatial bipartite structure of the hazard-
of harbors and low land prices, this move creates increased affected risk can be explained in two ways. First, the areas
explosive hazards. along the fringe Shonai River and the Tempaku River from
Third, the offshore area at the edge of the city, such as the the Ise Bay to inland are older settlements, with lagging con-
southwest area of Nagoya, is a saturated delta alluvium de- struction and neglected city renewal. This is because they lie
posit with a low bearing capacity. It can only be used as a in a soft and low alluvial plain, which experiences long-term
natural foundation for low-rise and light-structure buildings. erosion due to the river system and is located at the marginal-
For example, wood construction, a traditional but popular ization of urban growth. The area along the Horikawa River
construction approach in Japan, covers a large extent here, flowing across the city center to the professional port zone
further intensifying the fire-risk exposure of this area. accumulates dense social capital and is constructed to high
In contrast, low hazard-product risk areas are distributed standards. This is because it forms the main axis of urban
inland, removed from the coast. In these areas, living and development, with location-specific river shipping and land-
service communities are mainly developed and are charac- scape advancements. These shipping and landscape advance-
terized by high elevations and solid soils. ments are accompanied by expressway and rail transits for
For the hazard-affected risk, the spatial bipartite structure, city expansion and mass commuting/logistics.
with a high risk along a fringe river from offshore to in-
land and a low risk along the central river from inland to 5.2 The strategy of tsunami shelter accessibility in
offshore mainly manifest risks with respect to environmen- hazard-product risk and hazard-affected risk
tal attributes. Rich water networks that fragment the land
and flow seaward are very typical for coastal port cities.
Based on the spatial differences in hazard-product risk and
In general, waterfronts are resource-rich and socioeconom-
hazard-affected risk in comprehensive coastal port cities, we
ically diverse areas. However, port cities are the interface be-
recommend different strategies to improve tsunami shelter
tween metropolitan and industrial areas and accommodate a
accessibility. These strategies would enhance the adaptive
broad mix of different urban development phases (settlement,
capacity of each dimensional hazard risk identified by this
expansion, specialization, de-maritimization, redevelopment,
study of Nagoya.
and regionalization). This results in conflicting economic,
In high hazard-product risk areas, and given the signifi-
social, and environmental values, leading to different man-
cant possibility of heavy inundation, dense explosion, and
agement approaches and unbalanced resources. This conflict
sprawl fire, tsunami shelter accessibility is enhanced through
leads to very different practice construction conditions along
cross-region evacuation instead of through on-site evacua-
rivers related to hazard-affected risk.
tion. Specifically, the difference in distance between shelter
and expressway is significant, while the difference in dis-
Nat. Hazards Earth Syst. Sci., 19, 927–940, 2019 www.nat-hazards-earth-syst-sci.net/19/927/2019/W. Zhang et al.: Strategies for increasing tsunami shelter accessibility 937 tance to the junctions of an expressway is not significant. roads in high hazard-affected risk areas. This would improve This is because large populations in high hazard-product tsunami shelter accessibility within safe traffic environments risk areas should evacuate immediately before tsunamis; they and walkable distances. This is particularly needed because then should engage in secondary evacuations after hazards of the low ability of the vulnerable population to evacuate inland from the shoreline area, in a single and definite direc- over long distances during an emergency and in poor build- tion. This makes multiple-direction accessibility over long ing environments. distances less important. This advanced accessibility perfor- mance in the cross-region evacuation of Nagoya is supported 5.3 Limitations and suggestions for future research by the plan of using evacuation skeleton roads in response to a tsunami, as shown in the DPCDP (2015). These skeleton This study sorted and refined the population evacuation roads are either defined by existing expressways or by en- time–space routes for accessing tsunami shelters. It did not, hancing main roads and show a significant single-direction however, study the rescue and logistical transportation pro- attribute. vided by the governmental and public sectors. Future studies In contrast, in high hazard-affected risk areas with poor- could explore multiple transportation activities involved in quality buildings, poor environmental conditions, vulnerable accessing tsunami shelters. This would provide recommen- population aggregation, and the possibility of significant road dations related to accessibility that could be used by multiple damage, there is currently less capacity to develop fast and stakeholders. large-scale transfer mechanisms to more remote safe zones. Moreover, the accessibility of the studied shelters is spe- There is a lower capacity to accommodate a massive num- cific to the traffic location. This relates to both traffic tools ber of evacuees from outer regions; however, we recommend and range. Future studies should apply both overall planning increasing tsunami shelter accessibility through on-site evac- modeling and computer simulations to design shelter acces- uations instead of cross-region evacuation. sibility, using multi-object optimization separately for high It is useful to further elaborate upon several details re- hazard-product risk areas and high hazard-affected risk areas. lated to the accessibility performance of Nagoya, specifi- Multiple objects could cover populations accommodated by cally in high hazard-affected risk areas. Firstly, the weak the shelters, traffic costs, and evacuation time. These inves- tsunami shelter accessibility, based on the distance to the ex- tigations could use the targeted accessibility strategies pro- pressway and its junctions, may result from lower require- posed in this study to as guidance. ments for cross-region evacuation. However, it can also be Finally, the indicators that were used to evaluate the explained by the fact that expressways, which concentrate di- location-specific hazard risks in Nagoya form a simple eval- verse socio-economic capital and enhance the vicinity’s con- uation system due to data shortages; however, the indicators struction quality and urban function, are underrepresented in used can still reflect the main aspects of hazard risk associ- areas highly susceptible to hazards. Second, the significantly ated with evacuations in a tsunami scenario. Future studies longer distance to the main road junctions in high-risk ar- could expand on these indicators to produce more detailed eas can also be explained by the lagging traffic: this is be- hazard-risk information in a multiple evaluation system with cause main roads cannot form a perfect network. Third, the a reasonable weight assessment. This could include a sub- insignificant difference between road density and junction system of disaster process phases and disaster affected bod- density may originate from the fact that many modern and ies to achieve a more accurate hazard risk evaluation. This old communities in Japan have been constructed using simi- exploration should be closely related to a specific evacuation larly scaled grid-network branch-road systems. or relief processes. Above all, the lack of advantage in cross-regional and on- site evacuation in high hazard-affected risk areas originates from the reality-based situation in lagging areas of urban construction and development. They cannot be improved in 6 Conclusions the short term. However, the lower possibility of congestion and other traffic accidents can compensate for these disad- This Nagoya city case study shows that in comprehen- vantages. This increases the adaptive capacity of tsunami sive coastal port cities, the hazard-product risk and hazard- shelters by reducing the traffic risk associated with vulner- affected risk exhibit considerably different spatial distribu- able population activity. It also effectively limits roadblocks. tion rules. Here, the hazard-product risk is distributed in a This adds to the success of the land readjustment project in bipartite structure with high risk offshore and low risk in- Nagoya. This project is designed to develop sound city areas land. Both are manifested in a planarly extended way with out of undeveloped urban areas or areas scheduled for urban- a smooth interface. The hazard-affected risk is distributed in ization. This development is done by exchanging and trans- a different bipartite structure, with high risk along a fringe forming disorderly land into public roads and public service river from offshore to inland and low risk along a central facilities. This project should be continued in the long term river from inland to offshore. Both occur in an axially ex- to improve the main road network and to extend to branch tended way and with a wedge-shaped interface. www.nat-hazards-earth-syst-sci.net/19/927/2019/ Nat. Hazards Earth Syst. Sci., 19, 927–940, 2019
938                                                        W. Zhang et al.: Strategies for increasing tsunami shelter accessibility

   Based on the spatial differentiation of 2-D hazard risk, we          in the Study on Comprehensive Disaster Prevention Measure and
recommend different strategies for improving tsunami shel-              Safety Strategy of Coastal City Based on Intelligent Technology for
ter accessibility, with the goal of enhancing adaptive capac-           their ideas, input, and reviews.
ity for each dimensional hazard risk. This Nagoya city case
study shows that, in high hazard-product risk areas, tsunami
shelter accessibility is enhanced by cross-region evacuations           Review statement. This paper was edited by Maria Ana Baptista
by increasing the proximity from shelters to regional ex-               and reviewed by two anonymous referees.
pressways. This is a better alternative than requiring on-site
evacuation. In contrast, in hazard-affected risk areas, it is
recommended that tsunami shelter accessibility be increased             References
through on-site evacuations while reducing the possibility of
traffic congestion on city main roads and main road junc-               Allan, P., Bryant, M., Wirsching, C., Garcia, D., and Teresaro-
tions. This is a better alternative than intensifying a cross-            driguez, M.: The influence of urban morphology on the resilience
region evacuation. Tsunami shelter accessibility performance              of cities following an earthquake, Journal of Urban Design, 18,
was positive with respect to the targeted adaptive capacity for           242–262, https://doi.org/10.1080/13574809.2013.772881, 2013.
                                                                        Atwater, B. F., Musumi, S., Satake, K., Tsuji, Y., Ueda, K., and
different dimensional hazard risks in Nagoya. This may also
                                                                          Yamaguchi, D. K.: The Orphan Tsunami of 1700: Japanese clues
provide indicators for other coastal port cities.                         to a parent earthquake in North America, Environ. Hist., 11, 614–
                                                                          615, https://doi.org/10.1080/00207230600720134, 2006.
                                                                        Balica, S. F., Wright, N. G., and Meulen, F. V.: A flood vulnerability
Data availability. The research data in this manuscript are official,     index for coastal cities and its use in assessing climate change im-
as are the public planning maps, current maps and related statistical     pacts, Nat. Hazards, 64, 73–105, https://doi.org/10.1007/s11069-
data. Until now (April 2019) they can be accessed from the official       012-0234-1, 2012.
website of Nagoya City, Japan. The list of research data sources are    Bottasso, A., Conti, M., Ferrari, C., and Tei, A.: Ports
as follows:                                                               and Regional Development: A spatial analysis on a panel
 1. Nagoya City government. The Nagoya City’s Disaster Preven-            of European regions, Transport. Res. A-Pol., 65, 44–55,
    tion City Development Plan, 2015. Accessed from the offi-             https://doi.org/10.1016/j.tra.2014.04.006, 2014.
    cial website of Nagoya City, Japan: http://www.city.nagoya.jp/      Campos, V., Bandeira, R., and Bandeira, A.: A method for evacua-
    jutakutoshi/cmsfiles/contents/0000002/2717/honpen.pdf (last           tion route planning in disaster situations, Procd. Soc. Behv., 54,
    access: April 2019).                                                  503–512, https://doi.org/10.1016/j.sbspro.2012.09.768, 2012.
                                                                        Cerceau, J., Mat, N., Junqua, G., Lin, L., Laforest, V., and Gonzalez,
 2. Nagoya City government. The Planning for Nagoya City, 2012,           C.: Implementing industrial ecology in port cities: International
    (including land use map). Accessed from the official website          overview of case studies and cross-case analysis, J. Clean. Prod.,
    of Nagoya City, Japan: http://www.city.nagoya.jp/jutakutoshi/         74, 1–16, https://doi.org/10.1016/j.jclepro.2014.03.050, 2014.
    page/0000045893.html (last access: April 2019).                     Chen, X., Kwan, M. P, Li, Q., and Chen, J.: A model for
 3. Nagoya City government. The statistical sketch of Nagoya              evacuation risk assessment with consideration of pre- and
    City. Accessed from the official website of Nagoya                    post-disaster factors, Comput. Environ. Urban., 36, 207–217,
    City,   Japan:    http://www.city.nagoya.jp/shisei/category/          https://doi.org/10.1016/j.compenvurbsys.2011.11.002, 2012.
    67-5-0-0-0-0-0-0-0-0.html (last access: April 2019).                Chocl, G. and Butler, R.: Evacuation planning considerations of
                                                                          the city of Honolulu for a Great Aleutian Tsunami, Tenth
 4. Nagoya City government. The Shelter Map, Accessed from
                                                                          U.S. National Conference on Earthquake Engineering Fron-
    the official website of Nagoya City, Japan: http://www.city.
                                                                          tiers of Earthquake Engineering, Alaska, USA, July 2014,
    nagoya.jp/en/page/0000013879.html (last access: April 2019)
                                                                          https://doi.org/10.4231/D3B56D51X, 2014.
                                                                        Christou, M., Gyenes, Z., and Struckl, M.: Risk assessment
                                                                          in support to land-use planning in Europe: Towards more
Author contributions. WZ and JW conceived the experiments. WZ             consistent decisions, J. Loss. Prevent. Proc., 24, 219–226,
designed the experiments, performed the experiments, analyzed the         https://doi.org/10.1016/j.jlp.2010.10.001, 2011.
data, and wrote the paper. YY outlined the article structure.           Cova, T. J. and Church, R. L.: Modeling community evacuation
                                                                          vulnerability using GIS, Int. J. Geogr. Inf. Sci., 11, 763–784,
                                                                          https://doi.org/10.1080/136588197242077, 1997.
Competing interests. The authors declare that they have no conflict     Daamen, T. A. and Vries, I.: Governing the European port–
of interest.                                                              city interface: Institutional impacts on spatial projects
                                                                          between city and port, J. Transp. Geogr., 27, 4–13,
                                                                          https://doi.org/10.1016/j.jtrangeo.2012.03.013, 2013.
Acknowledgements. This study was funded by the Major Project of         Dai, S. Z.: Comprehensive urban disaster prevention planning, 2nd
China National Social Science Fund (2013): Study on Comprehen-            ed., Chapter 1, China Architecture and Building Press, Beijing,
sive Disaster Prevention Measure and Safety Strategy of Coastal           2015.
City Based on Intelligent Technology (13&ZD162). The authors            Dall’Osso, F. and Dominey-Howes, D.: Public assessment of the
thank the anonymous reviewers of this paper and the participants          usefulness of “draft” tsunami evacuation maps from Sydney,

Nat. Hazards Earth Syst. Sci., 19, 927–940, 2019                                  www.nat-hazards-earth-syst-sci.net/19/927/2019/
W. Zhang et al.: Strategies for increasing tsunami shelter accessibility 939 Australia – implications for the establishment of formal evac- lem: Application to case studies, Safety Sci., 102, 263–274, uation plans, Nat. Hazards Earth Syst. Sci., 10, 1739–1750, https://doi.org/10.1016/j.ssci.2017.10.024, 2018. https://doi.org/10.5194/nhess-10-1739-2010, 2010. Kontokosta, C. E. and Malik, A.: The Resilience to Emergencies Desouza, K. C. and Flanery, T. H.: Designing, planning, and man- and Disasters Index: Applying big data to benchmark and vali- aging resilient cities: A conceptual framework, Cities, 35, 89–99, date neighborhood resilience capacity, Sustain. Cities Soc., 36, https://doi.org/10.1016/j.cities.2013.06.003, 2013. 272–285, https://doi.org/10.1016/j.scs.2017.10.025, 2018. Disaster Prevention Plan of Tokyo Port Area 2016: http://www.city. Kulshrestha, A., Lou, Y., and Yin, Y.: Pick-up locations minato.tokyo.jp/, last access: 1 January 2018. and bus allocation for transit-based evacuation planning Faruk, M., Ashraf, S. A., and Ferdaus, M.: An analysis of in- with demand uncertainty, J. Adv. Transport., 48, 721–733, clusiveness and accessibility of Cyclone Shelters, Bangladesh, https://doi.org/10.1002/atr.1221, 2014. 7th International Conference on Building Resilience: Using Lee, S. W., Song, D. W., and Ducruet, C.: A tale scientific knowledge to inform policy and practice in dis- of Asia’s world Ports: The spatial evolution in aster risk reduction, Bangkok, Thailand, November 2017, global hub port cities, J. Geoforum, 39, 372–385, https://doi.org/10.1016/j.proeng.2018.01.142, 2017. https://doi.org/10.1016/j.geoforum.2007.07.010, 2008. Felsenstein, D. and Lichter, M.: Land use change León, J. and March, A.: Urban morphology as a tool and management of coastal areas: Retrospect and for supporting tsunami rapid resilience: A case study prospect, Ocean Coast. Manage., 101, 123–125, of Talcahuano, Chile, Habitat Int., 43, 250–262, https://doi.org/10.1016/j.ocecoaman.2014.09.013, 2014. https://doi.org/10.1016/j.habitatint.2014.04.006, 2014. Frazier, T. G., Wood, N., Yarnal, B., and Bauer, D. H.: Influence Mahendra, R. S., Mothanty, P. C., and Bisoyi, H.: Assess- of potential sea level rise on societal vulnerability to hurricane ment and management of coastal multi-hazard vulnerability storm-surge hazards, Sarasota County, Florida, Appl. Geogr., 30, along the Cuddaloree Villupuram, east coast of India using 490–505, https://doi.org/10.1016/j.apgeog.2010.05.005, 2010. geospatial techniques, Ocean Coast. Manage., 54, 302–311, Glavovic, B. C., Saunders, W. S. A., and Becker, J. S.: Land-use https://doi.org/10.1016/j.ocecoaman.2010.12.008, 2011. planning for natural hazards in New Zealand: The setting, barri- Mas, E., Adriano, B., Koshimura, S., Imamura, F., Kuroiwa, J. H., ers, “burning issues” and priority actions, Nat. Hazards, 54, 679– Yamazaki, F., Zavala, C., and Estrada, M.: Identifying evacuees’ 706, https://doi.org/10.1007/s11069-009-9494-9, 2010. demand of tsunami shelters using agent based simulation, in: Goerigk, M., Deghdak, K., and Heßle, H.: A compre- Tsunami events and lessons learned: Environmental and soci- hensive evacuation planning model and genetic so- etal significance, advances in natural and technological hazards lution algorithm, Transport. Res. A-Pol., 71, 82–97, research, edited by: Kontar, Y. A., 347–358, Springer Science https://doi.org/10.1016/j.tre.2014.08.007, 2014. Business Media, Dordrecht, https://doi.org/10.1007/978-94-007- Goseberg, N., Lammel, G., Taubenb, H., Setiadi, N., Birkmann, J., 7269-4_19, 2014. and Schlurmann, T.: Early warning for geological disasters, Ad- Mollah, A. K., Sadhukhan, S., Das, P., and Anis, M. Z.: A cost op- vanced Technologies in Earth Sciences, Springer Publications, timization model and solutions for shelter allocation and relief Berlin, Germany, 2014. distribution in flood scenario, Int. J. Disast. Risk Re., 31, 1187– Hossain, N.: Street as accessible open space network in earthquake 1198, https://doi.org/10.1016/j.ijdrr.2017.11.018, 2018. recovery planning in unplanned urban areas, Asian Journal of Murakami, H., Yanagihara, S., Goto, Y., Mikami, T., Sato, S., and Humanities and Social Sciences, 2, 103–115, 2014. Wakihama, T.: Study on casualty and tsunami evacuation be- Huang, Y. F., Li, F. Y., Bai, X. M., and Cui, S. H.: Comparing vul- havior in Ishinomaki City: Questionnaire survey for the 2011 nerability of coastal communities to land use change: Analytical Great East Japan Earthquake, Tenth U.S. National Conference framework and a case study in China, Environ. Sci. Policy, 23, on Earthquake Engineering Frontiers of Earthquake Engineering, 133–143, https://doi.org/10.1016/j.envsci.2012.06.017, 2012. July 2014, Alaska, USA, 2014. Islas, P. V. and Alves, S.: Open space and their attributes, uses and Ng, A. K. Y., Ducruet, C., Jacobs, W., Monios, J., Notteboom, restorative qualities in an earthquake emergency scenario: The T., Rodrigue, J. P., Slack, B., Tam, K., and Wilmsmeier, case of Concepción, Chile, Urban For. Urban Gree., 19, 56–67, G.: Port geography at the crossroads with human geogra- https://doi.org/10.1016/j.ufug.2016.06.017, 2016. phy: Between flows and spaces, J. Transp. Geogr., 41, 84–96, Jabareen, Y.: Planning the resilient city: Concepts and strategies for https://doi.org/10.1016/j.jtrangeo.2014.08.012, 2014. coping with climate change and environmental risk, Cities, 31, Ng, M. W., Park, J., and Waller, T.: Hybrid Bilevel Model for the 220–229, https://doi.org/10.1016/j.cities.2013.06.001, 2013. optimal shelter assignment in emergency evacuations, Comput.- Jayakody, R. R. J. C., Amarathunga, D., and Haigh, R.: Integra- Aided Civ. Inf., 25, 547–556, https://doi.org/10.1111/j.1467- tion of disaster management strategies with planning and de- 8667.2010.00669.x, 2010. signing public open spaces, Procedia Engineer., 212, 954–961, Prasad, S.: Assessing the need for evacuation assistance in the https://doi.org/10.1016/j.proeng.2018.01.123, 2018. 100 year floodplain of South Florida, Appl. Geogr., 67, 67–76, Johnstone, W. M. and Lence, B. J.: Use of flood, loss, and https://doi.org/10.1016/j.apgeog.2015.12.005, 2016. evacuation models to assess exposure and improve a com- Preston, B. L., Yuen, E. J., and Westaway, R. M.: Putting munity tsunami response plan: Vancouver Island, Nat. Haz- vulnerability to climate change on the map: A review of ards Rev., 5, 162–171, https://doi.org/10.1061/(ASCE)NH.1527- approaches, benefits, and risks, Sustain. Sci., 6, 177–202, 6996.0000056, 2012. https://doi.org/10.1007/s11625-011-0129-1, 2011. Khalid, M. N. A. and Yusof, U. K.: Dynamic crowd evac- Rus, K., Kilar, V., and Koren, D.: Resilience assessment uation approach for the emergency route planning prob- of complex urban systems to natural disasters: Anew lit- www.nat-hazards-earth-syst-sci.net/19/927/2019/ Nat. Hazards Earth Syst. Sci., 19, 927–940, 2019
You can also read