Estimating sowing and harvest dates based on the Asian summer monsoon
←
→
Page content transcription
If your browser does not render page correctly, please read the page content below
Earth Syst. Dynam., 9, 563–592, 2018
https://doi.org/10.5194/esd-9-563-2018
© Author(s) 2018. This work is distributed under
the Creative Commons Attribution 4.0 License.

             Estimating sowing and harvest dates based on the
                          Asian summer monsoon
                       Camilla Mathison1 , Chetan Deva2 , Pete Falloon1 , and Andrew J. Challinor2
                                1 Met Office Hadley Centre, FitzRoy Road, Exeter, EX1 3PB, UK
                     2 School   of Earth and Environment, Institute for Climate and Atmospheric Science,
                                            University of Leeds, Leeds, LS2 9AT, UK
                         Correspondence: Camilla Mathison (camilla.mathison@metoffice.gov.uk)

                                 Received: 12 October 2017 – Discussion started: 1 November 2017
                            Revised: 14 March 2018 – Accepted: 25 April 2018 – Published: 18 May 2018

       Abstract. Sowing and harvest dates are a significant source of uncertainty within crop models, especially for
       regions where high-resolution data are unavailable or, as is the case in future climate runs, where no data are
       available at all. Global datasets are not always able to distinguish when wheat is grown in tropical and subtropical
       regions, and they are also often coarse in resolution. South Asia is one such region where large spatial variation
       means higher-resolution datasets are needed, together with greater clarity for the timing of the main wheat
       growing season. Agriculture in South Asia is closely associated with the dominating climatological phenomenon,
       the Asian summer monsoon (ASM). Rice and wheat are two highly important crops for the region, with rice
       being mainly cultivated in the wet season during the summer monsoon months and wheat during the dry winter.
       We present a method for estimating the crop sowing and harvest dates for rice and wheat using the ASM onset
       and retreat. The aim of this method is to provide a more accurate alternative to the global datasets of cropping
       calendars than is currently available and generate more representative inputs for climate impact assessments.
          We first demonstrate that there is skill in the model prediction of monsoon onset and retreat for two downscaled
       general circulation models (GCMs) by comparing modelled precipitation with observations. We then calculate
       and apply sowing and harvest rules for rice and wheat for each simulation to climatological estimates of the
       monsoon onset and retreat for a present day period. We show that this method reproduces the present day sowing
       and harvest dates for most parts of India. The application of the method to two future simulations demonstrates
       that the estimated sowing and harvest dates are successfully modified to ensure that the growing season remains
       consistent with the internal model climate. The study therefore provides a useful way of modelling potential
       growing season adaptations to changes in future climate.

1   Introduction                                                   pact Model Intercomparison Project (ISIMIP; Warszawski
                                                                   et al., 2013, 2014), and the Global Gridded Crop Model Inter-
Field studies dominate the modelling literature on crops and       comparison (GGCMI; Elliott et al., 2015). Recent work in
agriculture. Many crop models are developed and applied at         such climate–crop impact studies has sought to quantify un-
the field scale using site-specific observations to drive mod-     certainty from the quality and scale of input data. A result
els and optimize outputs. The growing awareness of climate         from this work is that for global-scale simulations, planting
change and the likely impact this will have on food produc-        dates are a significant source of uncertainty (Frieler et al.,
tion has generated a demand for regional and global assess-        2017; Elliott et al., 2015).
ments of climate impacts on food security through, for ex-            Aside from their use in modelling studies, deciding when
ample, projects such as the Agricultural Model Intercompar-        to plant crops is a significant challenge, particularly in water-
ison and Improvement Project (AgMIP; Rivington and Koo,            scarce regions such as parts of sub-Saharan Africa (SSA;
2010; Rosenzweig et al., 2013, 2014), the Inter-Sectoral Im-

Published by Copernicus Publications on behalf of the European Geosciences Union.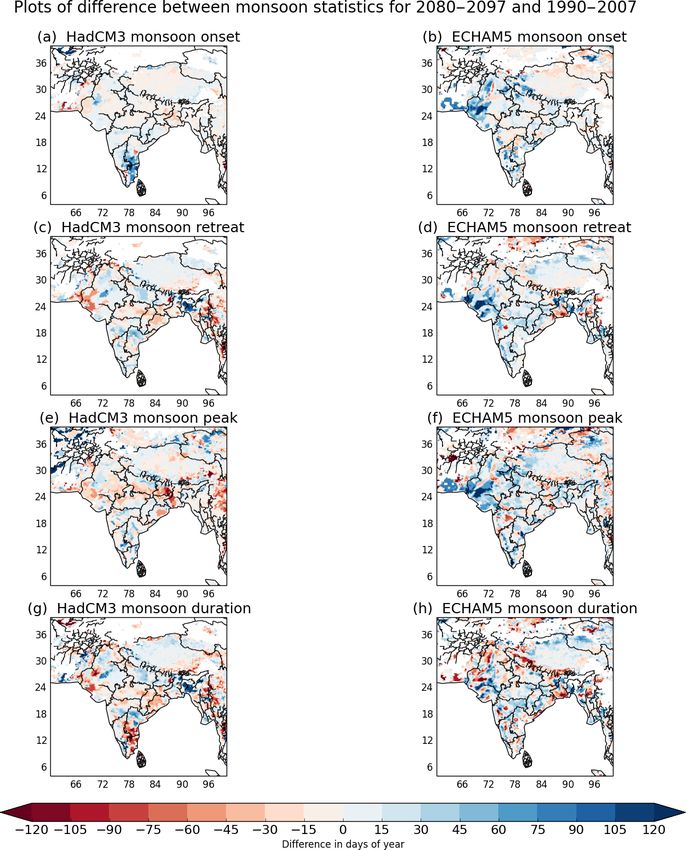
564                        C. Mathison et al.: Estimating sowing and harvest dates based on the Asian summer monsoon

Waongo et al., 2014) and South and South-east Asia (Kotera       practices is not really suitable for adaptation studies (van
et al., 2014). These regions have crop sowing dates that are     Bussel et al., 2015). The assumption that there will be no
closely associated with the onset of the rainy season. Any       large shifts in climate causing sowing and harvest dates to
prolonged dry spells of more than 2 weeks after sowing could     change significantly from the present day could lead to the
have serious consequences leading to crop failure or signifi-    sowing and harvesting of crops in the model in the future
cant yield reduction because topsoil layers dry out, prevent-    at unrealistic times of the year. Thus, the appropriate sow-
ing germination (Laux et al., 2008). For large parts of SSA,     ing and harvest dates used in future simulations depends on
deciding when to sow determines the length of the crop dura-     the intended application for the simulations. In many adap-
tion for the agricultural season and is therefore an important   tation studies, impacts without adaptation are assessed us-
tactical decision (Waongo et al., 2014).                         ing present day estimates of sowing dates, then the sowing
   Planting dates can be determined using a number of dif-       dates are adjusted in response to climate change to assess the
ferent methods; for example, Kotera et al. (2014) propose a      benefits of adaptation (Lobell, 2014). Challinor et al. (2017)
cropping calendar model for rice cultivation in the Vietnam      suggest using autonomous adaptation in simulations in or-
Mekong Delta (VMD). The Kotera et al. (2014) model es-           der to avoid overestimating the effects of adaptation. On this
timates the sowing date based on the suitability of the land     basis there is a requirement for estimates of sowing and har-
for crops given any flooding, saltwater intrusion, or erratic    vest dates for climate simulations that remain consistent with
monsoon rains; these are important factors for the water re-     the future model climate. This makes estimates of sowing
sources of the VMD region. Alternatively, Laux et al. (2008,     and harvest dates important not only for understanding the
2010) use a fuzzy-logic-based algorithm developed to esti-       present day, but also for use in future simulations, especially
mate the onset of the rainy season in order to examine the       when considering potential adaptation to climate change.
impact of the planting date for the SSA. In the General Large        Agriculture in South Asia is dominated by the Asian sum-
Area Model (GLAM; Challinor et al., 2004a), the sowing           mer monsoon (ASM). Kharif and Rabi are the two main sea-
date can be estimated by the model based on the soil mois-       sons in South Asian agriculture and these correspond to sum-
ture conditions, with the crop sown when surface soil mois-      mer and winter–spring growing seasons respectively. Rice–
ture exceeds a specified threshold during a given time win-      wheat systems are a major crop rotation across South Asia.
dow and crop emergence occurring at a specified time after       Kharif crops include rice, which is usually sown during the
sowing. Waha et al. (2012) base their estimates of sowing        monsoon and harvested in the autumn. Sowing and harvest
dates at the global scale on climatic conditions and crop-       dates for rice cultivated during the Kharif season vary be-
specific temperature thresholds, therefore providing a suit-     tween states, with rice traditionally sown in some locations
able method for taking climate change into account. How-         with the first rains of the monsoon, while other regions such
ever, the Waha et al. (2012) method is not really intended       as eastern parts of the Indo-Gangetic Plain (IGP) tend to plant
for use in irrigated multiple cropping regions. Elliott et al.   rice late into June when the monsoon is fully established
(2015) describe how sowing dates are defined in the GGCMI        (Erenstein and Laxmi, 2008). Rabi crops include wheat,
project. The GGCMI protocols use a combination of Sacks          which is mainly cultivated during the dry season (Erenstein
et al. (2010), Portmann et al. (2010), and model data to de-     and Laxmi, 2008; Singh et al., 2014). The close association
fine sowing dates, thus highlighting the challenges in defin-    of the sowing dates of these crops and the ASM offers the
ing a complete, accurate dataset of sowing and harvest dates.    potential for a new method of defining the cropping calendar
This has influenced and driven the development and applica-      for this important rotation.
tion of crop models on broader scales. In this study we are          Rice–wheat systems, particularly those in Pakistan (Eren-
considering the whole South Asia region; this is a large-scale   stein et al., 2008) and the Indo-Gangetic Plain (IGP), tend to
problem with complicated cropping patterns, which means          plant varieties like Basmati that take a long time to mature
that assumptions and generalizations need to be made across      (Erenstein and Laxmi, 2008). Since this delays wheat plant-
a region with a wide variety of climatic conditions and crop-    ing, this has a direct impact on wheat yield. In the eastern IGP
ping environments (soils etc). Waha et al. (2013) highlight      this is a particular problem as the season for which wheat is
the fact that global crop calendars such as those used in the    viable is relatively short (Erenstein and Laxmi, 2008; Laik
GGCMI often only report individual crops, therefore limiting     et al., 2014; Jat et al., 2014). Any delay between the rice
their usefulness for regions with multiple cropping systems.     harvest and wheat planting can have a large impact on the
   The growing interest in climate change and food secu-         success of the wheat crop as this will reduce the time avail-
rity has influenced the development of crop models for use       able before the temperatures get too high for the successful
in future climate impact assessments (Frieler et al., 2017);     cultivation of wheat (Joshi et al., 2007). The time between
this represents a different challenge for crop models in terms   the rice harvest and wheat sowing also depends on the time
of the input data used. ISIMIP simulations use time-varying      it takes to ensure the soil is in a suitable condition for wheat
crop management data until 2005, after which the data are        sowing after the rice harvest. Erenstein and Laxmi (2008) de-
held fixed at 2005 levels for the remainder of the simulations   scribe the zero-tillage approach, which allows for a reduced
(Frieler et al., 2017). Fixing crop management to present day    turnaround time between the harvest of rice and sowing of

Earth Syst. Dynam., 9, 563–592, 2018                                                 www.earth-syst-dynam.net/9/563/2018/
C. Mathison et al.: Estimating sowing and harvest dates based on the Asian summer monsoon                                    565

wheat. Potential avenues by which the uncertainty from sow-       integrated effective temperature in each development stage
ing and harvest dates can be reduced in inputs to crop simu-      is referred to as the thermal time of that development stage
lations include                                                   (Cannell and Smith, 1983; McMaster and Wilhelm, 1997);
                                                                  there may also be an additional photoperiod length depen-
  – the use of higher-resolution regional datasets of             dence. The thermal time in each development stage is typ-
    recorded sowing and harvest dates for crop calendars          ically set by the user and can be calibrated to simulate dif-
    rather than existing global datasets; and                     ferent varietal properties. Where these varietal properties are
                                                                  unavailable, e.g. for the global analysis in Osborne et al.
  – the use of new methods for estimating crop calendars in
                                                                  (2014), in order to mimic the spatial variation in the choice
    the absence of higher-resolution regional datasets.
                                                                  of crop variety, these thermal times were determined from
                                                                  sowing and harvest dates and the temperature climatology,
                                                                  which allowed them to vary spatially. This ensures that dur-
Motivation
                                                                  ing the simulation, the crop develops over the course of the
The correct representation of the crop duration within crop       crop season starting at the sowing date and ending at approx-
models is crucial for the interpretation of the important out-    imately the harvest date (i.e. the harvest date is the average
puts from the model. For example, if the datasets used for        over the course of the climatological period used). The use
sowing and harvest dates are inaccurate, the simulations          of this predefined thermal time ancillary drives the require-
could grow crops during the wrong season, thereby affect-         ment for providing both a sowing and harvest date. Reliable
ing the reliability of the simulated water use and crop yield.    high-resolution datasets for sowing and harvest dates are of-
The main differences between the regional Bodh et al. (2015)      ten unavailable for either the region or the time period that
dataset and the global Sacks et al. (2010) data are for spring    is needed. In addition, there is a demand for sowing and
wheat. Spring wheat grown in winter is misclassified as win-      harvest dates that maintain consistency with the model cli-
ter wheat in the Sacks et al. (2010) data. This is discussed by   mate. Therefore, in this paper we propose a new method,
Sacks et al. (2010) as a potential limitation when using the      outlined in Fig. 2, for estimating sowing and harvest dates
data for tropical and subtropical regions. Spring wheat is the    for use in the large-scale modelling of the rice–wheat ro-
more common type of wheat grown in the South Asia region          tation in South Asia using estimates of monsoon onset and
(Hodson and White, 2007) because minimum temperatures             retreat. This method does not require large amounts of data
there are not low enough to allow vernalization to take place,    and the user can elect to use either the sowing input data or,
which is needed for winter varieties of wheat (Sacks et al.,      if needed, both sowing and harvest data to run their chosen
2010; Yan et al., 2015).                                          crop model. The main objectives of this study are
   Figure 1 shows the averaged rice (green rectangles)
and wheat (orange rectangles) growing season durations                – to develop a method for determining sowing and harvest
for Sacks et al. (2010) (diagonal hatching) and the Bodh                dates for modelling the rice–wheat rotation in South
et al. (2015) dataset (perpendicular hatching labelled MinAg)           Asia based on the ASM and
overlaid on the present day South Asia averaged precipitation         – to test the method in current and future climates.
climatology and estimates of the monsoon onset and retreat.
This illustrates the differences between the Bodh et al. (2015)   We therefore present the methodology in Sect. 2. We show
and Sacks et al. (2010) datasets, showing that in Sacks et al.    that the proposed method is viable and show that it works
(2010) the main growing period for both rice and wheat ap-        in Sect. 3. A discussion of the results and conclusions are
pears to be during the monsoon. While rice is usually grown       provided in Sects. 4 and 5 respectively.
during the monsoon it is not typical that wheat should be
grown during this period for this region. The growing sea-        2    Methodology
son durations for the Bodh et al. (2015) dataset (see Fig. 1,
perpendicular hatching rectangles labelled MinAg) are more        The methodology is summarized in the flow chart in Fig. 2.
typical of this region with rice (green) growing during the       The model datasets, described in detail in Appendix A, in-
monsoon and wheat (orange) growing during the dry season.         clude general circulation models (GCMs) and a regional
Figure 1 highlights that where a global dataset is unable to      climate model (RCM). GCMs provide spatially consistent
establish exactly when wheat is grown in tropical regions, an     boundary data to an RCM, which generates 25 km regional
alternative is needed.                                            fields (see Fig. 2 blue boxes). The two GCMs used in this
   Crop models such as those described by Challinor et al.        analysis were specifically selected because they were able
(2003, 2004b) and Osborne et al. (2014) require sowing in-        to capture the main features of the ASM (see Appendix A).
formation such as a sowing date or a sowing window, with          RCMs are based on the same physical equations as GCMs
the crop model integrating an effective temperature over time     and therefore represent the entire climate system, including
as the crop develops. The effective temperature is a function     the carbon and water cycle. Their higher resolution allows for
of air or leaf temperature and differs between models. The        a better representation of the regional-scale processes, adding

www.earth-syst-dynam.net/9/563/2018/                                                   Earth Syst. Dynam., 9, 563–592, 2018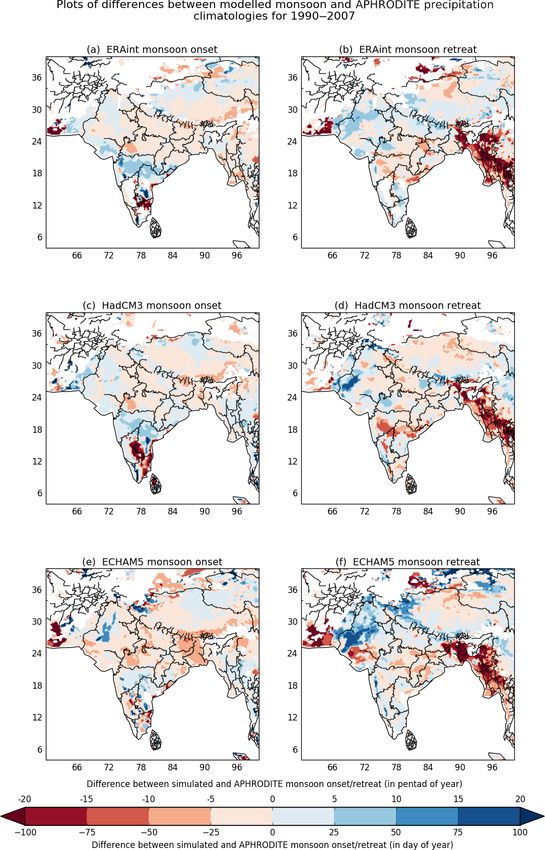
566                                   C. Mathison et al.: Estimating sowing and harvest dates based on the Asian summer monsoon

                                  7                     1990–2007 RCM climatology: precipitation for South Asia

                                  6

                                  5

                                  4
                        mmday−1

                                  3

                                  2

                                  1

                                  0    21 41 61 81 101 121 141 161 181 201 221 241 261 281 301 321 341 361 16 36 56 76 96 116
                                                                           Time / day of year

                                               HadCM3           HadCM3_onset              ECHAM5_onset        Minag_obs_rice
                                               APHRODITE        HadCM3_retreat            ECHAM5_retreat      Minag_obs_wheat
                                               ECHAM5           APHRODITE_onset           ERAint_onset        Sacks_obs_rice
                                               ERAint           APHRODITE_retreat         ERAint_retreat      Sacks_obs_wheat

Figure 1. The 1.5-year precipitation climatology for the 1990–2007 period averaged for South Asia for each simulation (ERA-Interim (la-
belled “ERAint” in the figures throughout the paper) cyan line, ECHAM5 blue line, HadCM3 red line) and APHRODITE observations (black
line) using a 5-day smoothed rolling mean. Also shown are the growing seasons averaged for 1990–2007 for South Asia for wheat (orange)
and rice (green) from two datasets: Sacks et al. (2010) (diagonal hatching-labelled sacks) and Bodh et al. (2015) (perpendicular hatching-
labelled Minag) and the monsoon onset (blue vertical lines) and retreat (pink vertical lines) from each of the simulations (APHRODITE
dotted, ERA-Interim dashed, HadCM3 solid, ECHAM5 dash dot).

detail to fields like precipitation (Mathison et al., 2015). The                    sensible results; these are described in Sect. 2.1 and shown
individual RCM simulations (also called HNRCMS; see Ap-                             by the green boxes.
pendix A) used in this analysis are referred to using their
global driving data abbreviations: HadCM3, ECHAM5, and                              2.1   Observations
ERA-Interim (labelled “ERAint” in the figures throughout
the paper) as described in Appendix A. Precipitation fields                         In order to demonstrate the viability of the methodology
are used to generate a precipitation climatology, which is                          outlined in Fig. 2, we compare the simulated precipitation
used to calculate the monsoon statistics (see Sect. 2.2) from                       with observations from the Asian Precipitation-Highly Re-
which sowing and harvest dates are estimated; shown by the                          solved Observational Data Integration Towards the Evalua-
pink rectangles (see Sect. 2.3). These estimated sowing and                         tion of Water Resources (APHRODITE; Yatagai et al., 2012)
harvest dates are referred to as relative monsoon sowing and                        dataset in Sect. 2.2.1. APHRODITE is a daily, 0.25◦ resolu-
harvest dates (see Fig. 2). Observations are used throughout                        tion land-only gridded dataset that is also used in Mathison
the process to ensure that the method is viable and produces                        et al. (2015) to show that the RCMs in this analysis capture

Earth Syst. Dynam., 9, 563–592, 2018                                                                       www.earth-syst-dynam.net/9/563/2018/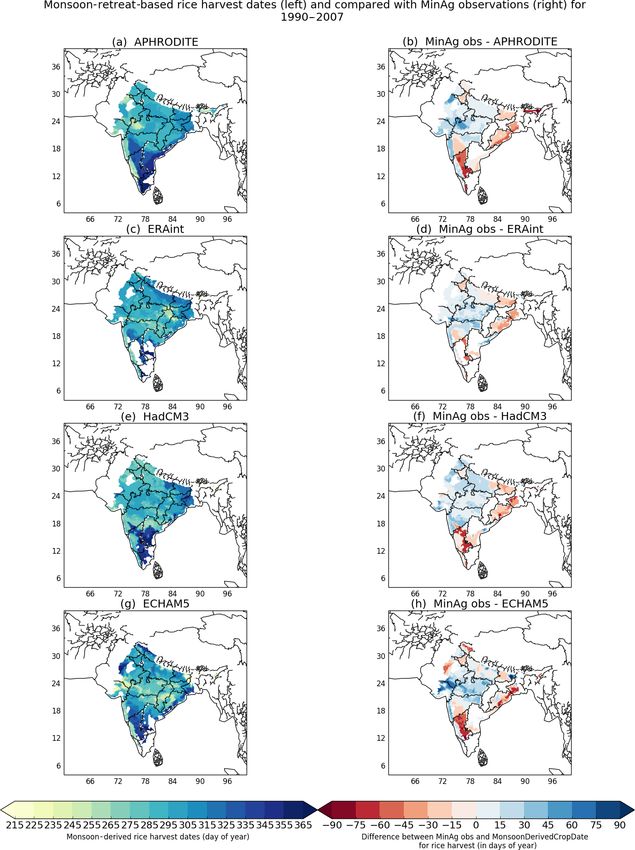
C. Mathison et al.: Estimating sowing and harvest dates based on the Asian summer monsoon                                         567

Figure 2. A flow chart summarizing the methodology. The blue rectangles represent datasets that are used within the methodology, green
rectangles represent observations, and pink rectangles represent any calculation parts of the methodology.

the general hydrology of the region. The monsoon is a highly             ized Pentad Precipitation Index (NPPI) (Lucas-Picher et al.,
variable and complex phenomenon that currently not all cli-              2011). The NPPI and Sperber et al. (2013) methods both
mate models are able to represent; this may mean that some               use a long-term climatological average of precipitation be-
climate models would not yet be suitable for use with this               cause the model data are too noisy to calculate the mon-
method, which relies on a good representation of the mon-                soon statistics per year. Agricultural-specific definitions of
soon. The method presented in Fig. 2 will become more ro-                monsoon onset and retreat represent breaks in the monsoon
bust with improving representations of the monsoon in cli-               which can adversely affect the germination of crops. How-
mate models.                                                             ever, these metrics are not as effective when used in con-
   The datasets used for sowing and harvest dates include a              junction with long-term average precipitation fields such as
global dataset, Sacks et al. (2010), and a regional dataset,             those used here. This is probably because the breaks that
Bodh et al. (2015), from the government of India, Ministry               occur in the monsoon are quite variable from year to year
of Agriculture and Farmers Welfare. The Bodh et al. (2015)               and are smoothed out within the climatology. The approach
data are referred to from here on as MinAg data. The Mi-                 by Sperber et al. (2013) defines monsoon onset as the pen-
nAg observations of sowing and harvest dates for rice and                tad in which the relative rainfall exceeds 5 mm day−1 during
wheat are given as a range of days of year. The midpoints of             the May–September period. However, Sperber et al. (2013)
these observed ranges are calculated and compared against                regrid to the GPCP rainfall dataset (Huffman et al., 2001),
the midpoints of the model pentads for onset and retreat in              which is much coarser resolution than the APHRODITE data
day of year. As a post-processing step the differences are then          used here. The NPPI metric uses Eq. (1) to estimate monsoon
masked using crop areas from the International Crops Re-                 onset, retreat, peak, and duration.
search Institute for the Semi-Arid Tropics (ICRISAT, 2015)                         P − Pmin
so that only the areas where rice or wheat is grown are con-             NPPI =               ,                                     (1)
                                                                                  Pmax − Pmin
sidered.
                                                                         where P is the unsmoothed pentad precipitation climatology
                                                                         and Pmin and Pmax are the annual minimum and maximum
2.2   Estimating monsoon onset and retreat
                                                                         at each grid box respectively. The monsoon onset is then de-
There are a wide variety of metrics for estimating the mon-              fined as the pentad in which the NPPI exceeds 0.618 for the
soon onset and retreat. Some are specific to agriculture and             first time and withdrawal as the last time the NPPI drops be-
include a representation of breaks in the monsoon (Moron                 low this threshold in the year. The NPPI only reaches a value
and Robertson, 2014). More general metrics include a com-                of 1.0 once in the annual cycle, which corresponds to the
bination of meteorological variables, such as 850 hPa wind               monsoon peak. In the NPPI method the only regridding that
and precipitation as in Martin et al. (2000), or only use pre-           takes place is to ensure that the model and observations are
cipitation, such as in Sperber et al. (2013) and the Normal-             on the same grid; as they are both 25 km resolution there is

www.earth-syst-dynam.net/9/563/2018/                                                           Earth Syst. Dynam., 9, 563–592, 2018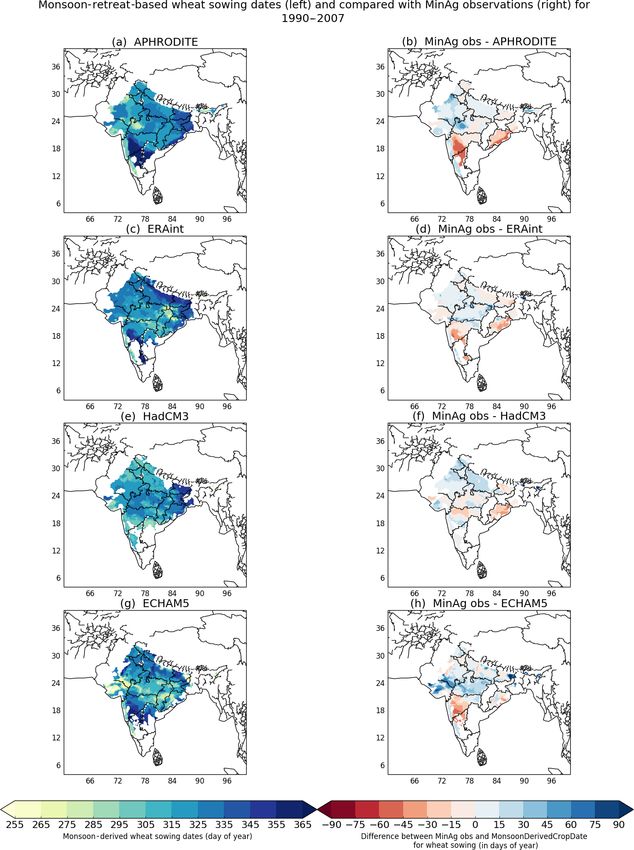
568 C. Mathison et al.: Estimating sowing and harvest dates based on the Asian summer monsoon
no loss of resolution in doing this. The threshold for NPPI is method allows any crop model that uses, for example, a driv-
also independent of the resolution of the data, which is not ing dataset similar to APHRODITE or the HNRCMs to de-
the case for the Sperber et al. (2013) method. The NPPI met- rive sowing and harvest dates that are consistent with the
ric has been successfully applied previously by Lucas-Picher monsoon of the driving data (see Fig. 2). Thus, the crop is
et al. (2011) to analyse the monsoon in models of a similar grown at the appropriate time of the year; i.e rice is kept dur-
resolution to the simulations used here (see Fig. 2). There- ing the monsoon period and wheat is sown and harvested
fore in this analysis in the same way that Lucas-Picher et al. during the dry season. The monsoon is a highly variable
(2011) use the 1981–2000 climatology, we use a 1990–2017 phenomenon; however, the use of a long-term average (cli-
climatology. The pentad provided by the NPPI is represen- matology) to calculate the monsoon statistics smooths out
tative of the climatological period and therefore cannot be their large inter-annual variability. This highlights the con-
compared to a particular year; however, the pentad can be sistency between the sowing and harvest dates and the mon-
used to find the 5-day window for the climatological period soon statistics. Therefore we do not expect the monsoon
during which onset and retreat typically occur, which can statistics to be exactly the same as the observed sowing and
then be compared to APHRODITE observations also aver- harvest dates. Rather, this method relies on consistency be-
aged for that period. We use the NPPI metric to calculate the tween the climatological estimate of the monsoon statistics
pentad of the monsoon onset, retreat, peak, and duration for and the sowing and harvest dates across the region. The in-
the APHRODITE observations and the three HNRCM simu- troduction of a crop rule then moves the monsoon statistic to
lations. more closely reflect the observed sowing and harvest dates.
This means that even if the difference between the most rel-
2.2.1 Comparison of model monsoon onset and retreat
evant monsoon statistic and the observed sowing or harvest
with precipitation observations
date is large then the difference is similar across India. Al-
though these sowing and harvest events may not always be
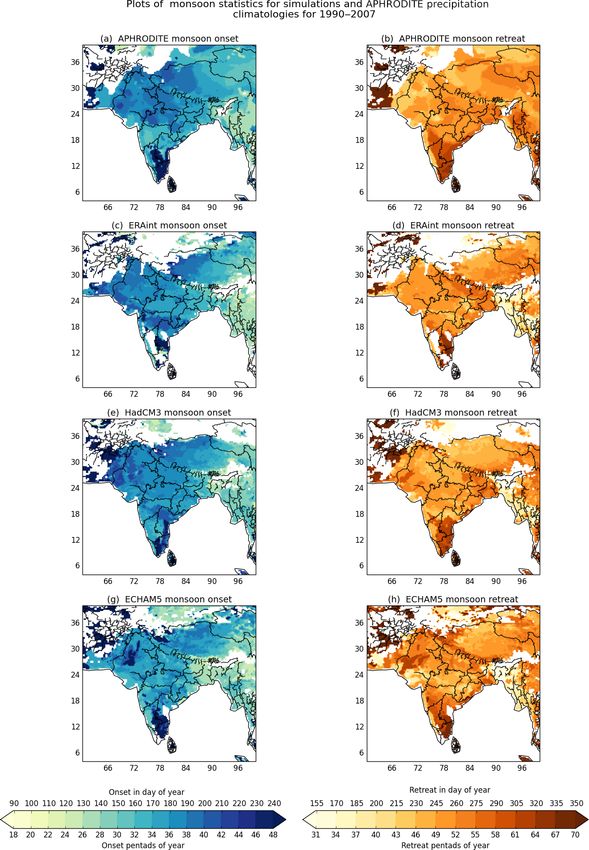
Figure 3 shows plots of the onset (left column) and the re- dictated entirely by the monsoon, the phenomenon provides
treat (right column) of the South Asian summer monsoon as the broader seasonality associated with the crop seasons in
defined using the NPPI described in Sect. 2.2. The NPPIs for this region. The consistency between the crop practices and
the climatology of the APHRODITE precipitation observa- the monsoon statistics across the region provides the empir-
tions (Yatagai et al., 2012) are shown in Fig. 3a and b for ical relationship exploited here to estimate the sowing and
comparison with the precipitation climatology for each of harvest dates for use in both present day and future crop sim-
the HNRCMs shown: ERA-Interim (c and d), HadCM3 (e ulations. These sowing and harvest dates are not really in-
and f), and ECHAM5 (g and h). The white regions are ar- tended to offer advice to farmers on when to sow or harvest
eas where the threshold was exceeded at the first pentad; this on a year to year basis; rather, it provides a way for sowing
implies that the monsoon had already started at the first pen- and harvest dates to remain relevant to this major climatolog-
tad, which suggests a model bias and therefore these regions ical feature. A key assumption is that the monsoon remains
were masked out. Figure 4 shows the differences between the a defining feature of the crop seasons for South Asia in the
model onset (retreat) and APHRODITE onset (retreat) for future.
each model. On average the difference between the monsoon
onset in APHRODITE and the HNRCM simulations is be- 2.3.1 Calculation of monsoon-derived estimates of
tween 1 and 7 days and the difference between the retreat in sowing and harvest dates for rice and wheat
APHRODITE and the HNRCM simulations is between 4 and
10 days. However, there are regions where the differences be- We use the precipitation climatologies from APHRODITE
tween the APHRODITE monsoon statistics are much larger precipitation observations and each of the HNRCM simula-
than this; these are highlighted by the darker red and blue re- tions (see Fig. 2) by calculating the difference between the
gions in Fig. 4. In general for most of India the HNRCMS are monsoon onset (or retreat) and the observed MinAg sowing
within 25 days of the APHRODITE observations, with the re- (or harvest) dates for each crop (see Fig. 2). These differences
gions where the differences are larger explained by different are per grid box. We then calculate a weighted area average
monsoon characteristics, for example the south of India and (using the Met Office, 2018, package) to produce a crop rule
the Bangladesh region (this is discussed further in Sect. 4.1). for the whole region for each crop and stage; these are listed
in Eq. (2). Collectively, the crop rules given in Eq. (2) are re-
ferred to as RelMonsooncroprule . This provides a simple rule
2.3 Calculating sowing and harvest dates from that can be applied across the region, even where observa-
monsoon characteristics tions are not available. Although calculating a rule per grid
We use estimates of the monsoon onset and retreat together box would provide excellent results where observations were
with present day rules on sowing and harvest for rice and available, it would limit the usefulness of the method where
wheat, referred to as crop rules, to calculate the sowing observations were not available, which is one of the main
and harvest dates relative to the monsoon (see Fig. 2). This aims of this approach.
Earth Syst. Dynam., 9, 563–592, 2018 www.earth-syst-dynam.net/9/563/2018/
C. Mathison et al.: Estimating sowing and harvest dates based on the Asian summer monsoon                                                569

Figure 3. Plots of the 1990–2007 monsoon statistics; monsoon onset (a, c, e, g) and retreat (b, d, f, h). The APHRODITE precipitation
observations (a and b) are shown and the three model simulations, ERA-Interim (c and d), HadCM3 (e and f), and ECHAM5 (g and h), are
calculated using the NPPI metric. White areas are the regions where the model precipitation exceeds the threshold, indicating the start of the
monsoon at the initial pentad; this does not imply early monsoon but more likely a model bias in the precipitation at this location.

www.earth-syst-dynam.net/9/563/2018/                                                            Earth Syst. Dynam., 9, 563–592, 2018
570                          C. Mathison et al.: Estimating sowing and harvest dates based on the Asian summer monsoon

Figure 4. Plots of the 1990–2007 difference between model simulations and APHRODITE observations for the monsoon statistics; monsoon
onset (a, c, e) and retreat (b, d, f); ERA-Interim (a and b), HadCM3 (c and d), and ECHAM5 (e and f) calculated using the NPPI metric.

Earth Syst. Dynam., 9, 563–592, 2018                                                        www.earth-syst-dynam.net/9/563/2018/
C. Mathison et al.: Estimating sowing and harvest dates based on the Asian summer monsoon                                      571

                                                                  2.4    Demonstration using monsoon-derived estimates of
                                                                         sowing and harvest dates for two future periods
  RiceSowing Croprule = AreaAverage(MonsoonOnset
                                                                  The method summarized in Fig. 2 is applied to two future
                         − RiceSowing)
                                                                  periods using the ECHAM5 and HadCM3 RCM simulations
  RiceHarvest Croprule = AreaAverage(MonsoonRetreat               (described in Appendix A). Global mean temperatures are
                         − RiceHarvest)                           used (within the High-End cLimate Impacts and eXtremes
WheatSowing Croprule = AreaAverage(MonsoonRetreat                 project, HELIX) to define the future climate in terms of spe-
                                                                  cific warming levels (SWLs), i.e considering a 2, 4, and 6 ◦ C
                         − WheatSowing)
                                                                  world. The use of time periods is much more common than
WheatHarvest Croprule = AreaAverage(MonsoonOnset                  SWLs; however, SWLs enable the analysis to focus less on
                         − WheatHarvest)                   (2)    the climate scenarios and more on what the world will look
                                                                  like at 2, 4, and 6 ◦ C (Gohar et al., 2017). This will differ de-
   The RelMonsooncroprule is then applied to the monsoon on-      pending on when the threshold is passed. The SWL approach
set and retreat field to provide an estimate of sowing and har-   is therefore a benefit as it means that new scenarios that are
vest dates for rice and wheat based on the monsoon. We refer      developed as part of new model intercomparison projects can
to these estimates of sowing and harvest dates as “monsoon-       be compared against older ones from previous projects. Al-
derived crop dates” for brevity.                                  though the older scenarios may not contain the most up-to-
                                                                  date socio-economic information, they are no less likely than
                                                                  the newer scenarios. The simulations used here are for the pe-
MonsoonDerivedCropDate = MonsoonStatistic
                                                                  riod 1965 to 2100 and therefore only the 2 ◦ C threshold for
                            − RelMonsooncroprule ,         (3)    global mean temperature is actually passed during these sim-
                                                                  ulations. For HadCM3 this occurs in 2047 and for ECHAM5,
where the MonsoonStatistic can be monsoon onset or retreat
                                                                  2055. Therefore the two future periods used in this analy-
and the RelMonsooncroprule is one of the four crop rules given
                                                                  sis are 2040–2057 and 2080–2097. The 2040–2057 period is
in Eq. (2).
                                                                  chosen because it includes the year that the global mean tem-
   The spatial variability of the monsoon-derived sowing
                                                                  perature exceeds 2 ◦ C in the two simulations, and the 2080–
and harvest dates is accounted for by the monsoon on-
                                                                  2097 period is chosen because it is furthest into the future
set and retreat in the climatology used to calculate the
                                                                  in these simulations and therefore likely to show the great-
RelMonsooncroprule . The monsoon-derived sowing and har-
                                                                  est warming. The length of the two future analysis periods
vest dates for both the APHRODITE and HNRCM simula-
                                                                  has been chosen for consistency with the ERA-Interim RCM
tions are provided and compared against MinAg observed
                                                                  simulation, which is only available for the period 1990–2007.
sowing and harvest dates in Sect. 3.2. The calculation of the
                                                                  Although the threshold of 2 ◦ C is exceeded globally it is im-
RelMonsooncroprule is based on observations for India (from
                                                                  portant to note that the relationship between the projected
MinAg and ICRISAT, 2015) and therefore the analysis for
                                                                  global mean change in temperature and the regional climate
the present day in Sect. 3.2 focuses on these areas. Because
                                                                  change in temperature for South Asia is complicated. Heat
most of the South Asia region is dominated by the ASM,
                                                                  and moisture and how they vary across the globe are not
the RelMonsooncroprule , though tuned using India observa-
                                                                  evenly distributed, with land warming faster than the ocean
tions, can be applied to any region dominated by the ASM
                                                                  (Christensen et al., 2013); therefore the actual temperature
in order to estimate sowing and harvest dates for larger ar-
                                                                  change experienced in South Asia may be higher than the
eas with a rice–wheat rotation (see Sect. 3.3). The method
                                                                  global mean change.
does not currently perform as well for parts of southern India
where the climate is influenced by the North-east Monsoon
but could be modified to provide better results for these ar-     3     Results
eas. In Sect. 3.2, we compare the monsoon-derived estimates
of sowing and harvest dates for the period 1990–2007 with         We compare the model monsoon to the monsoon calcu-
the MinAg range of sowing and harvest dates to establish if       lated from precipitation observations to demonstrate that the
the method shown in Fig. 2 gives good results. There are four     model is able to reproduce the monsoon (see Sect. 2.2.1);
datasets used throughout this analysis: APHRODITE and the         therefore the methodology summarized in Fig. 2 and Sect. 2
three HNRCMS. Where three of the four datasets provide            is viable. In Sect. 3.1 we compare the simulated monsoon
sowing or harvest dates that are within the MinAg range,          with the observed sowing and harvest dates in order to cal-
the method is said to give good results; where two of the         culate the monsoon-derived sowing and harvest dates and
four datasets are within the MinAg range, the results from        compare these new simulated sowing and harvest dates with
the method are said to be fair. If no datasets are within the     the observations. We then show results from applying the
MinAg range, the method is classed as poor. The sowing and        method in Sect. 3.2. As a demonstration, we also apply the
harvest dates are presented for each state in Sect. 3.2.          method to two future periods in Sect. 3.3.

www.earth-syst-dynam.net/9/563/2018/                                                   Earth Syst. Dynam., 9, 563–592, 2018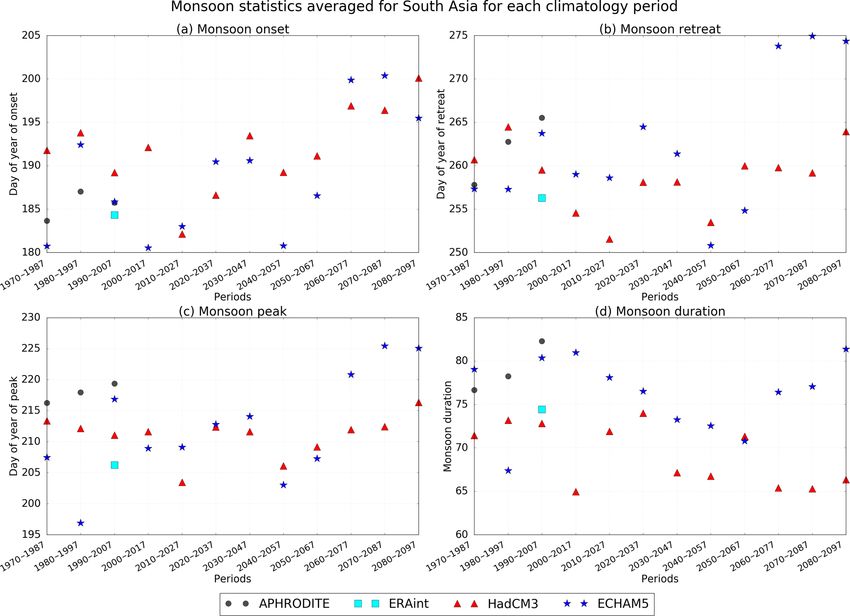
572 C. Mathison et al.: Estimating sowing and harvest dates based on the Asian summer monsoon
Table 1. Table of RelMonsooncroprule for each dataset, crop, and a “miss” (shown by the red regions). The yellow regions in
stage. The RelMonsooncroprule is the value subtracted from the Fig. 6 show the places where the monsoon onset overlaps
monsoon onset and retreat in order to calculate a new sowing or har- the range of observed sowing days but does not completely
vest date based on the monsoon onset and retreat. In each case the fall within it; these regions are labelled “overlaps”. Figure 6
new estimate of the sowing and harvest dates is calculated by sub- has only a small area of red indicating that monsoon onset
tracting the RelMonsooncroprule from the Monstat , where Monstat is
is, for large parts of India, within the range of days of rice
monsoon onset or monsoon retreat from HNRCM or APHRODITE
precipitation observations. Where the sowing or harvest is before
sowing. In each plot shown in Fig. 6 the region that is red
the monsoon statistic, the crop rule is in bold with normal type in- or yellow is different, and this makes it difficult to say if one
dicating that sowing or harvest occurs after the monsoon statistic. dataset is better than another. ECHAM5 appears to have the
smallest total area in red or yellow, which is probably be-
Crop Stage Monstat Source RelMonsooncroprule cause ECHAM5 tends to have an earlier onset than the other
(India average) datasets and in general that makes it closer to the rice sow-
Wheat Sowing Retreat APHRODITE −63.5 ing dates. Table 1 lists the differences between the monsoon
Wheat Sowing Retreat ERA-Interim −62.8 statistics (onset and retreat) and the relevant sowing and har-
Wheat Sowing Retreat HadCM3 −67.9 vest dates for each crop calculated for each of the simula-
Wheat Sowing Retreat ECHAM5 −63.6 tions and the APHRODITE observations and averaged for
Wheat Harvest Onset APHRODITE 98.5 India. Table 1 shows that on average across India rice sowing
Wheat Harvest Onset ERA-Interim 100.4 occurs between 10 and 20 days prior to the averaged mod-
Wheat Harvest Onset HadCM3 98.9 elled monsoon onset (third block, Table 1). We would not
Wheat Harvest Onset ECHAM5 91.4 expect the different datasets to give the same results; how-
Rice Sowing Onset APHRODITE 19.7 ever, Table 1 shows that they are relatively consistent with
Rice Sowing Onset ERA-Interim 17.3 each other and, importantly, with observations as illustrated
Rice Sowing Onset HadCM3 17.2 by the APHRODITE data. Table 1 highlights the fact that
Rice Sowing Onset ECHAM5 10.1
on average APHRODITE requires a larger crop rule than the
Rice Harvest Retreat APHRODITE −32.7 simulations for rice sowing; however, this is not always the
Rice Harvest Retreat ERA-Interim −35.4 case for sowing or harvest and rice or wheat. The crop rules
Rice Harvest Retreat HadCM3 −38.5
Rice Harvest Retreat ECHAM5 −34.7
used here are based on the 1990–2007 period for which ERA-
Interim has the earliest onset (see Fig. 10). ECHAM5 has the
smallest crop rule to move it towards the rice sowing date but
the highest variance in the mean difference between the mon-
3.1 Comparing observed sowing and harvest dates with soon onset and the MinAg rice sowing date. APHRODITE
estimates of monsoon onset and retreat has the largest crop rule for rice sowing, indicating that the
weighted average of the APHRODITE monsoon onset is fur-
The climatology in Fig. 1 shows that on average the observed ther from the rice sowing date than for other datasets.
rice and wheat sowing and harvest dates from MinAg align In general the differences between rice harvest and mon-
well with the monsoon onset and retreat in the simulations. soon retreat are larger but still consistent across the re-
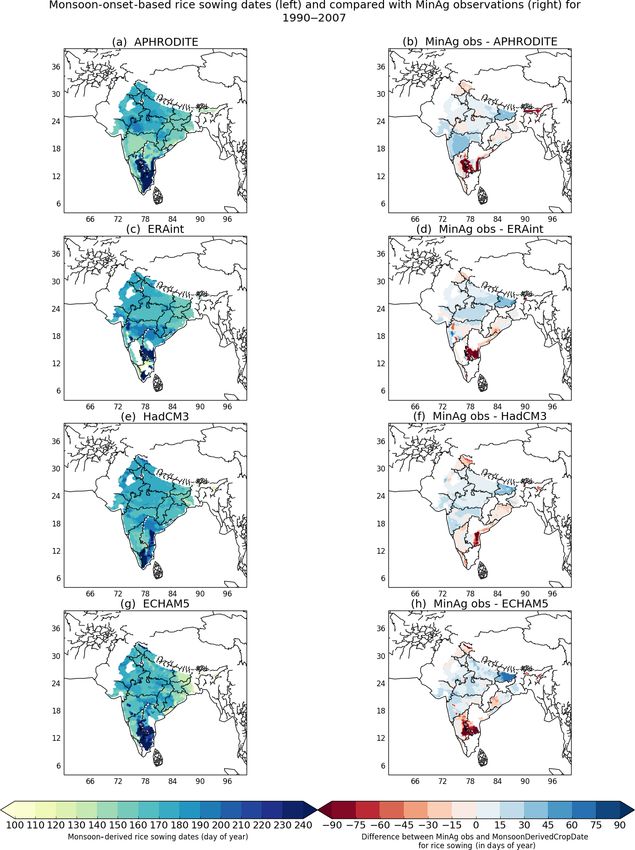
Observed rice sowing dates generally compare well with the gion (see Fig. B1), with rice harvest occurring on aver-
monsoon onset in the model as shown in Figs. 5 and 6. age 30–40 days after monsoon retreat (see fourth block,
The monsoon onset and retreat estimates are provided Table 1). Wheat sowing tends to occur approximately 60–
in days of year (pentads) and therefore with a range of plus 70 days after monsoon retreat (see Fig. B2 and first block,
or minus 2.5 days. The MinAg observations are also pro- Table 1) and wheat harvest tends to occur approximately
vided in days of year with a range that varies from plus or 90–101 days before monsoon onset (see Fig. B3 and second
minus 15 days depending on the location. Figure 8 shows block Table 1). These values (given in Table 1) provide the
the range of the MinAg sowing and harvest observations for RelMonsooncroprule values introduced in Sect. 2.3.1 used to
each state; the full sowing or harvest window is shown by the adjust the monsoon statistics and calculate the new sowing
downward grey triangles, with the midpoints shown by black and harvest dates based on the monsoon. There are small re-
triangles joined by a black line. Figure 6 considers the mid- gions with different monsoon characteristics and therefore
points of these two ranges in order to summarize how well much earlier sowing days, for example for rice sowing in the
aligned the monsoon onset range is to the observed range of southern and far north of India. These regions have a direct
rice sowing dates, i.e. how the 5-day onset windows coin- impact on the values (minimum, maximum, mean, and stan-
cide with the observed sowing window. If the monsoon onset dard deviation) given in Table 2, which are averages for the
range is completely within the range of sowing days provided whole of India and are discussed in more detail in Sect. 4.
by the observations, this is classed as a “hit” (shown by the Figure 1 highlights the fact that the average sowing and har-
blue regions). If the monsoon onset range is completely out- vest dates for rice and wheat are closely aligned with the
side the range of observed sowing days, this is classed as monsoon precipitation from all three RCM simulations.
Earth Syst. Dynam., 9, 563–592, 2018 www.earth-syst-dynam.net/9/563/2018/C. Mathison et al.: Estimating sowing and harvest dates based on the Asian summer monsoon 573
Figure 5. Plots of the difference between the midpoint of the monsoon onset in the model and the midpoint of the observed rice sowing
period for 1990–2007.
3.2 Monsoon-derived estimates of sowing and harvest the monsoon-derived estimates and the MinAg observations
dates for rice and wheat across the region. On average the monsoon-derived estimates
of sowing and harvest dates are within 4 days of the mid-
The monsoon-derived sowing and harvest dates are calcu- points for the sowing and harvest dates for rice and within
lated by applying the RelMonsooncroprule for each model (see 7 days of the midpoints for sowing and harvest dates for
Table 1) to the simulated monsoon onset and retreat fields wheat. There is some variation across India with some re-
(see Fig. 2). Here we compare these with the gridded obser- gions showing larger differences, but generally the monsoon-
vations to see how well the method performs for the present derived estimates for sowing and harvest dates are within the
day. The monsoon-derived sowing and harvest dates are com- range provided by the observations across much of the region
pared with the MinAg observations using regional maps and for both crops.
an analysis for each state area in order to show the differences Figure 8 shows the average crop duration for each state
in the method across India. where MinAg observations were available for the 1990 to
Figure 7 shows the monsoon-derived estimates of rice 2007 period alongside the crop duration for each of the four
sowing dates (left column) compared with MinAg observa- sets of monsoon-derived estimates using the Fig. 2 method.
tions (right column). Figure C1 shows the same plots for rice In the majority of states shown in Fig. 8 the sowing and har-
harvest, with plots for wheat shown in Figs. C2 and C3 for vest dates calculated using the Fig. 2 method were within the
sowing and harvest respectively. The RelMonsooncroprule val- range of the MinAg observations for rice and wheat sowing
ues for wheat for both sowing and harvest are much larger and harvest dates; however, the overall performance was bet-
than those for rice, but there is still good agreement between
www.earth-syst-dynam.net/9/563/2018/ Earth Syst. Dynam., 9, 563–592, 2018574 C. Mathison et al.: Estimating sowing and harvest dates based on the Asian summer monsoon Figure 6. The comparison of the model monsoon onset in terms of the days of the year (to within the pentad) and the range of days of the year for the observed sowing date for rice. This is shown in terms of hit (blue) and overlap (yellow); if there was no overlap this is shown as a miss (red). ter for rice compared with wheat and sowing compared with MinAg data as shown in Fig. 8, the results of the method are harvest in each crop. Figure 8 also highlights the difference said to be “good” for a state. The results of the method are in both the observed and simulated crop duration between said to be “fair” where two datasets are within the range of the two crops with rice having a shorter season than wheat. the MinAg data and “poor” where the sowing and harvest In general across most of the states with available data the dates fall outside the observed range. In this analysis only method provides a reasonable estimate of the sowing date, the state of Assam did not have any “good” scores for rice or harvest date, and crop duration. Even where the method does wheat sowing or harvest. Most of the scores for most states not quite capture the observed sowing and harvest dates, the for sowing and harvest as well as wheat and rice had a score method is often just outside the observed range. of good or fair. In order to establish how well the method performs overall, In general the regions where the monsoon-derived sowing we use Fig. 8 to assess if the results using the method are and harvest dates are not as close to the MinAg observations good, poor, or fair compared to the MinAg data. Where the tend to be the states in the south, such as Andhra Pradesh and monsoon-derived sowing and harvest dates from three of the Karnataka, or to the north of India, such as Jammu and Hi- four datasets using the method are within the range of the machal Pradesh. This is supported by the maps, particularly Earth Syst. Dynam., 9, 563–592, 2018 www.earth-syst-dynam.net/9/563/2018/
C. Mathison et al.: Estimating sowing and harvest dates based on the Asian summer monsoon 575
Table 2. Analysis of the differences between the midpoints of the MinAg data and monsoon onset and retreat for rice and wheat sowing or
harvest dates: the table shows the minimum, maximum, mean, and standard deviation (SD) averaged across South Asia where wheat or rice
is planted.
Crop Stage Monsoon stat Source Min Max Mean SD
Wheat Sowing Retreat APHRODITE −122.0 53.0 −63.5 23.6
Wheat Sowing Retreat ERA-Interim −160.0 36.0 −62.8 19.8
Wheat Sowing Retreat HadCM3 −185.0 33.0 −67.9 26.7
Wheat Sowing Retreat ECHAM5 −187.5 53.0 −63.6 34.6
Wheat Harvest Onset APHRODITE 32.5 216.5 98.5 26.5
Wheat Harvest Onset ERA-Interim 22.0 216.5 100.4 26.8
Wheat Harvest Onset HadCM3 −3.0 216.5 98.9 23.0
Wheat Harvest Onset ECHAM5 −18.0 217.5 91.4 33.7
Rice Sowing Onset APHRODITE −24.5 156.5 19.7 32.8
Rice Sowing Onset ERA-Interim −49.5 196.5 17.3 30.5
Rice Sowing Onset HadCM3 −40.0 226.5 17.2 25.4
Rice Sowing Onset ECHAM5 −65.0 186.5 10.1 36.7
Rice Harvest Retreat APHRODITE −91.5 110.5 −32.7 30.4
Rice Harvest Retreat ERA-Interim −116.5 73.5 −35.4 23.3
Rice Harvest Retreat HadCM3 −111.5 78.5 −38.5 29.3
Rice Harvest Retreat ECHAM5 −141.5 98.5 −34.7 35.9
for rice for these regions (in Figs. 7 and C1), which show that Fig. 10 in which each statistic has been averaged for South
the method does not perform as well for some of these states. Asia. Each point in Fig. 10 represents a 17-year time slice
These differences may be explained by the differing mon- from between 1970 and 2097 for each of the APHRODITE,
soon characteristics in these regions compared to the rest of ECHAM5, HadCM3, and ERA-Interim datasets. Figure 10
India; these are highlighted in Fig. 3 and discussed further in supports the points made regarding the spatial plots and also
Sects. 3.1 and 4. Assam in the north-east of India is also no- shows how the four monsoon statistics change between the
ticeable compared with the other states in Fig. 8, with the rice 17-year time slices. The 2040–2057 period has a much ear-
crop season in the MinAg data displaced to an earlier part of lier onset for ECHAM5 than all the other periods except the
the year. Assam tends to plant predominantly rice with three 2000–2017 period, which is similar (see Fig. 10a). For most
distinct rice seasons (autumn, winter, and summer) rather of the periods ECHAM5 has an earlier onset than HadCM3;
than a rice–wheat rotation (Sharma and Sharma, 2015). In this is also true of the retreat (see Fig. 10b), but the duration
this analysis we use data for the Kharif paddy rice crop from is usually longer for ECHAM5 compared with HadCM3 (see
the MinAg dataset, which is planted and harvested earlier in Fig. 10d).
Assam than in other states, with sowing in February–March In order to illustrate the method for deriving sowing and
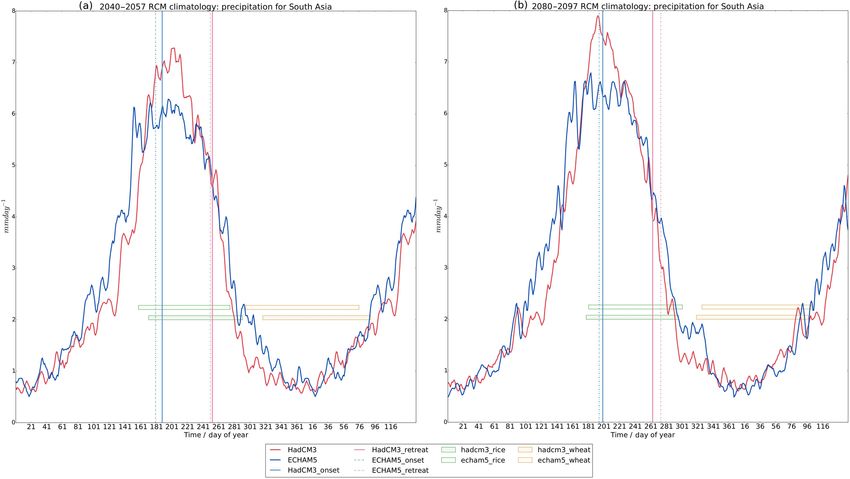
and harvest in June–July (Bodh et al., 2015). harvest dates, Fig. 11 shows the annual cycle of precipitation
averaged for South Asia for the two future periods (panel
a shows 2040–2057 and panel b shows 2080–2097) in the
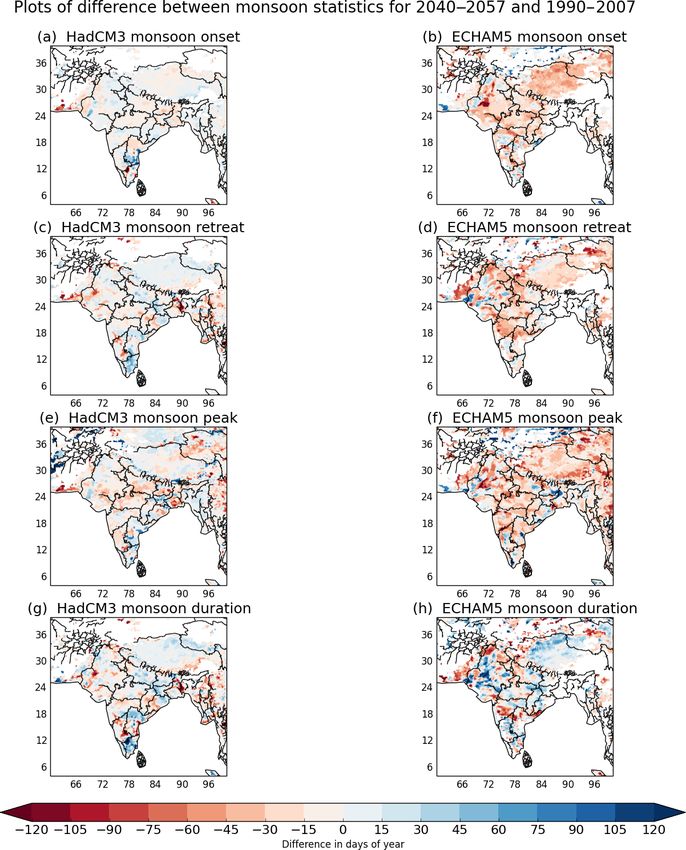
3.3 Analysis of future monsoon onset and retreat same way as the present day is shown in Fig. 1. The crop
As a demonstration of the method summarized in Fig. 2, the sowing and harvest dates used to provide the growing sea-
HELIX SWLs (described in Sec.2.4) are used to select two son durations in each of the plots shown in Fig. 11 for each
future periods: 2040–2057 and 2080–2097. Considering only of the simulations are calculated using the method described
these future periods, spatially HadCM3 and ECHAM5 show in Fig. 2. This shows that the proposed method provides an
quite different future climates. HadCM3 shows a similar on- estimate of sowing and harvest dates that ensures the crops
set to the present day for 2040–2057 (see Fig. 9a and c) but a can continue to be grown in the simulation when the climate
later onset compared with the present day for 2080–2097 (see is most appropriate rather than being fixed to the present day
Fig. D1a and c). ECHAM5 shows an earlier onset compared observed values.
with the present day for the 2040–2057 period (see Fig. 9b
and d) but much later for the 2080–2097 period (see Fig. D1b 4 Discussion
and d). This suggests high variability in monsoon onset in
these simulations. In fact, monsoon onset, peak, retreat, and Recent climate impact studies such as AgMIP (Rosenzweig
duration all show a large degree of variability as shown in et al., 2013, 2014) and ISIMIP (Warszawski et al., 2013,
www.earth-syst-dynam.net/9/563/2018/ Earth Syst. Dynam., 9, 563–592, 2018576 C. Mathison et al.: Estimating sowing and harvest dates based on the Asian summer monsoon Figure 7. The monsoon-derived rice sowing dates (a, c, e, g) and the difference between the MinAg observations and the monsoon-derived rice sowing dates (b, d, f, h) for the period 1990–2007. 2014) have highlighted the importance of reliable input data regions where data are scarce, unreliable, or unavailable such for models. Section 1 highlights the scale of the uncertain- as in future climate simulations. The future results are dis- ties present when solely using a global sowing and har- cussed further in Sect. 4.2. vest dataset to simulate region-specific cropping patterns. We have therefore proposed a new method for generating sow- 4.1 Present day analysis ing and harvest dates for South Asia based on the ASM. The method reproduces observed sowing and harvest dates In general the method described by Fig. 2 works well across for much of India, and these results are discussed further in most of India for the present day, with the monsoon-derived Sect. 4.1. This method will also be useful in other monsoon estimates of sowing and harvest dates falling within the range Earth Syst. Dynam., 9, 563–592, 2018 www.earth-syst-dynam.net/9/563/2018/
C. Mathison et al.: Estimating sowing and harvest dates based on the Asian summer monsoon                                              577

Figure 8. The state averaged durations for rice (upper panel) and wheat (lower panel) for each dataset are shown by the lines for each state
together with the sowing and harvest dates shown by the different shapes at the end of each line. The MinAg observations are shown by
the black line and downward triangles, with the paler triangles representing the full range of sowing and harvest days for that state. The
APHRODITE observations are also shown by black lines and filled circles for the sowing and harvest dates. ERA-Interim is shown by cyan
lines and squares, ECHAM5 by blue lines and asterisks, and HadCM3 by red lines and upward triangles.

of days for sowing given by the observations and therefore              more important for water resources for this part of India than
providing a good estimate of the crop duration for most states          the ASM, which accounts for approximately 30 % of the an-
(see Fig. 8). However, there are regions where the estimated            nual rainfall for this region (Dhar et al., 1982). These dif-
sowing and harvest dates do not compare as well against                 fering monsoon characteristics mean that different agricul-
present day observations. Rice sowing is generally closely              tural practices are required to cultivate rice in this part of the
associated with ASM onset across most of central India;                 country. This is illustrated by Fig. 12a, which shows that the
however, in the south of India there is a small region where            southern region of India with differing monsoon characteris-
the differences between the observations of sowing dates and            tics irrigates rice more intensively than other parts of India.
the monsoon are larger than everywhere else (see Fig. 5).               In the Tamil Nadu region, rivers are usually dry except dur-
In Sect. 3.1 this region is shown to have different monsoon             ing the monsoon months and the flat gradients mean there
characteristics to the rest of India. This part of India includes       are few locations for building reservoirs; therefore approx-
the state of Tamil Nadu, which is located on the lee side of            imately one-third of the paddy rice crop is irrigated from a
the Western Ghats and therefore does not receive the large              large network of water tanks (Anbumozhi et al., 2001). The
amount of ASM rainfall that is commonly associated with                 southern states of India have the highest density of irrigation
this part of the world. Tamil Nadu receives up to 50 % of               tanks with large numbers also found in Andhra Pradesh and
its annual rainfall during October–December via the less sta-           Karnataka; these are also regions shown to have a high ir-
ble North-east (NE) Monsoon. The NE Monsoon is therefore                rigation intensity in Fig. 12. Rice harvest is typically not as

www.earth-syst-dynam.net/9/563/2018/                                                           Earth Syst. Dynam., 9, 563–592, 2018
578                         C. Mathison et al.: Estimating sowing and harvest dates based on the Asian summer monsoon

Figure 9. The difference between the monsoon statistics for the 2040–2057 future period and the present day 1990–2007 for
HadCM3 (a, c, e, g) and ECHAM5 (b, d, f, h).

closely associated with the monsoon onset as rice sowing,       for most of India, it would be useful and interesting to ex-
which usually requires the monsoon to be fully established      tend this method to improve it for the south of India.
before planting.
   The widespread irrigation of wheat shown in Fig. 12b
                                                                4.2   Future analysis
has less of an impact on the estimates of wheat sowing and
harvest dates because this crop is less closely linked to the   The analysis of the future monsoon onset, retreat, peak, and
monsoon onset than rice. Therefore the regional differences     duration shown in Sect. 3.3 shows how changeable the ASM
between the MinAg observations and the monsoon-derived          is for these simulations between time periods. Christensen
sowing and harvest dates for wheat are not as large as some     et al. (2013) show that there is a high model agreement
of those for rice (see Sect. 3.2). Given that the method has    within the ensemble from the Coupled Model Intercompar-
provided reasonable estimates of sowing and harvest dates       ison Project Phase 5 (CMIP5) for an earlier onset and later
                                                                withdrawal in the future that therefore indicates a lengthen-

Earth Syst. Dynam., 9, 563–592, 2018                                               www.earth-syst-dynam.net/9/563/2018/
C. Mathison et al.: Estimating sowing and harvest dates based on the Asian summer monsoon 579
Figure 10. Monsoon statistics: onset (a), retreat (b), peak (c), and duration (d) averaged for South Asia for 12 total 17-year time slices
between 1970 and 2097 to provide a time series of values for the region to assess the variability of the monsoon.
ing monsoon duration. However, the simulations presented is a key benefit of using this method as it simulates the de-
here do not show this with Fig. 10, instead highlighting the cision a farmer might take to sow before the usual observed
large amount of variability in the ASM for this region. It is date if the monsoon arrived early. This method therefore pro-
possible that an increase in the monsoon duration does occur vides the capability for climate simulations to replicate the
in these simulations for some parts of South Asia, but this type of adaptation response that would happen in the real
detail is lost through averaging over the region or as a result world. This method would also be useful for other regions
of the time periods selected. Christensen et al. (2013) also that have a crop calendar that is similarly defined such as
suggest that there is medium confidence within the CMIP5 the SSA; this is a multiple cropping region with sowing and
ensemble that the ASM rainfall will increase to the end of the harvest dates closely associated with the main rainy season
century. The simulations presented do indicate this as shown (Waha et al., 2013).
by the time series in Fig. 13.
Assuming that crops continue to be grown in accordance
5 Conclusions
with the monsoon, Sect. 3.3 shows that the method described
in Sect. 2 provides a good estimate of sowing and harvest Sowing and harvest dates are an important input within crop
dates for the two future periods shown. Spatial plots of the models but are a source of considerable uncertainty. Global
sowing and harvest dates for the two future periods (not datasets, such as Sacks et al. (2010), cannot always distin-
shown) are similar to those in Sect. 3.2 for the present day guish when wheat is grown in tropical and subtropical re-
with the south of the Indian peninsula continuing to show gions, therefore driving a requirement for higher-resolution
different monsoon characteristics (see Sect. 4.1) to the rest regional datasets. Crops across much of South Asia are heav-
of India in the future, resulting in later estimated sowing and ily dependent on the ASM and therefore sowing and harvest
harvest dates for this region. dates tend to be closely linked to this climatological phe-
The proposed method successfully adjusts the sowing and nomenon. We have therefore presented a new method for de-
harvest dates when the monsoon begins earlier in the future riving sowing and harvest dates for rice and wheat for South
simulations and therefore provides a good estimate of sowing Asia from the ASM onset and retreat. For the present day,
and harvest dates for the two future periods considered. This the method generally shows good results for most areas of
www.earth-syst-dynam.net/9/563/2018/ Earth Syst. Dynam., 9, 563–592, 2018You can also read