Accelerometer informed time-energy budgets reveal the importance of temperature to the activity of a wild, arid zone canid
←
→
Page content transcription
If your browser does not render page correctly, please read the page content below
Tatler et al. Movement Ecology      (2021) 9:11
https://doi.org/10.1186/s40462-021-00246-w

 RESEARCH                                                                                                                                            Open Access

Accelerometer informed time-energy
budgets reveal the importance of
temperature to the activity of a wild, arid
zone canid
Jack Tatler1* , Shannon E. Currie2, Phillip Cassey1, Anne K. Scharf3, David A. Roshier4 and Thomas A. A. Prowse5

  Abstract
  Background: Globally, arid regions are expanding and becoming hotter and drier with climate change. For
  medium and large bodied endotherms in the arid zone, the necessity to dissipate heat drives a range of
  adaptations, from behaviour to anatomy and physiology. Understanding how apex predators negotiate these
  landscapes and how they balance their energy is important as it may have broad impacts on ecosystem function.
  Methods: We used tri-axial accelerometry (ACC) and GPS data collected from free-ranging dingoes in central
  Australia to investigate their activity-specific energetics, and activity patterns through time and space. We classified
  dingo activity into stationary, walking, and running behaviours, and estimated daily energy expenditure via activity-
  specific time-energy budgets developed using energy expenditure data derived from the literature. We tested
  whether dingoes behaviourally thermoregulate by modelling ODBA as a function of ambient temperature during
  the day and night. We used traditional distance measurements (GPS) as well as fine-scale activity (ODBA) data to
  assess their daily movement patterns.
  Results: We retrieved ACC and GPS data from seven dingoes. Their mass-specific daily energy expenditure was
  significantly lower in summer (288 kJ kg− 1 day− 1) than winter (495 kJ kg− 1 day− 1; p = 0.03). Overall, dingoes were
  much less active during summer where 91% of their day was spent stationary in contrast to just 46% during winter.
  There was a sharp decrease in ODBA with increasing ambient temperature during the day (R2 = 0.59), whereas
  ODBA increased with increasing Ta at night (R2 = 0.39). Distance and ODBA were positively correlated (R = 0.65) and
  produced similar crepuscular patterns of activity.
  Conclusion: Our results indicate that ambient temperature may drive the behaviour of dingoes. Seasonal
  differences of daily energy expenditure in free-ranging eutherian mammals have been found in several species,
  though this was the first time it has been observed in a wild canid. We conclude that the negative relationship
  between dingo activity (ODBA) and ambient temperature during the day implies that high heat gain from solar
  radiation may be a factor limiting diurnal dingo activity in an arid environment.
  Keywords: Behaviour, Dingo, Energy expenditure, ODBA, Temperature, Time-energy budget

* Correspondence: jack.tatler@gmail.com
1
 Invasion Science & Wildlife Ecology Lab, University of Adelaide, Adelaide, SA
5005, Australia
Full list of author information is available at the end of the article

                                         © The Author(s). 2021 Open Access This article is licensed under a Creative Commons Attribution 4.0 International License,
                                         which permits use, sharing, adaptation, distribution and reproduction in any medium or format, as long as you give
                                         appropriate credit to the original author(s) and the source, provide a link to the Creative Commons licence, and indicate if
                                         changes were made. The images or other third party material in this article are included in the article's Creative Commons
                                         licence, unless indicated otherwise in a credit line to the material. If material is not included in the article's Creative Commons
                                         licence and your intended use is not permitted by statutory regulation or exceeds the permitted use, you will need to obtain
                                         permission directly from the copyright holder. To view a copy of this licence, visit http://creativecommons.org/licenses/by/4.0/.
                                         The Creative Commons Public Domain Dedication waiver (http://creativecommons.org/publicdomain/zero/1.0/) applies to the
                                         data made available in this article, unless otherwise stated in a credit line to the data.
Tatler et al. Movement Ecology   (2021) 9:11                                                                   Page 2 of 12

Introduction                                                    limited understanding of how physiological capacities
Movement is the primary contributor to active energy            and environmental variables affect their movement and
expenditure in most vertebrates [1–3]. Animals move to          use of space.
improve their individual fitness through, for example,             It has been suggested that an individual’s maximal en-
access to food resources, to avoid predators, or to find        ergy expenditure may be constrained by their ability to
mates. Underlying these behaviours is the need to               dissipate heat [22] and therefore bodily processes that
balance energy acquisition and expenditure, which ul-           generate heat (e.g., movement, digestion etc.) trade-off
timately determines an animal’s behaviour and location          within a total limit defined by heat dissipation capacity.
in the landscape [4–6]. In addition, variation in the land-     For large (> 10 kg) mammals in arid regions, the ability
scape structure such as substrate, vegetation type, and         to lose heat is limited by low surface area to volume ra-
elevation will have varying movement costs [7, 8]. Given        tios and thus cooling can be slow [23]. This is increas-
that animals tend not to position themselves randomly           ingly important to understand in the wake of global
[5, 9–11], understanding purposive movements and use            climate change as arid regions are likely to experience
of space provides insight into the ecophysiology of             even hotter temperatures and prolonged droughts [24].
mobile taxa.                                                    As a first response, individuals are most likely to adjust
  The presence of medium and large carnivores in a              their short term behaviour before longer term physio-
landscape can strongly influence the structure and func-        logical adaptations or range adjustments [23].
tion of ecosystems [12–14]. In fact, mammalian preda-              Investigating how dingoes behave in an already
tors are often used as bio-indicators in the event of           challenging environment could potentially provide us in-
human-induced ecosystem disruption given their local            sights into how other arid zone predators cope under
extinction can trigger a trophic cascade [15]. Quantifying      climate change. Here, we used ACC and GPS data
the behaviour and resulting energy demands of free-             collected from free-ranging dingoes in central Australia
ranging carnivores is therefore useful for predicting their     to investigate their behaviour-specific energetics and
resource requirements and subsequent selection of               activity patterns through time and space, and uncover
patchily distributed resources across the landscape.            the trade-offs imposed by their arid habitat. We classi-
  Australia’s largest terrestrial predator, the dingo Canis     fied broad classes of behaviour from ACC data and used
dingo, is a medium-sized eutherian carnivore that               it to estimate daily energy expenditure via activity-
persists in a wide range of environments [16]. Dingoes          specific time-energy budgets. We explored the dingo’s
are a highly mobile species that traverse large areas to        behaviour at different times of the day and year, and ex-
acquire resources, and maintain social ties and territorial     amined daily patterns of activity in response to ambient
boundaries. As a result, the decision to move is biologic-      temperature as an indication of behavioural thermoregu-
ally significant and likely to vary at fine (e.g., daily) and   lation. We expected that dingoes would be most active
broad (e.g., seasonal) temporal scales, as well as spatially.   at night and that during periods of high temperature
For populations in the harsh, resource-limited deserts of       dingoes would be inactive to reduce the risk of hyper-
central Australia where risks of hyperthermia are high,         thermia. Finally, we explored how dingoes behave and
survival depends on making choices that minimise                partition their energy in relation to landscape features.
behavioural energetic expenditure (and evaporative
water loss), whilst optimising the acquisition of food,         Methods
shelter, and water resources needed for survival [17].          Study area and species
  How wild animals balance their energetics through             Our study took place from April 2016 to May 2018 at
time and space is increasingly being studied by integrat-       Kalamurina Wildlife Sanctuary (hereafter ‘Kalamurina’),
ing movement data with activity-specific time-energy            a 6670 km2 conservation area owned and managed by
budgets [18, 19]. Animal movement can be reliably               Australian Wildlife Conservancy, and located at the
captured by animal-attached accelerometers (ACC) that           intersection of three of Australia’s central deserts: the
measure changes in acceleration in up to three axes [20].       Simpson, Tirari, and Sturt’s Stony Desert (27°48’S,
As energy expenditure is a function of activity, behav-         137°40’E, UTM Zone 54S; Fig. 1). The site adjoins pro-
iours can then be linked to activity specific measures of       tected areas to the north and south to create a 64,064
energy expenditure to produce robust time-energy bud-           km2 contiguous area that is managed for conservation.
gets in free-ranging animals. Time-energy budgets, the          The region’s climate is arid with a median annual rainfall
categorisation of energy cost per activity integrated over      of 133.5 mm, and it is characterised by very hot sum-
the time spent performing that activity, provide a reliable     mers and mild winters; mean daily temperatures ranging
estimate of daily energy expenditure [21]. Measuring            from 23 °C – 38 °C in the hottest month and 6 °C –
energetic costs for free-ranging and highly mobile preda-       20 °C in the coldest month (with mid-afternoon being the
tors like dingoes is challenging and, to date, we have a        hottest part of the day) [25]. It is located in the
Tatler et al. Movement Ecology      (2021) 9:11                                                                                        Page 3 of 12

 Fig. 1 Tracking data from seven dingoes at Kalamurina Sanctuary. Inset displays the location of Kalamurina in central Australia. The Warburton
 Creek is the only major watercourse on the eastern side of the study site, and it is bordered by shrubland and desert woodland along its length.
 The majority of Kalamurina consists of sand dunes and flats

Simpson-Strzelecki Dunes Bioregion and the dominant                        scheduled to record on a one-day on, three-days off
landform is sand dunes (< 18 m), with scattered flood-                     sampling regime. We programmed the GPS to record a
plains, claypans, and salt lakes. The dune swales are                      location every 15 min on the days the ACC was active.
characterised by chenopod shrubland where the main                         Six collars were recovered via triggering the drop-off
vegetation are species of Acacia, Eremophila, and Atri-                    mechanism, and one was recovered by re-trapping.
plex. Extensive coolabah Eucalyptus coolabah woodlands                       To limit the effect of abnormal behaviour that might
exist along the banks and floodplains of the larger                        occur as a result of capture and collaring, we discarded
watercourses.                                                              any GPS and ACC data recorded during the 24 h imme-
  The dingoes at Kalamurina possess high levels of                         diately following release. Data were also discarded if they
dingo ancestry [26], making this study the first assess-                   had a horizontal dilution of precision ≥9 (a measure of
ment of energetics in a wild population of pure dingoes.                   GPS accuracy) or occurred after the collar had dropped-
European rabbits Oryctolagus cuniculus, c. 1.6 kg                          off. We were able to retrieve ACC and GPS data from
comprise the bulk of their diet, but they also consume                     seven dingoes. Three individuals were tracked during
reptiles, birds, invertebrates, and vegetation [27].                       winter 2016 and four during summer 2017–2018. All
                                                                           data manipulation and analyses were conducted in the R
Data collection, cleaning, and processing                                  software environment for statistical and graphical com-
Dingoes were captured using Victor Soft Catch® #3 leg-                     puting (version 3.5.1 [29];).
hold traps modified with Paws-I-Trip pans and a Jake
Chain Rig (Professional Trapp Supplies, Molendinar,                        Dingo behaviour, ODBA, and energetic expenditure
Queensland). These traps and modifications are                             We classified wild dingo behaviours from the ACC data
designed to reduce the impact on the trapped limb [28].                    using the Random Forest model described in Tatler
All traps were set within close proximity (< 20 m) to                      et al. [30]. This supervised-learning approach required
tracks and checked twice daily within 3 h of sunrise and                   ACC data to be manually classified into behaviours,
sunset. All methodology employed as part of this study                     which was achieved by observing captive dingoes (n = 3)
were ethically reviewed and approved (University of                        that were equipped with tri-axial ACC units pro-
Adelaide Animal Ethics Committee S-2015-177A). We                          grammed to sample at 1 Hz. The predictive performance
fit 19 dingoes with ACC-GPS collars (Telemetry                             of the model was assessed using out-of-sample validation
Solutions, Concord, CA, USA) that were equipped with                       and resulted in the accurate classification of 14 dingo
tri-axial accelerometers (LISD2H, ST Microelectronics,                     behaviours. However, for the purposes of this paper, we
USA) programmed to sample changes in acceleration at                       were only interested in general movement patterns that
1 Hz (one sample per second) and orientated so that the                    would influence daily energy expenditure. Therefore, we
x, y, and z-axes recorded acceleration along the sway,                     trained a new Random Forest model (with the same set
heave, and surge planes, respectively. To increase the                     of parameters as in 30) to identify five classes of move-
temporal window of data collection, accelerometers were                    ment: lying down, sitting, standing, walking, and running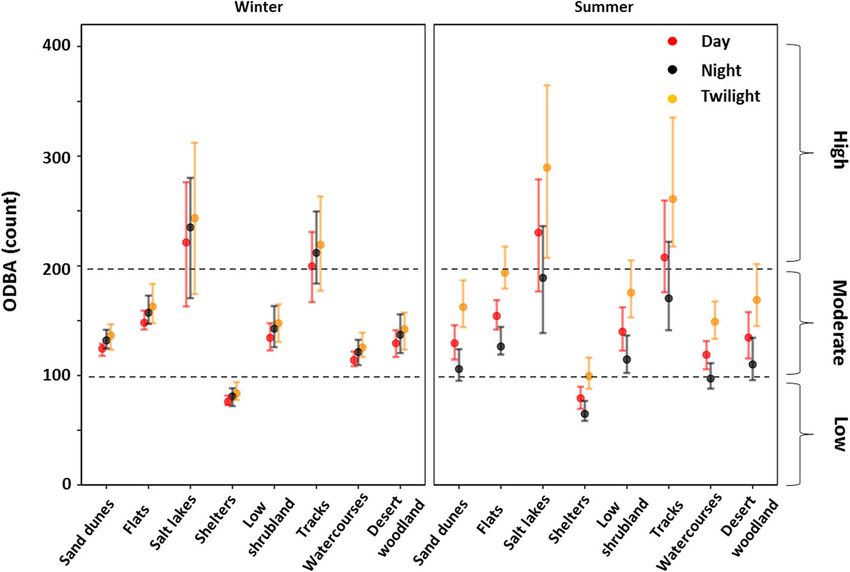
Tatler et al. Movement Ecology   (2021) 9:11                                                                           Page 4 of 12

Table 1 Performance of the Random Forest model at predicting 14 different behaviours versus grouped behaviours (from Tatler
et al [30];). We combined similar behaviours to create three broad movement classes. The True Skill Statistic was used as our
measure of classification accuracy, and the 95% confidence intervals are presented in square brackets next to each metric

(Table 1). Grouping the raw ACC data from the highest             their ability to predict energy expenditure [19], we chose
and lowest intensity behaviours increased the sample              to estimate energy expenditure in dingoes using ODBA.
size and improved the accuracy at which our model clas-
sified these movements (Table 1). Once we had classified          Energy calculation
our wild dingo ACC data into five behaviours, we                  Time-energy budgets have been shown to be an effective
relabelled Lying, Standing, and Sitting behaviours to             estimate of daily energy expenditure when compared to
‘Stationary’ as these behaviours are so similar that they         doubly labelled water in previous trials (Weathers et al.,
are unlikely to differ energetically.                             1984) and more recently ODBA was shown to accurately
   The total acceleration recorded by accelerometers is           predict energy expenditure for specific activities [31].
the result of both static (gravitational) and dynamic             We calculated daily energy expenditure using time-
(animal movement) components. Overall dynamic body                energy budgets calculated from our ACC derived behav-
acceleration uses the dynamic component and thus ac-              iours and equations derived from the literature. For rest-
celeration due to gravity must be removed. We calcu-              ing metabolic rate (applied to all stationary behaviours)
lated dynamic body acceleration (DBA) by subtracting a            we used oxygen consumption data from dingoes col-
running mean (five seconds) from each acceleration axis           lected by Shield [32] and derived the following equation
(x, y, and z) to give acceleration values occurring from          (Eq. 1) for V̇ O2 against Ta.
movement. The absolute value of DBA for each axis was
then summed to give a per-second value of ODBA. A
similar metric also derived from DBA, vectoral DBA                    V̇ O2 ml kg − 1 min − 1 ¼ 0:007  T a 2 − 0:298  T a þ 9:968
(VeDBA), has also been shown to accurately predict                                                                              ð1Þ
energy expenditure for different behaviours in wild
animals. Given Tatler et al. [30] found ODBA to be a                Where Ta was calculated per second using the Env-
better predictor of dingo behaviour than VeDBA, and               DATA system on Movebank (see ‘Environmental covari-
that ODBA and VeDBA do not differ significantly in                                                             ̇ O2 using
                                                                  ates’ section below). Shield [33] calculated V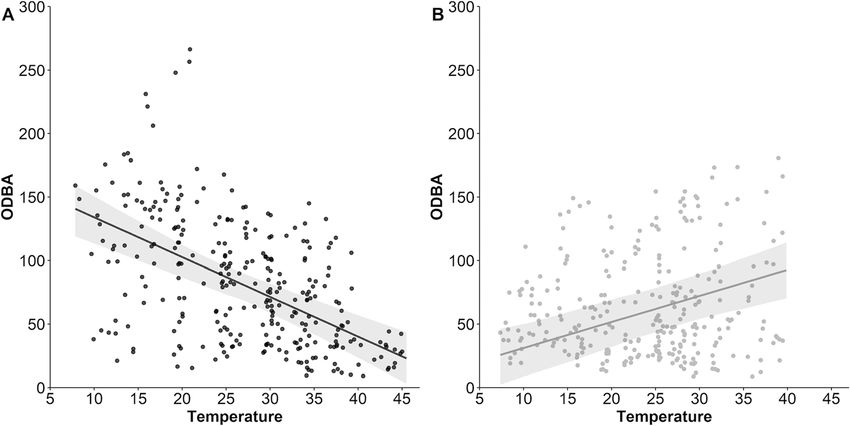
Tatler et al. Movement Ecology   (2021) 9:11                                                                   Page 5 of 12

flow through respirometry from dingoes of a similar size       woodland) to completely exposed (salt lakes). Each land-
to those in our study (mean ± se = 18.8 ± 0.2 kg vs 18.1 ±     scape layer was rasterized to the same resolution (25 m)
0.4 kg) and respirometry was conducted across a similar        and extent (56,366, 6,798,279; 339,166, 7,094,179; UTM
temperature range to that experienced by the dingoes at        Zone 54S) using the R package ‘raster’ [38]. Additional
Kalamurina. We selected V    ̇ O2 data from the control        raster layers were generated from the landscape rasters
group in Shield [33] as they were kept in an average am-       by calculating the shortest distance from every cell to
bient temperature of 23 °C over the course of their study,     each landscape feature. Prior to statistical analysis, all
which was not distinctly different from the average            such ‘distance to landscape feature’ variables were stan-
ambient temperature at Kalamurina over our study               dardised (x – mean (x) / standard deviation (x)) and
period (26 ± 0.1 °C). For the purpose of this study, it was    pairwise correlations (Pearson’s r) were calculated. Dis-
assumed that the rate of energy expenditure when sleep-        tance to flats was removed from the analyses because it
ing is the same as when stationary as metabolic rate has       was highly correlated with distance to sand dunes (r =
not been measured in sleeping dingoes and we did not           0.84). All other pairwise correlations were low (r < 0.7).
differentiate sleeping behaviour within our behavioural          We used the Env-DATA system on Movebank to an-
classifications. As such our calculations of daily energy      notate environmental data (temperature, NDVI, rainfall,
expenditure may be slightly overestimated. For our             and wind speed) to each GPS location, with information
walking and running behaviours we calculated energy            sourced from the European Centre for Medium-Range
expenditure using the following equation (Eq. 2) from          Weather Forecasts [39] and NASA Land Processes
Bryce and Williams [34] assuming an average speed of           Distributed Active Archive Center [40]. We collected
1.985 m s− 1 for walking and 4.96 m s− 1 for running.          data in two different field seasons, ‘winter’: April–August
                                                               2016, and ‘summer’ Oct 2017 – Jan 2018, and used the
                                                              R library ‘Maptools’ [41] to calculate astronomical time
    V̇ O2 ml kg − 1 min − 1 ¼ 7:5 þ 6:16  speed        ð2Þ    of day (day, night, dawn, and dusk). We then grouped
                                                               dawn and dusk together as ‘twilight’. We extracted hour
   We selected the ‘northern breed’ complex of domestic        and Julian day from our dataset as additional temporal
dogs (Canis lupus familiaris) as classified in Bryce and       covariates.
Williams [34] as these breeds most closely resemble din-
goes in overall body size conditions and unfortunately,        Identification of high-use ‘shelters’
to the best of our knowledge, no data exist for V    ̇ O2 of   Dingoes repeatedly shelter in discrete areas for resting,
active dingoes. We did not account for ambient                 rearing offspring, and/or socialising (hereafter referred
temperature during active behaviours because this is un-       to as ‘shelters’) and thus they may be an important
likely to have an additive effect on energy expenditure at     predictor of energy use [42]. We used the R package
low temperatures as heat generated from movement is            ‘recurse’ [43] to identify shelters for each dingo by using
often substituted for thermoregulation. Yet we cannot          a combination of 1) revisiting the same location (25 m
account for any additive effect ambient temperature may        radius), and 2) the average amount of time spent at that
have on energy expenditure during activity in hyperther-       location (residence time). Shelters were defined individu-
mic conditions. This is an entirely unstudied aspect of        ally for each dingo by an average residence time per visit
exercise physiology, with data only reported for a single      of ≥60 min and a rate of recursion in the 90th percentile
individual primate [35]. Total daily energy expenditure        of all recursions, i.e., the highest rate of revisitation
was calculated per day for each individual by summing          (Table 2).
the cost of each activity multiplied by the time (in hours)
each activity was undertaken. This was then converted          Statistical analysis
to kJ kg− 1 day− 1 by multiplying by a factor of 20.1 [36].    Behaviour in space and time
                                                               Dingoes may exhibit different behavioural responses
Environmental covariates                                       depending on their location in the landscape. So that
We created a map of the major landscape features in the        individual differences in behaviour through space and
study area using vegetation data from NatureMaps [37]          time could be clearly identified, we chose to analyse the
and a spatial layer representing tracks and permanent          relationship between behaviour and landscape features
water sources on Kalamurina provided by the Australian         for each dingo separately, using a multinomial logistic
Wildlife Conservancy. We identified seven landscape            regression in the R package ‘MDM’ [44]. Our dependent
features from the GIS data; watercourses, desert wood-         variable was the proportion of time a dingo was engaged
land, low shrubland, tracks, salt lakes, sand dunes, and       in each behaviour (stationary, walking, and running) in
flats. Landscape features provided varying amounts of          the 900 s (i.e., 15 min) prior to the GPS fix, with land-
shade based on vegetative cover, from full shade (desert       scape feature as our predictor variable. To investigate
Tatler et al. Movement Ecology (2021) 9:11 Page 6 of 12
Table 2 Attributes of the seven dingoes equipped with ACC-GPS collars at Kalamurina including the number of shelters, the mean
(± se) daily distance travelled (km d-1), and daily energy expenditure (kJ kg-1 d-1)
ID Sex Weight (kg) ACC collection period (days) Total ACC fixes Shelters Daily energy expenditure Distance travelled
JT04 F 16.0 12 Apr – 7 Aug 16 (44) 2,737,402 10 521 ± 1 6.9 ± 0.7
JT05 F 16.5 16 Apr – 3 Aug 16 (63) 2,652,399 3 611 ± 1 10.7 ± 0.6
JT07 M 20.5 12 Apr – 27 Apr 16 (4) 427,560 1 353 ± 1 3.9 ± 1.4
JT32 F 23.5 28 Oct – 11 Dec (25) 1,067,736 2 226 ± 3 11.2 ± 1.0
JT34 F 17.5 28 Oct – 24 Jan (46) 2,040,072 4 278 ± 4 9.1 ± 0.6
JT36 F 15.5 28 Oct – 24 Jan (64) 2,720,096 1 337 ± 4 12.8 ± 0.9
JT37 M 17.0 28 Oct – 24 Jan (46) 2,257,778 4 311 ± 4 15.5 ± 1.2
population-level seasonal differences in dingo behaviour, package ‘MuMin’ [47];) to rank the models. All candi-
we performed a meta-analysis to generate global param- date models included dingo ID as a random effect to
eter estimates across dingoes tracked during winter account for individual variation.
(JT04, JT05, and JT07) and summer (JT32, JT34, JT36,
and JT37). We weighted the estimates from the individ- Results
ual models by the inverse of each estimate’s standard Dingoes were much less active during summer where
error, to account for variation in the sample size. 91 ± 0.04% (mean ± sd) of their day (24 h) was spent sta-
tionary versus only 46 ± 0.1% during winter (Table S1).
Daily activity Season had the most profound effect on dingo behaviour
To investigate daily activity patterns of dingoes at (Fig. 2). In summer, dingoes were much more likely to
Kalamurina we constructed two generalised additive remain stationary than any other behaviour, regardless
models (GAMs) using the R package ‘mgcv’ [45]. Our of where they were in the landscape. In contrast, dingoes
first activity model assessed movement distance (be- were just as likely to be stationary as they were to be
tween successive 15-min GPS locations) as a function of walking or running during winter. The model with the
hour of day (0–23). Similarly, the second activity model lowest AICc and highest R2 (0.57) nested behaviour
assessed ODBA (averaged across the same, preceding within ID, included Julian day as a random effect, and
15-min period as the distance measure) as a function of landscape feature, time of day, and the interaction be-
hour. Prior to statistical analysis, both response variables tween time of day and season as fixed effects.
were standardised (x – mean (x) / standard deviation Distance and ODBA were positively correlated with
(x)). GAMs were fitted with a cyclic cubic regression each other (r = 0.65, p < 0.001), and both variables indi-
spline and 20 knots. We also ran a Pearson’s correlation cated crepuscular patterns of activity (Fig. 3). Dingoes
to test the strength and direction of the correlation be- were most active at dawn and into the early hours of the
tween the response variables. night and least active just before dawn and in the middle
To assess whether dingoes exhibited behavioural of the afternoon when compared across the entire study
thermoregulation by adjusting their activity levels as a period. However, during winter dingoes were signifi-
result of ambient temperature, we used a generalised cantly less active during twilight but more active at night
linear model (GLM) with ODBA (standardised) as our than dingoes in summer. The overall activity level of
response variable, and ambient temperature (standardised) dingoes during the day was not significantly different be-
and time of day (day or night) as our predictors. We tween summer and winter.
included dingo ‘ID’ and ‘Julian day’ as random effects. We found a contrasting relationship between ODBA
and Ta that was driven by the time of day (i.e. whether it
Effect of landscape features on behaviour was day or night; Fig. 4). There was a sharp decrease in
We used linear mixed effect models in the R package ODBA with increasing Ta during the day (R2 = 0.59),
‘lme4’ [46] to explore the relationship between (log whereas ODBA increased with increasing Ta at night
transformed) ODBA values (using 5 s average around (R2 = 0.39). Estimates of mean daily energy expenditure
each GPS timestamp) and our environmental/temporal are shown in Table 2. The mean estimated energy expend-
covariates. Based on our aims and a priori assumptions iture of dingoes was significantly higher in winter (495 kJ
of dingo activity, we built a candidate set of models (n = kg− 1 day− 1) than summer (288 kJ kg− 1 day− 1; p = 0.03).
25) and used Akaike’s Information Criterion corrected There was a significant effect of landscape feature on
for small sample sizes (AICc) and conditional R2 (R the activity levels (ODBA) of dingoes at KalamurinaTatler et al. Movement Ecology (2021) 9:11 Page 7 of 12
Fig. 2 Dingoes were much less active during summer than they were in winter. Predicted probabilities of being stationary, walking, or running in
each habitat. Blue represents dingoes tracked during winter (n = 3), and red represents dingoes tracked during summer (n = 4). Hollow circles
indicate probabilities for individual dingoes and solid circles represent global estimates (± 95% confidence intervals) from our meta-analysis of the
multinomial model estimates for each individual. In winter, only one dingo occurred on salt lakes, so no global statistic was calculated
(Fig. 5). Dingoes were most active on salt lakes, tracks, Australia with a long term median annual rainfall < 135
and flats, and least active when at their shelters (Table mm and maximum temperatures regularly above 40 °C
S2). However, the time of day had a significant effect on throughout summer. This region is predicted to experi-
how active dingoes were in each landscape feature dur- ence an increase in heat related extremes and duration
ing summer but not in winter (Fig. 5). Overall, dingoes of warm spells which could triple the number of days
exhibited a moderate - low level of activity in most land- above 40 °C by 2090 [24]. In our study the activity of
scape features. arid zone dingoes, as measured by ODBA, was primarily
driven by ambient temperature. More specifically, we
Discussion found that this was reflected in activity patterns across
Patterns and processes of all life in the arid zone are time of day, season, and even landscape features. Our re-
shaped by extremes in temperature and water availabil- sults suggest that under future climate scenarios dingoes
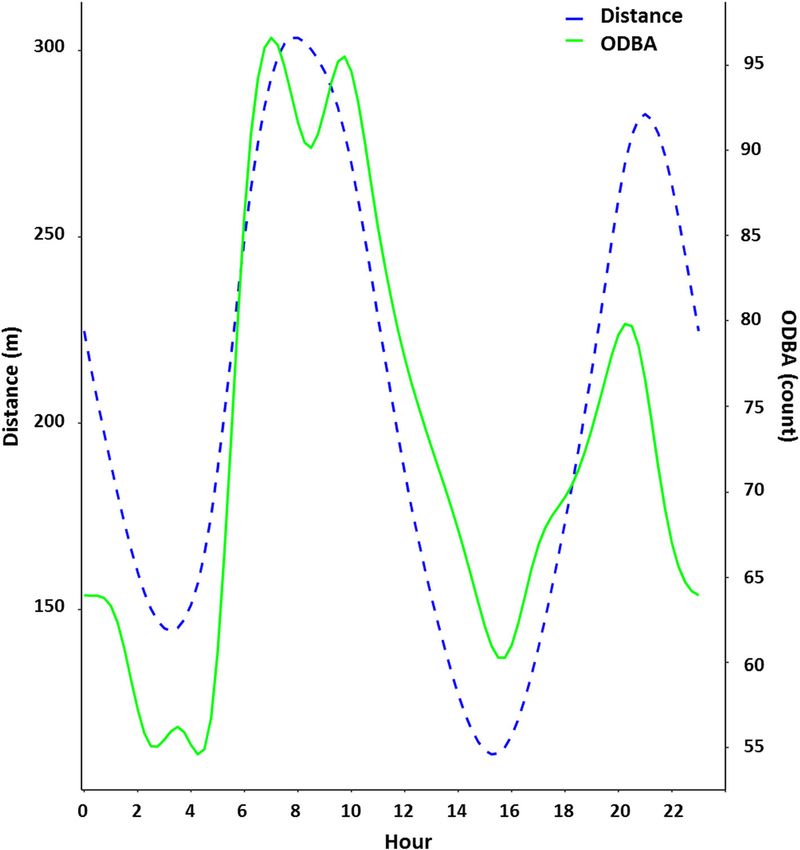
ity. Kalamurina is one of the hottest and driest places in may shift their behaviour to avoid hyperthermia.Tatler et al. Movement Ecology (2021) 9:11 Page 8 of 12 Fig. 3 Distance and ODBA were positively correlated with each other (r = 0.65, p < 0.001), and both of these variables indicated crepuscular patterns of activity. Daily activity patterns of dingoes (n = 7) at Kalamurina. The blue dotted line represents the distance moved between successive 15 min GPS location, and the solid green line represents the predicted, mean ODBA value across 900 s (i.e., 15 min), as a function of hour of day. The axis for ODBA has been scaled to fit within the range of the predicted distance values Dingoes in this study were largely crepuscular, with stressors associated with desert life [5, 52, 53]. While we two troughs in activity occurring during the early hours of were unable to track the activity of the same individuals the morning and the hottest part of the day (mid-after- across seasons, different patterns of daily movement dur- noon). Akin to other animals, the movement ecology of ing summer and winter have been shown to occur within dingoes is influenced by seasonally-variable intrinsic and individual dingoes in this study system [42]. This suggests extrinsic factors, with either primarily diurnal or primarily that our findings are more likely a response to nocturnal activity patterns reported in other studies [42, temperature variation between seasons and not simply an 48]. Activity patterns of predators usually coincide with artifact of differences between individuals. those of their major food source, which are also linked to Seasonally driven activity constraints have been re- ambient temperature [49, 50]. Rabbits comprise the bulk ported for other species (e.g., flying squirrels [54], and of the dingo’s diet in the arid zone [27], with most rabbit desert woodrats [55]) and suggests a trade-off between activity occurring at night regardless of season [51]. The remaining in areas which offer thermal respite versus time of day and seasonal differences in the activity of din- obtaining resources. Seasonal differences in daily energy goes in this study is therefore unlikely to be driven solely expenditure in free-ranging eutherian mammals have by prey acquisition. Moreover, as a vagile species, con- been found in several species, though this is the first straining high activity movements (or reducing them time it has been observed in a wild canid. It has been altogether) to the less climatically extreme times of the shown that dingoes are capable of acclimating physiolo- day is likely a behavioural adaptation to mitigate thermal gically to extreme temperatures (− 41 °C to + 45 °C) over
Tatler et al. Movement Ecology       (2021) 9:11                                                                                           Page 9 of 12

 Fig. 4 Predicted ODBA values (activity) by ambient temperature for dingoes (n = 7) at Kalamurina either during the day (Panel a) or at night
 (Panel b). The 95% confidence intervals are represented by grey shading

the course of a few months by reducing their metabolic                        altered activity patterns remains an important facet of
rate [33]. Warm acclimated individuals exposed to tem-                        energy balancing exhibited by dingoes.
peratures up to 45 °C reduced their metabolic rate by                            Movement is energetically costly and evaporative
around 40% compared to control individuals. This was                          water loss is highest during energetically demanding ac-
observed in concert with a change in thermal conductance,                     tivities at high ambient temperatures [1, 56]. During
an important component of heat dissipation, brought about                     locomotion even at low ambient temperatures (< 10 °C)
by altered coat composition [33]. It is reasonable to assume                  canines can rapidly reach high body temperatures (15–
that these physiological changes could contribute to                          20 minutes to reach 42 °C), due to the heat produced by
seasonal changes in daily energy expenditure for dingoes in                   muscle activity [57]. Therefore, at high ambient temper-
our study, however behavioural thermoregulation via                           atures the additive heat produced during activity must

 Fig. 5 Predicted ODBA values from our selected generalised linear mixed-effect model for dingoes (n = 7) in eight landscape features during the
 day, night, and twilight. Approximate activity levels (low, moderate, and high) were adapted from the relationship between ODBA and behaviour
 reported in Tatler et al. [30] and broadly represent our three grouped behaviour classes (stationary, walking, and running), respectively. Error bars
 represent 95% confidence intervals
Tatler et al. Movement Ecology   (2021) 9:11                                                                                   Page 10 of 12

be actively dumped, potentially further increasing ener-      Conclusions
getic costs. As such dingoes would benefit from remaining     Understanding the flexibility of behavioural thermoregu-
inactive in the heat in order to reduce hyperthermia and      lation in the arid zone informs our understanding of
evaporative water loss. We found that dingoes were sta-       how populations or species will respond to a changing
tionary for approximately 22 h a day during summer com-       climate. Here, we suggest that the behavioural ecology of
pared to only 12 h during winter. Winter also coincided       a medium sized carnivore in the arid zone is driven by
with the breeding and whelping seasons, which could also      limitations to heat dissipation regardless of season, in
explain why dingoes were more active during this time         line with the hypothesis that heat dissipation limits the
(e.g., searching for mates). Further, the daily energy ex-    upper boundary of total energy expenditure [22]. The
penditure of the two female dingoes tracked in winter was     shifts in behaviour observed in this study in response to
considerably higher than the male’s, which may be a con-      increasing ambient temperatures have also been re-
sequence of increased metabolic demands associated with       ported for other arid zone carnivores, such as Namibian
lactation. Activity levels of lactating females rise in re-   cheetahs (Acinonyx jubatus) and African wild-dogs
sponse to increased foraging effort due to additional ener-   (Lycaon pictus) [62, 63]. Given the previously reported
getic demands and fluid requirements for milk                 physiological capacity of dingoes to acclimate to temper-
production, which can be twice those of basal needs           atures exceeding 40 °C within months [33], alongside
[58]. However, as we were unable to make direct ob-           evidence of behavioural thermoregulation reported here,
servations of reproductive status this is merely              it appears that dingoes may be equipped to survive a
speculative.                                                  predicted increase in temperatures in their environment,
   Dingoes displayed the highest activity levels on salt      albeit via behavioural shifts. This may reflect how other
lakes and tracks, which was expected given they are pri-      apex predators in arid environments will respond to cli-
marily used for commuting [42]. These exposed parts of        mate change and could have significant repercussions
the landscape are likely used as directional travel routes    for predator-prey dynamics and intraguild competition
between resources such as water, shelter, and food but        in these ecosystems.
are also important for communication as dingoes mark
their territory by depositing visual and olfactory cues
(e.g., faeces and urine) in conspicuous places to maxi-       Supplementary Information
                                                              The online version contains supplementary material available at https://doi.
mise their detection by conspecifics. Returning to            org/10.1186/s40462-021-00246-w.
discrete areas for shelter and/or denning is common
amongst mammalian carnivores and can increase indi-            Additional file 1: Table S1. Proportion of each day spent stationary,
vidual fitness by providing thermoregulatory benefits          walking, and running. Table S2. Model summary showing the effect of
                                                               landscape features, time of day, and period on dingo activity (ODBA).
[59], reducing predation rates [60], and increasing off-       Model estimates, standard errors (SE) and p-values for our correlated
spring survival rates [61]. Further, microclimate selection    intercepts and slopes linear mixed model are presented. Significance is
(i.e., location of shelters in the landscape) is an import-    indicated in bold

ant thermal defence employed by animals to buffer
changes in ambient temperature. We previously col-            Acknowledgements
lected data on the same dingo population and found that       We thank Murray Schofield, Mark and Tess McLaren, Keith Bellchambers,
shelters were significantly more likely to be located in      Hannah Bannister, Casey O’Brien and all other volunteers for their role in
                                                              data collection at Kalamurina. We also acknowledge the constructive
the densely vegetated desert woodlands and along water-       comments given by John Kanowski on the manuscript. This project was
courses than in exposed habitats like salt lakes [42].        undertaken in collaboration with the Australian Wildlife Conservancy. JT
   Regardless of season, we found evidence that din-          acknowledges the support received through the provision of an Australian
                                                              Government Research Training Program Scholarship. Funding was provided
goes behaviourally thermoregulate by decreasing               by the Australian Wildlife Conservancy, Nature Foundation of South Australia
their activity levels with increasing ambient                 and Sir Mark Mitchell Research Fund.
temperature during the day. Conversely, the positive
relationship between activity and temperature at              Authors’ contributions
night suggests that dingoes could be compensating             JT, SEC and PC conceived the ideas and designed methodology. JT and DR
                                                              collected the data. JT, AS and TP analysed the data. JT and SEC led the
for low daily activity by partially shifting their move-      writing of the manuscript. All authors contributed critically to the drafts. The
ment to nocturnal periods to avoid solar radiation.           author(s) read and approved the final manuscript.
As the most energetically costly behaviours for din-
goes occur in exposed landscapes, shifting move-              Funding
ments to the night would mitigate the issue of                JT was funded by a Faculty of Sciences, University of Adelaide postgraduate
radiative heat gain while still enabling dingoes to           scholarship, and also by an Australian Government Research Training
                                                              Scholarship. The project was funded by the Linnean Society of New South
perform important behaviours, such as hunting and             Wales, the Australian Wildlife Society, the Mark Mitchell Research Foundation
socialising.                                                  and the Nature Conservancy of South Australia.
Tatler et al. Movement Ecology (2021) 9:11 Page 11 of 12
Availability of data and materials migrants. Ecol Appl. 2001;11(4):947–60. https://doi.org/10.1890/1051-0761
Data found in this manuscript is made available via Figshare: https://doi.org/ (2001)011[0947:AMPPIG]2.0.CO;2.
10.25909/5c901de204d18 16. Fleming P, Corbett L, Harden B, Thomson P. In: Bomford M, editor.
Managing the impact of dingoes and other wild dogs. Canberra: Bureau of
Rural Sciences; 2001.
Declarations 17. Allen BL. Do desert dingoes drink daily? Visitation rates at remote
waterpoints in the strzelecki desert. Aust Mammal. 2012;34(2):251–6. https://
Consent for publication
doi.org/10.1071/AM12012.
All authors gave final approval for publication.
18. Halsey LG, Shepard ELC, Wilson RP. Assessing the development and
application of the accelerometry technique for estimating energy
Competing interests expenditure. Comp Biochem Physiol A Mol Integr Physiol. 2011;158(3):305–
No competing interests. 14. https://doi.org/10.1016/j.cbpa.2010.09.002.
19. Wilson RP, Börger L, Holton MD, Scantlebury DM, Gómez-Laich A, Quintana
Author details F, et al. Estimates for energy expenditure in free-living animals using
1
Invasion Science & Wildlife Ecology Lab, University of Adelaide, Adelaide, SA acceleration proxies: a reappraisal. J Anim Ecol. 2020;89(1):161–72. https://
5005, Australia. 2Department of Evolutionary Ecology, Leibniz Institute for doi.org/10.1111/1365-2656.13040.
Zoo and Wildlife Research, Alfred-Kowalke Str. 17, 10315 Berlin, Germany. 20. Gleiss AC, Wilson RP, Shepard ELC. Making overall dynamic body
3
Department of Migration, Max Planck Institute of Animal Behavior, Am acceleration work: On the theory of acceleration as a proxy for energy
Obstberg 1, 78315 Radolfzell, Germany. 4Australian Wildlife Conservancy, PO expenditure. Methods Ecol Evol. 2011;2(1):23–33. https://doi.org/10.1111/j.2
Box 8070, Subiaco East, WA 6008, Australia. 5School of Mathematical 041-210X.2010.00057.x.
Sciences, University of Adelaide, Adelaide, SA 5005, Australia. 21. Ladds MA, Salton M, Hocking DP, Mcintosh RR, Thompson AP, Slip DJ,
et al. Using accelerometers to develop time-energy budgets of wild fur
Received: 12 December 2020 Accepted: 21 February 2021 seals from captive surrogates. PeerJ. 2018;6:e5814-e. https://doi.org/10.
7717/peerj.5814.
22. Speakman JR, Król E. Maximal heat dissipation capacity and hyperthermia
risk: Neglected key factors in the ecology of endotherms. J Anim Ecol. 2010;
References
79(4):726–46. https://doi.org/10.1111/j.1365-2656.2010.01689.x.
1. Schmidt-Nielsen K. Locomotion: energy costs of swimming, flying, and
23. Fuller A, Hetem RS, Maloney SK, Mitchell D. Adaptation to heat and water
running. Science. 1972;177(4045):222–8.
shortage in large, arid-zone mammals. Physiology. 2014;29(3):159–67.
2. Tatner P, Bryant DM. Flight cost of a small passerine measured using doubly
https://doi.org/10.1152/physiol.00049.2013.
labeled water: Implications for energetics studies. Auk. 1986;103(1):169–80.
https://doi.org/10.1093/auk/103.1.169. 24. Watterson I, Abbs D, Bhend J, Chiew F, Church J, Ekström M, et al.
3. Karasov WH. Daily energy expenditure and the cost of activity in mammals. Rangelands cluster report, climate change in Australia projections for
Am Zool. 2015;32(2):238–48. https://doi.org/10.1093/icb/32.2.238. australia’s natural resource management regions: cluster reports. 2015.
4. Harding KC, Fujiwara M, Axberg Y, Härkönen T. Mass-dependent energetics 25. Bureau of Meteorology; 2017. Climate data online. Available from: http://
and survival in harbour seal pups. Funct Ecol. 2005;19(1):129–35. https://doi. www.bom.gov.au/climate/data/. Accessed 12 Oct 2017.
org/10.1111/j.0269-8463.2005.00945.x. 26. Tatler J, Prowse TA, Roshier DA, Cairns KM, Cassey P. Phenotypic variation
5. Nathan R, Getz WM, Revilla E, Holyoak M, Kadmon R, Saltz D, et al. A and promiscuity in a wild population of pure dingoes (canis dingo). J Zool
movement ecology paradigm for unifying organismal movement research. Syst Evol Res. 2021;59(1):311–22. https://doi.org/10.1111/jzs.12418.
Proc Natl Acad Sci U S A. 2008;105(49):19052–9. https://doi.org/10.1073/pna 27. Tatler J, Prowse TA, Roshier DA, Allen BL, Cassey P. Resource pulses affect
s.0800375105. prey selection and reduce dietary diversity of dingoes in arid australia.
6. Wilson RP, Quintana F, Hobson VJ. Construction of energy landscapes can Mammal Rev. 2019;49(3):263–75. https://doi.org/10.1111/mam.12157.
clarify the movement and distribution of foraging animals. Proc R Soc Lond 28. Meek P, Jenkins D, Morris B, Ardler A, Hawksby R. Use of two humane leg-
B Biol Sci. 2012;279(1730):975–80. https://doi.org/10.1098/rspb.2011.1544. hold traps for catching pest species. Wildl Res. 1995;22(6):733–9. https://doi.
7. Rubenson J, Henry HT, Dimoulas PM, Marsh RL. The cost of running uphill: org/10.1071/WR9950733.
Linking organismal and muscle energy use in guinea fowl (numida 29. R Core Team. R: A language and environment for statistical computing.
meleagris). J Exp Biol. 2006;209(13):2395–408. https://doi.org/10.1242/jeb. Vienna: R Foundation for Statistical Computing; 2017.
02310. 30. Tatler J, Cassey P, Prowse TA. High accuracy at low frequency: Detailed
8. Wall J, Douglas-Hamilton I, Vollrath F. Elephants avoid costly behavioural classification from accelerometer data. J Exp Biol. 2018;221(23):
mountaineering. Curr Biol. 2006;16(14):R527–R9. https://doi.org/10.1016/j. jeb184085. https://doi.org/10.1242/jeb.184085.
cub.2006.06.049. 31. Pagano AM, Williams TM. Estimating the energy expenditure of free-ranging
9. Wolf JBW, Kauermann G, Trillmich F. Males in the shade: Habitat use and polar bears using tri-axial accelerometers: A validation with doubly labeled
sexual segregation in the galápagos sea lion (zalophus californianus water. Ecol Evol. 2019;9(7):4210–9. https://doi.org/10.1002/ece3.5053.
wollebaeki). Behav Ecol Sociobiol. 2005;59(2):293–302. https://doi.org/10.1 32. Shield J. Acclimation and energy metabolism of the dingo, cards dingo and
007/s00265-005-0042-7. the coyote, canis latrans. J Zool. 1972;168(4):483–501. https://doi.org/1
10. Revilla E, Wiegand T. Individual movement behavior, matrix heterogeneity, 0.1111/j.1469-7998.1972.tb01363.x.
and the dynamics of spatially structured populations. Proc Natl Acad Sci U S 33. Shield J. Acclimation and energy metabolism of the dingo, canis dingo and
A. 2008;105(49):19120–5. https://doi.org/10.1073/pnas.0801725105. the coyote, canis latrans. J Zool. 1972;168(4):483–501. https://doi.org/1
11. Wilson RP. Resource partitioning and niche hyper-volume overlap in free- 0.1111/j.1469-7998.1972.tb01363.x.
living pygoscelid penguins. Funct Ecol. 2010;24(3):646–57. https://doi.org/1 34. Bryce CM, Williams TM. Comparative locomotor costs of domestic dogs
0.1111/j.1365-2435.2009.01654.x. reveal energetic economy of wolf-like breeds. J Exp Biol. 2017;220(2):312–21.
12. Estes JA, Terborgh J, Brashares JS, Power ME, Berger J, Bond WJ, et al. https://doi.org/10.1242/jeb.144188.
Trophic downgrading of planet earth. Science. 2011;333(6040):301–6. 35. Mahoney SA. Cost of locomotion and heat balance during rest and running
https://doi.org/10.1126/science.1205106. from 0 to 55 degrees c in a patas monkey. J Appl Physiol. 1980;49(5):789–
13. Ritchie EG, Johnson CN. Predator interactions, mesopredator release and 800. https://doi.org/10.1152/jappl.1980.49.5.789.
biodiversity conservation. Ecol Lett. 2009;12(9):982–98. https://doi.org/1 36. Schmidt-Nielsen K. Animal physiology: adaptation and environment. 5th ed.
0.1111/j.1461-0248.2009.01347.x. Cambridge: Cambridge University Press; 1997.
14. Soulé ME, Estes JA, Berger J, Del Rio CM. Ecological effectiveness: 37. Department of Environment and Water; 2018. Naturemaps 3.0. Available
Conservation goals for interactive species. Conserv Biol. 2003;17(5):1238–50. from: https://data.environment.sa.gov.au/NatureMaps/Pages/default.aspx.
https://doi.org/10.1046/j.1523-1739.2003.01599.x. Accessed 27 Mar 2018.
15. Berger J, Stacey PB, Bellis L, Johnson MP. A mammalian predator–prey 38. Hijmans R, Van Etten J. Raster: Geographic analysis and modeling with raster
imbalance: Grizzly bear and wolf extinction affect avian neotropical data. R package version 2.6-7; 2010.Tatler et al. Movement Ecology (2021) 9:11 Page 12 of 12
39. Dee DP, Uppala SM, Simmons AJ, Berrisford P, Poli P, Kobayashi S, et al. The Publisher’s Note
era-interim reanalysis: Configuration and performance of the data Springer Nature remains neutral with regard to jurisdictional claims in
assimilation system. Q J R Meteorol Soc. 2011;137(656):553–97. https://doi. published maps and institutional affiliations.
org/10.1002/qj.828.
40. Didan K. In: DAAC NEL, editor. Mod13a2 modis/terra vegetation indices 16-
day l3 global 1km sin grid v006 [modis land/terra vegetation indices 1-km
16-day (mod13a2 v6)]. 6th ed; 2015.
41. Bivand R, Lewin-Koh N. Maptools: Tools for handling spatial objects. R
package version 0.9-4; 2018.
42. Tatler J. Integrated analysis of the movement and ecology of wild dingoes
in the arid zone. Australia: University of Adelaide; 2019.
43. Bracis C, Bildstein KL, Mueller T. Revisitation analysis uncovers spatio-
temporal patterns in animal movement data. Ecography. 2018;41(11):1801–
11. https://doi.org/10.1111/ecog.03618.
44. De'eath G. Mdm: Multinomial diversity model. R package version 1.3; 2013.
45. Wood SN. Fast stable restricted maximum likelihood and marginal
likelihood estimation of semiparametric generalized linear models. J R Stat
Soc B (Statistical Methodology). 2011;73(1):3–36. https://doi.org/10.1111/j.14
67-9868.2010.00749.x.
46. Bates D, Mächler M, Bolker B, Walker S. Fitting linear mixed-effects models
using lme4. 2015. 2015;67(1):48. https://doi.org/10.18637/jss.v067.i01.
47. Barton K. Mumin: Multi-model inference. 2009. http://r-forger-project.org/
projects/mumin/.
48. Allen BL, Goullet M, Allen LR, Lisle A, Leung LKP. Dingoes at the doorstep:
Preliminary data on the ecology of dingoes in urban areas. Landsc Urban
Plan. 2013;119:131–5. https://doi.org/10.1016/j.landurbplan.2013.07.008.
49. Harmsen BJ, Foster RJ, Silver SC, Ostro LET, Doncaster CP. Jaguar and puma
activity patterns in relation to their main prey. Mamm Biol. 2011;76(3):320–4.
https://doi.org/10.1016/j.mambio.2010.08.007.
50. Jenny D, Zuberbühler K. Hunting behaviour in west african forest leopards.
Afr J Ecol. 2005;43(3):197–200. https://doi.org/10.1111/j.1365-2028.2005.
00565.x.
51. Moseby KE, De Jong S, Munro N, Pieck A. Home range, activity and habitat
use of european rabbits (oryctolagus cuniculus) in arid australia: Implications
for control. Wildl Res. 2005;32(4):305–11. https://doi.org/10.1071/WR04013.
52. Aublet J-F, Festa-Bianchet M, Bergero D, Bassano B. Temperature constraints
on foraging behaviour of male alpine ibex (capra ibex) in summer.
Oecologia. 2009;159(1):237–47. https://doi.org/10.1007/s00442-008-1198-4.
53. Norris AL, Kunz TH. Effects of solar radiation on animal thermoregulation. In:
Babatunde E, editor. Solar radiation. Croatia: IntechOpen; 2012. p. 195–220.
54. Cotton CL, Parker KL. Winter activity patterns of northern flying squirrels in
sub-boreal forests. Can J Zool. 2000;78(11):1896–901. https://doi.org/10.113
9/z00-137.
55. Murray IW, Smith FA. Estimating the influence of the thermal environment
on activity patterns of the desert woodrat (neotoma lepida) using
temperature chronologies. Can J Zool. 2012;90(9):1171–80. https://doi.org/1
0.1139/z2012-084.
56. Mcnab BK. The physiological ecology of vertebrates: A view from energetics.
Ithaca: Cornell University Press; 2002.
57. Phillips CJ, Coppinger RP, Schimel DS. Hyperthermia in running sled dogs. J
Appl Physiol. 1981;51(1):135–42. https://doi.org/10.1152/jappl.1981.51.1.135.
58. Pond CM. The significance of lactation in the evolution of mammals.
Evolution. 1977;31(1):177–99. https://doi.org/10.2307/2407556.
59. Weber D. The ecological significance of resting sites and the seasonal
habitat change in polecats (mustela putorius). J Zool. 1989;217(4):629–38.
https://doi.org/10.1111/j.1469-7998.1989.tb02514.x.
60. Ruggiero LF, Pearson E, Henry SE. Characteristics of american marten den
sites in Wyoming. J Wildl Manag. 1998;62(2):663–73. https://doi.org/10.23
07/3802342.
61. Baker PJ, Robertson CPJ, Funk SM, Harris S. Potential fitness benefits of
group living in the red fox, vulpes vulpes. Anim Behav. 1998;56(6):1411–24.
https://doi.org/10.1006/anbe.1998.0950.
62. Hetem RS, Mitchell D, De Witt BA, Fick LG, Maloney SK, Meyer LCR, et al.
Body temperature, activity patterns and hunting in free-living cheetah:
biologging reveals new insights. Integr Zool. 2019;14(1):30–47. https://doi.
org/10.1111/1749-4877.12341.
63. Rabaiotti D, Woodroffe R. Coping with climate change: Limited behavioral
responses to hot weather in a tropical carnivore. Oecologia. 2019;189(3):
587–99. https://doi.org/10.1007/s00442-018-04329-1.You can also read