MUCCnet: Munich Urban Carbon Column network - AMT ...
←
→
Page content transcription
If your browser does not render page correctly, please read the page content below
Atmos. Meas. Tech., 14, 1111–1126, 2021
https://doi.org/10.5194/amt-14-1111-2021
© Author(s) 2021. This work is distributed under
the Creative Commons Attribution 4.0 License.

MUCCnet: Munich Urban Carbon Column network
Florian Dietrich, Jia Chen, Benno Voggenreiter, Patrick Aigner, Nico Nachtigall, and Björn Reger
Environmental Sensing and Modeling, Technical University of Munich (TUM), Munich, Germany

Correspondence: Florian Dietrich (flo.dietrich@tum.de) and Jia Chen (jia.chen@tum.de)

Received: 24 July 2020 – Discussion started: 12 August 2020
Revised: 2 December 2020 – Accepted: 25 December 2020 – Published: 11 February 2021

Abstract. In order to mitigate climate change, it is crucial        CO2 column concentration gradients to the traffic amount,
to understand urban greenhouse gas (GHG) emissions pre-             we demonstrate that our network is capable of detecting vari-
cisely, as more than two-thirds of the anthropogenic GHG            ations in urban emissions.
emissions worldwide originate from cities. Nowadays, urban             The measurements from our unique sensor network will be
emission estimates are mainly based on bottom-up calcula-           combined with an inverse modeling framework that we are
tion approaches with high uncertainties. A reliable and long-       currently developing in order to monitor urban GHG emis-
term top-down measurement approach could reduce the un-             sions over years, identify unknown emission sources and as-
certainty of these emission inventories significantly.              sess how effective the current mitigation strategies are. In
   We present the Munich Urban Carbon Column network                summary, our achievements in automating column measure-
(MUCCnet), the world’s first urban sensor network, which            ments of GHGs will allow researchers all over the world to
has been permanently measuring GHGs, based on the princi-           establish this approach for long-term greenhouse gas moni-
ple of differential column measurements (DCMs), since sum-          toring in urban areas.
mer 2019. These column measurements and column concen-
tration differences are relatively insensitive to vertical redis-
tribution of tracer masses and surface fluxes upwind of the
city, making them a favorable input for an inversion frame-         1   Introduction
work and, therefore, a well-suited candidate for the quantifi-
cation of GHG emissions.                                            Climate change is one of the defining issues of our time, and
   However, setting up such a stationary sensor network re-         one that affects the entire planet. To reduce greenhouse gas
quires an automated measurement principle. We developed             (GHG) emissions effectively, accurate and continuous mon-
our own fully automated enclosure systems for measuring             itoring systems for local- and regional-scale emissions are a
column-averaged CO2 , CH4 and CO concentrations with a              prerequisite.
solar-tracking Fourier transform spectrometer (EM27/SUN)               Especially for urban areas, which contribute to more than
in a fully automated and long-term manner. This also in-            70 % of global fossil fuel CO2 emissions (Gurney et al.,
cludes software that starts and stops the measurements au-          2015) and are therefore hotspots, there is a shortage of ac-
tonomously and can be used independently from the enclo-            curate emissions assessments. The city emission invento-
sure system.                                                        ries often underestimate emissions due to unknown emission
   Furthermore, we demonstrate the novel applications of            sources that are not yet included in the inventories (Chen
such a sensor network by presenting the measurement results         et al., 2020; Plant et al., 2019; McKain et al., 2015).
of our five sensor systems that are deployed in and around             In recent years, several city networks have been estab-
Munich. These results include the seasonal cycle of CO2             lished to improve emission monitoring. These include net-
since 2015, as well as concentration gradients between sites        works using in situ high-precision instruments (McKain
upwind and downwind of the city. Thanks to the automation,          et al., 2015; Bréon et al., 2015; Xueref-Remy et al., 2018;
we were also able to continue taking measurements during            Lamb et al., 2016) and low-cost sensor networks deploying
the COVID-19 lockdown in spring 2020. By correlating the            non-dispersive infrared sensors (Kim et al., 2018; Shuster-
                                                                    man et al., 2016). In addition, eddy covariance flux tower

Published by Copernicus Publications on behalf of the European Geosciences Union.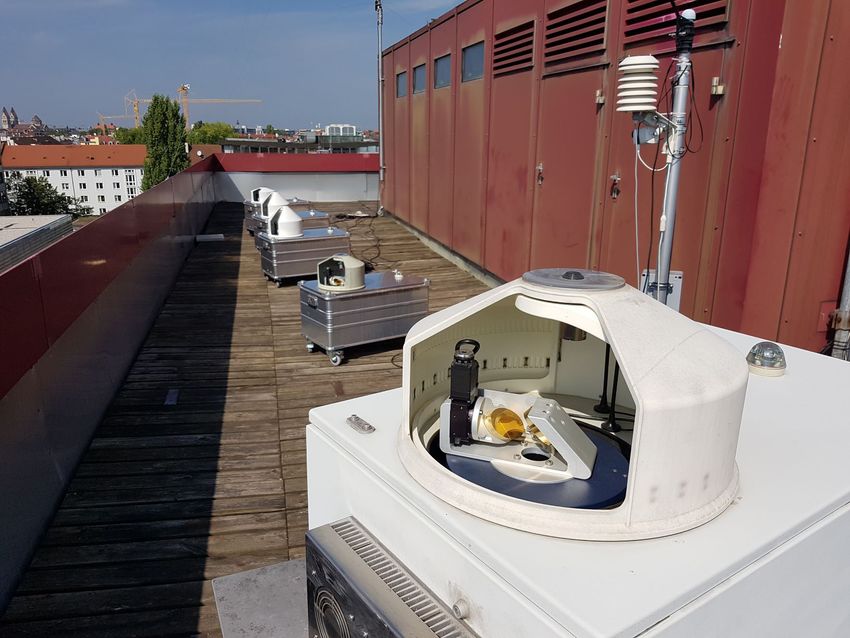
1112                                              F. Dietrich et al.: MUCCNET – Munich Urban Carbon Column network

measurements are used for directly inferring city fluxes
(Feigenwinter et al., 2012; Helfter et al., 2011). However, all
these approaches involve some challenges when it comes to
measuring urban emission fluxes, such as high sensitivity to
the boundary layer height dynamics, large variations due to
mesoscale transport phenomena or the fact that they can only
capture the fluxes of a rather small area.
   Column measurements have proven to be a powerful tool
for assessing GHG emissions from cities and local sources,
because they are relatively insensitive to the dynamics of the
boundary layer height and surface fluxes upwind of the city if
a differential approach is used (Chen et al., 2016). Therefore,
this method has recently been widely deployed for emis-
sion studies of cities and local sources using mass balance
or other modeling techniques. In St. Petersburg, Makarova
et al. (2020) deployed two compact solar-tracking Fourier
transform infrared (FTIR) spectrometers (EM27/SUN) and
a mass balance approach to study the emissions from the           Figure 1. Basic principle of the differential column measurements:
                                                                  with the help of an upwind and at least one downwind station, the
fourth-largest European city. The EM27/SUN spectrometer
                                                                  column-averaged GHG concentrations are measured. The differ-
has been developed by the Karlsruhe Institute of Technol-         ences between the two stations are representative for the emissions
ogy (KIT) in collaboration with Bruker and has been com-          generated in the city.
mercially available since 2014 (Gisi et al., 2011, 2012; Hase
et al., 2016). Hase et al. (2015) and Zhao et al. (2019) used
the measurements of five EM27/SUNs to measure emissions              In this paper, we present the Munich Urban Carbon Col-
of CO2 and CH4 in Berlin. With a similar sensor config-           umn network (MUCCnet), the permanent urban GHG net-
uration, Vogel et al. (2019) studied the Paris metropolitan       work in Munich, which is based on the differential column
area and applied the CHIMERE-CAMS model to show that              measurement (DCM) principle and consists of five fully au-
the measured concentration enhancements are mainly due to         tomated FTIR spectrometers. The combination of our sensor
fossil fuel emissions. Jones et al. (2021) combined measure-      network with a suitable modeling framework will build the
ments from Indianapolis (five EM27/SUNs) with an adapted          basis for monitoring urban GHG emissions over years, iden-
inverse modeling technique to determine the urban GHG             tifying unknown emission sources, validating satellite-based
emissions.                                                        GHG measurements and assessing the effectiveness of the
   Besides these urban studies, column measurements are           current mitigation strategies.
also used to investigate local sources: Chen et al. (2016) and
Viatte et al. (2017) determined the source strength of dairy
farms in Chino, California. By combining column measure-          2   Measurement principle
ments with a computational fluid dynamics (CFD) model,
Toja-Silva et al. (2017) verified the emission inventory of       As a measurement principle, the DCM method is used (Chen
the largest gas-fired power plant in Munich. With mobile se-      et al., 2016). DCM is an effective approach for determining
tups, Butz et al. (2017) studied emissions from the volcano       the emissions of large-area sources using just a small num-
Mt. Etna, Luther et al. (2019) quantified the coal mine emis-     ber of stationary ground-based instruments. The basic prin-
sions from upper Silesia and Klappenbach et al. (2015) uti-       ciple of DCM is illustrated in Fig. 1. The column-averaged
lized column measurements on a research vessel for satellite      concentrations of a gas in the atmosphere are measured up-
validations above the ocean. However, these studies are all       wind and downwind of an emission source, utilizing ground-
based on the campaign mode and not suited for monitoring          based FTIR spectrometers that use the sun as a light source.
the urban emissions permanently. Only TCCON (Total Car-           The concentration enhancements between the two stations
bon Column Observing Network; Wunch et al. (2011)) and            are caused by the urban emissions. Chen et al. (2016) have
COCCON (Collaborative Carbon Column Observing Net-                shown that the differences between the upwind and down-
work; Frey et al., 2019; Sha et al., 2020) are measuring the      wind column concentrations are relatively insensitive to the
global GHG column concentrations permanently. For this            boundary layer height and upstream influences. Therefore,
purpose, TCCON uses IFS 125HR spectrometers (resolution:          DCM in combination with a wind-driven atmospheric trans-
0.02 cm−1 ), while COCCON uses calibrated EM27/SUN                port model can be used to determine emissions.
spectrometers (resolution: 0.5 cm−1 ). However, both net-
works focus on detecting GHG background concentrations
and are not primarily designed to study urban emissions.

Atmos. Meas. Tech., 14, 1111–1126, 2021                                             https://doi.org/10.5194/amt-14-1111-2021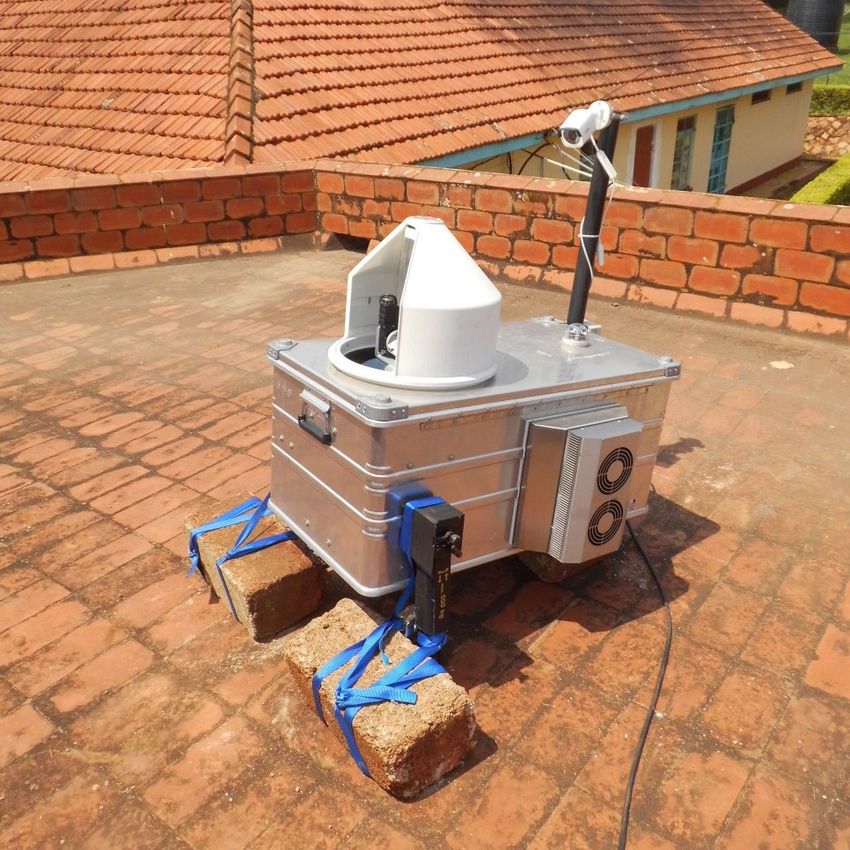
F. Dietrich et al.: MUCCNET – Munich Urban Carbon Column network                                                                    1113

3     Measurement system

In order to use the DCM principle for long-term monitor-
ing of the urban GHG emissions, a fully automated measure-
ment system is needed. For this, we developed an electron-
ically controlled enclosure system that includes the related
software.

3.1     Hardware

The enclosure system protects the spectrometer inside
against harsh weather conditions and other harmful events,
such as power or sensor failures. Furthermore, it enables
communication between the devices inside the system and
allows the host to remotely control the measurements over
the internet. Under suitable measuring conditions, such as
sunny weather and valid sun elevations, the system automat-
ically starts the measurement process. During the day, the
measurements are checked regularly by the enclosure soft-
ware to detect and solve malfunctions autonomously. When          Figure 2. Side view of the enclosure system (CAD model).
the measuring conditions are no longer suitable, the system
stops taking measurements and closes the cover to secure the
spectrometer. An operator is informed about any unexpected
behavior by email.

3.1.1    Standard edition

The described enclosure is based on our first prototype sys-
tem, presented in Heinle and Chen (2018), which has been
continuously running on the rooftop of the Technical Uni-
versity of Munich (TUM) in Munich’s inner city since 2016.
This system was developed to semi-automate the measure-
ment process using an EM27/SUN spectrometer over the
years. For the permanent urban GHG network, we improved
this system to make it more reliable, easier to transport and
fully autonomous.
   Our new enclosure system is based on a lightweight yet
robust aluminum housing (Zarges K470 box, waterproof ac-
cording to IP54) that we modified for our purposes. The CAD
model of this system is shown in Fig. 2. A rotating cover at
the top of the housing allows the sunrays to hit the mirrors
of the solar tracker at arbitrary azimuth and elevation angles.   Figure 3. CAD model of the newly designed cover (outer and inner
Every 10◦ , a magnet is fixed in the outer cover (see Fig. 3).    one) with a small opening and a steeper slope compared to the first
Reed sensors in the inner cover count these signals so that       version in Heinle and Chen (2018). With the help of the reed sensors
the relative position of the cover can be computed. Before the    1 and 2, the relative position of the cover is calculated (in 10◦ steps).
cover is opened and after every full rotation, two additional     The second sensor indicates the direction. The reed sensors 3 and
reed sensors indicate the absolute zero position. The target      4 are used to determine the absolute zero position each time before
position of the cover is computed automatically depending         the cover opens.
on the coordinates of the site and the time. Optical rain and
direct solar radiation sensors indicate whether the current en-
vironmental conditions are suited for measurements.               trial embedded box PC. In addition to the remote access, the
   Signal lamps, push buttons and an emergency stop button        computer is also responsible for controlling the spectrometer
can be used to control the basic functions of the enclosure       and the solar tracker and for storing the interferograms before
directly at the site. Full control can only be achieved by re-    they are transferred to our retrieval cloud via the internet.
mote access to the enclosure computer, which is an indus-

https://doi.org/10.5194/amt-14-1111-2021                                              Atmos. Meas. Tech., 14, 1111–1126, 2021
1114 F. Dietrich et al.: MUCCNET – Munich Urban Carbon Column network
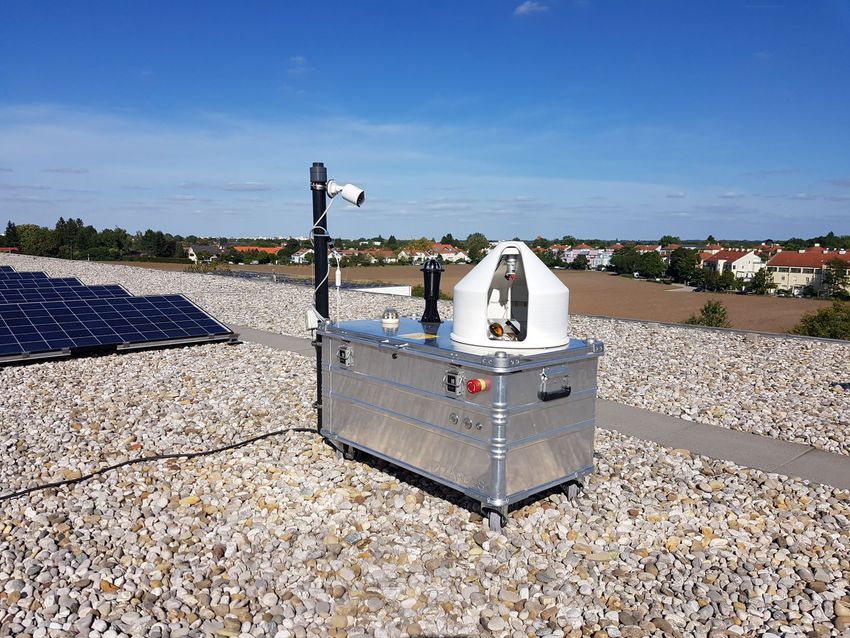
Figure 5. Image of the new enclosure system on the roof of a school
at our southern site, Taufkirchen. The systems includes, inter alia,
the newly designed rotating cover, the lightweight aluminum case,
the solar radiation sensor and a surveillance camera attached to a
post.
A photo of one of the four newly developed enclosure sys-
tems for the Munich network can be seen in Fig. 5. It shows
the measurement setup at our southern site on top of a flat
rooftop.
3.1.2 Universal editions
Figure 4. CAD model of the electrical components inside the en- Our enclosure system was originally developed to measure
closure. the GHG concentrations in Munich at a latitude of 48.15◦ N.
Therefore, the rotating cover that protects the solar tracker
from bad weather was designed to enable measurements for
The enclosure system itself is controlled by a Siemens S7-
all possible solar angles at such a latitude. However, if the
1200 PLC (programmable logic controller) and not by the
enclosure system is used somewhere else in the world, these
enclosure computer that runs on a Microsoft Windows oper-
limitations need to be considered. That is why we designed
ating system. This approach ensures that the safety features
our new cover so that it can measure solar elevation angles
– such as rain or power failure detection, cover motor control
up to about 80◦ and azimuth angles between 30 and 300◦ for
and temperature control – are separated from the Windows
setups in the Northern Hemisphere. The asymmetric azimuth
operating system, making the enclosure less error-prone and
angle range is due to the non-centered first mirror of the so-
more fail-safe.
lar tracker. If the system is used in the Southern Hemisphere,
All the additional electronics are placed in the rear part
it must be rotated by 180◦ and a setting must be changed
of the enclosure systems and are shown in Fig. 4 in detail.
in the software. These solar angles cover most places in the
Besides the PLC, we installed an LTE router, a heater, the
world. Furthermore, we adapted some features to overcome
motor driver, two circuit breakers, surge protection devices
challenges such as extreme temperatures and high relative
and an RCCB (residual current circuit breaker). In addition,
humidity. We developed two of these special editions and
new relays were added to the system to be able to reset all
tested them at both very low and very high latitudes: one in
error-prone devices – such as the computer, router or PLC –
Uganda next to the Equator and one in Finland next to the
remotely. In order to make the system as lightweight as possi-
polar circle.
ble, we replaced the large and heavy thermoelectrical cooler
As part of the NERC MOYA project, the University of Le-
by a cooling fan and a heater, and replaced the lead–acid bat-
icester has been using our enclosure system to measure CH4
tery of the UPS (uninterruptible power supply) by capacitor-
emissions from the wetlands north of Jinja, Uganda (latitude:
based energy storage. All the devices inside the system com-
0.4◦ N), since the beginning of 2020 (Humpage et al., 2019).
municate via the two standard protocols TCP/IP and USB.
Quite apart from the significantly higher temperatures and
Atmos. Meas. Tech., 14, 1111–1126, 2021 https://doi.org/10.5194/amt-14-1111-2021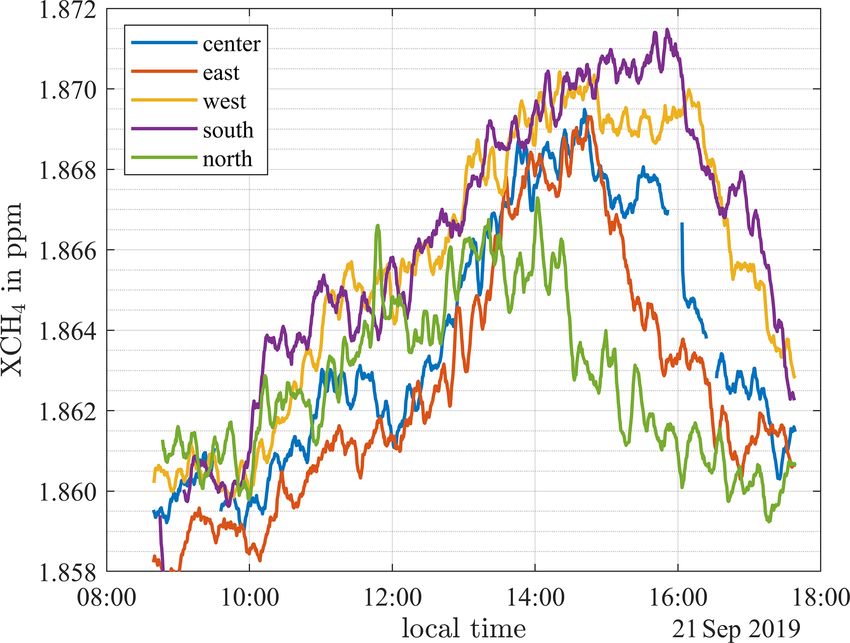
F. Dietrich et al.: MUCCNET – Munich Urban Carbon Column network                                                                 1115

                                                                         used are replaced by two 150 W thermoelectrical coolers.
                                                                         They can keep the temperature at a constant level of 25 ◦ C
                                                                         under normal weather conditions in Uganda, as well as being
                                                                         able to condense water vapor to reduce the relative humidity
                                                                         inside the system.
                                                                            Our enclosure is, however, suited to work not only at very
                                                                         low latitudes but also at high ones. To test the system under
                                                                         such conditions, we built another enclosure system for the
                                                                         COCCON site next to the TCCON station in Sodankylä at a
                                                                         latitude of 67.4◦ N (Tu et al., 2020). There, the system has
                                                                         been measuring continuously since 2018, which shows that
                                                                         our system can not only withstand cold winters but is also
                                                                         suitable to measure a large azimuth angle range.
                                                                            Overall, we developed a system that is universally ap-
                                                                         plicable and can be used for a wide latitude range to en-
                                                                         able ground-based GHG measurements worldwide with min-
                                                                         imum effort and maximum measurement data.

                                                                         3.2     Software

                                                                         For controlling and automating the enclosure system, we de-
Figure 6. Setup of the tropical version of our enclosure in Jinja,       veloped two independent software programs: ECon and Pyra.
Uganda (Latitude: 0.4◦ N). With the help of car jacks the whole sys-     The purpose of ECon is to control all safety and enclosure
tem is tilted in order to enable measurements at high elevation levels   features that are monitored by the PLC, whereas Pyra is used
close to 90◦ . Furthermore, the system is equipped with two 150 W        to control the spectrometer and take measurements automat-
thermoelectrical coolers (attached at the two sides of the system)       ically. Pyra also includes a user interface (UI) through which
that keep the temperature inside the enclosure constant at 25 ◦ C.       the operator can set all parameters and observe the current
Photo by Neil Humpage, University of Leicester.                          state of the system.

                                                                         3.2.1    Enclosure control (ECon)
relative humidity than in Munich, the very high solar eleva-
tion angles (up to 90◦ ) are challenging. These high angles              The enclosure control software ECon was already a part of
are a problem both for the cover of the enclosure as it blocks           the first enclosure version (Heinle and Chen, 2018). There,
the sun in such cases and for the solar tracker of the spec-             a microcontroller program is used to control the enclosure
trometer. The solar tracker of the EM27/SUN can only mea-                features, such as opening and closing the rotating cover, an-
sure up to elevation angles of about 85◦ . At higher elevations,         alyzing the rain sensor data, powering the spectrometer and
the control algorithm is no longer stable. Therefore, both the           monitoring the UPS. For the new version, we separated these
spectrometer and the cover cannot work properly at such high             safety operations from the measurement-related software that
elevation angles.                                                        is running on a Windows computer to make these features
   To overcome this challenge, we tilted the whole enclosure             fail-safe. As the microcontroller is replaced by a PLC in the
system by a few degrees to simulate the instrument being lo-             new version, the ECon software needed to be renewed as
cated at a site with a higher latitude than it actually is. This is      well.
done using two state-of-the-art car jacks (see Fig. 6), which               ECon is structured as a sequence control that loops
can elevate the side of the enclosure that points towards the            through the main program, which is grouped into several
Equator up to 15◦ . As a result, the very low elevation angles           functions, over and over again. These functions include, for
can no longer be measured, as the sun is then blocked by the             example, the detection of any alarm caused by the UPS, en-
lid of the enclosure, although this is not an issue. This is be-         coder or power failures; the request of the current solar az-
cause the air mass dependency of the slant column cannot be              imuth angle and the control of the cover motor; and other
reliably handled by the GFIT retrieval algorithm at these high           outputs such as relays or signal lamps.
solar zenith angles (Wunch et al., 2011). Using this unique                 The most safety-relevant function is the control of the
approach, both the solar tracker and the rotating cover work             cover motor. The program is structured in such a way that
properly at high elevation angles, which makes this approach             closing the cover is prioritized in any condition. Even in the
suited for locations at low latitudes.                                   event of a reed sensor failure, the program will make sure
   Since the temperature and relative humidity are much                  that the cover closes correctly by evaluating the sensor sig-
higher than in central Europe, the fan and heater normally               nals, which are implemented redundantly.

https://doi.org/10.5194/amt-14-1111-2021                                                    Atmos. Meas. Tech., 14, 1111–1126, 2021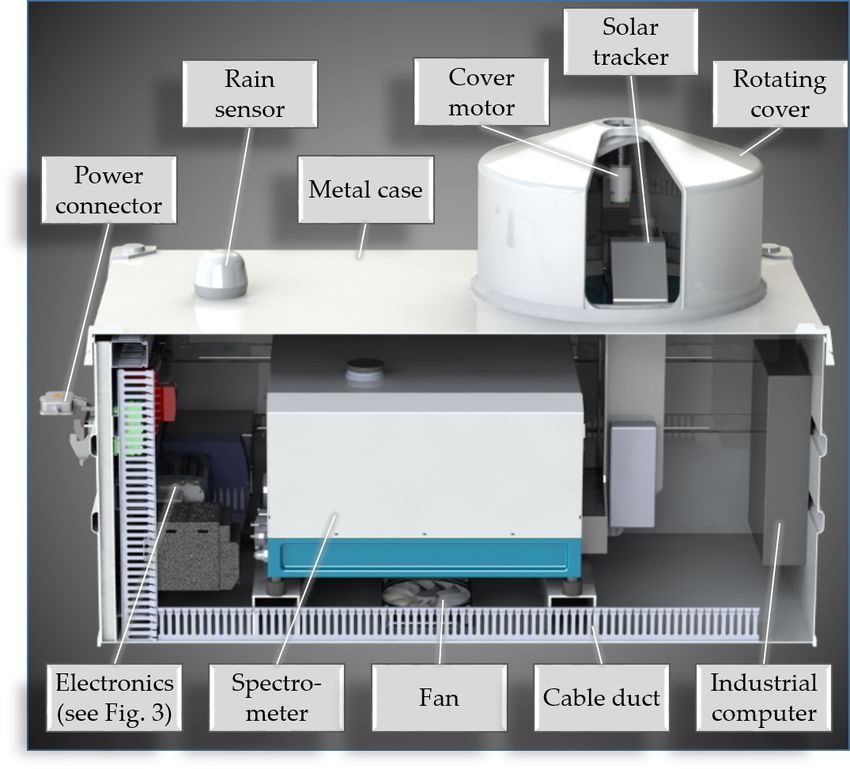
1116                                              F. Dietrich et al.: MUCCNET – Munich Urban Carbon Column network

   Furthermore, ECon monitors whether the ethernet connec-        ferent shelter. In this case, only the fully automated mode no
tions to the computer, spectrometer and internet are working      longer works, as the information from the direct solar radi-
properly. If any malfunction is detected, the program auto-       ation sensor is not available. However, all the other modes
matically restarts the spectrometer, computer or router, de-      work, which leads to less human effort and more reliable
pending on the kind of failure, by briefly interrupting the       measurements.
power supply to the respective device using relays. This ap-         All the aforementioned features of Pyra are combined in a
proach ensures a minimum requirement of human interac-            common user interface (see Fig. 7). It is a clear and handy
tions if malfunctions occur, which is particularly beneficial     interface that allows any operator to make all the neces-
for operating very remote sites.                                  sary settings for performing automated measurements us-
   To keep the temperature within a predefined range, ECon        ing EM27/SUN spectrometers. In total, there are three Pyra
also controls the temperature inside the enclosure by power-      tabs (measurement, configuration and log) and one ECon tab,
ing either the heater or the fan, depending on the actual and     which we also included in this user interface. The ECon tab
the given nominal temperature.                                    allows us to control the PLC that operates the enclosure sys-
                                                                  tem (for details, see Sect. 3.2.1). Thus, the program itself runs
3.2.2   Automation software (Pyra)                                not on the enclosure computer but on the PLC, which makes
                                                                  the safety-related features fail-safe. As the PLC does not pro-
In order to control the measurements of the spectrometers         vide its own graphical user interface, we decided to include
automatically, it was necessary to develop software that cov-     these functions – such as controlling the cover motor, heater,
ers all the tasks that a human operator normally does to per-     fan, relays etc. – in the Pyra UI as well. For that, the Python
form the measurements. We decided to use Python as the pro-       library snap7 is used, which makes it possible to communi-
gramming language to develop both the automation software         cate with a Siemens S7 PLC using an ethernet connection.
and a user interface that allows an operator to set all neces-
sary parameters and observe the current state of the system.      3.2.3   Automated retrieval process
The program runs all the time on each enclosure computer
and serves as a juncture between the spectrometer, enclosure      For a fully automated greenhouse gas observation network,
system and operator. Since the measurements are based on          not only the measurements need to be autonomous; the data
the spectral analysis of the sun, we have named the program       processing also needs to be autonomous. Therefore, we au-
Pyra, which is a combination of the programming language          tomated the data processing chain as well.
Python and the name of the Egyptian sun god Ra.                      At the end of a measurement day, each enclosure computer
   The manufacturer Bruker provides the EM27/SUN spec-            automatically uploads all the interferograms and weather
trometers with the two independent software components            data via an SSH connection to our Linux cloud server at
OPUS and CamTracker, to control both the spectrometer it-         the Leibniz Supercomputing Center in Garching. After about
self and the camera-based solar tracker that is attached to the   5 d, when the a priori vertical pressure profiles from NCEP
spectrometer. Pyra does not replace these two software ele-       (National Centers for Environmental Prediction) are avail-
ments but provides the possibility to start, stop and control     able, the retrieval algorithm converts the information from
them automatically. Besides these necessary tasks, Pyra also      the interferograms into concentrations. The retrieval algo-
monitors the operating system and the spectrometer to detect      rithm used is GGG2014 (Wunch et al., 2015), which is also
malfunctions such as insufficient disk space or non-working       used to retrieve all the TCCON data. We applied the standard
connections. Furthermore, it evaluates whether the environ-       TCCON parameters, including the air-mass-independent cor-
mental conditions are suited for measurements and logs each       rection factors. The spectral windows for retrieving diverse
event to a file.                                                  gas species are slightly modified according to the EGI setup
   Pyra has four different operating modes: the manual one,       (Hedelius et al., 2016).
in which the operator can start and stop the measurements
with just one click; two semi-automated modes, in which           4   Network setup
Pyra starts and stops the measurements based on either a de-
fined time or the solar zenith angle (SZA) range; and the fully   We tested the automated network consisting of five spectrom-
automated mode. In the latter, Pyra evaluates the direct solar    eters in a measurement campaign in August 2018 (Dietrich
radiation sensor data and combines them with the SZA infor-       et al., 2019), before the permanent network was installed in
mation calculated online to start and stop the measurements       September 2019. In addition, our first enclosure system has
whenever the environmental conditions are suitable.               been permanently measuring on the university rooftop since
   A more detailed description about the features of Pyra can     2016.
be found in Appendix A.
   Although Pyra was developed to automate the process of
EM27/SUN spectrometers that are operated in our enclosure
system, it can also be used without this system or in a dif-

Atmos. Meas. Tech., 14, 1111–1126, 2021                                            https://doi.org/10.5194/amt-14-1111-2021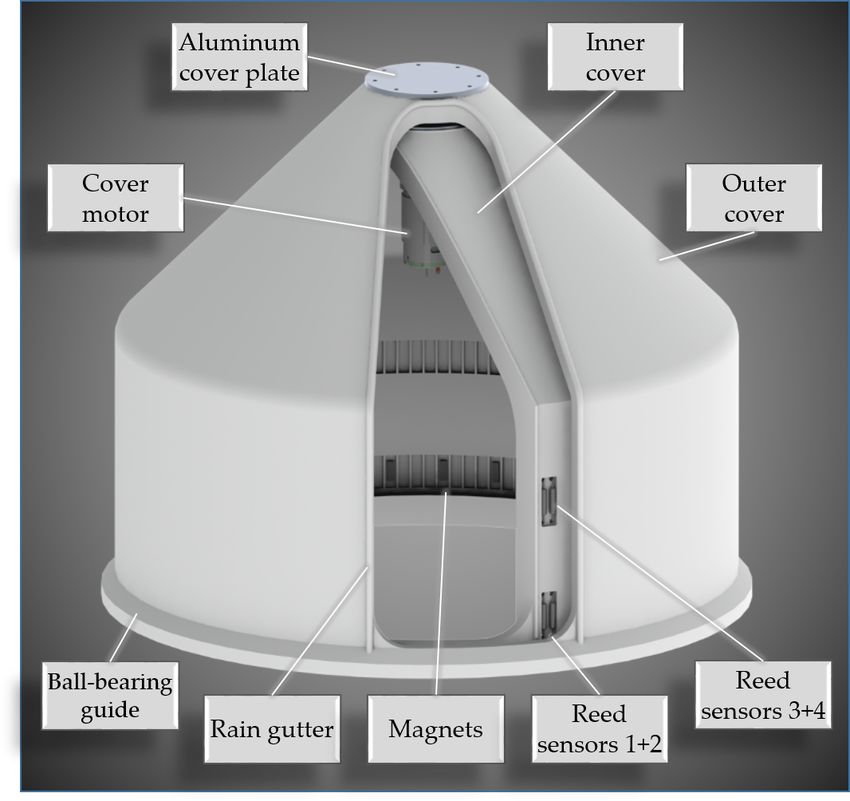
F. Dietrich et al.: MUCCNET – Munich Urban Carbon Column network 1117
Figure 7. User interface for the control software, Pyra. In total there are four different tabs (Measurement, Configuration, Log and Enclosure
control) that can be selected. In this image, the measurement tab is shown.
4.1 Test campaign – Munich, August 2018 ing this kind of setup for a permanent urban GHG observa-
tion network.
After building a total of five enclosure systems, we estab-
lished the first fully automated GHG sensor network based 4.2 Permanent Munich GHG network setup
on the differential column measurement principle (Chen
et al., 2016) in a 1-month measurement campaign in Munich. Although the configuration of the outer stations in the August
To test our enclosure systems and the network configura- 2018 campaign was well suited for capturing the background
tion, we borrowed spectrometers from KIT and the German concentrations, this setup cannot be used to determine the
Aerospace Center (DLR). In addition to our long-term oper- emissions of the city center of Munich separately from its
ating station in the inner city, we set up a system in each com- outer surroundings. Instead, the greater Munich area emis-
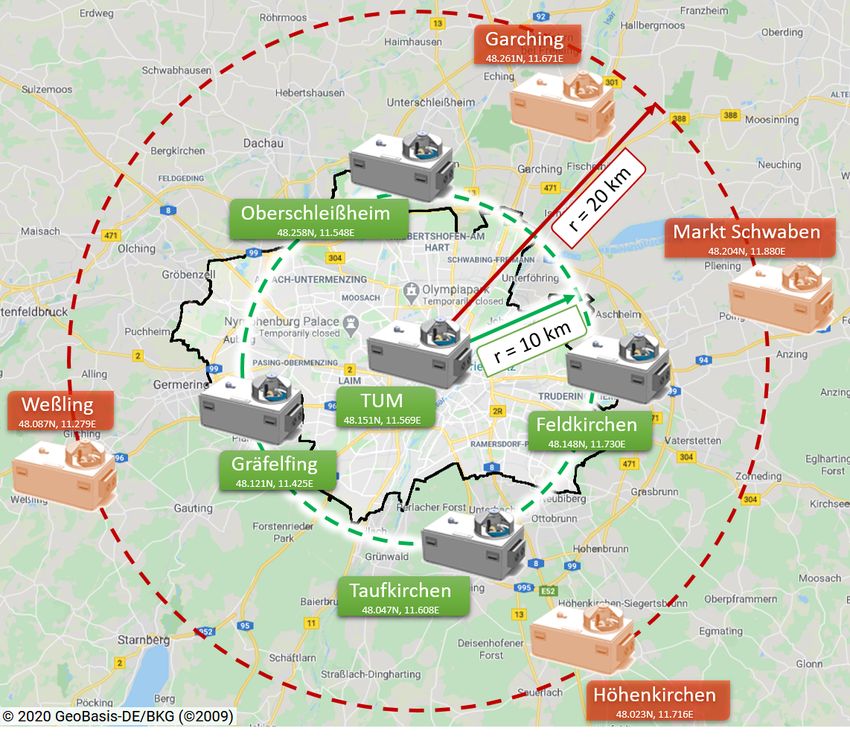
pass direction (see red shaded enclosure systems in Fig. 8). sions are captured as well. As our focus is emissions from
A distance of approximately 20 km was selected between the the city itself, we decided to go closer to the city boundaries
downtown station and each outer station, to ensure that the for our permanent sensor network. The distance between the
outer stations are not directly affected by the city emissions downtown station and each outer station was halved to 10 km
if they are located upwind. (see green enclosure systems in Fig. 8). Thus, the outer sta-
Thanks to the automation, we were able to take measure- tions are located approximately at the city boundaries of Mu-
ments on each of the 25 sunny days in August, both week- nich. The second benefit of such a dense sensor setup is that
days and weekends, mostly from very early in the morning it can be better used for validating concentration gradients
to late evening (approx. 07:00 to 20:00 CEST). This kept hu- measured by satellites. Due to the unique dataset of our sen-
man interactions to a minimum and restricted them mostly sor network, the NASA satellites OCO-2 (Crisp et al., 2017)
to setting up and disassembling the enclosure systems on the and OCO-3 (Eldering et al., 2019) have been measuring CO2
rooftops that we used as measurement sites. Therefore, this concentrations over Munich in the target mode since spring
campaign was characterized by a very small effort as well as 2020. The area OCO-2 can cover over Munich in this mode
a very high data volume. These results are the desired out- is approximately 21 km × 13 km. As the satellite trajectory
comes of such campaigns and are also the foundation for us- is not exactly aligned on the north–south axis, the distance
https://doi.org/10.5194/amt-14-1111-2021 Atmos. Meas. Tech., 14, 1111–1126, 2021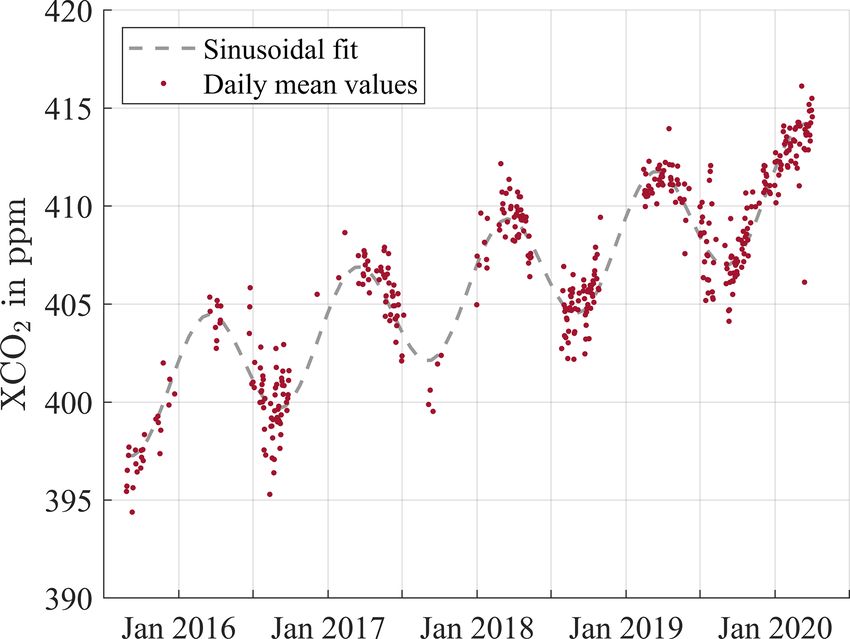
1118                                                    F. Dietrich et al.: MUCCNET – Munich Urban Carbon Column network

                                                                         Figure 9. Daily mean values of the CO2 measurements from the
                                                                         downtown station in Munich. The concentrations follow the glob-
                                                                         ally rising trend. Furthermore, the seasonal cycle with lower con-
                                                                         centrations in summer and higher concentrations in winter is clearly
                                                                         visible for the 5-year period shown.
Figure 8. Map of the greater Munich area together with the two
different sensor network setups that have been implemented. The
urban area itself (indicated by the black border) is largely contained
within the inner green dashed circle in the center, which represents     5.1   Seasonal cycle
the current setup of the stationary network. The light red shaded
sensor systems, together with the center station, represent the setup    In Fig. 9, we show the measurement curve of our downtown
during our 2018 summer campaign. Both setups are characterized           station over the first 5 years of measurements. In order to
by a center station and a station in each compass direction to mea-      display the seasonal cycle, we use a sinusoidal function of
sure the inflow and outflow of GHG concentrations under arbitrary        the form
wind conditions. Map data are from © Google Maps.
                                                                                              2π(t − b)
                                                                         cCO2 (t) = a · sin                + ct + d              (1)
                                                                                                 365
of 10 km between the inner and outer stations is optimal for
                                                                         with the parameters a to d to be fitted. One can clearly see the
capturing the urban concentration gradients.
                                                                         globally rising trend in CO2 (about 2.4 ppm yr−1 ), as well as
   In addition to the relocation, the enclosure systems were
                                                                         the seasonal cycle over the 5-year period.
slightly improved based on the experiences from the August
                                                                            Although the entire period from fall 2015 to summer 2020
2018 campaign. In particular, this includes the addition of
                                                                         is covered, some times within this range yield a much greater
a direct solar radiation sensor in order to start and stop the
                                                                         volume of data than others. These high-density data clusters
measurements depending on the actual weather conditions.
                                                                         represent our campaigns in summer 2017 and 2018. A further
Furthermore, we replaced the three borrowed spectrometers
                                                                         hot spot can be detected in fall 2016, when the first version
with our own ones so that all five instruments can measure
                                                                         of our enclosure system (Heinle and Chen, 2018) was es-
long-term.
                                                                         tablished and intensively tested in the semi-automated mode.
   All in all, we were able to set up MUCCnet, the first per-
                                                                         Since summer 2019, the fully automated enclosure system
manent urban column concentration network for GHGs, in
                                                                         has been measuring whenever the weather conditions are
September 2019 using our own five spectrometers. Since this
                                                                         suitable, which results in a very high and dense data volume.
date, we have been measuring not only the absolute GHG
                                                                            In total, we have measured on 498 d throughout the last
concentration trend of Munich but also the city gradients,
                                                                         5 years. Of these, only days with continuous measurements
which will be used to determine the urban GHG emissions
                                                                         of at least 1 h are taken into account. The ratio of mea-
in Munich over the years, as well as to find unknown emis-
                                                                         surement days compared to non-measurement days is about
sion sources.
                                                                         17 % for the time period before summer 2019. Once full au-
                                                                         tomation was established, this ratio increased to about 52 %,
5   Results                                                              which shows the great benefit of our fully automated sen-
                                                                         sor network approach. In this calculation all days are taken
Since 2015, we have been continuously measuring the GHG                  into account, regardless of whether the measuring conditions
concentrations in Munich with at least one instrument. Over              were good or bad.
time, the amount of data has increased as we have improved
our automation and used more and more instruments.

Atmos. Meas. Tech., 14, 1111–1126, 2021                                                    https://doi.org/10.5194/amt-14-1111-2021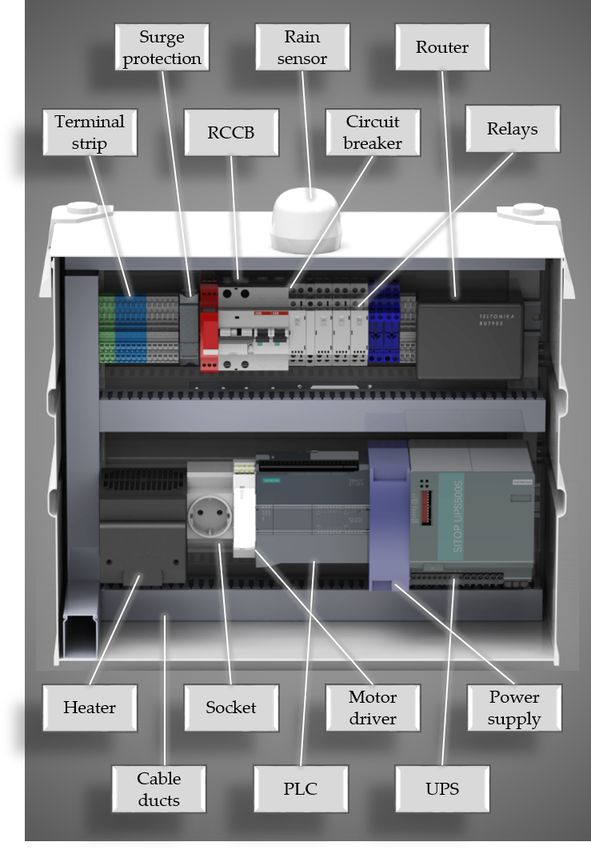
F. Dietrich et al.: MUCCNET – Munich Urban Carbon Column network                                                                  1119

Figure 10. Calibration measurements of all our five sensor systems   Figure 11. CH4 measurement values (5 min average) from all five
on the roof of our institute’s building. One can see four slightly   stations during our Oktoberfest 2019 campaign on 21 September
different versions of our enclosure systems.                         2019. The concentration gradients between the single stations are
                                                                     clearly visible, which indicates the presence of strong CH4 sources
                                                                     in the city.
5.2   Side-by-side and urban gradient comparison

The results in the previous section show that our automation         urban emissions using these measurements as an input. Fur-
works and that we are able to gather a lot of GHG mea-               thermore, one can see that our automated network allows us
surement data. The final goal of our network is, however,            to measure not only on weekdays but also on weekends from
to quantify the urban emissions. For that, the gradients be-         early morning to evening, without the need for human re-
tween the single stations need to be analyzed. As the concen-        sources.
tration enhancements of column-averaged dry-air mole frac-              In Fig. 12, we show the CO2 concentration enhancements
tions are quite small for an urban emission source, it is abso-      above the background concentration for the four outer-city
lutely necessary to calibrate the instruments regularly. In ad-      stations depending on the wind direction. For this purpose,
dition to the calibration of absolute concentration values dur-      we use an ultrasonic wind sensor (Gill WindObserver II) on
ing measurements next to the TCCON station in Karlsruhe,             a roof in the inner city of Munich (48.148◦ N, 11.573◦ E,
the relative comparison between the single instrument is even        24 m a.g.l.). To determine the background concentration, we
more decisive. Therefore, we calibrate all instruments regu-         use the data from all of our measurement stations and deter-
larly with respect to our defined standard represented by the        mine the lowest measurement point for each time step. Af-
instrument ma61. Figure 10 shows the setup of this kind of           terwards, a moving average with a window size of 4 h is used
side-by-side measurement day, where five automated sensor            to smooth the curve as we assume that the background con-
systems measure next to each other on our university roof.           centration must not change rapidly. For each station, a po-
   For each instrument and gas species, a constant correc-           lar histogram shows where the concentration enhancements
tion factor f (see Table B1) is determined to convert the raw        originate and how frequent they are. In contrast to a standard
concentration value craw to the corrected concentration value        wind rose, the different colors indicate the strength of the
ccorr using linear scaling:                                          concentration enhancement; yellow means low and red high
          craw                                                       enhancement. The wind speed is displayed by the distance of
ccorr =        .                                              (2)    the respective cell to the center point of each circle.
           f
                                                                        One can see clearly that for all four stations the enhance-
As an absolute reference value, we will use the instrument           ments are higher towards the city. For the eastern station, for
that was calibrated at a TCCON station most recently. So far,        example, the highest enhancements, indicated by the reddish
the most recent correction value determined by Frey et al.           color, are located in the west. These results indicate that the
(2019) before shipping the instruments from Bruker to Mu-            captured GHGs are mainly generated in the city and that our
nich has been used (see Table B2).                                   network is able to detect and quantify such urban emitters.
   Figure 11 shows the CH4 gradients of a standard measure-          Due to technical issues, not all stations started their measure-
ment day on a Saturday during Oktoberfest 2019. It indi-             ments at the same time. Therefore, the data volume collected
cates that our sensor network can detect the differences in          at the southern station, which started no earlier than May
CH4 concentrations well, which allows us to determine the            2020, is much smaller. An overview of when each station

https://doi.org/10.5194/amt-14-1111-2021                                                Atmos. Meas. Tech., 14, 1111–1126, 2021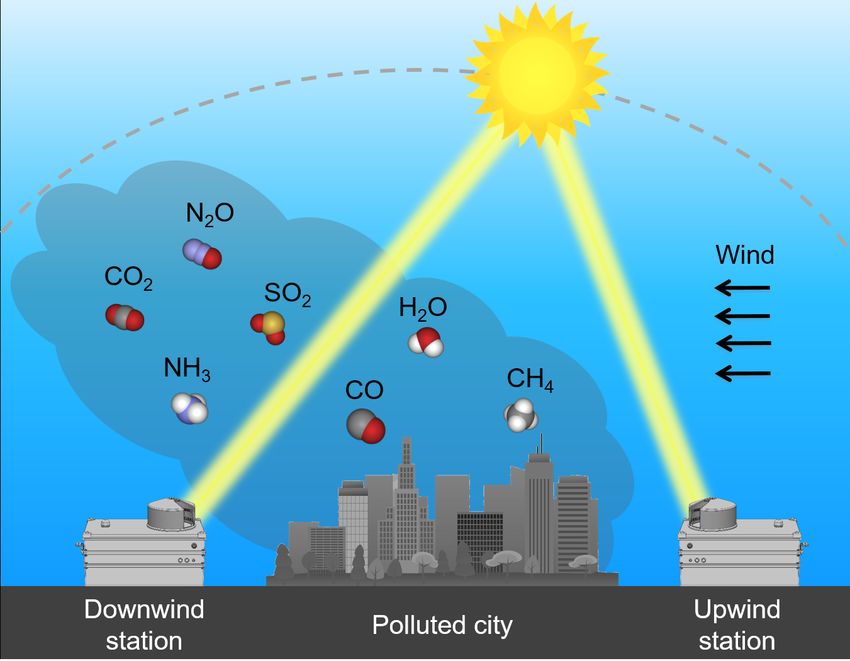
1120                                                    F. Dietrich et al.: MUCCNET – Munich Urban Carbon Column network

                                                                            All concentration gradients are clustered into biweekly
                                                                         bins. In Fig. 13, the median of these bins is displayed as
                                                                         the blue curve. The error bars indicate the 1σ standard de-
                                                                         viation of these biweekly distributions. In addition, volume
                                                                         of traffic in Munich is displayed in red using the congestion
                                                                         rate provided by TomTom International BV. Furthermore, the
                                                                         COVID-19 lockdown period is shown as the grey shaded
                                                                         area.
                                                                            The plot demonstrates that the lockdown had a significant
                                                                         impact on traffic flow. The CO2 enhancements show a similar
                                                                         pattern throughout the first half of the year 2020. Based on
                                                                         the regression plot, there seems to be a correlation between
                                                                         the reduced traffic volume and the lower CO2 enhancements
                                                                         (R 2 = 0.63). Both curves first decrease and then increase
                                                                         again after the strict restrictions were gradually loosened.
                                                                            However, our statistical approach, which uses about
                                                                         100 000 measurement points, shows large variations in the
                                                                         CO2 enhancements for the single bins. Such high variations
                                                                         are, however, not concerning as the approach does not take
                                                                         into account wind speed and direction, for example. Further-
                                                                         more, the assumption of homogeneously distributed emis-
                                                                         sions sources does not reflect the truth, and photosynthetic
                                                                         effects are not considered. Therefore, it can only serve as a
                                                                         first indication of how the emissions were reduced during the
Figure 12. Concentration enhancements over the background for            lockdown period. In the future, we will apply more sophisti-
each of the five stations displayed as a polar histogram. The CO2        cated modeling approaches to quantify the emissions.
enhancements are represented by the different colors (low (yellow)
to red (high)). The wind direction is indicated by the location of the
respective cells in the circle, and the wind speed by the distance of
the cells to the center point.
                                                                         6   Conclusion
Table 1. Start of operation including the number of measurements
                                                                         We present the world’s first permanent urban GHG column
taken by each station so far (until 12 August 2020).
                                                                         network consisting of five compact solar-tracking spectrom-
                                                                         eter systems distributed in and around Munich (MUCCnet).
      Instrument   Location     Start date           Data points
                                                                         We developed the hardware and software to establish this
      ma61         Center       September 2015       1550k               kind of a fully automated GHG sensor network for quanti-
      mb86         East         August 2018          850k                fying large-area emission sources, such as cities. Both the
      mc15         West         September 2019       310k                enclosure system and the related Python program for au-
      md16         North        December 2019        270k                tomating the measurement process can be used by the com-
      me17         South        May 2020             16k
                                                                         munity to build up similar sensor networks in cities world-
                                                                         wide. Also, COCCON would benefit greatly from this kind
                                                                         of automated system, as the current approach of operating
started its measurements in the permanent network, includ-               EM27/SUN spectrometers in this network still requires man
ing the data collected so far, is shown in Table 1.                      power on site to start up measurements and to protect the
                                                                         spectrometer from adverse meteorological conditions. Per-
5.3    Influences of the COVID-19 lockdown on urban                      manent and long-term observations will help to improve the
       concentration gradients                                           understanding of the global carbon cycle.
                                                                            With our sensor systems, we carried out several test cam-
Thanks to the automation, we took measurements through-
                                                                         paigns between 2016 and 2019 and finally set up the per-
out the COVID-19 lockdown in spring 2020, which resulted
                                                                         manent urban GHG sensor network based on the differential
in a unique dataset showing the influence of such a drastic
                                                                         column methodology in fall 2019. The results show the ad-
event on the urban GHG gradients of a city like Munich. Fig-
                                                                         vantages of this kind of automated network, such as very high
ure 13 displays the gradients between the measurements of
                                                                         data volume, low personnel effort and high data quality. Due
the inner-city station and the background concentrations (cf.
                                                                         to the very frequent measurements that were taken indepen-
Sect. 5.2).
                                                                         dent of the day of the week or the season, this study shows

Atmos. Meas. Tech., 14, 1111–1126, 2021                                                   https://doi.org/10.5194/amt-14-1111-2021
F. Dietrich et al.: MUCCNET – Munich Urban Carbon Column network 1121 Figure 13. Correlations between the CO2 enhancements over the background measured at our inner-city station in Munich and the traffic amount represented by the congestion rate (a: time series; b: regression plot). The time period includes the COVID-19 lockdown in spring 2020. We show the median trend of all column concentration gradients clustered into biweekly bins. The error bars show the 1σ standard deviation of all enhancements within the respective 2-week period. Traffic data are from © 2020 TomTom International BV. that our network can effectively detect both the globally ris- In order to quantify the Munich GHG emissions, we are ing trend of CO2 concentrations and the seasonal cycle. currently developing an atmospheric transport model based The final goal of this kind of network is the quantification on Bayesian inversion. This kind of modeling framework will of urban GHG emissions. For that, the concentration gradi- help us quantify Munich’s GHG emissions in the future and ents between the downwind and upwind stations are decisive, find correlations with parameters such as time of the day, sea- as they represent the anthropogenic emissions superimposed son and weather conditions. Furthermore, we will use our with biological processes. Our results indicate that these gra- rich dataset to detect and quantify unknown GHG emission dients can be captured clearly with our sensor setup. Addi- sources. tional analyses, including wind information, show that the In summary, this study provides the framework for estab- city causes these enhancements. lishing a permanent GHG sensor network to determine urban Furthermore, the network can be used to validate GHG concentration gradients using column measurements over a satellites in a unique way, as not only absolute values but also wide range of latitudes. The characteristics of the hardware concentration gradients can be compared. Since spring 2020, presented here – such as high reliability, ease of use and low the NASA OCO-2 and OCO-3 satellites have been measur- operating costs – form the basis for it to become a new stan- ing urban CO2 concentration gradients in Munich using the dard for monitoring urban GHG concentrations. spatially highly resolved target mode in a recurring pattern to compare the satellite measurements with our ground-based ones. With the benefit of full automation, we were also able to measure concentration gradients during the COVID-19 lock- down period in spring 2020. The results show a possible correlation between the CO2 column concentration gradients and the traffic amount, both of which appear to be drastically affected by the lockdown. https://doi.org/10.5194/amt-14-1111-2021 Atmos. Meas. Tech., 14, 1111–1126, 2021
1122                                              F. Dietrich et al.: MUCCNET – Munich Urban Carbon Column network

Appendix A: Pyra – software features                                 In order to detect malfunctions, Pyra is equipped with sev-
                                                                  eral live monitoring functions. It monitors whether the two
To control the spectrometer program OPUS, we use the Mi-          programs OPUS and CamTracker are still running correctly
crosoft Windows technology dynamic data exchange (DDE),           every 0.2 s. If they are not, it automatically restarts the non-
which is also supported by OPUS. It is a protocol for ex-         working program to proceed with the measurements. Fur-
changing data based on the client–server model and allows         thermore, the log files of CamTracker are read continuously,
us to send requests, such as starting a measurement or load-      which allows us to detect automatically if the solar tracker is
ing a specific setting file, to OPUS. With the help of DDE,       not tracking the sun correctly anymore, for example. Such a
combined with an MTX macro file for OPUS, Pyra can start          behavior is quite common as the solar tracker uses a camera-
recurring measurements of the spectrometer. The necessary         based approach to follow the sun over the course of the day.
settings are stored in an XPM experiment file and are loaded      In cloudy conditions, the algorithm sometimes mistakenly
into the program in the same way.                                 detects objects other than the sun, resulting in incorrect track-
   Communication with the solar tracker program Cam-              ing. In such a case, the tracking is restarted using the calcu-
Tracker is simpler, as this program’s settings no longer need     lated position of the sun at the given coordinates and time. In
to be changed after the initialization. Therefore, we asked       addition to trying to solve the error automatically, Pyra also
the manufacturer Bruker to implement an autostart option for      sends an error notification email to an operator, whose email
the tracker. Whenever CamTracker is called with this option,      address can be defined in the settings.
the solar tracker automatically aligns its two mirrors with the
calculated live position of the sun and enables the tracking of
the sun. Once the program has been terminated, the tracker
automatically moves back to its parking position.

Atmos. Meas. Tech., 14, 1111–1126, 2021                                            https://doi.org/10.5194/amt-14-1111-2021
F. Dietrich et al.: MUCCNET – Munich Urban Carbon Column network 1123
Appendix B: EM27/SUN calibration factors
Table B1. Scaling factors of the side-by-side measurements with reference to our standard instrument ma61 for CO2 and CH4 .
No. Date Species ma61 mb86 mc15 md16 me17
1 August 2018 CO2 (R 2 ) 1 (1.00) 0.99998 (0.99) – – –
CH4 (R 2 ) 1 (1.00) 0.99966 (0.99) – – –
2 February 2019 CO2 (R 2 ) 1 (1.00) 0.99960 (0.99) – – –
CH4 (R 2 ) 1 (1.00) 0.99996 (0.99) – – –
3 September 2019 CO2 (R 2 ) 1 (1.00) – 0.99922 (0.96) – –
CH4 (R 2 ) 1 (1.00) – 0.99946 (0.99) – –
4 December 2019 CO2 (R 2 ) 1 (1.00) 0.99995 (0.98) – 1.00034 (0.97) –
CH4 (R 2 ) 1 (1.00) 0.99999 (0.86) – 1.00041 (0.90) –
5 November 2020 CO2 (R 2 ) 1 (1.00) – – – 0.99989 (0.98)
CH4 (R 2 ) 1 (1.00) – – – 1.00175 (0.99)
Table B2. Scaling factors according to Frey et al. (2019) of our five
EM27/SUN instruments with respect to the reference EM27/SUN
(S/N 037) at KIT.
Instrument S/N Date CO2 CH4 CO
(yyyymmdd)
ma61 61 20170713 0.9993 0.9996 1.0000
mb86 86 20180214 0.9986 1.0002 0.9975
mc15 115 20190725 0.9998 1.0005 1.0272
md16 116 20191014 0.9998 0.9996 1.0055
me17 117 20191031 1.0015 1.0004 1.0058
https://doi.org/10.5194/amt-14-1111-2021 Atmos. Meas. Tech., 14, 1111–1126, 20211124 F. Dietrich et al.: MUCCNET – Munich Urban Carbon Column network
Code and data availability. The Python software Pyra and the
measurement data can be provided by the authors upon request. This work was supported by the German Research Founda-
The measurement data are also available at http://atmosphere.ei. tion (DFG) and the Technical University of Munich (TUM) in the
tum.de/ (Dietrich et al., 2021). framework of the Open Access Publishing Program.
Author contributions. FD and JC conceived the study and devel- Review statement. This paper was edited by Markus Rapp and re-
oped the concept; FD led the hardware and software development viewed by David Griffith and one anonymous referee.
as well as the setup of the sensor network. FD, BV and BR built the
enclosure systems. PA, BV and FD developed the software Pyra.
FD and JC performed the measurements. FD, JC and NN analyzed
the measurement data. FD and JC wrote the manuscript. References
Bréon, F. M., Broquet, G., Puygrenier, V., Chevallier, F., Xueref-
Remy, I., Ramonet, M., Dieudonné, E., Lopez, M., Schmidt,
Competing interests. The authors declare that they have no conflict
M., Perrussel, O., and Ciais, P.: An attempt at estimat-
of interest.
ing Paris area CO2 emissions from atmospheric concentra-
tion measurements, Atmos. Chem. Phys., 15, 1707–1724,
https://doi.org/10.5194/acp-15-1707-2015, 2015.
Acknowledgements. We thank Ludwig Heinle for developing the Butz, A., Dinger, A. S., Bobrowski, N., Kostinek, J., Fieber, L., Fis-
first version of a semi-automated enclosure system; Frank Hase cherkeller, C., Giuffrida, G. B., Hase, F., Klappenbach, F., Kuhn,
for testing and calibrating the instruments prior to the delivery and J., Lübcke, P., Tirpitz, L., and Tu, Q.: Remote sensing of volcanic
for providing us with two spectrometers each for our August 2018 CO2 , HF, HCl, SO2 , and BrO in the downwind plume of Mt.
and Oktoberfest 2019 campaign; André Butz for providing us with Etna, Atmos. Meas. Tech., 10, 1–14, https://doi.org/10.5194/amt-
his EM27/SUN in our August 2018 campaign; Jacob Hedelius for 10-1-2017, 2017.
his support in all matters concerning the GFIT retrieval algorithm; Chen, J., Viatte, C., Hedelius, J. K., Jones, T., Franklin, J. E., Parker,
Stephan Hachinger for helping us regarding the automated retrieval H., Gottlieb, E. W., Wennberg, P. O., Dubey, M. K., and Wofsy,
process on the Linux cloud; Jonathan Franklin, Taylor Jones, An- S. C.: Differential column measurements using compact solar-
dreas Luther and Ralph Kleinscheck for their support during our tracking spectrometers, Atmos. Chem. Phys., 16, 8479–8498,
measurement campaigns; Neil Humpage and Harmut Boesch for https://doi.org/10.5194/acp-16-8479-2016, 2016.
testing our enclosure system in Uganda; Martin Wild, Norbert Chen, J., Dietrich, F., Maazallahi, H., Forstmaier, A., Winkler,
Tuschl, Abdurahim Bingöl, Sebastian Zunterer and Bernhard Ober- D., Hofmann, M. E. G., Denier van der Gon, H., and Röck-
maier for manufacturing the enclosure systems; Markus Garham- mann, T.: Methane emissions from the Munich Oktoberfest, At-
mer and Mark Wenig for providing us with meteorological data; mos. Chem. Phys., 20, 3683–3696, https://doi.org/10.5194/acp-
First Mayor Andreas Janson (Feldkirchen) and the municipalities of 20-3683-2020, 2020.
Gräfelfing, Markt Schwaben, Oberschleißheim and Taufkirchen as Crisp, D., Pollock, H. R., Rosenberg, R., Chapsky, L., Lee, R. A.
well as Lothar Lauterbach from the ARCONE Technology Center M., Oyafuso, F. A., Frankenberg, C., O’Dell, C. W., Bruegge, C.
Höhenkirchen, who allowed us to use their rooftops as measurement J., Doran, G. B., Eldering, A., Fisher, B. M., Fu, D., Gunson, M.
sites; and our students Andreas Forstmaier, Adrian Wenzel, Nikolas R., Mandrake, L., Osterman, G. B., Schwandner, F. M., Sun, K.,
Hars, Jared Matzke, Yiming Zhao, Xu Hang, Dingcong Lu, Xiao Bi Taylor, T. E., Wennberg, P. O., and Wunch, D.: The on-orbit per-
and Michal Wedrat for their help during the campaigns and the net- formance of the Orbiting Carbon Observatory-2 (OCO-2) instru-
work setup as well as programming helpful automation scripts and ment and its radiometrically calibrated products, Atmos. Meas.
supporting the CAD model. TUM is grateful to Stefan Schwietzke Tech., 10, 59–81, https://doi.org/10.5194/amt-10-59-2017, 2017.
and Daniel Zavala-Araiza for helpful conversation in their role as Dietrich, F., Chen, J., Reger, B., Matzke, J., Forstmaier, A.,
part of the Office of the Chief Scientist of the Climate and Clean Air Bi, X., Luther A., Frey, M., Hase, F., and Butz, A.: First
Coalition Methane Science Studies (MSS), which are funded by the fully-automated differential column network for measuring
Environmental Defense Fund, the European Commission, the com- GHG emissions tested in Munich, EGU General Assembly
panies of the Oil and Gas Climate Initiative, and the United Nations 2019, Vienna, Austria, 7–12 April 2019, EGU2019–13327,
Environment Programme. TUM is additionally grateful for invita- https://doi.org/10.13140/RG.2.2.26867.17441, 2019.
tions to participate in workshops hosted by UNEP in the context of Dietrich, F., Rissmann, M., Makowski, M., and Chen, J.: Column
the Methane Science Studies. Greenhouse Gas Concentrations, available at: http://atmosphere.
ei.tum.de, last access: 8 February 2021.
Eldering, A., Taylor, T. E., O’Dell, C. W., and Pavlick, R.:
Financial support. This research has been supported by the The OCO-3 mission: measurement objectives and expected
Deutsche Forschungsgemeinschaft (DFG, German Research performance based on 1 year of simulated data, Atmos.
Foundation) (grant nos. CH 1792/2-1, INST 95/1544). Jia Chen is Meas. Tech., 12, 2341–2370, https://doi.org/10.5194/amt-12-
supported by the Technical University of Munich – Institute for 2341-2019, 2019.
Advanced Study, funded by the German Excellence Initiative and Feigenwinter, C., Vogt, R., and Christen, A.: Eddy Covariance Mea-
the European Union Seventh Framework Programme under grant surements Over Urban Areas, in: Eddy Covariance: A Practical
agreement number 291763. Guide to Measurement and Data Analysis, edited by Aubinet,
Atmos. Meas. Tech., 14, 1111–1126, 2021 https://doi.org/10.5194/amt-14-1111-2021F. Dietrich et al.: MUCCNET – Munich Urban Carbon Column network 1125
M., Vesala, T., and Papale, D., Springer Atmospheric Sciences, Workshop, 11–14 November 2019, Frascati (Rome), Italy,
Springer Netherlands, Dordrecht, https://doi.org/10.1007/978- https://doi.org/10.13140/RG.2.2.18535.80808, 2019.
94-007-2351-1_16, 377–397, 2012. Jones, T. S., Franklin, J. E., Chen, J., Dietrich, F., Hajny, K. D.,
Frey, M., Sha, M. K., Hase, F., Kiel, M., Blumenstock, T., Harig, Paetzold, J. C., Wenzel, A., Gately, C., Gottlieb, E., Parker, H.,
R., Surawicz, G., Deutscher, N. M., Shiomi, K., Franklin, J. E., Dubey, M., Hase, F., Shepson, P. B., Mielke, L. H., and Wofsy,
Bösch, H., Chen, J., Grutter, M., Ohyama, H., Sun, Y., Butz, A., S. C.: Assessing Urban Methane Emissions using Column Ob-
Mengistu Tsidu, G., Ene, D., Wunch, D., Cao, Z., Garcia, O., serving Portable FTIR Spectrometers and a Novel Bayesian In-
Ramonet, M., Vogel, F., and Orphal, J.: Building the COllabora- version Framework, Atmos. Chem. Phys. Discuss. [preprint],
tive Carbon Column Observing Network (COCCON): long-term https://doi.org/10.5194/acp-2020-1262, in review, 2021.
stability and ensemble performance of the EM27/SUN Fourier Kim, J., Shusterman, A. A., Lieschke, K. J., Newman, C.,
transform spectrometer, Atmos. Meas. Tech., 12, 1513–1530, and Cohen, R. C.: The BErkeley Atmospheric CO2 Ob-
https://doi.org/10.5194/amt-12-1513-2019, 2019. servation Network: field calibration and evaluation of low-
Gisi, M., Hase, F., Dohe, S., and Blumenstock, T.: Camtracker: cost air quality sensors, Atmos. Meas. Tech., 11, 1937–1946,
a new camera controlled high precision solar tracker sys- https://doi.org/10.5194/amt-11-1937-2018, 2018.
tem for FTIR-spectrometers, Atmos. Meas. Tech., 4, 47–54, Klappenbach, F., Bertleff, M., Kostinek, J., Hase, F., Blumenstock,
https://doi.org/10.5194/amt-4-47-2011, 2011. T., Agusti-Panareda, A., Razinger, M., and Butz, A.: Accurate
Gisi, M., Hase, F., Dohe, S., Blumenstock, T., Simon, A., and mobile remote sensing of XCO2 and XCH4 latitudinal transects
Keens, A.: XCO2 $-measurements with a tabletop FTS using so- from aboard a research vessel, Atmos. Meas. Tech., 8, 5023–
lar absorption spectroscopy, Atmos. Meas. Tech., 5, 2969–2980, 5038, https://doi.org/10.5194/amt-8-5023-2015, 2015.
https://doi.org/10.5194/amt-5-2969-2012, 2012. Lamb, B. K., Cambaliza, M. O. L., Davis, K. J., Edburg, S. L.,
Gurney, K. R., Romero-Lankao, P., Seto, K. C., Hutyra, L. R., Ferrara, T. W., Floerchinger, C., Heimburger, A. M. F., Hern-
Duren, R., Kennedy, C., Grimm, N. B., Ehleringer, J. R., Mar- don, S., Lauvaux, T., Lavoie, T., Lyon, D. R., Miles, N., Prasad,
cotullio, P., Hughes, S., Pincetl, S., Chester, M. V., Runfola, K. R., Richardson, S., Roscioli, J. R., Salmon, O. E., Shep-
D. M., Feddema, J. J., and Sperling, J.: Climate change: Track son, P. B., Stirm, B. H., and Whetstone, J.: Direct and In-
urban emissions on a human scale, Nature, 525, 179–181, direct Measurements and Modeling of Methane Emissions in
https://doi.org/10.1038/525179a, 2015. Indianapolis, Indiana, Environ. Sci. Technol., 50, 8910–8917,
Hase, F., Frey, M., Blumenstock, T., Groß, J., Kiel, M., Kohlhepp, https://doi.org/10.1021/acs.est.6b01198, 2016.
R., Mengistu Tsidu, G., Schäfer, K., Sha, M. K., and Orphal, J.: Luther, A., Kleinschek, R., Scheidweiler, L., Defratyka, S.,
Application of portable FTIR spectrometers for detecting green- Stanisavljevic, M., Forstmaier, A., Dandocsi, A., Wolff, S.,
house gas emissions of the major city Berlin, Atmos. Meas. Dubravica, D., Wildmann, N., Kostinek, J., Jöckel, P., Nickl, A.-
Tech., 8, 3059–3068, https://doi.org/10.5194/amt-8-3059-2015, L., Klausner, T., Hase, F., Frey, M., Chen, J., Dietrich, F., Ne¸cki,
2015. J., Swolkień, J., Fix, A., Roiger, A., and Butz, A.: Quantifying
Hase, F., Frey, M., Kiel, M., Blumenstock, T., Harig, R., Keens, A., CH4 emissions from hard coal mines using mobile sun-viewing
and Orphal, J.: Addition of a channel for XCO observations to Fourier transform spectrometry, Atmos. Meas. Tech., 12, 5217–
a portable FTIR spectrometer for greenhouse gas measurements, 5230, https://doi.org/10.5194/amt-12-5217-2019, 2019.
Atmos. Meas. Tech., 9, 2303–2313, https://doi.org/10.5194/amt- Makarova, M. V., Alberti, C., Ionov, D. V., Hase, F., Foka, S.
9-2303-2016, 2016. C., Blumenstock, T., Warneke, T., Virolainen, Y., Kostsov, V.,
Hedelius, J. K., Viatte, C., Wunch, D., Roehl, C. M., Toon, G. C., Frey, M., Poberovskii, A. V., Timofeyev, Y. M., Paramonova,
Chen, J., Jones, T., Wofsy, S. C., Franklin, J. E., Parker, H., N., Volkova, K. A., Zaitsev, N. A., Biryukov, E. Y., Osipov, S.
Dubey, M. K., and Wennberg, P. O.: Assessment of errors and I., Makarov, B. K., Polyakov, A. V., Ivakhov, V. M., Imhasin,
biases in retrievals of XCO2 , XCH4 , XCO , and XN2 O from a H. Kh., and Mikhailov, E. F.: Emission Monitoring Mobile Ex-
0.5 cm−1 resolution solar-viewing spectrometer, Atmos. Meas. periment (EMME): an overview and first results of the St. Pe-
Tech., 9, 3527–3546, https://doi.org/10.5194/amt-9-3527-2016, tersburg megacity campaign-2019, Atmos. Meas. Tech. Discuss.
2016. [preprint], https://doi.org/10.5194/amt-2020-87, in review, 2020.
Heinle, L. and Chen, J.: Automated enclosure and protec- McKain, K., Down, A., Raciti, S. M., Budney, J., Hutyra, L. R.,
tion system for compact solar-tracking spectrometers, Atmos. Floerchinger, C., Herndon, S. C., Nehrkorn, T., Zahniser, M. S.,
Meas. Tech., 11, 2173–2185, https://doi.org/10.5194/amt-11- Jackson, R. B., Phillips, N., and Wofsy, S. C.: Methane emis-
2173-2018, 2018. sions from natural gas infrastructure and use in the urban region
Helfter, C., Famulari, D., Phillips, G. J., Barlow, J. F., Wood, C. of Boston, Massachusetts, P. Natl. Acad. Sci. USA, 112, 1941–
R., Grimmond, C. S. B., and Nemitz, E.: Controls of carbon 1946, https://doi.org/10.1073/pnas.1416261112, 2015.
dioxide concentrations and fluxes above central London, At- Plant, G., Kort, E. A., Floerchinger, C., Gvakharia, A., Vimont, I.,
mos. Chem. Phys., 11, 1913–1928, https://doi.org/10.5194/acp- and Sweeney, C.: Large Fugitive Methane Emissions From Ur-
11-1913-2011, 2011. ban Centers Along the U.S. East Coast, Geophys. Res. Lett., 46,
Humpage, N., Boesch, H., Dietrich, F., and Chen, J.: Testing 8500–8507, https://doi.org/10.1029/2019GL082635, 2019.
an automated enclosure system for a ground-based green- Sha, M. K., De Mazière, M., Notholt, J., Blumenstock, T., Chen, H.,
house gas remote sensing spectrometer; application to the Dehn, A., Griffith, D. W. T., Hase, F., Heikkinen, P., Hermans, C.,
validation of Sentinel-5 Precursor carbon monoxide and Hoffmann, A., Huebner, M., Jones, N., Kivi, R., Langerock, B.,
methane, in: Copernicus Sentinel-5 Precursor Validation Team Petri, C., Scolas, F., Tu, Q., and Weidmann, D.: Intercomparison
of low- and high-resolution infrared spectrometers for ground-
https://doi.org/10.5194/amt-14-1111-2021 Atmos. Meas. Tech., 14, 1111–1126, 2021You can also read