Ionian Abyssal Plain: a window into the Tethys oceanic lithosphere
←
→
Page content transcription
If your browser does not render page correctly, please read the page content below
Solid Earth, 10, 447–462, 2019
https://doi.org/10.5194/se-10-447-2019
© Author(s) 2019. This work is distributed under
the Creative Commons Attribution 4.0 License.

Ionian Abyssal Plain: a window into the Tethys oceanic lithosphere
Anke Dannowski1 , Heidrun Kopp1,2 , Frauke Klingelhoefer3 , Dirk Klaeschen1 , Marc-André Gutscher4 ,
Anne Krabbenhoeft1 , David Dellong3,4 , Marzia Rovere5 , David Graindorge4 , Cord Papenberg1 , and Ingo Klaucke1
1 Dynamics    of the Ocean Floor, GEOMAR, Helmholtz Centre for Ocean Research Kiel, 24148 Kiel, Germany
2 Department   of Geosciences, Kiel University, 24118 Kiel, Germany
3 Géosciences Marines, Ifremer, Centre de Brest, Plouzané, 29280, France
4 Laboratoire Géosciences Océan, IUEM, Université Brest, CNRS, Plouzané, 29280, France
5 Institute of Marine Sciences – National Research Council, ISMAR-CNR, Bologna, 40129, Italy

Correspondence: Anke Dannowski (adannowski@geomar.de)

Received: 20 November 2018 – Discussion started: 10 December 2018
Revised: 19 February 2019 – Accepted: 21 March 2019 – Published: 3 April 2019

Abstract. The nature of the Ionian Sea crust has been the         1   Introduction
subject of scientific debate for more than 30 years, mainly
because seismic imaging of the deep crust and upper man-
tle of the Ionian Abyssal Plain (IAP) has not been conclu-        Starting back in the Cretaceous the ongoing convergence
sive to date. The IAP is sandwiched between the Calabrian         between the African and Eurasian plates results in a com-
and Hellenic subduction zones in the central Mediterranean.       plex tectonic setting in the central Mediterranean Sea. This
A NNE–SSW-oriented 131 km long seismic refraction and             complexity includes segmented and strongly curved subduc-
wide-angle reflection profile, consisting of eight ocean bot-     tion zones, shortening of overriding plates, subduction roll-
tom seismometers and hydrophones, was acquired in 2014.           back, the formation of extensional back-arc basins, and the
The profile was designed to univocally confirm the proposed       existence of several proposed continental or oceanic mi-
oceanic nature of the IAP crust as a remnant of the Tethys        croplates (e.g. Dewey et al., 1989; Faccenna et al., 2001,
and to confute its interpretation as a strongly thinned part      2014; Stampfli et al., 2002; Polonia et al., 2016; Barreca et
of the African continental crust. A P -wave velocity model        al., 2016, and references therein). However, seismicity and
developed from travel-time forward modelling is refined by        geodesy measurements show that strain is concentrated in
gravimetric data and synthetic modelling of the seismic data.     narrow bands bounding the microplates that are moving in-
A roughly 6–7 km thick crust with velocities ranging from         dependently from the overall convergent motion (Faccenna
5.1 to 7.2 km s−1 , top to bottom, can be traced throughout the   et al., 2014). The lithosphere of the Ionian Sea constitutes
IAP. In the vicinity of the Medina seamounts at the southern      one of these microplates, for which the long-lasting contra-
IAP boundary, the crust thickens to about 9 km and seismic        dictions in the interpretations of the nature of the Ionian Sea
velocities decrease to 6.8 km s−1 at the crust–mantle bound-      crust (“oceanic” vs. “thinned continental”) result from a lack
ary. The seismic velocity distribution and depth of the crust–    of conclusive imaging of the deep crust and upper mantle,
mantle boundary in the IAP document its oceanic nature and        preventing a clear characterization. Of special difficulty is the
support the interpretation of the IAP as a remnant of the         Messinian evaporite unit, which massively impedes seismic
Tethys lithosphere with the Malta Escarpment as a transform       energy penetration and hence limits the data quality of geo-
margin and a Tethys opening in the NNW–SSE direction.             physical imaging methods. The challenges in imaging have
                                                                  ignited a long-standing debate about the deeper structure and
                                                                  the nature of the crust and lithosphere of the Ionian Abyssal
                                                                  Plain (IAP). The interpretations range from continental or
                                                                  hyperextended continental lithosphere (Finetti and Morelli,
                                                                  1973; Cloething et al., 1980; Baldi et al., 1982; Makris et al.,
                                                                  1986; Ferrucci et al., 1991; Cernobori et al., 1996; Mantovani

Published by Copernicus Publications on behalf of the European Geosciences Union.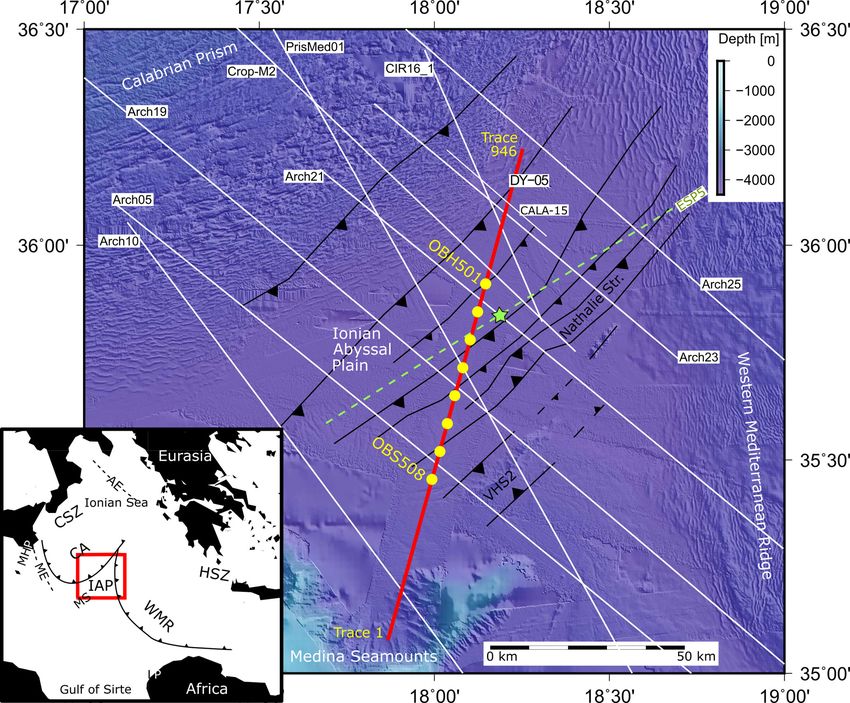
448                                                        A. Dannowski et al.: A window into the Tethys oceanic lithosphere

et al., 2002; Hieke et al., 2003; Roure et al., 2012) to oceanic    tively subducting underneath Eurasia along both subduction
or atypical oceanic lithosphere (Finetti, 1981, 1982, 2003;         zones, causing a high potential for devastating earthquakes
Finetti et al., 1996; Makris et al., 1986; Leister et al., 1986;    and tsunamis. Both subduction zones are characterized by
de Voogd et al., 1992; Faccenna et al., 2001, 2004; Catalano        large accretionary prisms (Calabrian Arc to the north and
et al., 2001; Gallais et al., 2011, 2012; Speranza et al., 2012;    western Mediterranean Ridge (WMR) to the east), which
Dellong et al., 2018). A new feature was added to the discus-       have advanced into the Ionian Sea and cover vast parts of the
sion by Polonia et al. (2017) interpreting diapiric structures to   IAP. Imaging of the Ionian lithosphere is difficult because of
be constructed of serpentine, similar to findings in the back-      the voluminous sedimentary cover of the accretionary prism
arc basin of the Tyrrhenian Sea (Prada et al., 2016). If this       (Dellong et al., 2018), which furthermore is underlain by a
is true, serpentine should be present in the subducting Ionian      thick sequence of Messinian evaporites (Ryan et al., 1982).
plate.                                                              Only a relatively small “window” of approximately 100 km
   Finetti (1982) used geological, geophysical, and drilling        length and 60 km width remains undisturbed by the highly
exploration data to infer that the crust in the IAP is of           deformed accreted sequences advancing from the north and
oceanic type adjacent to continental crust. The IAP was in-         east or by the Medina seamount cluster of volcanic origin
terpreted to consist of oceanic type crust by a two-ship deep       found to the south (Finetti, 1982). To the south and west,
refraction and reflection seismic experiment (de Voogd et al.,      the Ionian Sea is bounded by the continental platforms of
1992). Oceanic crust east of the Malta Escarpment is inferred       Libya and the Malta–Hyblean plateau, respectively. The tran-
from the deep reflection seismic CROP lines M23A and                sition from the deep-ocean environment of the IAP to the
M3 (Finetti, 2003). Furthermore, time and pre-stack depth-          shallow-water carbonate platform of the continental Malta–
migrated reflection seismic data (Gallais et al., 2011, 2012)       Hyblean plateau is marked by the Malta Escarpment (Mi-
and magnetic anomaly data (Speranza et al., 2012) indicated         callef et al., 2016). This distinct, 290 km long and 3.2 km
oceanic crust within the IAP. Contrasting interpretations are       high scarp is described as an inherited transform margin from
based on echo sounding and seismic reflection data (Hieke et        the early Mesozoic (Argnani and Bonazzi, 2005; Micallef
al., 2003) and a paleo-geographic analysis of faults (Roure et      et al., 2016; Dellong et al., 2018) that traces the transition
al., 2012), interpreting the crust of the IAP to be of continen-    from the oceanic domain of the Ionian Sea to the Tertiary–
tal type. While the majority of studies today infer an oceanic      Quaternary continental foreland domain of the Pelagian plat-
type of crust in the IAP (LeBreton et al., 2017; Dellong et al.,    form (Barreca et al., 2016).
2018), robust information on the crustal structure of the IAP,         Direct sampling of the sediment cover is available from
including Moho depth and seismic velocities, to confirm the         ODP–DSDP sites (Ryan et al., 1973), while sub-basement
oceanic nature of the crust are still sparse.                       structure was mainly inferred from potential field and refrac-
   Understanding the geodynamic evolution and intricate in-         tion data. Early studies (Locardi and Nicolich, 1988; Nicol-
terplay between continental and oceanic fragments hence             ich, 1989; de Voogd et al., 1992; Scarascia et al., 1994) con-
requires exact knowledge of the crustal and lithospheric            sidered the crust to be 15–20 km thick. Later investigations
structures. Given its location in the central Mediterranean         refined this value to 8–10 km (Catalano et al., 2001; Gal-
Sea, the Ionian Sea is a key element in reconstructing the          lais et al., 2011; Dellong et al., 2018). Important insight has
kinematic evolution of the central–eastern Mediterranean            come from heat flow measurements, which revealed that very
(Finetti, 1982). To fill this gap, RV Meteor cruise M111 in         low values prevail in the eastern Mediterranean compared
2014 targeted the crustal and lithospheric structure of the         to the western Mediterranean (Jiménez-Munt and Negredo,
Ionian Abyssal Plain (Fig. 1). Along line DY-05, modern             2003), indicating distinct differences in the age and thickness
seismic refraction and wide-angle reflection data were ac-          of the lithosphere in these realms (younger, warmer litho-
quired using four ocean bottom seismometers (OBSs) and              sphere in the west; older, colder, and thicker lithosphere in
four ocean bottom hydrophones (OBHs). The aim of this               the east). Low heat flux values of 30–40 mW m−2 (Della Ve-
work is to provide information on the seismic velocity distri-      dova and Pellis, 1989) from the Ionian basin underpin its
bution and crustal structure to assess the debate on the nature     oceanic origin of at least Mesozoic age, coherent with the
of the lithosphere in the IAP.                                      Pangea breakup and rifting of the Neo-Tethys Ocean during
                                                                    the late Paleozoic or early Mesozoic (Ricou, 1994; Stampfli
                                                                    et al., 2002; Frizon de Lamotte et al., 2015). In addition,
2   Geological setting                                              the relatively high Bouguer gravity anomaly of the IAP with
                                                                    values exceeding 200 mgal (Morelli et al., 1975) suggests a
The Ionian Sea and its abyssal plain are sandwiched be-             shallow Moho boundary (Dellong et al., 2018). The sea-floor
tween the Calabrian (CSZ) and Hellenic (HSZ) subduction             magnetic pattern of the IAP indicates that the Ionian Sea
zones in the central–eastern part of the Mediterranean basin        lithosphere was formed around 220–230 Ma during Triassic
(Fig. 1). The IAP comprises an asymmetric basin of approx-          times, and it is considered a remnant of the Tethys Ocean
imately 600 km length and 330 km width with water depth             (Speranza et al., 2012).
reaching ∼ 4100 m in its central part. Its lithosphere is ac-

Solid Earth, 10, 447–462, 2019                                                                www.solid-earth.net/10/447/2019/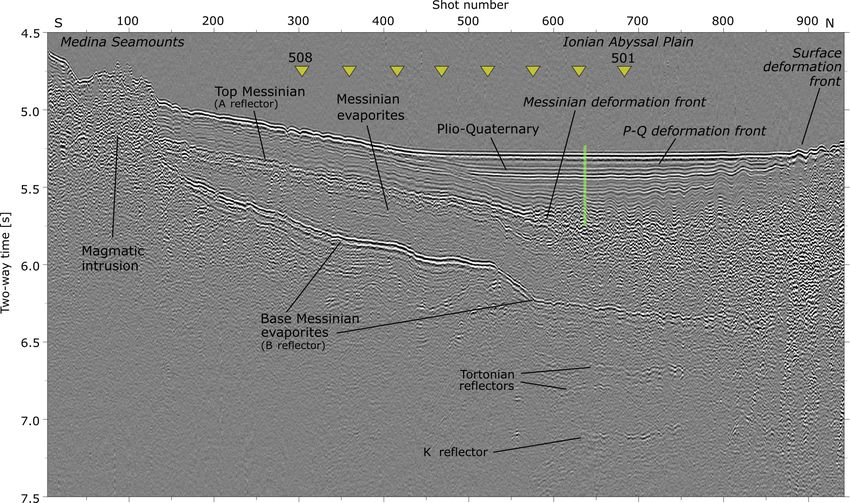
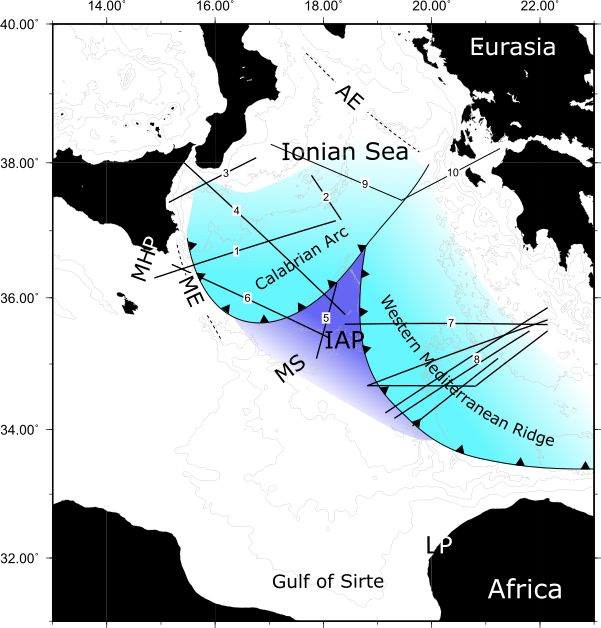
A. Dannowski et al.: A window into the Tethys oceanic lithosphere                                                                        449

Figure 1. Map of the study area showing the location of the OBS profile DY-05 (red line) and the OBS locations (yellow dots). White lines
present MCS data (Gallais et al., 2011, 2012; Polonia et al., 2011; Gutscher et al., 2017). The green star marks the location of the ESP5
(de Voogd et al., 1992) and the location of DSDP site 347 (Cita et al., 1978; Hsü et al., 1978) next to it. The ESP shot line is indicated by
the green dashed line. Black lines indicate thrust faults (Gallais et al., 2011). The black-and-white map shows the regional structures around
the study area: AE – Apulian Escarpment, CA – Calabrian Arc, CSZ – Calabrian subduction zone, HSZ – Hellenic subduction zone, IAP –
Ionian Abyssal Plain, ME – Malta Escarpment, MHP – Malta–Hyblean platform, MS – Medina seamounts, LP – Libyan platform, WMR –
western Mediterranean Ridge.

   The IAP lithosphere is subducting beneath the Calabrian               al. (2011), and Roure et al. (2012) seismic data show thrust
Arc, which is proposed to have formed in the late Miocene                faulting and inversion structures in the IAP (Fig. 1), which
during the opening of the Tyrrhenian Sea (Faccenna et                    are indicative of active deformation and would contradict
al., 2001; Chiarabba et al., 2008). Clear Wadati–Benioff                 a totally “rigid” connection to Africa. Roure et al. (2012)
zones are imaged below the CSZ in the west (Selvaggi and                 favour the IAP to be a thinned part of the African Plate.
Chiarabba, 1995) and below the HSZ in the north (Hatzfeld                The occurrence of active deformations in the IAP (Gallais
et al., 1993), and recent studies interpreted the slabs to be            et al., 2011, 2012; Polonia et al., 2011) would support the
composed of subducted oceanic crust (Chiarabba et al., 2008;             idea of an independent Adria microplate (i.e. Ustaszewski et
Pearce et al., 2012). The Ionian basin is bounded by the Apu-            al., 2008; Handy et al., 2010, and references therein) allow-
lian Escarpment (AE) in the north and the Malta Escarpment               ing it to move relative to Africa, at least in Neogene times
(ME) in the southwest. The escarpments are interpreted to be             (LeBreton et al., 2017). During Neogene times Ustaszewski
the conjugated passive margins separated during the opening              et al. (2008) determined a ∼ 20◦ counterclockwise rotation
of the Tethys (Catalano et al., 2001; Chamot-Rooke et al.,               of Adria relative to Eurasia, while only ∼ 2◦ of rotation has
2005). In contrast, Gallais et al. (2011) and Frizon de Lam-             been accommodated between Europe and Africa.
otte et al. (2011) interpreted the ME differently and see it as
part of a continental transform margin separating the conti-
nental domain west of the ME from the deep Ionian basin.                 3    Data and methodology
The oceanic nature of the Ionian lithosphere supports the hy-
pothesis that the Adriatic microplate, which comprises the               During RV Meteor cruise M111 wide-angle refraction seis-
Ionian Sea in its southernmost portion, was a rigid promon-              mic data were acquired simultaneously with multi-channel
tory of Africa (e.g. Channell et al., 1979; Dewey et al., 1989).         seismic reflection seismic (MCS) data. Profile DY-05 is
However, according to Gallais et al. (2011, 2012), Polonia et            131 km long and crosses the IAP from SW to NE (red line in

www.solid-earth.net/10/447/2019/                                                                         Solid Earth, 10, 447–462, 2019
450                                                         A. Dannowski et al.: A window into the Tethys oceanic lithosphere

Figure 2. Stacked and bandpass-filtered (f = 20, 30, 80, 120 Hz) multi-channel data (MCS) along profile DY-05. Yellow triangles mark the
OBS locations along the MCS profile. Green bar marks the projected location of DSDP site 374 on the profile DY-05.

Fig. 1). The location of the line was chosen to cover the area        seamounts to ∼ 4060 m (∼ 5.3 s twt) in the central portion
of the IAP that is neither affected by the emplacement of vol-        of the profile. The water depth declines again towards the
canic structures (Medina seamounts in the south) nor by the           northern end of the line, which starts to cover the Ionian ac-
advancing thick accretionary prisms of deforming sediment             cretionary prism (compare Fig. 1). North of the rough sea
in the north and east in order to gain an “unobstructed view”         floor of the Medina seamounts, the data section is dominated
into the deep IAP crust and lithosphere. The central part of          by the thick sedimentary and evaporitic sequences which fill
the profile was covered by eight sea-floor stations (OBH501–          the basin. Stratified sediment layers are softly inclined along
OBS508) with a spacing of 7.4 km. Shooting (946 shots) was            the southern part of the profile between shot numbers 150
extended for ∼ 40 km beyond the first and last instrument,            and 450. Towards the centre of the basin, horizontally lay-
respectively, in order to record long offsets from shots trav-        ered, sub-parallel sequences are onlapping these strata be-
elling through the subsurface. An airgun array consisting of          tween shots 450 and 550. These units are underlain by a thick
six G-gun clusters with a total volume of 84 L (5440 cu in) at        sequence of incoherent amplitudes truncating the sediment
210 bar was fired at a 60 s shot interval. Data quality was very      layers in the south. A prominent strong-amplitude reflector
good and arrivals were recorded over the entire profile length.       may be traced from shot point 150 at 5.2 s to around shot
Mantle phases, PmP reflections, and Pn phases were recorded           number 550 at 5.7 s. Whereas a coherent layering is visible
on all stations. A mini-streamer with four channels spread            in the units above this reflector, the units below are seismi-
over an active length of 65 m was towed at a depth of 8 m be-         cally much more opaque. The base of these units is marked
tween the airguns. For each channel, six hydrophones with a           by a strong negative reflector at 5.5 (near trace 200) to 6.3 s
distance of 0.5 m were grouped together. The streamer served          (near trace 800). Below this reflector, the seismic signal is
two purposes: it was used to control the correct functioning          strongly attenuated and no coherent structures may be iden-
of the airguns and to provide information on the uppermost            tified. Three deep reflectors to the north at 6.6 s, 6.8 s, and
sedimentary structures in regions where sea-floor roughness           at 7.15 s lose their seismic amplitude coherence beyond shot
does not cause aliasing. A medium gun delay of 78 ms could            numbers 600 and 750, respectively.
be identified, with one gun firing out of sequence, as recog-
nized on the streamer data near trace 800 in Fig. 2.                  3.2   Description of the seismic wide-angle reflection and
                                                                            refraction data
3.1   Description of the multi-channel seismic reflection
      data                                                            Figure 3 presents seismic shot sections, including picked and
                                                                      calculated travel-time picks, of the two outermost stations,
The stacked MCS data section displays the upper subsur-               OBH501 and OBS508. In the following we want to describe
face structure in two-way travel time (twt; Fig. 2). The water        the recorded data using pick phases, pick colours, and layer
depth along the profile increases from ∼ 3570 m (∼ 4.7 s twt)         names, which can be found in Table 1. The earliest arrival at
at the southern termination in the vicinity of the Medina             the stations is the direct wave through the water picked in yel-

Solid Earth, 10, 447–462, 2019                                                                   www.solid-earth.net/10/447/2019/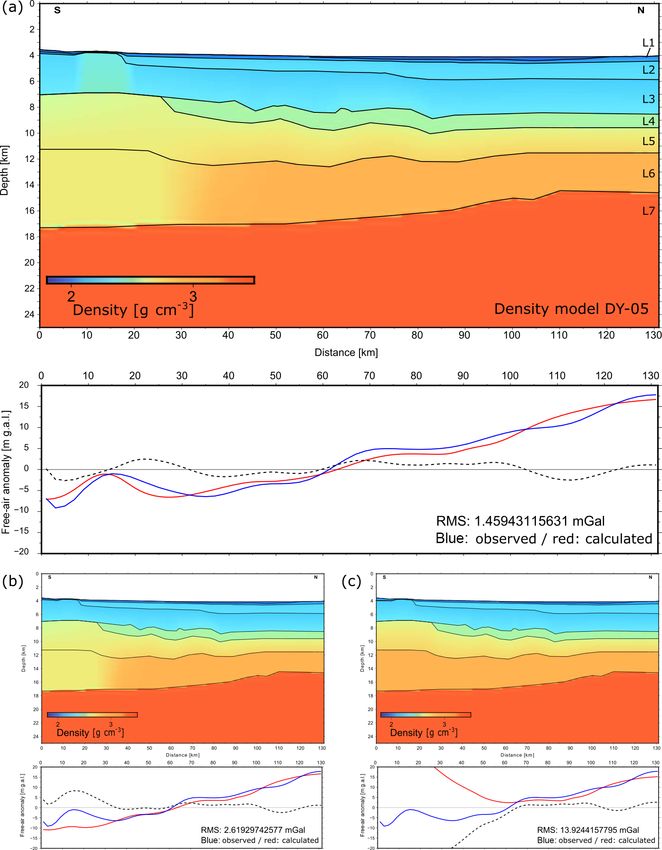
A. Dannowski et al.: A window into the Tethys oceanic lithosphere 451
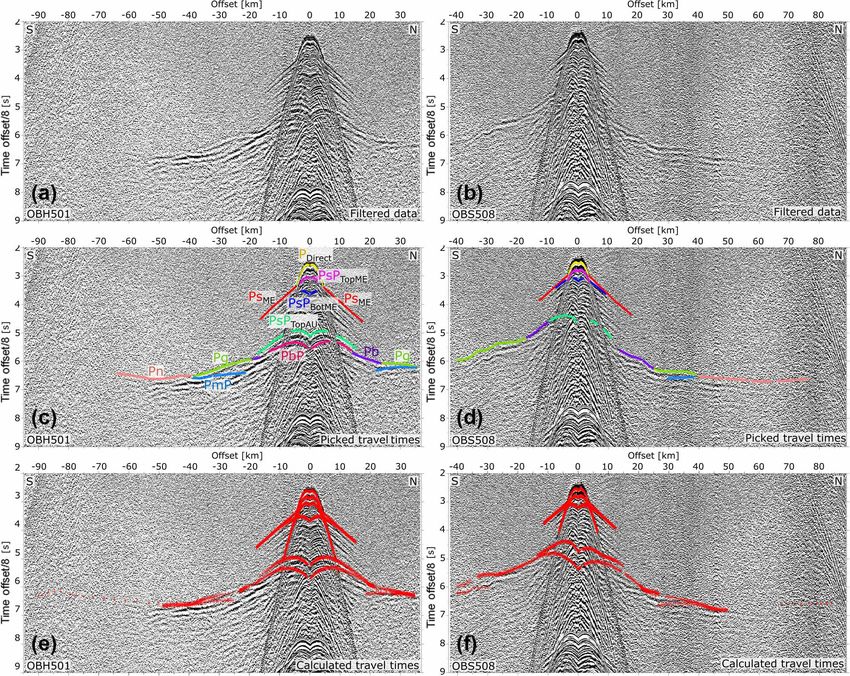
Figure 3. Seismic record sections of OBH501 and OBS508. Panels (a) and (b) show processed data. Panels (c) and (d) show the travel-time
picks used for the forward modelling (please refer to phase definitions in the text). Calculated travel times from the final model are displayed
in (e) and (f). Data are plotted with a reduced time of 8 km s−1 .
low (PDirect, phase 1). Magenta picks (PsPTopME, phase 3) tors originate from the base of the slow sediment unit and the
represent the base of the youngest sediment units. The ge- basement, respectively. At larger offsets, two crustal phases
ometry of these sediment layers is well imaged in the multi- (violet (Pb, phase 8) and light green (Pg, phase 10) picks)
channel seismic data (Fig. 2) by a strong positive reflector could be identified. At about 35–40 km in offset the mantle
(PsPTopME). Red picks (PsME, phase 2) follow the first ar- reflection is observed and picked in light blue (PmP, phase
rivals to an offset of ∼ 15 km (3.5 to 4.5 s), representing re- 11), with mantle-refracted phases in bright red (Pn, phase
fracted waves travelling through the evaporite layers with an 12). Except for OBS508, where the PmP phase was observed
apparent velocity of 4.5 km s−1 . At about 15 km offset from on the northern branch only, all instruments show wide-angle
the station, at the limit of the red picks (phase 2), a prominent mantle reflections (phase 11) at both branches.
shadow zone indicates a strong negative velocity inversion in
the subsurface including a thick low-velocity zone. The near- 3.3 Methodology and modelling strategy
offset early arrivals are offset by 1.5 s to the deeper crustal
first-arrival phases (light green picks, Pg, phase 10) that have By developing a velocity model for profile DY-05 we tar-
been recorded starting at roughly 6 s. A strong negative re- geted the structure of the sedimentary strata, the crust, and
flector starting at zero offset is present on all OBS record the uppermost mantle. This was achieved by forward mod-
sections and is picked in dark blue (PsPBotME, phase 5). It elling of the observed travel times using the ray-tracing soft-
marks the base of the Messinian unit at ∼ 3.6 s at zero off- ware RAYINVR (Zelt and Smith, 1992; Zelt and Forsyth,
set. After a ∼ 1.4 s long sequence of high-amplitude reflec- 1994). It runs on the graphical user interface MODELING
tors follows a low-frequency high-amplitude reflector (dark (Fujie et al., 2008). Travel times were picked using the soft-
green, PsPTopAU, phase 7) visible between 0 and 20 km off- ware PASTEUP (Fujie et al., 2008). Attempts to apply tomo-
set at ∼ 5 s. Underneath, a second similar reflector is picked graphic inversion approaches failed due to the presence of
in dark magenta (PbP, phase 9) at ∼ 5.6 s. These two reflec- a thick low-velocity zone. The final forward model (Fig. 4)
was developed starting with the water layer and progressing
www.solid-earth.net/10/447/2019/ Solid Earth, 10, 447–462, 2019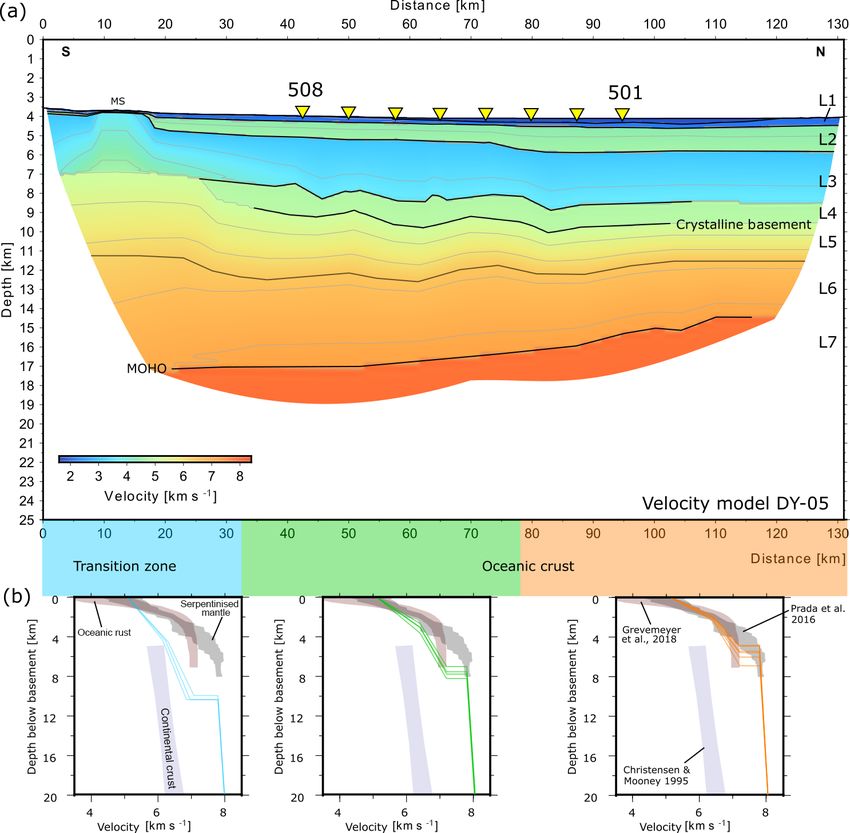
452                                                          A. Dannowski et al.: A window into the Tethys oceanic lithosphere

Figure 4. (a) Final velocity model for profile DY-05 obtained from forward modelling. (b) Velocity–depth functions (blue, green, and orange)
starting at the basement and extracted from the final velocity model every 10 km according to the coloured sections. Observed velocities are
compared to oceanic crust (red grey ensemble) (Grevemeyer et al., 2018), continental crust (blue ensemble) (Christensen and Mooney, 1995),
and serpentinized mantle (dark grey ensemble) found in the Tyrrhenian Sea (Prada et al., 2016). MS – Medina seamounts.

downward layer by layer. The geometry of the upper lay-                 fitting the data, especially in the inversion modelling. An
ers was constrained by the MCS data (Fig. 2). The geome-                overall normalized Chi2 = 1 in travel-time misfit should be
try of the deeper layer boundaries was optimized by using               achieved for the final model. We receive velocity uncertain-
the inversion algorithm of RAYINVR. The approach of com-                ties of up to 0.05 km s−1 for the shallow sedimentary units,
bined forward modelling and layer-wise inversion was cho-               while the velocity uncertainties for the low-velocity sedimen-
sen to find the simplest model to fit all data without over- or         tary layer are higher at ∼ 0.2 km s−1 . At the crustal level and
under-fitting the data. The velocity and interface nodes have           deeper, uncertainties reach 0.1 km s−1 . Due to the high num-
been spaced irregularly. The velocities are tied to layer inter-        ber of observed PmP arrivals and the dense shot spacing, the
faces at the top and bottom of each layer. Between the nodes,           uncertainty for the depth of the Moho is ∼ 1 km.
velocity and interface information is interpolated (Zelt and                To corroborate the seismic velocity model obtained by
Smith, 1992; Zelt, 1999). The root mean square (RMS) mis-               seismic travel-time forward modelling, complementary two-
fit and the Chi2 value for each phase are provided in Table 1.          dimensional gravity forward modelling was performed. Es-
Pick uncertainties were assigned to avoid over- or under-               pecially at the profile ends with only moderate station cov-

Solid Earth, 10, 447–462, 2019                                                                      www.solid-earth.net/10/447/2019/
A. Dannowski et al.: A window into the Tethys oceanic lithosphere                                                                       453

Figure 5. (a) The density distribution calculated for profile DY-05 based on seismic velocities and minor adjustments to fit the observed FAA
in panels (b, c). (b) Case study for the local influence of the Medina seamounts on the model response. (c) Case study for oceanic crust over
the entire profile length. Black dashed line shows the residuum of the observed and calculated data.

erage, the seismic velocity model is highly uncertain and                   To validate the forward modelling, synthetic data based
gravity modelling (Fig. 5) helps to constrain and adjust the             on the final seismic velocity model were calculated and
model. The free-air anomaly (FAA) along the 2-D profile was              compared to the recorded data (Fig. 6). A finite-difference
extracted from satellite altimetry data (Sandwell and Smith,             scheme for the solution of the elastic isotropic wave equa-
1997). Based on the seismic velocities an initial 2-D density            tion from Hestholm et al. (1994) was used to calculate the
model was constructed. The model response (Talwani et al.,               synthetic data for a 2-D structure. The input velocity model
1959) was compared to the observed free-air anomaly data                 had a grid cell size of 50 m. The seismogram was computed
along the profile. Minor adjustments to the model densities,             with a P -wave source frequency up to 30 Hz, while a 2 ms
all within common density–velocity relationships (Carlson                time step was chosen. No random noise was added.
and Herrick, 1990; Christensen and Mooney, 1995), were ap-
plied to achieve a reasonable fit between calculated and ob-
served FAA.

www.solid-earth.net/10/447/2019/                                                                        Solid Earth, 10, 447–462, 2019
454                                                          A. Dannowski et al.: A window into the Tethys oceanic lithosphere

Table 1. Observed seismic phases with their pick number, number of picks, pick uncertainty, RMS fit, and Chi2 to allow for an estimation of
the robustness of the seismic velocity model obtained from forward modelling.

                  Phase         Phase number (pick colour)    Number picks      RMS (s)     Chi2    Pick uncertainty (s)
                  All picks                                            8128        0.064    0.979
                  PDirect       1 (yellow)                              422        0.004    0.123                 0.010
                  PsPTopME      3 (magenta)                             299        0.012    0.378                 0.020
                  PsME          2 (red)                                1017        0.019    0.867                 0.020
                  PsPBotME      5 (dark blue)                           313        0.020    0.986                 0.020
                  PsPTopAU      7 (dark green)                          985        0.072    1.054                 0.070
                  PbP           9 (dark magenta)                        919        0.078    1.239                 0.070
                  Pb            8 (violet)                              424        0.089    1.637                 0.070
                  Pg            10 (light green)                       1349        0.079    1.271                 0.070
                  PmP           11 (light blue)                        1324        0.048    0.392                 0.080
                  Pn            12 (bright red)                        1498        0.072    1.038                 0.080

                                                                           The base of the Messinian evaporites has been termed the
                                                                        B reflector by Finetti and Morelli (1972). We interpret phase
                                                                        5 (PsPBotME , dark blue picks) in the OBS seismic sections
                                                                        (Fig. 3) to correspond to this reflector. The B reflector dis-
                                                                        appears in our seismic section near trace 800 towards the
                                                                        north due to seismic scattering. Three reflectors identified
                                                                        near trace 650 at 6.6, 6.8, and at 7.15 s indicate pre-Messinian
                                                                        sedimentary layering. We link the upper two reflectors to
                                                                        Tortonian age, while the deeper reflector at 7.15 s is inter-
                                                                        preted to be the so-called K reflector, as identified by Gallais
                                                                        et al. (2011) in the crossing seismic line Arch21 (Fig. 1).
                                                                           At trace 100 of the MCS profile the layering of the up-
                                                                        per sediments is disturbed by the volcanic signature of the
                                                                        Medina seamounts (Fig. 2). In the northern part of the pro-
                                                                        file, starting near trace 570 (OBH503), the A reflector of
                                                                        the Messinian unit gradually disappears towards the north-
                                                                        ern profile end. The upper Plio–Quaternary sediments are
                                                                        gently folded near trace 700, whereas north of trace 880,
                                                                        all Plio–Quaternary sediments are strongly folded up to the
                                                                        sea floor. The fold amplitude progressively decreases towards
                                                                        the south as observed in Polonia at al. (2011) along the
Figure 6. (a) Synthetic seismogram of OBH501 based on the fi-           MCS line CALA-15. We interpret these folds to represent
nal velocity model. (b) Original bandpass-filtered seismogram of        the deformation front of the Calabrian accretionary wedge,
OBH501.                                                                 expressed at different depth levels. The deformation of the
                                                                        sediments and/or differential sediment loading possibly cre-
                                                                        ate fluid pathways and may thus support the dissolution of
4     Interpretation and results                                        the evaporites below.

4.1    Shallow structures from multi-channel seismic data               4.2   Sedimentary structures from seismic travel-time
                                                                              modelling
The uppermost unit in the MCS data was drilled at DSDP site
374 to a depth of 457 m (Hsü et al., 1978) and corresponds              Layer 1 in our final velocity model (Fig. 4a) is 250–500 m
to Plio–Quaternary sediments. The lower limit of this unit              thick with rapidly increasing seismic velocities from 1.8 to
is marked by the so-called A reflector (Finetti and Morelli,            2.2 km s−1 , top to bottom. From drilling it is known that L1
1972), which forms the transition to the Messinian evaporite            is composed of unconsolidated Plio–Quaternary sediments
layers (Hsü et al., 1978; Gallais et al., 2011). This reflec-           (Hsü et al., 1978). The underlying layer L2 is characterized
tor corresponds to phase 3 (PsPTopME , magenta picks) in the            by uniform seismic velocities of 4.4 to 4.65 km s−1 and a
seismic sections of the OBH (Fig. 3).                                   thickness of 0.8 to 1.3 km. L2 is interpreted as the Messinian

Solid Earth, 10, 447–462, 2019                                                                      www.solid-earth.net/10/447/2019/
A. Dannowski et al.: A window into the Tethys oceanic lithosphere 455
evaporite unit (layer 2 in Fig. 4a), similar to the findings velocity–depth ensemble for serpentinized mantle found in
along seismic profiles in the Calabrian Arc, profiles DY-01 the Tyrrhenian Sea (Prada et al., 2016) and a velocity–depth
and DY-03 (Dellong et al., 2018). The A reflector (phase profile typical for extended continental metamorphic crust.
3, magenta picks, PsPTopME ) and the reversed-polarity B re- In the northern portion of the profile (orange section) and
flector (phase 5, dark blue picks, PsPBotME ) occur as strong at shallow depth (∼ 2 km into the basement) the profile fits
phases in the OBS data at all stations, representing the top both ensembles for magmatic crust and serpentinized man-
and bottom of the Messinian evaporite unit, respectively. The tle, while at greater depth in the northern portion of the pro-
B reflector at the base of the Messinian unit is also known as file (orange section), lower-crust velocities typical for gab-
the S1 horizon from the ESP5 (Expanding Spread Profile) bro are observed. Between 40 and 130 km (green and orange
studied by de Voogd et al. (1992). sections), the observed seismic velocity field and the velocity
Below the B reflector, the OBS data show a succession gradients are typical for magmatic crust.
of high-amplitude reflectors similar to observations made In the northern part of the profile in the IAP, 6–7 km thick
by Gallais et al. (2011) in the MCS data (Archimede and crust is encountered. Towards the southern end, the crust
PrisMed01 profiles). However, it is difficult to link these thickens to at least ∼ 9 km. Due to the moderate resolution
reflectors to certain horizons in our velocity model; thus, at the model termination in the south, especially at greater
we modelled the pre-Messinian sediments as a low-velocity depth, it is difficult to identify the nature of the crust in
layer (layer 3 in Fig. 4a) with velocities increasing from the southern part. In conjunction with crustal thickening we
3.1 km s−1 at the B reflector to 3.7 km s−1 at the base of observe crustal velocities at the crust–mantle boundary of
the unit. Chamot-Rooke et al. (2005), Polonia et al. (2011), 6.8 km s−1 , which plot closer to the velocity–depth ensem-
and Gallais et al. (2011) propose that the upper part of the ble of continental metamorphic crust (compare to Fig. 4b,
unit, containing the succession of reflectors, is of Torto- blue section). The recorded seismic data show a change in
nian age, overlying an undifferentiated Tertiary sequence and the characteristics of the mantle phases towards the south.
Mesozoic sediments. From 20 km towards south, we observe This could result from a change in the nature of the crust or
higher velocities up to 3.7–4.7 km s−1 (top to bottom) that simply originate from the influence of the Medina seamounts
we relate to the Medina seamounts. This part of the profile, with their proposed volcanic composition (Finetti, 1982).
however, was not covered by OBS stations; thus, the model Again, at the edges and with increasing depth, modelling
here is less reliable. becomes less accurate. Pick uncertainties and data fits are
A high-amplitude, low-frequency reflector (phase 7, dark presented in Table 1. Table 2 lists layers L1 to L7 (used in
green picks, PsPTopAU in Fig. 3) marks the top of layer 4, Fig. 4a) with their seismic velocities.
with shows a low-velocity gradient, with seismic velocities
of 4.8–4.9 km s−1 (Fig. 4a). We interpret L4 as a sedimen- 4.4 Gravity modelling
tary unit based on the seismic velocities and the velocity
gradient within the layer. This layer is called the ambiguous The results of the 2-D gravity forward modelling are shown
unit in Gallais et al. (2011). Thus, we observe the crystalline in Fig. 5. In the south, possible 3-D effects of the Medina
basement at a depth of ∼ 9.5 km at OBH501 to ∼ 8.5 km at seamounts have not been taken into account during the mod-
OBS508. elling. However, the seismic velocities of the crust and the
density of the crust decrease towards the south, roughly south
4.3 Crustal structures from seismic travel-time of kilometre 30 of the profile. At the corresponding location
modelling in the model, a thickening of the crust is observed. A good fit
is observed with an RMS deviation of 1.46 mgal. Figure 5b
Indeed, layer 5 (Fig. 4a) shows a steeper velocity gradient to presents a case without the shallow density anomaly between
a depth of ∼ 11 km. The seismic velocities increase from 5.1 5 and 20 km along the profile. The overall trend of an in-
to 6.4 km s−1 , typical for upper oceanic crust (seismic layer creasing FAA from south to north can be still observed; how-
2) (White et al., 1992; Grevemeyer et al., 2018). The upper ever, the short-wavelength fit is inferior compared to the fi-
crust is approximately 2–3 km thick. Layer 6 (Fig. 4a) again nal model (Fig. 5a): the RMS misfit is 2.62 mgal. This part
shows a lower-velocity gradient with velocities increasing of the model is not covered by OBS, resulting in less well-
from 6.4 to 7.2 km s−1 from top to bottom, typical for lower constrained seismic velocities; however, shallow denser ma-
oceanic crust (seismic layer 3) (White et al., 1992; Greve- terial supports the observed higher seismic velocities. This is
meyer et al., 2018). Layer 7 (Fig. 4a), with velocities higher supported as well by the MCS data in Fig. 2, for which the
than 7.8 km s−1 , is interpreted as mantle with a seismic Moho sedimentary succession is deformed and reflectors are dis-
at ∼ 15 km of depth at OBH501 and at ∼ 17 km of depth at turbed. To further test the velocity model, a constant crustal
OBS508. velocity was assumed. In contrast to the final model, densi-
In Fig. 4b we compare seismic velocity–depth profiles ties in the crust were defined with constant values typical of
along profile DY-05 with a velocity–depth ensemble for mag- oceanic crust over the entire profile (Fig. 5c). The model re-
matic crust (Grevemeyer et al., 2018), as well as with a sponse in Fig. 5c shows a strong RMS misfit of 13.92 mgal
www.solid-earth.net/10/447/2019/ Solid Earth, 10, 447–462, 2019456 A. Dannowski et al.: A window into the Tethys oceanic lithosphere
between observed and calculated FAA south of kilometre 60. Table 2. Overview of the layers in Figs. 4 and 5 including interpre-
In this scenario, the crustal densities are too high in the tation of the unit and seismic velocities for each layer at OBH501.
southern part of the model. Additionally, assuming a con-
stant crustal thickness would even enlarge the misfit of the Layer Layer type interpreted Seismic velocities
data. By means of the gravity study, we can confirm the final (top–bottom)
seismic velocity model, even for the portions not covered by at OBS501
OBS. L1 Quaternary and Pliocene 1.8–2.2 km s−1
sediments
4.5 Synthetic data L2 Messinian evaporites 4.4–4.65 km s−1
L3 Pre-Messinian sediments 3.1–3.7 km s−1
The computation of synthetic data serves to test the forward L4 Carbonate sediments 4.8–4.9 km s−1
modelling results. Figure 6 compares the synthetic seismo- L5 Upper crust 5.1–6.4 km s−1
gram based on the final velocity model (Fig. 4) with the L6 Lower crust 6.4–7.2 km s−1
recorded seismogram of OBH501. The gross features of the L7 Mantle > 7.8 km s−1
observed amplitudes (Fig. 6b) could be reproduced in the
synthetic record section (Fig. 6a). The near-offset waveforms
(between 5 and 15 km offset and between 3.5 and 4 s) of the
evaporite unit show high amplitudes that rapidly decrease
with offset. The large shadow zone, starting at 15 km off-
set and at ∼ 4 s to both sides, is caused by a thick unit of
sediment layers with slower seismic velocities compared to
the evaporite unit. This portion of the model was kept simple
during forward modelling; thus, we observe a lack in phases
between 4 and 5 s in the synthetic data compared to the ob-
served data in Fig. 6b. The additional phases in the observed
data indicate internal layering of the evaporite unit as well as
layering within the slow sedimentary unit below, which were
not resolved during travel-time modelling. At roughly 5 s the
reflected phase of the fast sedimentary unit above the base-
ment and the reflection of the basement at 5.5 s are present Figure 7. Comparison of the data and the final velocity model
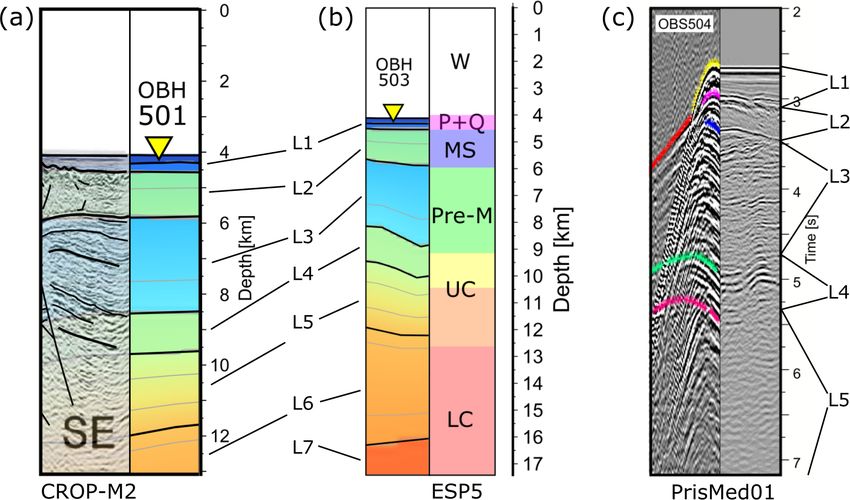
in the synthetic data with weak amplitudes (Fig. 6a). The from this study (OBH501, OBH503, OBS504) with previous stud-
ies: (a) CROP M2 (Polonia et al., 2011), (b) ESP5 (de Voogd et al.
crustal phases between 15 and 30 km offset become stronger
1992), and (c) PrisMed01 (Gallais et al., 2011). L1–L7 follow the
again, while the PmP, between 40 and 50 km offset at about
same layer convention as in the final velocity model. Abbreviations
7 s, shows high amplitudes. This feature is observed in the in panel (b): W – water, P+Q – Pliocene and Quaternary sediments,
recorded data as well and is associated with a discontinuity MS – Messinian sediments, Pre-M – pre-Messinian sediments, UC
at the crust–mantle boundary. The mantle phases with offsets – upper crust, LC – lower crust.
larger than 55 km slowly fade. They can be better recognized
in the synthetic data in which they are not obscured by ambi-
ent noise. The apparent velocities of the main features fit the (Fig. 1), frontal thrusting affecting the sea floor was ob-
observed data. served, as was a zone of “proto-thrusts” that deform deeper
layers, but without reaching the sea floor yet (Polonia et al.,
5 Discussion 2011) (see their Fig. 8). The same is true for the line PrisMed-
1 (Gallais et al., 2012) (see their Fig. 5a). The distribution of
5.1 Deformation and tectonic thickening at the front of the deformation fronts is most likely a function of the rhe-
the Calabrian accretionary prism ological properties of the different layers. In fact, we ob-
serve distributed shortening and tectonic thickening of the
Folds in the sedimentary units have been observed at differ- Messinian salt unit, resulting in an obscured and chaotic A
ent depth levels at the sea floor within the Plio–Quaternary reflector within a short distance towards the north. While
unit and in the Messinian evaporites (Fig. 2); however, we the Plio–Quaternary sediments at greater depth show gen-
do not interpret this as a result of deformation stepping back tly undulating folds, we observe an increase in the amplitude
in time towards the north. We rather interpret the scenario as of these folds towards the north where they affect the en-
deformation occurring at all three depth levels, most likely tire Plio–Quaternary sediment unit up to the sea floor. We
simultaneously, caused by the distributed thrusting at the toe interpret the sudden onset of strongly undulating folds ex-
of the Calabrian accretionary wedge. Along the MCS line pressed at the sea floor as the signature of the outer defor-
CALA-15, which crosses our profile in the northern IAP mation front of the Calabrian wedge at the sea floor, while
Solid Earth, 10, 447–462, 2019 www.solid-earth.net/10/447/2019/A. Dannowski et al.: A window into the Tethys oceanic lithosphere 457
reflective bands can be observed, indicating pre-Messinian
sedimentary layering. The OBS data show a sequence of
steep angle reflections with high frequencies. However, a
comparison of OBS and MCS data proved unsuitable to cor-
relate the observed phases at the different stations. The model
in this portion is highly unreliable, especially the velocity in-
formation with absolute velocities and the velocity gradient.
Layer 4 was the next layer that could be verified by a high-
amplitude, low-frequency reflector. Based on the absolute
velocity and the low-velocity gradient it is interpreted as a
sedimentary layer. While de Voogd et al. (1992) interpreted
layer 4 (Fig. 4a) as oceanic upper-crust layer 2A, we inter-
pret this to be a 1 km thick layer of fast sediments, possibly
carbonate sediments of Mesozoic age (Polonia et al., 2011)
(Fig. 7b). For seismic layer 2 of oceanic crust, we would ex-
pect a high-velocity gradient with absolute velocities lower
than observed (< 4.4 km s−1 ) (Carlson, 1998; White et al.,
1992; Grevemeyer et al., 2018) or a low-velocity gradient
with higher absolute velocities (> 5.7 km s−1 ) for continen-
tal crust (Christensen and Mooney, 1995). Finetti (1982),
Figure 8. Dark blue marks the presence of oceanic lithosphere be-
LeMeur (1997), and Gallais et al. (2011) also proposed that
low the sea floor in the Ionian Abyssal Plain (undeformed portion)
as determined by seismic studies. Light blue areas mark the extent
L4 represents a further Mesozoic sedimentary unit, which is
of buried oceanic lithosphere below adjacent accretionary wedges supported by the imaged layered facies in their studies (com-
as determined by seismic studies. Profiles 1–5: M111; profile 6: pare Fig. 7c).
Makris et al. (1986) and Finetti (2003) (part of CROP M23A); pro-
files 7–8: IMERSE profiles (Fruehn et al., 2001; Westbrook and Re- 5.3 Nature of the lithosphere of the Ionian Abyssal
ston, 2002; Reston et al., 2002); profiles 9 and 10: ION6 (Cernobori Plain
et al., 1996) and ION7 (Kokinou et al., 2003). AE – Apulian Es-
carpment. Further abbreviations are explained in Fig. 1. Based on the results of our seismic modelling and the gravi-
metric modelling, we interpret the IAP to be of oceanic na-
ture with a thickness of 6–7 km. Further south in the vicinity
the Plio–Quaternary sediments at the bottom of the unit are of the Medina seamounts, we observe a change in the charac-
already affected by the growth of the accretionary wedge. teristics of the crust towards a continental type of crust with
Along the approximately perpendicular MCS profile CALA- a thickness of 9 km. We briefly resume the discussion from
15 the same pattern is observed from SE to NW (Polonia et the Introduction in the context of our results, and we will
al., 2011). The thickness of the Plio–Quaternary sediments is concentrate on the lithosphere of the central IAP.
predominantly constant (Figs. 2 and 4), supporting the idea Thinned continental crust vs. oceanic crust. In Fig. 4b we
that rheological properties influence the location of the de- compare seismic velocity–depth profiles along profile DY-05
formation front at each layer. The MCS profile CROP M2 with a velocity–depth ensemble for magmatic crust (Greve-
(Polonia et al., 2011) crosses the DY-05 profile at OBH501 meyer et al., 2018), as well as with a velocity–depth en-
(Fig. 7a). Polonia et al. (2011) interpreted the base of the semble for continental metamorphic crust (Christensen and
Messinian evaporites as the detachment acting as the plate Mooney, 1995) that includes extended continental crust. The
boundary between the post-Messinian wedge (Eurasia) and seismic velocities within the basement obtained from the fi-
pre-Messinian sediments on top of the very old African sub- nal velocity model (Fig. 4a) plot into the velocity–depth field
ducting oceanic crust. This would indeed be consistent with typical for oceanic crust but are too fast for continental crust
our observations of a B reflector that can be traced through (Fig. 4b).
almost the entire profile and the undisturbed flat-lying Plio– Hyperextended continental crust vs. oceanic crust.
Quaternary sediments on top of the Messinian evaporites, Thinned or extended continental crust is slower than nor-
which are affected in the north by the advancing Calabrian mal continental crust (Christensen and Mooney, 1995). In a
wedge. seismic refraction study in the Gulf of California (Lizarralde
et al., 2007), seismic velocities have been shown to de-
5.2 Pre-Messinian sedimentary layers crease as the continental crust becomes thinner towards
the continent–ocean transition zone. Lower-crust velocities
Beneath the B reflector, the seismic signal is strongly attenu- reach 6.4 km s−1 , which is much slower than observed in the
ated both in the OBS and MCS data. In the MCS data, short final velocity model along DY-05 (Fig. 4a).
www.solid-earth.net/10/447/2019/ Solid Earth, 10, 447–462, 2019458 A. Dannowski et al.: A window into the Tethys oceanic lithosphere
In conclusion, based on seismic P -wave velocities, the of profile DY-05 that has a dense shot (∼ 140 m) and
lithosphere of the central IAP is interpreted to be of oceanic station (∼ 7.6 km) spacing.
type. This is supported by the gravity modelling results pre-
sented in Fig. 5. To continue the discussion we want to inves- – Thinned continental crust in the IAP was interpreted
tigate if the oceanic domain is constructed of magmatic crust by Finetti and Morelli (1973) and Finetti (1981, 1982)
or serpentinized mantle. based on gravity data; however, they could not explain
Serpentinized mantle vs. magmatic crust. In Fig. 4b we the gravity data without having mantle material that in-
show the velocity–depth ensemble for serpentinized mantle truded into the crust. In a later work based on seismic
found in the Tyrrhenian Sea (Prada et al., 2016). At shallow MCS line CROP M3, Finetti (2003) interpreted the crust
depth (∼ 2 km into the basement) the profile fits both ensem- east of the ME to be of oceanic nature, with a crys-
bles for magmatic crust and serpentinized mantle. Based on talline basement at 7 to 8 s twt, which is, if converted
seismic P -wave velocities only it is not possible to discrim- into depth, similar to our findings. As part of the work of
inate between upper crust and highly serpentinized mantle. Polonia et al. (2011) the data were reprocessed and the
However, at greater depth lower-crust velocities typical for authors could confirm the occurrence of oceanic crust
gabbro (Carlson and Miller, 2004) are observed. The data fit east of the ME. During RV Meteor M111 cruise, wide-
the ensemble for magmatic crust as observed by Grevemeyer angle refraction seismic data (DY-01) were acquired
et al. (2018), and we exclude serpentinized mantle on top of along CROP M3 (Dellong et al., 2018). In this study
gabbroic crustal rocks. the deeper crustal structures along the profile could be
We conclude that based on seismic P -wave velocities, the better resolved and the authors proved that oceanic crust
lithosphere of the central IAP comprises magmatic crust with has been subducted into the CA.
a crustal thickness of 6–7 km (Fig. 5). Our gravity mod- – De Voogd et al. (1992) analysed the ESP5 data from
elling along profile DY-05 (Fig. 5) shows a good fit assuming a two-ship experiment in the vicinity of OBS502. We
oceanic crust in the central and northern part of the profile find similar results for the shallow part of the models
with a possible change in crustal type towards the south and (Fig. 7b), while the deeper portions vary regarding the
towards the extension of the Malta Escarpment. depth of the layers. The crustal thickness at ESP5 is
Previous and recent studies of the area are combined in about 8 km versus 6 km at OBS502 along profile DY-
Fig. 8 to show the distribution of oceanic lithosphere in the 05. The lower crust has a similar thickness for both
Ionian Sea. In the following discussion we want to summa- experiments. We observe a seismic mantle velocity of
rize previous works and compare them to our results. 7.8 km s−1 at the crust–mantle boundary that is increas-
ing with depth in at least the upper 2 km below the
– Hieke et al. (2003) presented an extensive discussion Moho, while the studies of the ESP5 experiment (de
of previous work and argued that based on magnetic Voogd et al., 1992) (Fig. 7b) and Makris et al. (1986)
anomalies, missing heat flow anomalies, and the gravity show constant mantle velocities of 8.1 and 8.5 km s−1 .
data, the IAP is a thinned part of the African continental
crust. We agree that the system seems to be in equilib- – Sioni (1996) and Gallais et al. (2011) interpreted the
rium regarding the heat flow; however, similar low val- high-amplitude reflector at 8 s twt (in the seismic line
ues of 38–46 mW M−2 are expected for very old oceanic PrisMed01) as the top of oceanic crust. The reflectors
crust as well (Sclater et al., 1980). Our interpretation of from OBS502 and PrisMed01 lines show an ideal fit
a possible change in crustal type from the central IAP (Fig. 7c).
towards the Medina seamounts and the extension of the
– Polonia et al. (2017) interpreted diapiric structures in
ME is supported by new marine satellite gravity maps
the CA to be constructed of serpentine. In our study as
of the area (Sandwell et al., 2014). We can identify the
well as in the seismic study from Dellong et al. (2018)
deep-seated ME as a transition zone from continental to
we find no evidence for major serpentine structures as
oceanic type of crust, further south towards the Medina
layers in the IAP lithosphere or in the vicinity of fault
seamounts.
systems in the CA. This does not rule out the findings of
Polonia et al. (2017) for the CA region, where a fossil
– Similar to our findings, Makris et al. (1986) observed fracture zone might has been subducted, allowing ser-
velocities up to 7.2 km s−1 resulting from oceanic crust. pentinized material to rise.
However, the authors could not exclude stretched con-
tinental crust with intruded upper mantle. The stations 5.4 The oceanic IAP in the frame of plate tectonics
within the IAP failed and their profile could only be
extended to the IAP based on shots within the IAP The geophysical characteristics, for example seismic veloc-
recorded at stations outside the IAP. This leaves their ities, crustal thickness, densities (Figs. 4 and 5), and heat
results with a high uncertainty in this portion of the pro- flow, confirm the IAP to be oceanic lithosphere. The IAP is
file. This lack of resolution was overcome by the design consequently a leftover of the Tethyan lithosphere, and the
Solid Earth, 10, 447–462, 2019 www.solid-earth.net/10/447/2019/A. Dannowski et al.: A window into the Tethys oceanic lithosphere 459
Apulia–Adriatic domain and the eastern Mediterranean basin during the formation of the Tethys Ocean. Our data and the
do not belong to the former southern continental margin of model indicate that the Ionian Abyssal Plain is underlain by
the Tethys as suggested by Roure et al. (2012). However, the oceanic crust with seismic velocities increasing with depth
isostatic equilibrium and magnetic anomalies exclude a sea- from 5.1 to 7.2 km s−1 . The thickness of the crust in the Io-
floor age younger than Late Triassic or Early Jurassic (de nian Abyssal Plain is 6–7 km but thickens to ∼ 9 km in the
Voogd et al., 1992; Stampfli, 2000; Speranza et al., 2012). south. At the crust–mantle boundary crustal seismic veloc-
The Apulian Escarpment in the N and the Malta Escarpment ities decrease from 7.2 km s−1 in the north to 6.8 km s−1 in
in the SW are bounding the Tethys basin and are most prob- the south. This change in the crustal structure supports the
ably transform margins (Gallais et al., 2011; Frizon de Lam- interpretation of the Malta Escarpment as a transform mar-
otte et al., 2011) and not conjugate passive margins (Cata- gin, reactivated normal faults in the SW–NE direction in the
lano et al., 2001). They are present as steep and high steps Ionian microplate, and a passive margin in the vicinity of the
in the sea-floor bathymetry, which is not expected at pas- Medina seamounts.
sive margins where sedimentation and erosion over a period Based on the seismic and gravimetric results the crust is
of ∼ 200 Myr would overprint and smoothen the topography interpreted to be oceanic. We consider the Ionian Abyssal
(Mosher et al., 2017). Additionally, the ME and the AE as Plain to be a remnant of the Tethys lithosphere. This sup-
passive margins would require a plate boundary in the NW– ports the hypothesis that the Adria was a rigid promontory
SE direction within the Ionian basin, which has not been ob- of Africa until the beginning of the opening of the Tethys in
served so far. On the other hand, interpreting the ME and the early Mesozoic. During the opening of the Tethys, the
the AE as transform margins, a plate boundary would be ex- Adriatic microplate was separated from Africa. Between the
pected in the SW–NE direction, parallel to the observed deep end of spreading in the early Mesozoic and the formation
reverse faults beneath the IAP (Gallais et al., 2011; Polonia of the Calabrian Arc in the Miocene the connection between
et al., 2011) (Fig. 1), and could explain our results of the ob- Adria and Africa might have been rigid. However, at least
served transition from oceanic crust towards continental crust in Neogene times, the Tethyan lithosphere was less rigid, al-
in the vicinity of the Medina seamounts (Fig. 4). lowing the Adria microplate to move relative to Africa again.
Oceanic lithosphere is considered to be rigid and shows This places the African Plate margin much further south than
little deformation compared to continental lithosphere that previously thought, to the Hellenic subduction zone and the
is mechanically weak, especially when thinned (Polonia et Calabrian subduction zone, and supports an Adria microplate
al, 2016). An IAP made of Tethyan lithosphere, due to its that can move relative to Africa and Europe.
rigidity, would imply that the connection between Africa and
Adria was rigid since the end of oceanic spreading in the
early Mesozoic. However, deformation within the IAP litho- Data availability. Seismic data are available on re-
sphere was observed in seismic data by Gallais et al. (2011), quest from the first or second author or via
Polonia et al. (2011) (Fig. 1), and in this study (Fig. 2). https://doi.org/10.1594/PANGAEA.899796 (Dannowski and
The deformation caused by contraction is possibly connected Kopp, 2019).
to subduction processes during Neogene times and subduc-
tion might be still active. The connection between Adria and
Competing interests. The authors declare that they have no conflict
Africa during Neogene times is consequently not particularly
of interest.
rigid (Gallais et al., 2011; Le Breton et al., 2017) as pro-
posed earlier (e.g. Channell et al., 1979; Dewey et al., 1989),
and Adria might move relative to Africa. This supports the Acknowledgements. The cruise M111 of RV Meteor was funded
hypothesis of an independent Adriatic microplate that was by the Deutsche Forschungsgemeinschaft (DFG) with additional
separated during the opening of the Tethys as proposed in support from GEOMAR. Our special thanks go to the captain and
reconstructions by Handy et al. (2010) and Ustaszewski et crew of RV Meteor for their excellent support at sea. We thank
al. (2008). Alina Polonia and Eline Le Breton for their detailed and helpful
reviews to improve the paper.
6 Conclusions The article processing charges for this open-access
publication were covered by a Research
Our new seismic velocity model images the deep subsur- Centre of the Helmholtz Association.
face of the Ionian Abyssal Plain in more detail than previ-
ous approaches. In addition, gravimetric modelling validates
Review statement. This paper was edited by Patrice Rey and re-
these findings. We interpret the layer directly above the crys-
viewed by Eline Le Breton and Alina Polonia.
talline basement, interpreted earlier as layer 2A, as a unit
of seismically fast sediments, possibly carbonates of Meso-
zoic age. This is in agreement with the warm environment
www.solid-earth.net/10/447/2019/ Solid Earth, 10, 447–462, 2019460 A. Dannowski et al.: A window into the Tethys oceanic lithosphere
References in the Ionian Sea, with links to SGY data files, PANGAEA,
https://doi.org/10.1594/PANGAEA.899796, 2019.
Della Vedova, B. and Pellis, G.: New heat flow density measure-
Argnani, A. and Bonazzi, C.: The Malta Escarpment fault zone ments in the Ionian sea, Atti VIII Convegno GNGTS, Roma,
offshore eastern Sicily: Pliocene-Quaternary tectonic evolution 1133–1145, 1989.
based on new multichannel seismic data, Tectonics, 24, TC4009, Dellong, D., Klingelhoefer, F., Kopp, H., Graindorge, D., Margher-
https://doi.org/10.1029/2004TC001656, 2005. iti, L., Moretti, M., Murphy, S., and Gutscher, M.-A.: Crustal
Baldi, P., Degli Angioli, E., Piallini L., and Mantovani, E.: Gravity structure of the Ionian basin and eastern Sicily margin: Results
anomaly interpretation in the Calabrian Arc and surrounding re- froma wide-angle seismic survey, J. Geophys. Res., 123, 2090–
gions: a tridimensional approach, Earth Evol. Sci., 3, 243–247, 2114, https://doi.org/10.1002/2017JB015312, 2018.
1982. de Voogd, B., Truffert, C., Chamot-Rooke, N.. Huchon, P., Lalle-
Barreca, G., Scarfì, L., Cannavò, F., Koulakov, I., and Monaco, C.: mant, S., and Le Pichon, X.: Two-ship deep seismic soundings
New structural and seismological evidence and interpretation of in the basins of the Eastern Mediterranean Sea (Pasiphae cruise),
a lithospheric-scale shear zone at the southern edge of the Ionian Geophys. J. Int., 109, 536–552, 1992.
subduction system (central-eastern Sicily, Italy), Tectonics, 35, Dewey, J. F., Helman, M. L., Knott, S. D., Turco, E.,
1489–1505, https://doi.org/10.1002/2015TC004057, 2016. and Hutton, D. H. W.: Kinematics of the western
Carlson, R. L.: Seismic velocities in the uppermost oceanic crust: Mediterranean, Geol. Soc. Spec. Publ., 45, 265–283,
Age dependence and the fate of layer 2A, J. Geophys. Res., 103, https://doi.org/10.1144/GSL.SP.1989.045.01.15, 1989.
7069–7077, https://doi.org/10.1029/97JB03577, 1998. Faccenna, C., Becker, T. W., Pio Lucente, F., Jolivet, L., and Rosetti,
Carlson, R. L. and Herrick, C. N.: Densities and porosities in the F.: History of subduction and back-arc extension in the Central
oceanic crust and their variations with depth and age, J. Geophys. Mediterranean, Geophys. J. Int., 145, 809–820, 2001.
Res., 95, 9153–9170, https://doi.org/10.1029/JB095iB06p09153, Faccenna, C., Piromallo, C., Crespo-Blanc, A., and Jo-
1990. livet, L.: Lateral slab deformation and the origin of
Carlson, R. L. and Miller, D. J.: Influence of pressure and mineral- the western Mediterranean arcs, Tectonics, 23, TC1012,
ogy on seismic velocities in oceanic gabbros: Implications for the https://doi.org/10.1029/2002TC001488, 2004.
composition and state of the lower oceanic crust, J. Geophy. Res., Faccenna, C., Becker, T. W., Auer, L., Billi, A., Boschi, L., Brun, J.
109, B09205, https://doi.org/10.1029/2003JB002699, 2004. P., Capitanio, F. A., Funiciello, F., Horvàth, F., Jolivet, L., Piro-
Catalano, R., Doglioni, C., and Merlini, S.: On the mallo, C., Royden, L., Rossetti, F., and Serpelloni, E.: Mantle
Mesozoic Ionian Basin, Geophys. J. Int., 144, 49–64, dynamics in the Mediterranean, Rev. Geophys., 52, 283–332,
https://doi.org/10.1046/j.0956-540X.2000.01287.x, 2001. https://doi.org/10.1002/2013RG000444, 2014.
Cernobori, L., Hirn, A., McBride, J. H., Nicolich, R., Petro- Ferrucci, F., Gaudiosi, G., Hirn, A., and Nicolich, R.: Ionian basin
nio, L., and Romanelli, M.: Crustal image of the Ionian and Calabrian arc: some new elements from DSS Data, Tectono-
basin and its Calabrian margins, Tectonophysics, 264, 175–189, physics, 195, 411–419, 1991.
https://doi.org/10.1016/S0040-1951(96)00125-4, 1996. Finetti, I.: Geophysical study on the evolution of the Ionian Sea, in:
Chamot-Rooke, N., C. Rangin, X. Le Pichon, and Dotmed Work- Sedimentary basins of Mediterranean margins, edited by: Wezel,
ing Group: DOTMED–Deep Offshore Tectonics of the Mediter- F. C., C.N.R. Italian Project of Oceanography, Bologna (Tecno-
ranean: A synthesis of deep marine data in eastern Mediter- print), 465–484, 1981.
ranean, Mem. Soc. Geol. Fr., 177, 64 pp., 69 maps with CD- Finetti, I.: Structure, stratigraphy and evolution of central Mediter-
ROM, 2005. ranean, B. Geofis. Teor. Appl., 24, 247–312, 1982.
Channell, J. E. T., D’Argenio, B., and Horvath, F.: Adria, the Finetti, I.: The CROP profiles across the Mediterranean Sea (CROP
African promontory, in Mesozoic Mediterranean palaeogeogra- MARE I and II), in: Memorie descrittive della carta geologica
phy, Earth Sci. Rev., 15, 213–292, https://doi.org/10.1016/0012- d’Italia – CROP Atlas – Seismic Reflection Profiles of the Italian
8252(79)90083-7, 1979. Crust, LXII, 171–184, 2003.
Chiarabba, C., De Gori, P., and Speranza, F.: The southern Tyrrhe- Finetti, I. and Morelli, C.: Wide scale digital seismic exploration
nian subduction zone: Deep geometry, magmatism and Plio- of the Mediterranean Sea, B. Geofis. Teor. Appl., 14, 291–342,
Pleistocene evolution, Earth Planet. Sc. Lett., 268, 408–423, 1972.
https://doi.org/10.1016/j.epsl.2008.01.036, 2008. Finetti, I. and Morelli, C.: Geophysical exploration of the Mediter-
Christensen, N. I. and Mooney, W. D.: Seismic velocity ranean Sea, B. Geofis. Teor. Appl., 15, 263–341, 1973.
structure and composition of the continental crust: A Finetti, I., Lentini, F., Carbone, S., Catalano, S., and Del Ben,
global view, J. Geophys. Res.-Sol. Ea., 100, 9761–9788, A.: Il sistema Appennino Meridionale–Arco Calabro–Sicilia nel
https://doi.org/10.1029/95JB00259, 1995. Mediterraneo Centrale: studio geologico-geofisico, Boll. Soc.
Cita, M. B., Ryan, W. B. F., and Kidd, R. B.: Sedimentation rates in Geol. Ital., 115, 529–559, 1996.
Neogene deep-sea sediments from the Mediterranean and geody- Frizon de Lamotte, D., Raulin, C., Mouchot, N., Wrobel-Daveau, J.
namic implications of their changes, edited by: Kidd, R. B. and C., Blanpied, C., and Ringenbach, J. C.: The southernmost mar-
Worstell, P. J., Init. Rep. DSDP XLII (part 1), 991–1002, 1978. gin of the Tethys realm during the Mesozoic and Cenozoic: Ini-
Cloetingh, S., Nolet, G., and Wortel, R.: Crustal structure of the tial geometry and timing of the inversion processes, Tectonics,
Eastern Mediterranean inferred from Rayleigh wave dispersion, 30, TC3002, https://doi.org/10.1029/2010TC002691, 2011.
Earth Planet Sc. Lett., 51, 336–342, 1980. Frizone de Lamotte, D., Fourdan, B., Leleu, S., Lepar-
Dannowski, A. and Kopp, H.: A seismic refraction and wide-angle mentier, F., and de Clarens, P.: Style of rifting and
reflection profile M111 – DY-05 during METEOR cruise M111
Solid Earth, 10, 447–462, 2019 www.solid-earth.net/10/447/2019/You can also read