Seismic evidence for failed rifting in the Ligurian Basin, Western Alpine domain - Recent
←
→
Page content transcription
If your browser does not render page correctly, please read the page content below
Solid Earth, 11, 873–887, 2020
https://doi.org/10.5194/se-11-873-2020
© Author(s) 2020. This work is distributed under
the Creative Commons Attribution 4.0 License.

Seismic evidence for failed rifting in the Ligurian Basin,
Western Alpine domain
Anke Dannowski1 , Heidrun Kopp1,2 , Ingo Grevemeyer1 , Dietrich Lange1 , Martin Thorwart2 , Jörg Bialas1 , and
Martin Wollatz-Vogt1
1 GEOMAR       Helmholtz Centre for Ocean Research Kiel, Kiel, Germany
2 CAU,   Institute of Geosciences, Christian-Albrechts-Universität zu Kiel, Kiel, Germany

Correspondence: Anke Dannowski (adannowski@geomar.de)

Received: 30 November 2019 – Discussion started: 13 December 2019
Revised: 7 April 2020 – Accepted: 14 April 2020 – Published: 13 May 2020

Abstract. The Ligurian Basin is located in the Mediterranean       of mantle serpentinisation indicates a high rate of syn-rift
Sea to the north-west of Corsica at the transition from the        sedimentation. However, rifting failed before oceanic spread-
Western Alpine orogen to the Apennine system and was gen-          ing was initiated, and continental crust thickens towards the
erated by the south-eastward trench retreat of the Apennines–      NE within the northern Ligurian Basin.
Calabrian subduction zone. Late-Oligocene-to-Miocene rift-
ing caused continental extension and subsidence, leading to
the opening of the basin. Yet it remains unclear if rifting
caused continental break-up and seafloor spreading. To re-         1   Introduction
veal its lithospheric architecture, we acquired a 130 km long
seismic refraction and wide-angle reflection profile in the        The Ligurian Sea is situated in the north-western Mediter-
Ligurian Basin. The seismic line was recorded in the frame-        ranean Sea at the transition from the Western Alpine orogen
work of SPP2017 4D-MB, a Priority Programme of the Ger-            to the Apennine system. The geodynamic setting of the area
man Research Foundation (DFG) and the German compo-                is controlled by the convergence of the African and Eurasian
nent of the European AlpArray initiative, and trends in a NE–      plates (e.g. Dercourt et al., 1986). Despite the existing large
SW direction at the centre of the Ligurian Basin, roughly par-     collection of seismic and other geophysical data, the present-
allel to the French coastline.                                     day crustal architecture of the Ligurian Basin is still under
   The seismic data were recorded on the newly developed           discussion and the kinematic boundaries are poorly resolved,
GEOLOG recorder, designed at GEOMAR, and are domi-                 in particular the continent–ocean transition (COT) along the
nated by sedimentary refractions and show mantle Pn arrivals       margins as well as its termination to the north-north-east.
at offsets of up to 70 km and a very prominent wide-angle          Imaging clear fault structures within the crust has proven
Mohorovičić discontinuity (Moho) reflection. The main fea-       challenging due to the presence of thick Messinian salt lay-
tures share several characteristics (e.g. offset range, continu-   ers and due to the masking effect of the first seafloor multiple,
ity) generally associated with continental settings rather than    which roughly coincides with the arrival of the reflection of
documenting oceanic crust emplaced by seafloor spreading.          the acoustic basement (Béthoux et al., 2008). Deep-drilling
Seismic tomography results are complemented by gravity             data are lacking, and the magnetic data are complex and their
data and yield a ∼ 6–8 km thick sedimentary cover and the          anomalies discontinuous (Bayer et al., 1973). Based on inte-
seismic Moho at 11–13 km depth below the sea surface. Our          grated seismic and magnetic data, maps indicating the ex-
study reveals that the oceanic domain does not extend as far       tent of the oceanic domain were created (i.e. Burrus, 1984;
north as previously assumed. Whether Oligocene–Miocene             Gueguen et al., 1998; Rollet et al., 2002); however, no ax-
extension led to extremely thinned continental crust or ex-        ial ridge was imaged near the centre of the basin (Rollet et
humed subcontinental mantle remains unclear. A low grade           al., 2002). To explain the mismatch between the expected
                                                                   oceanic domain and the observed seismic signal, the crust

Published by Copernicus Publications on behalf of the European Geosciences Union.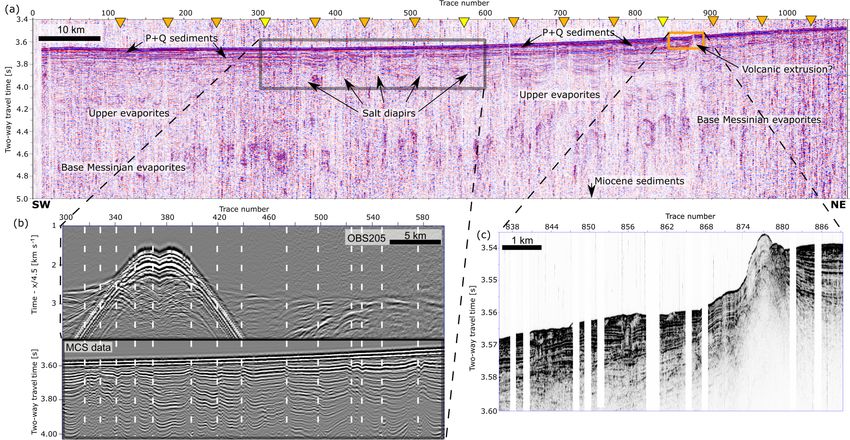
874                                            A. Dannowski et al.: Seismic evidence for failed rifting in the Ligurian Basin

in the north-eastern basin was interpreted as being “atypi-        (e.g. Doglioni et al., 1997; Faccenna et al., 1997; Réhault
cal” oceanic crust (Mauffret et al., 1995; Chamot-Rooke et         et al., 1984). The Alpine transition is characterised by a
al., 1997; Contrucci et al., 2001; Rollet et al., 2002). A clear   change in subduction polarity between the two orogens (Jo-
change from continental to oceanic crust was only shown            livet and Faccenna, 2000; Handy et al., 2010). The Ligurian
for the southern area of the Ligurian Basin, in the Gulf of        Basin is the oldest back-arc basin in the western Mediter-
Lion and offshore of Sardinia (Gailler et al., 2009). It is pro-   ranean Sea and developed from the late Oligocene to the
posed that the oceanic domain is separated from the conti-         Early Miocene (Réhault and Béthoux, 1984; Roca and De-
nental margins by a transitional domain characterised by a         segaulx, 1992; Fernàndez et al., 1995; Jolivet and Faccenna,
high-velocity lower crust (Fig. 1). An overview of seismic         2000; Rosenbaum et al., 2002; Finetti et al., 2005; Advokaat
experiments until 2002 is presented in Rollet et al. (2002).       et al., 2014). The extension is related to the south-east trench
Furthermore, the area was revisited or data were re-analysed       retreat of the Apennines–Calabrian subduction zone initi-
with modern seismic techniques including the CROP deep             ated in the Oligocene (Montigny et al., 1981; Réhault and
seismic profiles (Finetti et al., 2005), the TGS-NOPEC and         Béthoux, 1984; Vigliotti and Langenheim, 1995; Gueguen et
the SARDINIA profiles (Gailler et al., 2009; Jolivet et al.,       al., 1998; Rosenbaum et al., 2002; Faccenna et al., 2001).
2015), and more recent studies along the French and Italian           Rifting initiated ∼ 30 Ma at a rate of ∼ 1 cm yr−1 in the
Riviera with the 3D seismic refraction GROSMarin project           NE and ∼ 2 cm yr−1 in the SW (Rollet et al., 2002). The
(Dessa et al., 2011) and an amphibious ambient-noise study         initiation is associated with magmatism on land along the
(Guerin et al., 2019).                                             western Ligurian margin (Rollet et al., 2002). At roughly
   In the frame of the LOBSTER project (Ligurian Ocean             21 Ma, rifting terminated while an anticlockwise rotation
Bottom Seismology and TEctonics Research), we obtained a           of the Corsica–Sardinia block was initiated (Rollet et al.,
new state-of-the-art seismic refraction data (Fig. 1, red line     2002; Speranza et al., 2002). This phase has been proposed
with orange and yellow triangles). Here, we present the anal-      as the commencement of oceanic spreading (Pascal et al.,
ysis of the seismic refraction data from the central Ligurian      1993; Contrucci et al., 2001; Rollet et al., 2002; Finetti et
Basin, which is the extension of a pre-existing seismic profile    al., 2005). These authors referred to tholeiitic volcanic edi-
(Makris et al., 1999), which we call MAKRIS (Fig. 1, black         fices to solidify their interpretation and interpreted the pat-
line). We aim to unravel the present-day crustal structure and     tern of magnetic data (Bayer et al., 1973) as being a result
its nature in the centre of the Ligurian Basin, map the depth      of two main discontinuous volcanic lineaments, sub-parallel
of the crust–mantle boundary (seismic Mohorovičić discon-        to the basin axis related to oceanic spreading and unroof-
tinuity (Moho)), and reveal the styles of deformation during       ing of mantle material. The opening of the Ligurian Basin
the last extensional phase. We investigate the hypothesis that     ended ∼ 16–15 Ma and was associated with a second calc-
Oligocene–Miocene rifting led to either extended continental       alkaline volcanic phase along the Corsican margin (Rollet et
crust or exhumation of sub-continental mantle below post-rift      al., 2002) that is linked to the migration of the subducting
sediments in the north-eastern Ligurian Basin.                     lithosphere towards the E–SE. The extension of the Ligurian
                                                                   Basin terminated and shifted to the Tyrrhenian Sea, while the
                                                                   Apennines–Calabrian subduction zone continued to roll back
2     Geological structures and geodynamics of the                 further south-east until late the Messinian, ∼ 6 Ma (Faccenna
      Ligurian Sea and the Corsica–Sardinia block                  et al., 2001; Advokaat et al., 2014). The opening rate was
                                                                   calculated with 7.8–10.3 mm yr−1 (Moeller et al., 2013). In
The Ligurian Sea has a width of ∼ 150 km, reaching from            the north of the Tyrrhenian Sea, extension led to continental
the northern tip of Corsica to the Ligurian coast near the city    crustal thinning (Moeller et al., 2013), while further south
of Sanremo. It widens towards the south-west to ∼ 175 km           in the centre of the Tyrrhenian Basin the mantle was ex-
between Calvi (Corsica) and Cannes. South of an imagi-             humed and serpentinised and intruded by mid-ocean-ridge-
nary line between Ajaccio (Corsica) and Toulon, the Lig-           type (MOR-type) and intraplate basalts (Prada et al., 2016).
urian Sea is roughly 225 km wide and opens entirely towards        Similar to the Ligurian Basin, the Tyrrhenian Sea shows dis-
the Balearic Sea. The Ligurian Basin itself is smaller with        tributed, non-linear magnetic anomalies (Cella et al., 2008).
a width of 70, 120, and 170 km along the three dashed grey         Anomalies often coincide with volcanic islands, seamounts,
lines in Fig. 1, and the seafloor reaches a depth of ∼ 2700 m.     or other morphological units of igneous composition. Dur-
The Ligurian margin is characterised by a narrow and steep         ing the Ocean Drilling Project (ODP) Leg 107 at site 651,
slope (10–20 km) with a few listric normal faults (Finetti         serpentinised mantle rocks forming the top of the basement
et al., 2005). The Corsica slope is wider (20–50 km), and          were drilled (Bonatti et al., 1990).
the margin is characterised by several listric faults extend-         Gueguen et al. (1998) and Rollet et al. (2002) suggest
ing over a wider area (Contrucci et al., 2001; Rollet et al.,      that the central Ligurian Basin is comprised of oceanic crust.
2002).                                                             These authors divided the basin into different zones of con-
   The Ligurian Sea formed as a back-arc basin at the transi-      tinental and oceanic domains based on seismic, magnetic,
tion from the Western Alpine orogen to the Apennine system         and gravity data (Fig. 1): (1) atypical oceanic crust with

Solid Earth, 11, 873–887, 2020                                                               www.solid-earth.net/11/873/2020/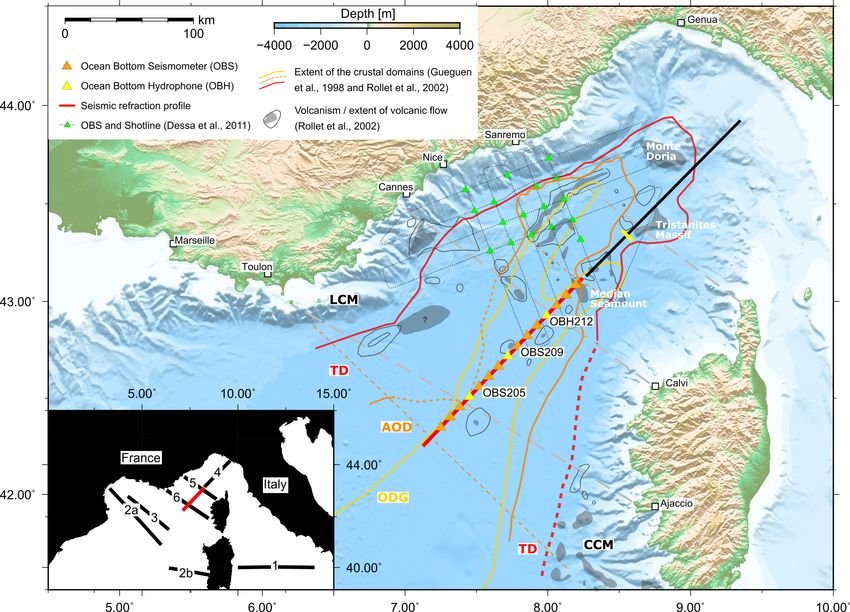
A. Dannowski et al.: Seismic evidence for failed rifting in the Ligurian Basin                                                                 875

Figure 1. Relief map (GMRT data; Ryan et al., 2009) of the study area with the seismic refraction line (thick red line) and OBH/OBS
locations (yellow and orange triangles, respectively) that extend the MAKRIS profile (thick long black line) (Makris et al., 1999). Thin
black polygons and grey shaded areas mark volcanic extrusion according to Rollet et al. (2002). The different crustal domains (Rollet et al.,
2002) are marked by thin orange and red lines and are labelled AOD – atypical oceanic domain; CCM – Corsica continental margin; LCM
– Ligurian continental margin; and TD – transitional domain. A thin yellow line marks the oceanic domain (ODG) according to Gueguen et
al. (1998). Thin red dashed lines show proposed fracture zones (Rollet et al., 2002). Short thick yellow bar perpendicular to the MAKRIS
profile marks the continent–ocean transition (COT) (Makris et al., 1999). Green triangles and thin dotted black lines are the OBS locations
and shot profiles of Dessa et al. (2011). The black and white inset in the lower left corner shows previous seismic refraction and reflection
lines: 1 – Prada et al. (2014); 2a/2b – Gailler et al. (2009); 3 – Jolivet et al. (2015); 4 – Makris et al. (1999); 5 – Contrucci et al. (2001); and
6 – MA24 from Rollet et al. (2002).

(2) transitional zones to (3) continental crust. The location               trending seismic refraction and wide-angle reflection line is
of the north-east–south-west-trending continent–ocean tran-                 situated in the prolongation of an existing refraction profile
sition is proposed to be situated in the vicinity of the volcanic           in the northern Ligurian Basin (Makris et al., 1999) (Fig. 1).
Tristanites Massif (Fig. 1) (Makris et al., 1999) (yellow bar
perpendicular to the MAKRIS profile in Fig. 1). Based on                    3.1    Data acquisition and processing
re-analysed expanding spread profiles (ESPs), Contrucci et
al. (2001) proposed a 40 km wide area of oceanic crust near
                                                                            The active seismic data were simultaneously recorded on
the Median Seamount (Fig. 1).
                                                                            short-period ocean bottom seismometers (OBSs) and ocean
                                                                            bottom hydrophones (OBHs) as well as on a short streamer
3   Data acquisition, processing, and modelling                             (280 m long) that was towed behind the vessel at 5 m water
                                                                            depth. Additionally, Parasound sediment echo sounding data
Data at different scales resolving the subsurface structure                 were recorded along the profile. The 127.5 km long refrac-
were acquired in the Ligurian Sea in February of 2018 during                tion seismic profile consists of 15 OBHs/OBSs at a station
the cruise MSM71 aboard the German research vessel Maria                    spacing of ∼ 8 km (Fig. 1). A total of 1079 shots were fired
S. Merian (Kopp et al., 2018). Active seismic refraction data               by an ∼ 89 L (5420 in.3 ) G-gun array consisting of two sub-
were obtained along the centre of the basin. Our NE–SW-                     arrays, each with a cluster of 2 × 8.5 L (520 in.3 ), followed

www.solid-earth.net/11/873/2020/                                                                              Solid Earth, 11, 873–887, 2020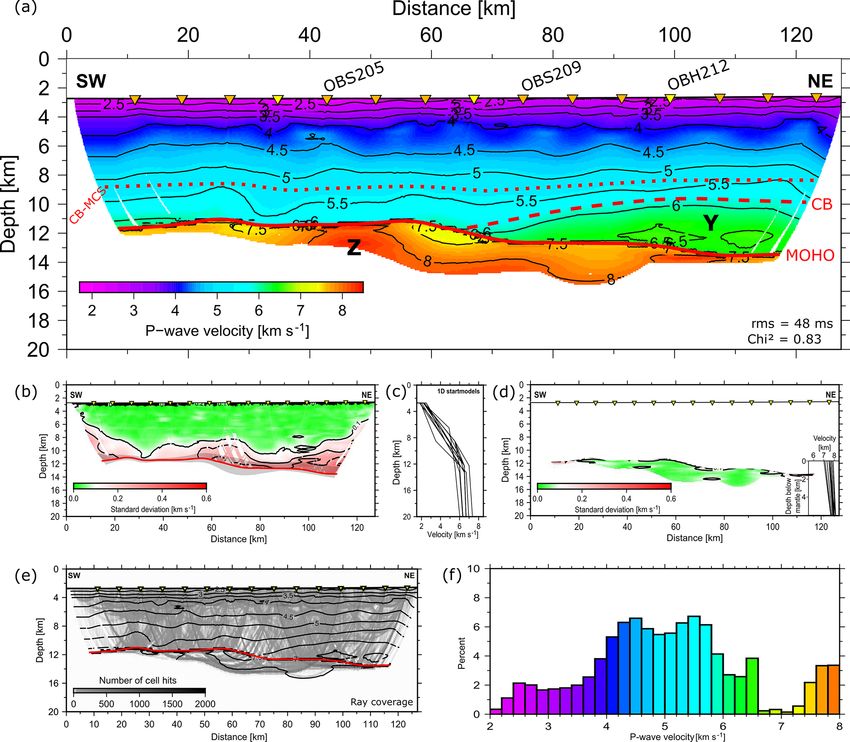
876                                            A. Dannowski et al.: Seismic evidence for failed rifting in the Ligurian Basin

by a cluster in the middle of 2 × 6.2 L (2 × 380 in.3 , port)      and proved reliable for writing speeds and SD cards of up
and 2 × 4.1 L (2 × 250 in.3 , starboard), and the third clus-      to 128 GB (larger capacities are possible). The low power
ter again of 2 × 8.5 L for both sub-arrays. The array with a       consumption of 375 mW (average battery drain) allowed us
string distance of 12 m was towed at 8 m below the sea sur-        to save batteries. We used only eight alkaline batteries per
face and 40 m behind the vessel. A shot interval of 60 s re-       station for our short-term deployment. Thus, using lithium
sulted in a shot distance of ∼ 123 m. The guns were shot at        batteries, long-term deployments of more than 9 months can
∼ 190 bar, providing a dominant frequency band of approxi-         be performed. Battery power can further be saved by a de-
mately 5–70 Hz. The location of the stations on the seafloor       layed start of recording up to 31 d after programming. We
was determined using the symmetry of the direct water ar-          set the recording parameters – i.e. the number of channels,
rivals from the shots on both sides. For this purpose, the di-     gain, and sampling rate – using a graphical user interface.
rect arrival was picked and the deviation between computed         The recorders can be programmed through any terminal pro-
and real travel times was minimised by adjusting the OBS’s         gram on a Windows or Linux operating system. The pro-
position along the profile. Dislocation offline cannot be cor-     gramming device was connected via RS232 using an RS232–
rected with this method. For 2D travel time modelling, the         USB adapter. A second RS232 interface can be used to drive
stations were projected onto the profile. The airgun shots         external sensors (e.g. levelling of broadband seismometers).
were recorded using newly developed GEOLOG data log-               The GPS system used for the internal clock time synchro-
gers designed at GEOMAR. All recorders operated reliably           nisation was developed together with the recorder and can
during the deployment of 2 d with a negligible absolute clock      operate with GPS, GLONASS, GALLILEO, and QZSS, en-
drift between −1.03 and +0.72 ms. The sampling frequency           abling operation worldwide and in polar regions. Besides sta-
was 250 Hz. The data processing included the conversion of         ble output of NMEA data (defined by the National Marine
the continuous data from GEOLOG format into the standard           Electronics Association) and a PPS (pulse-per-second) time
continuous SEG-Y format using the GEOLOG programming               signal, the German DCF-77 code is also available. Moreover,
interface. Afterwards, the continuous SEG-Y data were con-         the GPS system is available to deliver time- or distance-based
verted into standard trace-based SEG-Y format (Fig. 2b). Si-       trigger with TTL output, NMEA sequence, and records of
multaneously, the clock drift was corrected, a step important      time stamps on an SD card.
for OBS data, since the instruments cannot be continuously
synchronised via GPS during deployment as commonly done            3.3   Data description and analysis
onshore. A gated Wiener multi-trace deconvolution with an
autocorrelation average of 51 traces was applied to the shot       The airgun shots can be followed for offsets up to 60 km at
gathers to compress the basic wavelet, to leave the Earth’s        all 15 stations (Fig. 2). In general, the sections look very sim-
reflectivity in the seismic trace and to remove the source sig-    ilar with clear sedimentary arrivals and wide-angle Moho re-
nature and the hydrophone and geophone responses.                  flections (PmP) as well as mantle phases (Pn) at a critical
                                                                   distance between 25 and 35 km to the stations (Fig. 2a). Al-
3.2   The GEOLOG recorder                                          though phase arrivals show common features in all record
                                                                   sections (Fig. 2a), the characteristics of the seismic phases
The GEOLOG is a 32 bit seismic data logger designed to             change slightly from south to north (Fig. 2b–d).
digitise data from a three-component seismometer and a hy-            As a result of decreasing water depth towards the north-
drophone. We recorded the hydrophone output on two chan-           east, the direct wave through water (Pw) arrives later at the
nels (channels 1 and 5) at two different amplification levels      southern stations than at the northern stations (Fig. 2a). Ar-
providing well-amplified long-range records (gain = 16) and        rivals from a shallow sedimentary reflection phase (PsP) oc-
preventing clipped amplitudes from short-range airgun shots        cur approximately 0.5 to 1 s after the direct wave and re-
(gain = 1) to minimise difficulties with amplitude restoration     sult from the top of salts that become shallower towards
because no gain range was implemented. The gain for seis-          the north (as imaged in the multi-channel seismic (MCS)
mometer channels 2, 3, and 4 was set to 16, which provided         data in Fig. 3a). The red picks (Ps1) and the orange picks
good signal-to-noise ratios for all record offsets without clip-   (Ps2) (Fig. 2b–d) are interpreted as refracted phases through
ping of amplitudes. Two additional analogue pins can be used       Plio–Quaternary and older sediments, respectively. The ap-
as general-purpose input/output (GPIO) for measuring power         parent seismic velocity of the Ps2 is very constant at ∼ 4.3 to
levels for example. External devices can be served by 3.3 and      ∼ 4.6 km s−1 . The phase shows many undulations and some
5 V connectors. Sampling intervals between 50 Hz and 4 kHz         shadow zones (Fig. 3b) caused by the salt unit that displays
are controlled either by an atomic clock or by a temperature-      intense doming and is possibly disrupted by some volcanic
compensated clock (SEASCAN). We used an external GPS               structures that are imaged in the MCS (Fig. 3a) and the Para-
receiver for synchronisation of the internal clock prior to        sound data (Fig. 3c). This phase continues as a secondary ar-
and after deployment, which was driven by the GEOLOG               rival (Ps3) with a similar apparent velocity of ∼ 4.6 km s−1
itself. Our seismic data were stored on two microSD cards          at the southern stations but disappears at the northern sta-
with a volume of 32 GB each. The recorder has been tested          tions. Based on the apparent velocity and forward modelling,

Solid Earth, 11, 873–887, 2020                                                               www.solid-earth.net/11/873/2020/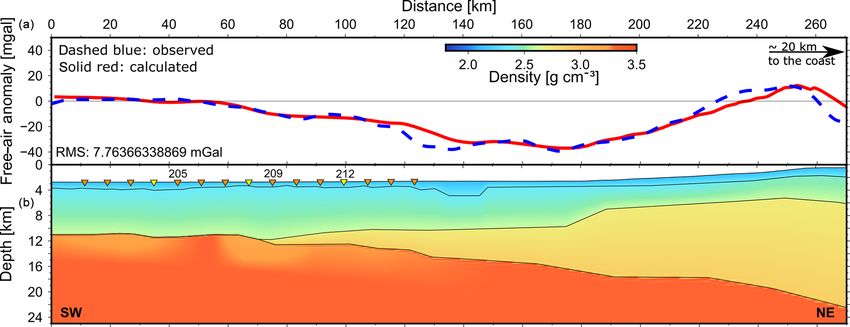
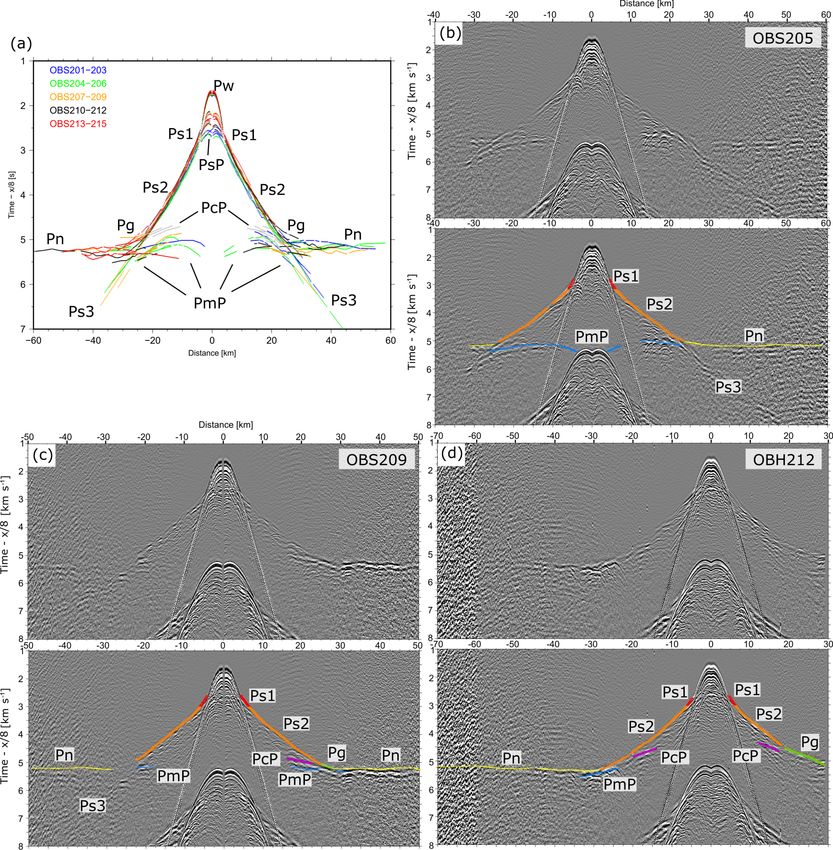
A. Dannowski et al.: Seismic evidence for failed rifting in the Ligurian Basin                                                           877

Figure 2. (a) Stacked travel time picks of all 15 stations showing very similar arrivals, suggesting an almost 1D structure along the profile.
(b) Record section of station OBS205 (time reduced with a velocity of 8 km s−1 ). The lower panel shows the calculated travel time picks
from the final velocity model superimposed on the seismic data. (c) Record section and calculated travel times of station OBS209. (d) Record
section and calculated travel times of station OBH212.

we interpret phase Ps3 as a refracted phase through the sed-             show a similar apparent seismic velocity of ∼ 8 km s−1 at the
iments. Simultaneously, when phase Ps3 disappears from                   northern stations. However, the critical distance at the north-
OBS208 towards the north (compare to OBS209 (Fig. 2c),                   ern stations moves to slightly larger offsets of up to ∼ 30 km.
where Ps3 only occurs on the southern branch), an additional             Furthermore, an earlier very short reflection occurs at 20–
refracted phase (Pg) (green picks in Fig. 2c, d) occurs with             25 km offset. Pn phases at the southern stations are very
an increasing range of offsets observed at the stations north-           weak, while the PmP is relatively strong compared to typical
wards. The phase has an apparent velocity of ∼ 6.2 km s−1 .              oceanic crust characteristics. The observed slight changes in
At an offset of about 25 km, an abrupt change in the appar-              the seismic signal are accompanied by slight changes in the
ent seismic velocity to ∼ 8 km s−1 occurs for the first arrival,         free-air gravity anomaly around profile kilometre 60 (approx.
as typically observed in the oceanic upper mantle. The yel-              20 km south of OBS209), as discussed below.
low picks (Fig. 2b–d) are refracted mantle phases (Pn) that

www.solid-earth.net/11/873/2020/                                                                         Solid Earth, 11, 873–887, 2020
878                                              A. Dannowski et al.: Seismic evidence for failed rifting in the Ligurian Basin

Figure 3. (a) Multi-channel seismic data (MCS data) simultaneously shot with the refraction seismic line. The orange and yellow triangles
mark the OBS and OBH positions along the profile, respectively. (b) Upper panel shows OBS205 from shot point 300 to shot point 600 with
a reduction velocity of 4.5 km s−1 . The lower panel is a zoomed-in view of the MCS section (black box in a). The white lines show that the
undulations in the sedimentary phases fit well with faults and salt diapirs. (c) Parasound sediment echo sounder data (orange box in a).

3.4   P-wave travel time tomography modelling strategy                  nal and the decreased signal-to-noise ratio. Subsequently, all
      and parameters                                                    first arrivals and the mantle reflections were inverted with
                                                                        a set of starting models that converged to χ 2 values of less
A preliminary seismic velocity model was build using RAY-               than 1 within five iterations. To test the model space and its
INVR (Zelt, 1999) to (1) reveal the overall structure of the            limits, starting models, ranging from velocities between 1.8
profile, (2) manually assign the picked phases to certain lay-          and 2.5 km s−1 at the seafloor with different velocity gradi-
ers, and (3) serve as starting point for the travel time tomog-         ents to velocities between 4.5 and 7.5 km s−1 at 12–13.5 km
raphy. Travel times were picked on the hydrophone chan-                 depth to mimic the different types of crust, were manually
nels using the interactive analysis tool for wide-angle seis-           created using RAYINVR (Zelt, 1999). The 1D starting mod-
mic data PASTEUP (Fujie et al., 2008). The overall quality              els were hanging below the seafloor (Fig. 4c). To carefully
of the hydrophone data was slightly better compared to the              evaluate the resulting velocity models, we used three crite-
vertical geophone channel; however, the vertical component              ria: (1) travel times need to fit the data (Fig. 2a); (2) travel
was used for picking to confirm and to complement the picks             time residuals, root mean square (rms) misfit, and χ 2 have to
observed on the hydrophone channel. In addition, multiples              be low (i.e. χ 2 ∼ 1); and (3) the gravity response (calculated
were picked when above the noise level (because of con-                 after a velocity–density conversion according to Korenaga et
structive interference) and where primary waves are below               al., 2001) of the resulting density model must yield compara-
the noise level (Meléndez et al., 2014). Picks of water layer           ble results to the satellite gravity data. Based on this evalua-
multiple phases were used during the forward modelling ap-              tion, 17 models (Fig. 4c) were chosen to generate an average
proach to confirm the layer boundaries and seismic veloci-              model for the crustal part (Fig. 4a, above the Moho), and
ties. Thereafter, a travel time tomographic inversion (tomo2D           the standard deviation was calculated (Fig. 4b). Overall, the
from Korenaga et al., 2000) was applied to invert the seismic           standard deviation in the crust down to the acoustic basement
P-wave velocity model and yield model uncertainties. The                is smaller than 0.15 km s−1 , indicating small differences be-
picks were assigned pick uncertainties in the range of 20 ms            tween the inverted velocity models and hence an excellent
for clear near-offset phases (Ps1), 30 ms for intermediate off-         resolution. Random Gaussian noise was not added to the
sets (Ps2 and Pg), and up to 50–70 ms for picks at larger off-          travel time picks; however, during modelling, re-picking of
sets (Pn and PmP), taking into account the decreased reso-              phases (mainly fine adjustments to the picks) did not lead to
lution due to the increased wavelength of the seismic sig-

Solid Earth, 11, 873–887, 2020                                                                     www.solid-earth.net/11/873/2020/
A. Dannowski et al.: Seismic evidence for failed rifting in the Ligurian Basin 879
major differences in the resulting velocity model. In a further on absolute velocities, as continental crust, thickening to-
step, the average model was edited by adding different 1D wards the north. The acoustic basement here is at a depth
profiles with mantle velocities underneath the crust–mantle of ∼ 10 km below the sea surface. At the opposite south-
boundary (inlay in Fig. 4d). A set of 14 mantle velocity start- ern half of the profile, we could not identify the CB in the
ing models was used to invert for refracted mantle phases, OBS data. However, a strong velocity jump occurs from 5.7
while the model above the seismic Moho was overdamped. to ≥ 7.3 km s−1 that we interpret as the crust–mantle bound-
Again, an average model and the standard deviation for the ary (Moho). The uppermost mantle is characterised by seis-
mantle were calculated (Fig. 4d). Standard deviations for the mic velocities > 7.3 km s−1 that increase to ∼ 8 km s−1 over
mantle P-wave velocities are small (< 0.1 km s−1 ), indicat- a depth interval of 2–3 km. The histogram (Fig. 4f) images a
ing a good resolution of upper-mantle velocities. Lastly, the gap in seismic velocities between 6.6 and 7.3 km s−1 , which
very short reflected phases interpreted as resulting from the suggests that no fresh oceanic crust material (gabbroic rocks)
top of the continental crust were calculated as a floating re- is present along the profile.
flector without implementing a velocity discontinuity into the
model to confirm the top of crust, i.e. the crystalline base- 4.2 Gravity modelling
ment (CB in Fig. 4a).
To constrain the crustal structure along the profile, we cal-
culated the gravity response (Talwani et al., 1959) of the fi-
nal seismic velocity model and compared it to the free-air
4 Results
gravity anomaly derived from satellite data (Sandwell et al.,
4.1 Seismic P-wave velocity distribution 2014). The fact that the profile is situated in the centre of the
basin allows us to assume that only minor 3D side effects
In general, the average P-wave velocity along the profile occur in our 2D-modelling approach, caused by topogra-
(Fig. 4a) shows only minor lateral variations, mainly caused phy. The velocity–depth distribution was used to assign den-
by the salt layers and the corresponding tectonic features sities by applying different density–velocity relations. The
at 4–6 km depth. The uppermost portion of the velocity water layer is assumed to have a density of 1.03 g cm−3 .
model is characterised by a strong velocity gradient of ∼ Gardner’s rule, ρ = 1.74 · Vp0.25 , valid for sediments be-
1 s−1 that is laterally constant. P-wave velocities increase tween 1.5 km s−1 < Vp < 6.1 km s−1 (Gardner et al., 1974),
from 2.2 km s−1 at the seafloor to 3.5 km s−1 approximately was used for the sedimentary layers. For crystalline (non-
1.3 km depth below the seafloor. We interpret this unit as volcanic) rocks the relation ρ = 0.541 + 0.3601 · Vp (Chris-
Plio–Quaternary sediments mixed with the upper evapor- tensen and Mooney, 1995) was used. A density of 3.3 g cm−3
ite unit according to Rollet et al. (2002), using their multi- was assigned to the mantle. In areas with reduced seis-
channel seismic data profile MA24 (Fig. 1, inlay profile 6). mic mantle velocities, the mantle density was reduced to
The Plio–Quaternary sediments are imaged as horizontally 3.15 g cm−3 (Carlson and Miller, 2003). The converted den-
layered strata in the multi-channel seismic data in Fig. 3a. sities explain the observed free-air gravity anomaly for the
This high-velocity gradient layer thins towards the north, part covered by our deployed instruments. We extended
from 1.5 to 1.2 km thickness, and shows slightly slower ve- the profile further north-east over the marine part of the
locities at the southern end (2.2 km s−1 ) compared to the MAKRIS line (Fig. 1, inlay profile 4). From profile kilo-
northern end (2.4 km s−1 ) at the seafloor. Between ∼ 4 and metre 127.5 northwards, we related the gross density model
6 km depth, the velocities range from 3.5 to 4.5 km s−1 , and structure to the results of the MAKRIS line (Makris et al.,
there are areas where minor velocity inversions are observed. 1999). However, we removed a large step of 10 km in Moho
These low-velocity units have a lateral extent of up to 10 km depth and replaced it with a more gradually deepening Moho,
and a velocity contrast of up to ∼ 0.2 km s−1 . We identify which closely follows the top of the layer of underplating in
this section as the Messinian salt unit. From 6 to ∼ 10 km the MAKRIS line. The fit of observed and calculated gravity
depth, the seismic velocities increase from ∼ 4.5 km s−1 at data supports the interpretation of a thickening continental
the top to 5.7 km s−1 at the bottom. We interpret this section crust towards the north-east reasonably well.
as syn-rift sediments, possibly Aquitanian according to Jo-
livet et al. (2015), to post-rift sediments, until pre-Messinian. 5 Discussion
We will discuss the nature of these layers in a later section,
since the observed seismic velocities also account for tilted 5.1 Nature of the crust
fault blocks of stretched continental crust.
In the north-eastern half of the profile, starting roughly at The seismic velocity model along our refraction profile
profile kilometre 70, we determine the CB (red dashed line (Fig. 4a) shows no common features of oceanic crust.
in Fig. 4a) at a depth of 10 to 11.5 km below the sea sur- Oceanic crust typically consists of a high-velocity gradient in
face. The basement velocities increase from 5.8 to 6.6 km s−1 Layer 2 and a lower velocity gradient in Layer 3 (e.g. White
(marked with “Y” in Fig. 4a); they are interpreted, based et al., 1992; Grevemeyer et al., 2018; Christeson et al., 2019).
www.solid-earth.net/11/873/2020/ Solid Earth, 11, 873–887, 2020880 A. Dannowski et al.: Seismic evidence for failed rifting in the Ligurian Basin Figure 4. (a) Final velocity model based on the averaged velocities from the plausible starting models. The red dashed line marks the crystalline basement (CB) as determined from the refraction seismic data. The red dotted line presents the CB inferred from MCS data (CB- MCS) crossing our profile (details given in the text). The solid red line marks the crust–mantle boundary (Moho). (b) Standard deviation for 17 inverted velocity models, covering the crustal part down to the Moho. (c) Starting models used in the inversion and to calculate the resulting average model in (a). (d) Standard deviation for 14 inverted velocity models (starting models in the inlay), covering the upper mantle up to the Moho. (e) Ray coverage for the final average velocity model. (f) Histogram with the velocity distribution of the final average velocity model. The absolute seismic velocities are highly variable; however, the northern half of the profile, starting from profile kilometre for a gabbroic crust, velocities are typically between 6.7 and 70, at a depth of 10 to 13 km (marked with “Y” in Fig. 4a). 7.2 km s−1 (Grevemeyer et al., 2018; Christeson et al., 2019). The observed seismic velocities provide only two possible The histogram in Fig. 4f shows a gap for this range of veloc- interpretations: (1) hyper-extended continental crust or (2) a ities, suggesting the lack of a thick gabbroic layer and, thus, laterally isolated magmatic intrusion within the sedimentary the lack of typical oceanic crust. In any case, the lack of seis- units feeding the volcanic extrusion observed in the MCS and mic velocities expected for oceanic crust does not support the Parasound data (Fig. 3c). Based on the gravity model (Fig. 5), occurrence of larger units of oceanic crust as observed in the we favour the first scenario of extremely thinned continental central Tyrrhenian Sea (Prada et al., 2014). crust, which decreases in thickness towards the SW and may Continental crust is characterised by a low-seismic- even lead to exhumed mantle during the rifting phase in the velocity gradient throughout the crystalline crustal layers and south. shows typical velocities of ∼ 5.8 to ∼ 6.6 km s−1 (Chris- The velocity model for the southern half along our re- tensen and Mooney, 1995). We observe this velocity range in fraction profile is well constrained; however, the lower part Solid Earth, 11, 873–887, 2020 www.solid-earth.net/11/873/2020/
A. Dannowski et al.: Seismic evidence for failed rifting in the Ligurian Basin                                                            881

Figure 5. Density model (b) converted from seismic velocities to densities (details given in the text) for the SW part covered by seismic
stations. The profile was extended towards the NE using the marine part of the seismic refraction line of Makris et al. (1999). Panel (a) shows
the data fit between the satellite-derived free-air anomaly data (Sandwell et al., 2014) (dashed blue) and the model response (solid red line).

(9 to 11 km depth), above the Moho, shows higher uncer-                   crustal layer supports the interpretation as continental crust,
tainty compared to the shallow sedimentary units. The depth               since we would expect the COT to be manifested in an abrupt
of the crust–mantle boundary is well constrained with an                  change from oceanic to continental crust or oceanic crust to
uncertainty range of ±0.25 km along the southern profile                  gradually thin out towards the NE, towards the rotational pole
half in contrast to ±0.75 km along the northern profile half              (Rosenbaum et al., 2002), depending on the position of the
(Fig. 4b). We observe seismic velocities > 5.5 km s−1 , which             profile with respect to the proposed spreading axis.
we interpret as fast syn-rift sediments due to a missing crys-               An ESP (Le Douaran et al., 1984; Contrucci et al., 2001)
talline basement reflection. Alternatively, the change from               crosses the northern end of our profile (Fig. 1, inlay profile 5).
sediments to the crystalline basement might not be charac-                There the crust–mantle boundary was defined at a depth
terised by a high impedance contrast and, thus, not imaged                of 13–15 km, while the acoustic basement was observed at
in our refraction seismic data as a strong-amplitude reflec-              ∼ 9 km depth. Contrucci et al. (2001) retrieved crustal ve-
tion event (compare to Fig. 2); it is expressed with a higher             locities of 6.3–6.9 km s−1 for the basin centre, which in gen-
uncertainty of the determined CB at the northern profile end              eral is in good agreement with our results. Based on MCS
(Fig. 4). The MCS line MA24 (Rollet et al., 2002) (Fig. 1,                data (LISA01) (Contrucci et al., 2001) with an observed ma-
inlay profile 6) records the acoustic basement at ∼ 6.5 s two-            jor step in the basement on the Ligurian margin, they inter-
way travel time (stwt), while the seafloor occurs at 3.6 stwt             preted the central basin as an oceanic domain. On the Corsica
(∼ 2.7 km below sea surface). By means of a simple time-                  margin, this major step was not observed; however, mag-
to-depth conversion using an average seismic velocity of                  netic anomalies were used to constrain the interpretation.
4.2 km s−1 , we estimate a minimum sedimentary thickness of               The MCS data resolve only the sedimentary portion of the
∼ 6.1 km (2.9 stwt), resulting in an acoustic basement depth              crust and yield no information on the internal structures of
of ∼ 8.8 km, as the shallowest approximation (drawn as a red              the crystalline basement itself. Thus, a different explanation
dotted line in Fig. 4a). This line roughly fits the 5.5 km s−1            for the major step in the basement near the Ligurian margin
isoline accounting for a standard deviation of 0.2 km s−1                 could be that upper-crustal blocks sit on top of the continental
(Fig. 4b). For the southern half of our profile, this leaves a            mantle similar to the Galicia margin (Nagel and Buck, 2004).
maximum continental crustal thickness of 2–2.5 km, thick-                 Our profile only provides information on the basin centre,
ening northwards.                                                         where the absolute velocities of Le Douaran et al. (1984)
   Based on the refraction seismic data along our profile                 and Contrucci et al. (2001) fit continental crust velocities and
(southern half), we are not able to distinguish between sed-              support our interpretation for the northern end of the profile,
iments with high seismic velocities and extremely thinned                 where we observe mantle material beneath thinned continen-
continental crust. However, we can give a minimum and                     tal crust.
maximum continental crustal thickness, ranging from 0 to
2.5 km. Based on the velocity model (Fig. 4a), it is not pos-             5.2   Low degree of mantle serpentinisation
sible to distinguish whether the crystalline basement is up-
per, middle, or lower continental crust. The thickening of
the continental crust towards the north-east is also supported            Seismic velocities of unaltered mantle are > 7.8 km s−1
by the gravity modelling (Fig. 5). Additionally, a thickening             (Carlson and Miller, 2003; Grevemeyer et al., 2018). Based
                                                                          on the seismic P-wave velocities, we interpret the uppermost

www.solid-earth.net/11/873/2020/                                                                          Solid Earth, 11, 873–887, 2020
882 A. Dannowski et al.: Seismic evidence for failed rifting in the Ligurian Basin mantle to be serpentinised at a low grade, which is supported al., 2013). Two other factors can play a role for the degree by the Pn phases that are weak in amplitude at the south- of mantle serpentinisation in the Ligurian Basin: Ruepke et ern stations (Fig. 2). P-wave velocities of ∼ 7.5 km s−1 in the al. (2013) show in thermo-tectono-stratigraphic basin mod- south-western half of the profile (Fig. 4a) are in line with up els the effects of sedimentary blanketing and low stretch- to ∼ 20 % serpentinisation (Carlson and Miller, 2003). From ing factors on serpentinisation. Hence our seismic velocity OBS204 to OBS207, the PmP phase is extremely high in am- model (Fig. 4a) can be well explained if mantle rocks have plitude and unusually clearly visible over a wide distance of been partially exhumed from continental crust, without being up to 20 km (in ∼ 10 to ∼ 30 km offset to the station). This directly exposed to seawater due to syn-rift sedimentation. area (profile kilometre 40–60) is marked by Vp > 7.8 km s−1 Also the interpretation of extremely thinned brittle continen- directly underneath the basement (“Z” in Fig. 4a), possibly tal crust requires syn-rift sedimentation since the stretching an area of unaltered mantle due to a leftover (and possi- might open fluid pathways through the crust down to the bly rotated) block of continental crust as observed in other mantle and would lead to a high degree of mantle serpen- magma-poor passive margins (Bayrakci et al., 2016). The tinisation (Nagel and Buck, 2004). fact that the mantle is only partly serpentinised suggests ei- ther that continental crustal blocks are overlying the mantle, 5.3 Continent–ocean transition and magmatic and thus it was not fully exposed during rifting, or that syn- intrusions rift sediments (recently showing high P-wave velocities) may have been directly deposited on top of the mantle, preventing The MCS line MA24 (Rollet et al., 2002) was shot along its full serpentinisation (Perez-Gussinyé et al., 2013). Thus, an ESP consisting of four measurements with a spacing of structurally, the Ligurian Sea is mimicking the Atlantic non- ∼ 35 km (Le Douaran et al., 1984). The two transects cross volcanic passive margins of Iberia (Minshull et al., 2014) and our profile at the southern end (Fig. 1, inlay profile 6). The Goban Spur (Bullock and Minshull, 2005). However, the fast MCS data resolve sedimentary units, while the seismic ve- mantle in the Ligurian Sea would support a much lower de- locities retrieved along the ESP show no absolute seismic gree of serpentinisation when compared to these two regions velocities similar to oceanic crust. Both transects do not map with a mantle serpentinisation of 100 % at the top basement a spreading axis. Further west along the Ligurian margin, and < 25 % at 5–7 km depth at the Goban Spur and > 75 % a multi-channel seismic study (Jolivet et al., 2015) and a at the top basement and < 25 % at 2 km depth at the Iberia wide-angle refraction seismic study (Gailler et al., 2009) of margin. the Ligurian margin (Fig. 1, inlay profiles 2a and 3), in the In comparison to the central Tyrrhenian Sea, where ex- Gulf of Lion, show a wide continent–ocean transition zone. humed mantle is inferred, the P-wave velocities of the upper The travel time tomography model along the OBS profiles mantle in the Ligurian Sea are faster (Fig. 4a). P-wave veloc- (Gailler et al., 2009) images a succession of three domains: ities of the upper mantle in the Magnaghi and Vavilov basins (1) continental, (2) transitional, and (3) oceanic towards the in the Tyrrhenian Sea (i.e. Domain #3 in Prada et al., 2014) basin centre, following the zonation of Rollet et al. (2002). are significantly lower at 4.5 km s−1 at the top of the mantle The same succession was found for both continental mar- (Prada et al., 2016). We observe significant differences be- gins, though the Corsica margin’s transitional zone is much tween both basins: (1) along the southern half of our profile narrower. The transitional domain is interpreted as consist- we observe strong PmP reflections indicating a high-velocity ing of a mixture of continental crust, exhumed mantle, and contrast at the crust–mantle boundary, while in Domain #3 in magmatic intrusions (Gailler et al., 2009; Rollet et al., 2002). the Tyrrhenian Sea PmP reflections are absent. (2) The Lig- In contrast, Jolivet et al. (2015) interpret the transitional zone urian Basin was stretched ∼ 150 km during the 16 Myr open- as exhumed lower continental crust overlying the continen- ing phase, while the Tyrrhenian Sea was stretched ∼ 170 km tal mantle which was exhumed in the distal part and ser- within 5 Myr prior the onset of oceanic spreading (Faccenna pentinised. The nature of the COT along the Gulf of Lion et al., 2001; Prada et al., 2014). Thus, the stretching rate in is still debated. For example, numerical modelling of conti- the Tyrrhenian Sea was higher compared to the Ligurian Sea. nental rifting at the magma-poor Galicia margin showed that Further, (3) the Ligurian Basin has a thick sedimentary cover the lower crust is scarcely preserved or absent at the con- of ∼ 6–8 km, while the Tyrrhenian Sea Domain #3 shows a tinental tip (Nagel and Buck, 2004). Our velocity model at sedimentary cover of ∼ 1–2 km (Prada et al., 2014). Syn-rift the base of the continental crust is not resolved well enough sedimentation was recorded in MCS data (Fig. 1, “3” in the (Fig. 4b) to distinguish between upper and lower continental inlay profile) in the Gulf of Lion (Jolivet et al., 2015). The crust, but we emphasise again that we can exclude oceanic proximity of the two basins to the continental margin during crust based on the seismic velocity structure (Fig. 4f) and the their formation might result in a different syn-rift sedimen- results of gravity modelling (Fig. 5) along our seismic pro- tation rate that possibly was higher in the Ligurian Sea com- file. The oceanic domain on both conjugated margins in the pared to the Tyrrhenian Sea. Sediments are known to reduce Gulf of Lion (Fig. 1, inlay profile 2a) and offshore of Sar- the permeability and, thus, the amount of water that reaches dinia (Fig. 1, inlay profile 2b) was interpreted on the basis of the mantle rocks necessary for serpentinisation (Ruepke et a 2D P-wave model derived from travel time tomography as Solid Earth, 11, 873–887, 2020 www.solid-earth.net/11/873/2020/
A. Dannowski et al.: Seismic evidence for failed rifting in the Ligurian Basin                                                   883

an anomalously thin oceanic crust (4–5 km) with the typical        rifting phase and could add to the discontinuous magnetic
two-layer gradients clearly characteristic of oceanic layers 2     anomalies.
and 3 (Gailler et al., 2009).
   The extension process in the Ligurian Basin stopped             5.4   Opening of the Ligurian Basin
roughly 16 Ma and was replaced by the extension and open-
ing of the Tyrrhenian Sea as the Apennines–Calabrian sub-          The opening of the Ligurian Basin in a back-arc position
duction zone continued to roll back. The magnetic data             during the late Oligocene and Early Miocene was driven by
(Bayer et al., 1973; Cella et al., 2008) in both basins show       the south-east-retreating Apennines–Calabria–Maghrebides
a similar anomaly distribution with discontinuous, partially       subduction zone (e.g. Doglioni et al., 1997; Faccenna et al.,
isolated anomalies. Prada et al. (2014) analysed a seismic         1997; Réhault et al., 1984; Carminati et al., 1998). The shift
refraction profile crossing the Tyrrhenian Sea from Sardinia       of active expansion from the Ligurian Basin to the Tyrrhe-
to mainland Italy. Similar to the Ligurian Basin, the western      nian Sea is considered a result of the Alpine collision that
margin is more elongated than the eastern margin. They di-         locked the Corsica–Sardinia drift towards the east and slab
vide the analysed profile into three different domains from        break-offs along the northern African margin and along the
Sardinia to the central basin: in Domain #1 continental crust      Apennines (Carminati et al., 1998). Thus, the opening of the
thins from 22 to 13 km over a distance of 80 km. Domain            Ligurian Basin was limited in time and space. Two differ-
#2 is interpreted as magmatic back-arc crust with blocks of        ent conceptual scenarios of rifting could explain our obser-
continental crust and stretches over a distance of ∼ 80 km         vations: (1) rifting causing continental crust to thin until con-
on the Corsican side of the basin (Prada et al., 2014). The        tinental lower crust and mantle are exhumed, with oceanic
change from continental to magmatic crust is marked by an          spreading induced afterwards as observed in the Gulf of Lion
abrupt increase of seismic velocities to > 7 km s−1 in the         (Gailler et al., 2009; Jolivet et al., 2015), and (2) rifting caus-
lower crust, similar to the observation of Gailler et al. (2009)   ing continental crust to thin until back-arc spreading is initi-
on the Ligurian Basin side of Sardinia. Prada et al. (2014)        ated and the continuation of extension leading to exhumation
interpret the seismic velocities, which are slightly lower than    of mantle with magmatic intrusions (Prada et al., 2016).
found in 0–7 Myr old oceanic crust, to be a result of back-           Depending on the scenario, our profile is situated in the
arc spreading close to the active volcanic arc. Domain #3 is       Ligurian transitional Domain #2 or in the Tyrrhenian domain
interpreted as being composed of serpentinised mantle to a         #3. Rifting scenario (2) would imply that well-developed
depth of 5–6 km with basaltic intrusions and shows a width of      oceanic back-arc crust should occur south-east and north-
∼ 140 km. Prada et al. (2014) suggest that rifting in the cen-     west of the profile. The transect reaches into the area of a
tral Tyrrhenian Basin started with extension of continental        3D seismic study of the Ligurian margin offshore of San-
crust, continued with back-arc spreading, and was followed         remo (Dessa et al., 2011). The authors state that they were
by mantle exhumation. Later, the area underwent magmatic           surprised not to see a distinct change in the velocity field at
episodes with magmatic intrusions into the sedimentary layer       the COT. Dessa et al. (2011) could not find clear evidence
or cropping out, forming volcanoes. These volcanoes and            for a kind of back-arc crust as shown by Prada et al. (2014)
magmatic intrusions could be related to magnetic anomalies         or Gailler et al. (2009). However, continental crustal thinning
(Prada et al., 2016). Using the Tyrrhenian Sea as an analogy,      is well imaged. Considering these aspects, we rather favour
we suggest that many of the isolated magnetic anomalies in         rifting scenario (1), which is also supported by the concep-
the Ligurian Sea are caused by magmatic intrusions or ex-          tual model described by Decarlis et al. (2017) for the evolu-
trusions manifested as volcanic edifices (Median Seamount,         tion of magma-poor rifted margins. The model includes three
Tristanites Massif, and Monte Doria; see Fig. 1) (Rollet et al.,   phases of extension: (1) an initial stretching phase forming
2002), rather than being related to a spreading axis, which        widely distributed half-grabens in the upper crust, (2) a thin-
has indeed not been mapped in MCS data so far. However, in         ning phase thereafter that leads to hyper-extended crust, and
MCS data, intrusions of volcanic sills into younger sediments      finally (3) an exhumation phase during which subcontinental
have been observed (Finetti et al., 2005). At the Monte Doria      mantle rocks were exhumed. Yet it is debated if we observe
Seamount, 11–12 Myr old basalts with a calc-alkaline signa-        the latter phase in the central Ligurian Basin.
ture have been sampled by dredges and submersible dives               Furthermore, the Ligurian Basin width in our study
(Rollet et al., 2002; Réhault et al., 2012). The age clearly       area (70–120 km) is much narrower than further south (∼
indicates post-rift magmatism. Further, volcanism related to       200 km), where Domain #2 has a cumulative length of ∼
the slab roll-back of the Apennines–Calabrian subduction           100 km for both conjugated margins together, which would
zone has been observed at the Ligurian continental margin          entirely fill the basin in our study area, leaving little or no
and dated to the initiation of the rifting phase (Rollet et al.,   space for oceanic spreading. This is supported, for exam-
2002). Volcanism is also associated with the end of the open-      ple, by petrological and geophysical observations at the West
ing of the Ligurian Basin and related to the trench retreat        Iberia margin that suggest that a COT zone can reach a width
of the Apennines–Calabrian subduction zone (Rollet et al.,         of up to 200 km (Pérez-Gussinyé, 2013).
2002). This implies that volcanism also occurred during the

www.solid-earth.net/11/873/2020/                                                                  Solid Earth, 11, 873–887, 2020
884                                            A. Dannowski et al.: Seismic evidence for failed rifting in the Ligurian Basin

   Additionally, the opening rate becomes lower towards the        Thus, we conclude that the oceanic domain does not extend
north, and the amount of stretching becomes less, which            as far north as previously stated and that the transition from
is probably caused by the anticlockwise rotation of the            the continental domain and the real oceanic domain with a
Corsica–Sardinia block. Stretching of the crust as a result        potential spreading axis is situated south or south-west of our
of the opening of the basin becomes less intense towards           seismic line.
the north and thus controls the NE termination of the ultra-
thin continental crust. Further, the extension of the basin de-
creases towards the north, and, assuming oceanic crust to be       Data availability. Seismic data are available on request from the
present, the crust should become less thick towards the pro-       first or second author and are available via the German marine data
posed ridge axis tip. However, our seismic data and gravity        archive PANGAEA at https://doi.org/10.1594/PANGAEA.910561
data indicate a gradual thickening of the crystalline crust, at    (Dannowski et al., 2020).
least a gradual deepening of the mantle, indicating thicken-
ing continental crust northwards. This is also supported by
                                                                   Author contributions. AD was involved in the investigation, for-
the magnetic data (Bayer et al., 1973), which do not show
                                                                   mal analysis, methodology, visualisation, and writing (original draft
the typical oceanic crust pattern of magnetisation stripes, but
                                                                   with contributions from all co-authors). HK participated in funding
rather a lateral patchy pattern of magmatic domains, support-      acqusition, conceptualisation, investigation, and writing (reviewing
ing again the lack of oceanic spreading during the formation       and editing). IG was involved in funding acquisition, methodology,
of the Ligurian Basin in the Oligocene–Miocene. Continu-           and writing (review and editing). DL carried out investigation and
ing further north of our seismic line, extension led to thinned    writing (review and editing). MT contributed to the investigation
continental crust, but the amount of extension was too small       and validation. JB was involved in providing resources and in writ-
to extremely thin out the continental crust and exhume man-        ing (review and editing). MWV contributed to resources and soft-
tle.                                                               ware.

6    Conclusion                                                    Competing interests. The authors declare that they have no conflict
                                                                   of interest.
The P-wave velocity model determined in this study images
the uppermost lithospheric structure of the central Ligurian
Basin. Syn- and post-rift sediments of ∼ 6–8 km thickness          Acknowledgements. We thank captain and crew of RV Maria S.
filled the basin during and after the 15 Myr long opening          Merian cruise MSM71 for their support during the OBS work. We
                                                                   thank the MSM71 cruise participants for their effort. The LOB-
phase. Based on the image of the seismic velocity distri-
                                                                   STER project comprises the offshore component of the AlpAr-
bution along the southern half of the profile, it remains un-
                                                                   ray seismic network (Hetényi et al., 2018) and is part of the Ger-
clear if the mantle is overlain directly by syn-rift sediments     man Priority Programme SPP2017 4D-MB. Generic Mapping Tools
or by extremely thin continental crust of up to 2.5 km. The        (Wessel and Smith, 1998) were used to produce the figures. We
degree of mantle serpentinisation with up to 20 % is low. The      thank Laurent Jolivet and the reviewers Jean-Xavier Dessa, and
northern half of the profile indicates a northward thickening      Manel Prada for their fruitful comments.
of continental crust and a deepening crust–mantle boundary
from 11 to 13 km. Based on the retrieved velocity distribu-
tion, gravity modelling, and results of surrounding studies,       Financial support. This research has been supported by
we conclude that the extension of the Ligurian Basin led to        the Deutsche Forschungsgemeinschaft (DFG) (grant no.
                                                                   KO_2961/6-1).
    1. extended and very thin continental crust or exhumed,
       partially serpentinised mantle; it remains unclear if the   The article processing charges for this open-access
       mantle is overlain directly by sediments or by extremely    publication were covered by a Research
       thinned continental crust of up to 2.5 km thickness;        Centre of the Helmholtz Association.

    2. continental crustal thinning from north to south related
       to the increase of extension with increasing distance       Review statement. This paper was edited by Michal Malinowski
       from the rotation pole of the anticlockwise rotation of     and reviewed by Jean-Xavier Dessa and Manel Prada.
       the Corsica–Sardinia block.

Furthermore, our study documents that

    3. seafloor spreading and formation of mantle-derived
       oceanic crust was not initiated during the extension of
       the Ligurian Basin.

Solid Earth, 11, 873–887, 2020                                                                 www.solid-earth.net/11/873/2020/
A. Dannowski et al.: Seismic evidence for failed rifting in the Ligurian Basin 885
References Contrucci, I., Nercessian, A., Béthoux, N., Mauffret, A., and Pascal,
G.: A Ligurian (Western Mediterranean Sea) geophysical tran-
sect revisited, Geophys. J. Int., 146, 74–97, 2001.
Advokaat, E. L., van Hinsbergen, D. J. J., Maffione, M., Langereis, Dannowski, A., Kopp, H., and Lange, D.: Seismic refrac-
C. G., Vissers, R. L. M., Cherchi, A., Schroeder, R., Madani, tion and wide-angle reflection data from profile MSM71-
H., and Columbu, S.: Eocene rotation of Sardinia, and the paleo- P02 of Maria S. Merian cruise MSM71 in the Lig-
geography of the western Mediterranean region, Earth Planet. Sc. urian Basin, with links to SGY data files, PANGAEA,
Lett., 401, 183–195, https://doi.org/10.1016/j.epsl.2014.06.012, https://doi.org/10.1594/PANGAEA.910561, 2020.
2014. Decarlis, A., Beltrando, M., Manatschal, G., Ferrando, S.,
Bayer, R., Le Mouel, J. L., and Le Pichon, X.: Magnetic anomaly and Carosi, R.: Architecture of the Distal Piedmont-
pattern in the western mediterranean, Earth Planet. Sc. Lett., 19, Ligurian Rifted Margin in NW Italy: Hints for a Flip
168–176, https://doi.org/10.1016/0012-821X(73)90111-8, 1973. of the Rift System Polarity, Tectonics, 36, 2388–2406,
Bayrakci, G., Minshull, T. A., Sawyer, D. S., Reston, T. J., https://doi.org/10.1002/2017TC004561, 2017.
Klaeschen, D., Papenberg, C., Ranero, C., Bull, J. M., Davy, Dercourt, J., Zonenshain, L. P., Ricou, L.-E., Kazmin, V. G., Le Pi-
R. G., Shillington, D. J., Perez-Gussinye, M., and Mor- chon, X., Knipper, A. L., Grandjacquet, C., Sbortshikov, I. M.,
gan, J. K.: Fault-controlled hydration of the upper man- Geyssant, J., Lepvrier, C., Pechersky, D. H., Boulin, J., Sibuet,
tle during continental rifting, Nat. Geosci., 9, 384–388, J.-C., Savostin, L. A., Sorokhtin, O., Westphal, M., Bazhenov,
https://doi.org/10.1038/NGEO2671, 2016. M. L., Lauer, J. P., and Biju-Duval, B.: Geological evolution of
Béthoux, N., Tric, E., Chery, J., and Beslier, M.-O.: Why is the tethys belt from the atlantic to the pamirs since the LIAS,
the Ligurian Basin (Mediterranean Sea) seismogenic? Ther- Tectonophysics, 123, 241–315, https://doi.org/10.1016/0040-
momechanical modeling of a reactivated passive margin: 1951(86)90199-X, 1986.
Modeling of the Ligurian Basin, Tectonics, 27, TC5011, Dessa, J.-X., Simon, S., Lelievre, M., Beslier, M.-O., Deschamps,
https://doi.org/10.1029/2007TC002232, 2008. A., Bethoux, N., Solarino, S., Sage, F., Eva, E., Ferretti, G.,
Bonatti, E., Seyler, M., Channell, J., Giraudeau, J., and Bellier, O., and Eva, C.: The GROSMarin experiment: three
Mascle, G. (Eds.): Peridotites drilled from the Tyrrhe- dimensional crustal structure of the North Ligurian margin
nian Sea, ODP Leg 107, Ocean Drilling Program 107, from refraction tomography and preliminary analysis of mi-
https://doi.org/10.2973/odp.proc.sr.107.141.1990, 1990. croseismic measurements, Bull. Soc. Geol. Fr., 182, 305–321,
Bullock, A. and Minshull, T.: From continental extension to seafloor https://doi.org/10.2113/gssgfbull.182.4.305, 2011.
spreading: Crustal structure of the Goban Spur rifted mar- Doglioni, C., Gueguen, E., Sàbat, F., and Fernandez, M.: The
gin, southwest of the UK, Geophys. J. Int., 163, 527–546, Western Mediterranean extensional basins and the Alpine oro-
https://doi.org/10.1111/j.1365-246X.2005.02726.x, 2005. gen, Terra Nova, 9, 109–112, https://doi.org/10.1046/j.1365-
Burrus, J.: Contribution to a geodynamic synthesis of the Provencal 3121.1997.d01-18.x, 1997.
Basin (NorthWestern Mediterranean), Mar. Geol., 55, 247–269, Faccenna, C., Mattei, M., Funiciello, R., and Jolivet, L.: Styles of
https://doi.org/10.1016/0025-3227(84)90071-9, 1984. back-arc extension in the Central Mediterranean, Terra Nova,
Carlson, R. L. and Miller, D. J.: Mantle wedge water contents es- 9, 126–130, https://doi.org/10.1046/j.1365-3121.1997.d01-12.x,
timated from seismic velocities in partially serpentinized peri- 1997.
dotites: mantle wedge water contents, Geophys. Res. Lett., 30, Faccenna, C., Funiciello, F., Giardini, D., and Lucente, P.: Episodic
1250, https://doi.org/10.1029/2002GL016600, 2003. back-arc extension during restricted mantle convection in the
Carminati, E., Wortel, M. J. R., Meijer, P. T., and Sabadini, R.: The Central Mediterranean, Earth Planet. Sc. Lett., 187, 105–116,
two-stage opening of the western-central mediterranean basins: https://doi.org/10.1016/S0012-821X(01)00280-1, 2001.
a forward modeling test to a new evolutionary model, Earth Fernàndez, M., Foucher, J. P., and Jurado, M. J.: Evidence for
Planet. Sc. Lett., 160, 667–679, https://doi.org/10.1016/S0012- the multi-stage formation of the south-western Valencia Trough,
821X(98)00118-6, 1998. Mar. Petrol. Geol., 12, 101–109, https://doi.org/10.1016/0264-
Cella, F., Fedi, M., Florio, G., Paoletti, V., and Rapolla, A.: 8172(95)90390-6, 1995.
A review of the gravity and magnetic studies in the Tyrrhe- Finetti, I. R., Boccaletti, M., Bonini, M., Ben, A., Pipan, M., Priz-
nian Basin and its volcanic districts, Ann. Geophys., 51, zon, A., and Sani, F.: Lithospheric Tectono-Stratigraphic Setting
https://doi.org/10.4401/ag-3035, 2008. of the Ligurian Sea–Northern Apennines–Adriatic Foreland from
Chamot-Rooke, N., Jestin, F., and Gaulier, J.-M.: Constraints Integrated CROP Seismic Data, in: Deep Seismic Exploration of
on Moho Depth and Crustal Thickness in the Liguro- the Central Mediterranean and Italy, CROP PROJECT, 119–158,
Provencial Basin from a 3d Gravity Inversion?: Geody- Elsevier, Trieste, Italy, 2005.
namic Implications, Rev. Inst. FRANCAIS Pet., 52, 557–583, Fujie, G., Kasahara, J., Murase, K., Mochizuki, K., and Kaneda,
https://doi.org/10.2516/ogst:1997060, 1997. Y.: Interactive analysis tools for the wide-angle seismic data for
Christensen, N. I. and Mooney, W. D.: Seismic velocity crustal structure study (Technical Report), Explor. Geophys., 39,
structure and composition of the continental crust: A 26–33, https://doi.org/10.1071/EG08006, 2008.
global view, J. Geophys. Res.-Sol. Ea., 100, 9761–9788, Gailler, A., Klingelhoefer, F., Olivet, J.-L., and Aslanian, D.:
https://doi.org/10.1029/95JB00259, 1995. Crustal structure of a young margin pair: New results
Christeson, G. L., Goff, J. A., and Reece, R. S.: Syn- across the Liguro–Provencal Basin from wide-angle seis-
thesis of Oceanic Crustal Structure From Two- mic tomography, Earth Planet. Sc. Lett., 286, 333–345,
Dimensional Seismic Profiles, Rev. Geophys., 57, 504–529, https://doi.org/10.1016/j.epsl.2009.07.001, 2009.
https://doi.org/10.1029/2019RG000641, 2019.
www.solid-earth.net/11/873/2020/ Solid Earth, 11, 873–887, 2020You can also read