Limnological response from high altitude wetlands to the water supply in the Andean Altiplano - Nature
←
→
Page content transcription
If your browser does not render page correctly, please read the page content below
www.nature.com/scientificreports
OPEN Limnological response
from high‑altitude wetlands
to the water supply in the Andean
Altiplano
Ignacio García‑Sanz1,2, Inger Heine‑Fuster3, José A. Luque1,2, Héctor Pizarro4,
Rodrigo Castillo5, Matías Pailahual5, Manuel Prieto6, Pablo Pérez‑Portilla1,2 &
Adriana Aránguiz‑Acuña7,8*
The Andean Altiplano-Puna is located at an elevation of approximately 4000 m.a.s.l. and is delineated
by the Western and the Eastern Andes Cordillera. The high-altitude wetlands (HAWs) in the Central
Andes are unique ecosystems located in the Altiplano that provide many ecosystem services. The
objective of this study was to characterize the spatial heterogeneity of the environmental conditions
associated with varying hydrology of the HAW, Salar de Tara, in the Andean Altiplano. Sediment
samples of up to 20 cm in depth were obtained from various salt flat sub-environments. The samples
were analyzed using proxies for mineralogical and chemical composition, thermal analysis, and
magnetic susceptibility. Diatom and ostracod communities were also identified and analyzed. The
results reflected changes in the geochemistry, carbon content, mineralogy, and magnetic properties
of the sediments that can be explained by variations in the sources of water input to the Salar de
Tara. The sub-environments depend on the supply of water via the groundwater recharge of springs
adjacent to the streamflow from the Zapaleri River, which promotes greater diversity and richness of
genera. Our results suggest that water extraction at industrial levels greatly impacts the persistence of
hydrologically connected HAWs, which concentrate a worldwide interest in brine mining.
The Andean Altiplano-Puna is a highland surface located at an elevation of approximately 4000 m.a.s.l., between
15° and 28°S, and is delineated on either side by the Western and Eastern Andes C ordillera1. In contrast to the
extreme aridity of the Atacama Desert lowlands, in the Altiplano area, wetter conditions with concentrated
precipitation occur during the austral summer (December to March) due to the South American monsoon2.
During the rest of the year, precipitation is uncommon. The seasonal moisture source of the Altiplano-Puna
plateau is explained by the displacement of the Inter-Tropical Convergence Zone (ITCZ) to the south3 and by
a low-pressure continental zone formed over the Gran Chaco region in Argentina during the summer months.
This phenomenon forces easterly winds in the Amazon to be redirected to the south, transporting significant
humidity to the sub-tropics4. The arrival of moist winds contributes to the rainfall recharge of lakes, aquifers, and
high-altitude azonal wetlands and salt flats5. Additionally, in the Altiplano zone, strong interannual variability is
associated with the El Niño Southern Oscillation (ENSO) phenomenon, resulting in fluctuations between warm
and dry phases in El Niño years, and cold and wet phases in La Niña years3,6.
The high-altitude wetlands (HAWs) in the Central Andes are unique ecosystems that correspond to areas
of land that are fully or partially covered with shallow water permanently or during certain periods of the year.
These wetlands include peatland (locally known as bofedales), wet meadows (locally known as vegas), and salt
1
Departamento de Ciencias Geológicas, Universidad Católica del Norte, Av. Angamos 0610, Antofagasta,
Chile. 2Centro de Investigación Tecnológica del Agua en el Desierto (CEITSAZA), Universidad Católica del
Norte, Av. Angamos 0610, Antofagasta, Chile. 3Departamento de Ciencias Ecológicas, Universidad de Chile,
Las Palmeras 3425, Santiago, Chile. 4Departamento de Geología, Universidad de Chile, Casilla 13518 Correo 21,
Santiago, Chile. 5Departamento de Química, Universidad Católica del Norte, Av. Angamos 0610, Antofagasta,
Chile. 6Departamento de Ciencias Históricas y Geográficas, Universidad de Tarapacá, Av. 18 de Septiembre 2222,
Arica, Chile. 7Departamento de Biología, Facultad de Ciencias, Universidad de Tarapacá, Av. 18 de Septiembre
2222, Arica, Chile. 8ANID Millennium Science Initiative Program Nucleo Milenio UPWELL, Av. 18 de Septiembre
2222, Casilla 6‑D, 1000000 Arica, Chile. *email: aaranguiza@academicos.uta.cl
Scientific Reports | (2021) 11:7681 | https://doi.org/10.1038/s41598-021-87162-6 1
Vol.:(0123456789)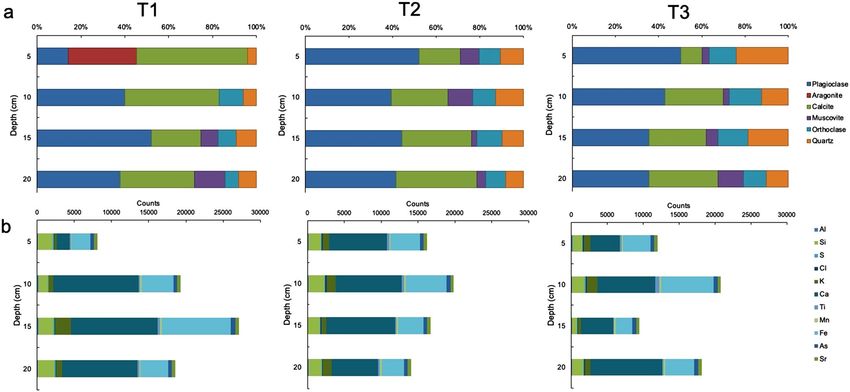
www.nature.com/scientificreports/
flats. The HAWs are hotspots of biodiversity, have a high degree of endemism7,8, control the water cycle9, and
are an integral component of the global climate system10,11. Additionally, they have important cultural value for
local agropastoralist indigenous communities12. Although the HAWs play an essential role in the lives of the
inhabitants and ecological sustainability, numerous climatic and anthropogenic factors threaten these ecosys-
tems. First, the salt flats are located in an area that is extremely vulnerable to climate c hange13. Observations and
projected scenarios for the Andes suggest alterations in precipitation patterns and evaporation rates that will
affect the restricted water availability for these e cosystems14,15. Second, the extractive industries located in the
region use surface water and groundwater for mining activities, development, and urban consumption. Histori-
cally, copper mining has resulted in the over-extraction of water from the highlands16 and, since the early 1980s,
lithium mining has resulted in the over-extraction of brines which has depleted the aquifers and threatened local
biodiversity17. The area of HAW is located within the “Lithium Triangle,” a region of the Andes (including parts
of Argentina, Bolivia, and Chile) that contains greater than half of the world’s lithium reserves. This situation is
exacerbated by a water management system based on private rights and m arkets18 and the current lithium boom.
Due to various temporal scales that alternate between aridity and humidity, the Altiplano-Puna water bodies,
lakes, salt flats, wet meadows, and peatlands located in the highlands of South America are informative archives
of the evolution of the socio-environmental and climatic conditions in the region and their impacts on the
biota19,20. On a millennial scale, wetter to drier periods have been identified from lake sediments using a multi-
proxy approach that included the analysis of isotopic and magnetic properties and the study of biological proxies
such as fossil plant cover and diatom assemblages, as recorded from the Salar de Uyuni s ediments21,22 and Lake
Titicaca23,24. For shorter timescales, decadal phenomena such as the ENSO have been identified through sedi-
mentary records25, as have recent anthropic disturbances including the intensive mining activities in the Atacama
Desert on lacustrine sediments and the biotic communities of the Inca Coya Lake26,27 and the Ascotán salt flat28.
The objective of this study was to characterize the spatial heterogeneity of the environmental conditions
associated with the varying hydrology of the HAW, Salar de Tara, in the Andean Altiplano. Water and sediment
records were analyzed using several approaches, such as geochemical, thermal, and mineralogical analyses.
Moreover, magnetic properties were utilized to identify the content and dynamics of the sediment transport and
biological proxies (communities of diatoms and ostracods), and to examine the impact of the spatial heteroge-
neity on several ecological descriptors. We studied the Salar de Tara as a model (Fig. 1), which is located in a
territory claimed by the Atacameño (Likan antai) indigenous community of Toconao, a protected area of Chile
and a Wetland of International Importance (as determined by the Ramsar Convention). Despite this conservation
status, the Chilean State has granted mining rights for the exploitation of lithium and other mineral resources,
thus, threatening the future of these ecosystems and the indigenous communities that claim their ancestral rights.
Our results highlight the inconsistency of the physical, chemical, and biological environments of HAWs in
regions with variable hydrology, which may be associated with the fluctuating humidity in the Altiplano sys-
tem. Furthermore, the results of this study emphasize the relevance of these factors in the formation of aquatic
communities.
Results
Water parameters and sediment sampling. Three sampling points were selected to capture the het-
erogeneity of the landscape: an upwelling spring (T1), a salty lagoon (T2), and a playa lake (T3) (Fig. 1). The
results of the physicochemical analysis of water are presented in Table 1. The alkalinity was similar at all three
sampling points, and higher pH levels were observed at T3. The electric conductivity was lower at T1, which was
closest to an upwelling zone. The water temperature was approximately 8 °C at T1 and T2, which was attributed
to the discharge of shallow groundwater. The higher temperature observed at T3 (18 °C) was likely associated
with the atmospheric temperature because this sampling point consisted of a shallow playa lake (< 15 cm depth,
approximately).
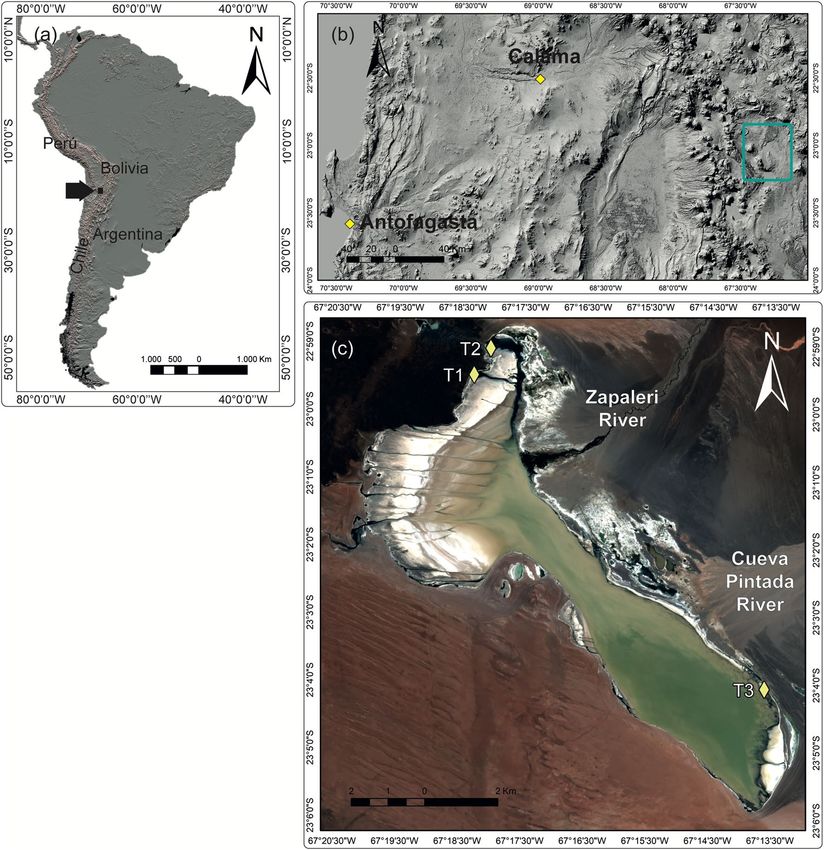
Mineralogical and elemental composition of the sediments. The mineral phases identified from
the sampling points showed differences in the current sediment composition between the sites, and changes
were observed in the percentage of minerals from the oldest to the most recent deposits (Fig. 2a). For T1, the
samples obtained from the upper layer had the most dissimilar composition among the samples, with a greater
proportion of calcite (50.56%) and aragonite (31.16%) and lower proportions of plagioclases and quartz. The
sediment obtained from a depth of 5 to 10 cm was dominated by carbonates of calcite and tectosilicates of albite,
with a minor presence of orthoclase. The samples obtained between depths of 10 and 20 cm showed a similar
composition, with a dominance of plagioclases-type andesine and Mg-rich calcite, which together comprised
greater than 70% of the composition. The samples obtained from the T2 sampling point showed a more homo-
geneous composition through the depth layers, with a greater proportion of plagioclases and calcite (which
jointly represented ~ 65–80%) and a lower proportion of muscovite, orthoclase, and quartz. In the T2C sample,
obtained between a depth of 10 and 15 cm, andesine was replaced by albite (44.26%). For T3, the dominance of
plagioclases decreased while the percentage of calcite increased with soil depth. Lower and variable concentra-
tions of quartz and orthoclase, and increasing concentrations of muscovite were measured and, combined, did
not exceed 40% throughout the record.
In summary, the samples revealed a predominance of carbonates and tectosilicates, except for the upper layer
of sediment (0–10 cm) at the T1 sampling point, and all the samples contained a minimal amount of phyllosili-
cates. The samples collected from T1 were dominated by aragonite and calcite (> 80%), primarily in the upper
sediments. This finding is possibly associated with recent authigenic processes. Conversely, the samples collected
from T2 and T3 showed a greater proportion of tectosilicates at all depth layers, which is likely associated with
detrital accumulation.
Scientific Reports | (2021) 11:7681 | https://doi.org/10.1038/s41598-021-87162-6 2
Vol:.(1234567890)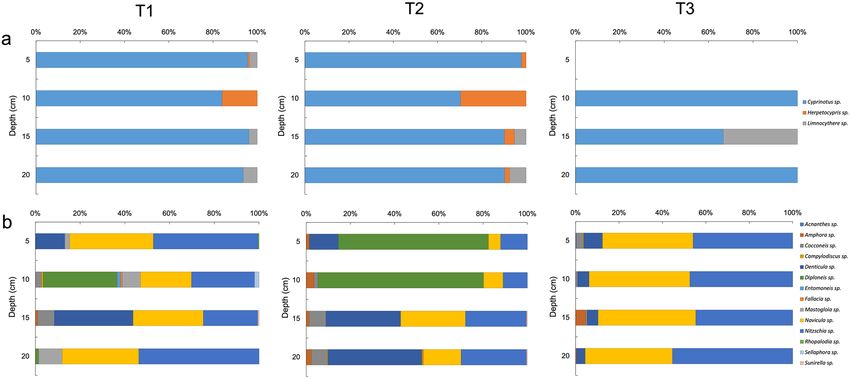
www.nature.com/scientificreports/
Figure 1. Salar de Tara. Location of Salar de Tara in Andean Altiplano-Puna, and sampling points distributed
in the basin (a) ASTER Global Digital Elevation Model (GDEM) V.3 from 2006 was retrieved on 2020/06/16
from https://lpdaac.usgs.gov, maintained by the NASA EOSDIS Land Processes Distributed Active Archive
Center (LP DAAC) at the USGS Earth Resources Observation and Science (EROS) Center . https://doi.org/
10.5067/ASTER/AST14DEM.003; (b) Sentinel-2A, European Space Agency (ESA) image courtesy of the U.S.
Geological Survey. https://doi.org/10.5066/F76W992G; (c) Shuttle Radar Topography Mission Products, Jet
Propulsion Laboratory, NASA (Date: 2000–02-11T00:00:00.000Z), http://www.jpl.nasa.gov/srtm/).
Sampling Points Conductivity (µS/cm) pH Temperature (°C)
T1 1768 8.40 10.4
T2 3455 8.13 17.1
T3 3747 8.93 18.7
Table 1. Water parameters obtained in situ from sampling points in Salar de Tara.
The elemental composition was consistent with the mineralogical profile (Fig. 2b and Supplementary Table).
For T1, the allochthonous proportion increased from the upper to the bottom layer, indicating increased Al, Si,
and Ca. This trend was associated with the trend of increasing plagioclases with depth. The presence of ortho-
clase provided K. Additionally, Fe was likely detected from ferric oxides, indicating a high correlation with the
occurrence of plagioclases. Therefore, the detrital origin of the sediment triggered an increase in Al, Si, Ca, K,
Scientific Reports | (2021) 11:7681 | https://doi.org/10.1038/s41598-021-87162-6 3
Vol.:(0123456789)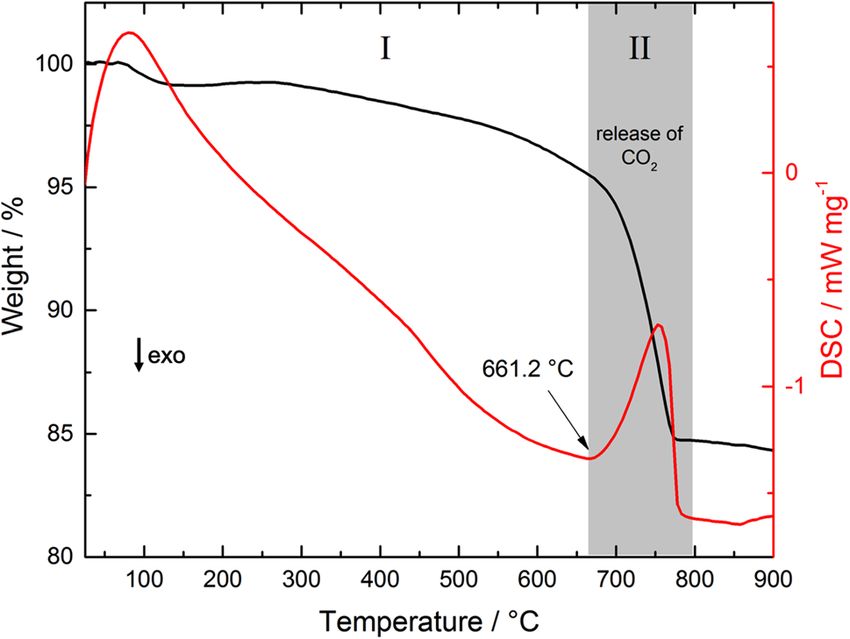
www.nature.com/scientificreports/
Figure 2. Mineralogy and Geochemistry of sediments. (a) Percentual composition of minerals and (b)
Elemental composition (measured in counts) identified in sampling points in Salar de Tara T1, T2 and T3,
through 20 cm depth records.
Figure 3. TG-DSC. TG-DSC curves of sample T1C, indicating the onset temperature of the endothermic event
corresponding to the release of CO2. Similar thermograms are observed for the remaining samples.
and Fe. In contrast, the authigenic minerals (i.e., calcite and aragonite) were associated with the upper layer of
the profile, and they resulted in low values in the detected counts during the analysis. Moreover, relatively high
values were associated with tectosilicates.
For T2 and T3, the same geochemical elements were also detected (Al, Si, Ca, K, and Fe), although in more
homogeneous proportions. Samples obtained from T2 showed the most homogeneous profile, and no significant
changes were observed with depth. This result indicates that allochthonous minerals (plagioclase, orthoclase,
and quartz) are predominant in the sediment. Samples collected from T3 revealed part of an authigenic layer
at 0 cm and 15 cm depth due to decreased values of Al, Si, Ca, K, and Fe. Overall, the elemental composition
was associated with the geochemical signature of the catchment area, as the watershed is comprised of quartz,
plagioclase, orthoclase, and ferric oxides. Several trace elements were also detected (e.g., S, Mn, and As). Hence,
the analysis did not reveal the internal facies of the Salar de Tara (i.e., sulfate and chloride) since the concentra-
tions of S and Cl were extremely low or absent. Finally, As was detected in all the samples collected and was
homogeneously distributed through the depth profiles, suggesting that this geochemical element constitutes a
natural background provided by the volcanic origin of the Chilean Altiplano.
The thermogravimetry and differential scanning calorimetry (TG-DSC) technique was used to obtain an esti-
mator of carbon content in the sediment samples (Fig. 3). The obtained thermogram was divided into two regions.
Scientific Reports | (2021) 11:7681 | https://doi.org/10.1038/s41598-021-87162-6 4
Vol:.(1234567890)www.nature.com/scientificreports/
Sampling point Depth (cm) Temperature onset (°C) Mass loss (%) CaCO3 (%)
5 653.9 22.90 52.09
10 683.9 13.28 30.21
T1
15 661.2 15.60 35.48
20 663.7 15.08 34.30
5 662.4 12.83 29.18
10 691.1 14.84 33.76
T2
15 681.0 15.08 34.30
20 680.2 18.29 41.60
5 664.8 9.48 21.56
10 691.4 15.06 34.26
T3
15 701.7 21.37 48.61
20 689.5 19.93 45.33
Table 2. Results obtained from TG-DSC analysis. Temperature onset is the temperature when the
decomposition of carbonates starts, and Mass loss correspond to the amount of released C
O 2.
In the first region, ranging from room temperature to 661.2 °C, the samples experienced a constant mass loss of
approximately 6%, which was attributed to the intrinsic humidity of the samples and the dehydration of silicate
hydrate minerals. In the second region, a substantial change in the slope of the TG curve began at 661.2 °C (onset
temperature). This change was accompanied by an endothermic effect in the DSC curve, which indicated the
decomposition of the carbonates in the sample into CO2 and the respective oxides. A similar result was observed
for the remaining samples. Assuming that calcium carbonate was the sole source of carbonate, the amount was
estimated to be 35.48%. The results obtained for all samples are summarized in Table 2. The samples obtained
from the T1 sampling site demonstrated the highest carbonate content in the upper layer sediments, which also
corresponded to the highest carbonate content among all the samples analyzed. The samples collected at T2 and
T3 revealed increasing carbonate content through the depth profiles, with more homogeneous values for T2.
Analysis of sediment magnetic properties. Figure 4 illustrates the variations of bulk magnetic suscep-
tibility (k) and frequency-dependent magnetic susceptibility (kfd %) with respect to the Fe, Ti, and S content
in the stratigraphic records of the various study sites. The k values varied from 4.76 × 10⁻³ (SI) in the sediment
layers of T3 to 1.53 × 10⁻⁵ (SI) in the sediment layers of T1, with an average value of ca. 1.30 × 10⁻³ (SI). The high-
est k values were measured in the samples collected from T3, with an average value of 3.56 × 10⁻³ (SI) whereas
the lowest k values were detected in the samples obtained from T1 and T2 (with average values of 1.57 × 10⁻⁴
and 1.91 × 10⁻⁴, respectively) (Fig. 4). Moreover, at these sites, k values of two orders of magnitude lower were
detected in several samples. For all sites, the k values tended to be higher in the middle portion of the depth
profile except for T1 which demonstrated a high k value at the bottom.
The kfd % parameter was used to qualitatively estimate the presence and concentration of small ferromagnetic
particles with magnetic sizes near the superparamagnetic/single-domain (SP/SD) limit29,30. The kfd % values
varied from 9.0% in the sediment layers at T1 to 2.9% in the sediment layers at T3, with an average value of 5.3%.
In this case, the highest kfd % values were observed in samples obtained from T1 and T2 (with average values of
7.3% and 5.4%, respectively) whereas the lowest kfd % values were detected in samples collected from T3, with
an average value of 3.2%. Based on these results, we propose that the number of extremely small ferromagnetic
particles was only significant in layers from sites T1 and T2, which may reflect the presence of authigenic pro-
cesses over magnetic minerals30–32.
The k values were primarily influenced by the concentration of ferromagnetic minerals. The Fe and Ti curves
were comparatively similar for all sites and these minerals were present in relatively high concentrations, sug-
gesting that the primary magnetic phase in the sediments may be (titano)magnetite and/or (titano)maghemite,
which coincides with the ferromagnetic minerals recorded in surrounding volcanic rocks28,32. No significant
variations were observed in the composition throughout the sections. Additionally, for T3, the observed similari-
ties between the Fe, Ti, and S curves may indicate the presence of iron sulfides in this sector. For T1, the Fe and
Ti curves were similar to the kfd % curves, which indicates that in this sector, the magnetic signal is primarily
influenced by variations in the magnetic particles of authigenic origin.
Thus, the magnetic signal detected at T1 was influenced by a high concentration of ferromagnetic minerals of
authigenic origin, while the magnetic signal observed at T3 was mainly influenced by ferromagnetic minerals of
detrital origin. A mixture of both types of particles (but with a greater predominance of particles of authigenic
origin) influenced the magnetic signal at T2. Based on the results, it was also inferred that the highest concentra-
tion of ferromagnetic minerals occurred in the middle portions of each stratigraphic section.
Biological proxies and statistical analyses. A single order of the class Ostracoda was identified,
namely the Podocopida, 97% of which was represented by members of the Ciprididae family. The dominant
genus was Cyprinotus (90%) and the genus Herpetocypris represented only 7%. The Lymnocytheridae family
was represented by a single genus, Limnocythere (3%). The three genera that were identified showed a similar
Scientific Reports | (2021) 11:7681 | https://doi.org/10.1038/s41598-021-87162-6 5
Vol.:(0123456789)www.nature.com/scientificreports/
Figure 4. Magnetics parameters. Bulk magnetic susceptibility values measured at low frequency (k),
Frequency-dependent magnetic susceptibility (kfd%) values and S, Ti and Fe concentrations (ppm) versus the
depth of the different study sites. From top to bottom: sampling site T1, T2 and T3.
distribution in the T1 and T2 cores but not in the T3 core, wherein the abundance of individuals was too low to
be representative of the ostracods in the area.
Only benthic taxa of the class Bacillariophyceae (diatoms) were recorded. The distribution and representation
of the genera identified at the three sampling points are presented in Table 3 and Fig. 5. The genera richness and
diversity index calculated based on the relative abundance of the diatom and ostracod genera varied within and
between the sites and demonstrated similar patterns. Sampling point T1 showed greater richness and diversity
in the 5–10 cm layer. Below that layer, the richness and diversity decreased with depth, was the poorest and least
diverse in the bottom layer (15–20 cm). Conversely, T2 showed a regular pattern of increasing richness and
diversity with depth. The lowest and most homogeneous values of genus richness were observed throughout all
Scientific Reports | (2021) 11:7681 | https://doi.org/10.1038/s41598-021-87162-6 6
Vol:.(1234567890)www.nature.com/scientificreports/
T1 T2 T3
Genus A B C D A B C D A B C D
Cyprinotus
945 931 910 714 875 567 847 510 0 16 4 14
sp.
Herpetocy-
Ostracoda 7 175 0 0 18 238 42 12 0 0 0 0
pris sp.
Limno-
35 0 35 48 0 0 49 42 0 0 2 0
cythere sp.
Acnanthes
0 0 0 0 0 0 0 0 2 0 0 0
sp.
Amphora
0 0 6 0 7 16 8 14 0 0 28 2
sp.
Cocconeis
0 14 43 0 0 8 47 42 16 4 4 0
sp.
Campylo-
0 4 0 0 0 0 0 2 2 0 0 0
discus sp.
Denticula
72 0 202 0 62 0 208 250 46 22 30 16
sp.
Diploneis
0 171 0 8 322 342 0 2 0 0 0 0
sp.
Entomoneis
0 8 0 0 0 0 0 0 0 0 0 0
sp.
Fallacia sp. 0 4 0 0 0 0 0 4 0 0 0 0
Diatoms
Mastogloia
12 42 0 56 0 0 0 0 0 0 0 0
sp.
Navicula
204 118 180 182 26 40 180 100 222 193 268 162
sp.
Nitzschia
256 146 140 286 57 50 170 175 244 197 266 223
sp.
Rhopalodia
2 0 0 0 0 0 0 0 0 0 0 0
sp.
Sellaphora
0 10 0 0 0 0 0 0 0 0 0 0
sp.
Sunirella
0 0 3 0 0 0 2 2 0 0 0 0
sp.
Simpson
0.571 0.634 0.599 0.624 0.530 0.686 0.657 0.725 0.607 0.588 0.602 0.561
1-D
Shannon H 1.167 1.426 1.27 1.227 1.058 1.353 1.44 1.585 1.081 1.035 1.099 0.967
Table 3. Abundance of Ostracoda and diatoms identified, and community indices calculated from Salar de
Tara samples.
Figure 5. Relative abundance of diatoms and ostracods. (a) Percentual abundance of ostracods genera and (b)
diatoms genera identified in sampling points in Salar de Tara T1, T2 and T3, through 20 cm depth records.
Scientific Reports | (2021) 11:7681 | https://doi.org/10.1038/s41598-021-87162-6 7
Vol.:(0123456789)www.nature.com/scientificreports/
Figure 6. Cluster of community structure. Cluster analysis showing the similitude in Euclidean distance
between sampling points from Salar de Tara and between depth layers.
depths at T3. A similar result was obtained for diversity, except for the surface layer, in which the diversity values
were slightly higher than that observed at T2.
Two clusters were obtained by comparison using the Shannon–Wiener diversity index, for each stratigraphic
level (mode R) from a sampling point (mode Q) (Fig. 6). T1 and T2 showed similar levels of diversity, with mean
values of 1.27 and 1.36, respectively. These two sites were separated from T3 which had a lower mean diversity
value (1.04). This ordination mode had a correlation coefficient of 0.896. The clusters obtained from stratification
levels (mode R) grouped more tightly in layers B (5–10 cm) and C (10–15 cm), with an average diversity value
of 1.27. The greatest distance was identified between this group and the deepest level, D (15–20 cm). The upper
level (A layer) showed the most differentiation compared with the rest of the layers and revealed the lowest mean
diversity. The correlation coefficient in this mode was 0.73.
The results of a multivariate analysis of variance with permutations (PERMANOVA) showed no significant
interaction between space and depth, however, the community indices differed significantly among the sampling
points (F = 5.33; d.f. = 1; p = 0.017).
Discussion
The sediment proxies of past change recorded in the cores analyzed during this study demonstrated variability
over time concerning the input of water to the Salar de Tara in the Altiplano-Puna plateau of the Andes Cordil-
lera. These results are likely associated with changes in precipitation and hydrology.
Spatial and temporal heterogeneity was observed between and within the samples. Carbonates (aragonite-
calcite) and tectosilicates (plagioclases) were dominant at the T1 sampling site, primarily in the upper layer of
sediments (> 80%). Moreover, a greater proportion of carbonates was observed in the upper-layer sediment
samples and may be associated with an authigenic origin. This idea is reinforced by the observed high kfd%
values, suggesting the presence of small magnetic Fe-oxides of authigenic o rigin31,32. At the T3 sampling site,
carbonate concentrations showed a decreasing trend and an inverse relationship with tectosilicates, which may be
associated with increased detrital input. The observed agreement between the highest k and lowest kfd % values
at T3 indicated a high Fe-Ti oxide content of detrital origin32. Finally, intermediate carbonate and tectosilicate
concentrations were observed at the T2 sampling site, which supported the observed intermediate kfd percentage
(> 3%) and low k values, demonstrating lower concentrations of carbonates and Fe-oxides of authigenic origin
than at T1. Thus, the sediments obtained from T1 were primarily composed of minerals of authigenic origin,
while at T3, the sediments are mostly composed of allochthonous minerals. The sediments collected from T2
contained a mixture of both types of particles, however, the particles of detrital origin were dominant.
The Salar de Tara is the only salt flat in the region where permanent surface water flows converge. The main
source of surface water for the Salar de Tara is the inflow from the Zapaleri River and the secondary Cueva Pin-
tada River (Fig. 1)33. Therefore, during wet periods, the rivers supply low-salinity water33 and sediment to the
shoreline of the salt flat, triggering the subsequent development of alluvial fans. Two alluvial fans are located along
the eastern shoreline of the salt flat and are associated with both rivers. The presence of allochthonous minerals
in samples from T2 and T3 may be associated with climatic fluctuations due to the hydrological behavior of the
Zapaleri and the Cueva Pintada Rivers, respectively. The results obtained for T3 strongly support this theory, as
the mineral content of detrital origin in the samples collected from this site was greater, and the concentration
Scientific Reports | (2021) 11:7681 | https://doi.org/10.1038/s41598-021-87162-6 8
Vol:.(1234567890)www.nature.com/scientificreports/
of authigenic minerals was less than in the samples obtained from T1 and T2. This is in accord with the larger
alluvial fan generated by the Cueva Pintada river.
Arsenic was detected in all the samples collected and showed a homogeneous distribution throughout the
profiles, suggesting that this geochemical element constitutes a natural background provided by the volcanic
origin of the Chilean Altiplano, as has been stated for other HAWs of the Altiplano-Puna34.
Variations in mineralogical analysis, thermal analysis, and an analysis of the magnetic properties of the
sediments were consistent with the observed distribution of biota. The composition of ostracod and diatom
genera showed variations at numerous levels for the T1 and T2 sampling points which may be explained by
environmental factors such as the water period and s easonality35–37. An ostracod of the genus Cyprinotus was
dominant and has been associated with regular changes in the water table, such as cyclical floods of minor mag-
nitude. Nevertheless, an increase in diversity at the subsurface level coincided with the presence of ostracods of
the genus Herpetocypris which are most associated with more stable water levels over t ime38,39. Ostracods of the
genus Limnocythere were scarce. This observation may be due to the fact that members of this genus are more
successful in deeper p onds40. These sedimentary layers would be associated with periods under the influence of
the rainfall of the austral summer. In the subsurface layer (5–10 cm depth), samples from T1 showed the highest
genera richness and biodiversity. Conversely, samples from T3, a characteristic shallow playa lake, revealed the
lowest richness and diversity.
Diatom analysis showed that Achnanthes, a genus of low-profile diatoms, was exclusively observed in the
upper layer of sediment at T3. This may be due to the fact that this site was located in an evaporitic area with
a playa lake, a very shallow water column, and absent vegetation. Previous studies on Altiplano diatoms have
demonstrated associations between periphytic diatoms and low water levels, while tychoplanktonic, facultative
planktonic, and planktonic diatoms have been associated with higher water l evels41,42. A lack of dating controls
prevents us from drawing conclusions about the observed similarities in temporal variations among the cores,
however, we can conclude that the variability in the ostracod and diatom genera was greater among the sites than
within each site. This reflects the heterogeneous landscape of the study region and suggests that multiple cores
from a variety of locations may be required to accurately assess long-term environmental change.
The salt flat exhibited sub-environments where the water supply is primarily dependent on the climate, which
controls the groundwater flow and the streamflow. The salinity of the various areas of the HAWs is influenced by
direct precipitation, runoff, riverine input, and g roundwater43. The outlier condition of the T1 sampling point
is most likely associated with the impact of the water supply from complementary sources (springs related to
groundwater recharge and the streamflow from the Zapaleri River), which supply the characteristic water and
sediment that influence the high diversity and genera richness observed at this site. Our results highlight the
relevance of the water inflows, organic matter, and salts for the maintenance and structure of the ecological
communities and ecosystems in the HAWs.
The Andean Altiplano-Puna constitutes a recharge zone for the regional aquifer in the study area44,45. From
this highland surface, located at an elevation of approximately 4000 m.a.s.l., the groundwater flows towards the
west to the Salar de Atacama, at approximately 2500 m.a.s.l. When the groundwater from the Altiplano-Puna
reaches the Salar de Atacama, a mixing zone is generated between the lithium-rich brine and the fresh water.
This triggers the formation of lacustrine systems along the eastern border of the Salar de Atacama46–48. Paleoen-
vironmental studies have reported fluctuations in the input of water recharge in the Salar de Atacama during
the Pleistocene49. Hence, the identification of this hydrogeological variability is also crucial for understanding
the human settlement along the Salar de Atacama. Our results concerning the limnological characteristics of
the Salar de Tara may be associated with environmental processes related to the recharge of water in the Andean
Altiplano-Puna. Thus, paleolimnological records may help to infer how the fluctuations of groundwater flux
influence the brine and the formation of other lacustrine systems of ecological interest.
Nevertheless, industrial interests regarding brine mining pose a risk for the Salar de Tara. Several lithium
mining projects are expected to be developed in Tara and the surrounding salt flats (e.g., Quisquiro, Pujsa, Aguas
Calientes, and Helada), and the lithium-rich brine of the Salar de Atacama is the primary objective of the mining
activity46,50,51. This situation threatens the stability and conservation of the hydrogeological characteristics and
ecological communities in the basin, and it also impacts the indigenous communities that claim territorial rights
in the area and that have already been affected by colonialism and industrial m ining52.
In the Los Flamencos National Reserve, which includes the Salar de Tara, only certain key areas are protected
under a weak institutional model, including lakes, salt flats, and the Tamarugo forest. Sonter et al.53 stated recently
that this is a consideration of worldwide conservation interest. While several protected areas prevent mineral
activities, greater than 14% of these areas contain mines within or near their boundaries, and the consequences
for biodiversity may extend a great distance from the core mining sites. Furthermore, the generation of renewable
energies may exacerbate other non-climatic changes that impact the conservation of biodiversity. For example,
the Salar de Tara and all the salt flats included in the lithium triangle are exposed to brine and freshwater extrac-
tion at industrial levels. Conservation efforts focused on landscapes, biodiversity, and indigenous practices may
be applied with greater success if the authorities include integral regional considerations of hydrogeological and
ecological connectivity between the protected patches that constitute fragmented land(water)scapes54 and local
ecological knowledge from the indigenous communities and their territorial d emands55.
Methods
Study area. The Salar de Tara (22° 01′ 59″ S, 67° 16′ 30″ W, 4,300 m.a.s.l.) is located in the highlands of the
Atacama Desert, known as the Altiplano-Puna plateau (Antofagasta Region, northern Chile). The total extent
of this basin is 1,710 km2 and it is hydrogeologically shared by Bolivia, Argentina, and Chile, with an area of
1,209 km2, and a depositional area of 32 km256. The topography of the sector is of an endorheic basin, with rock
Scientific Reports | (2021) 11:7681 | https://doi.org/10.1038/s41598-021-87162-6 9
Vol.:(0123456789)www.nature.com/scientificreports/
outcrops and a regular cone shape. The volcanic system is comprised of lava flows, tuff, and basaltic to andesitic
breccia of the Pliocene–Pleistocene age57. Within the study area, groundwater flows through the volcanic system
from northwest to southeast and is finally intercepted by the topographical profile. The drainage network that
runs through the east of the basin includes the Zapaleri River and the Cueva Pintada River, while the west drains
into the Chico and Huailitas Rivers. Therefore, the Salar de Tara receives a relevant contribution of surface water
from the Zapaleri River which has an exceptional flow in the arid system of the Andes in northern Chile.
The Salar de Tara contains the largest number of species of birds and mammals observed in the wetlands of
the Antofagasta Region, which makes it a focus of great biological conservation interest58. Among the species of
avifauna, there are three species of high Andean flamingos, and the endemic species Liolaemus molinai represents
the reptiles. The biodiversity of mammals, reptiles, and birds is supported by microbiota, diatoms, and benthic
microinvertebrates in the lacustrine s ediments59.
Climatic features affect the density and diversity of vegetation, and plant cover decreases as the altitude and
latitude increase58. The salt flat is located in an altitudinal vegetation belt dominated by perennial herbs and sev-
eral cushion p lants58. Additionally, the azonal plant communities develop what is locally known as vega salina,
the Andean high-altitude wetland type, composed mainly of Baccharis acaulis, Distichlis humilis, Deyeuxia
velutina var. atacamensis, D. crispa, Mulinu, crasifolium, Oxychloe, Carex marítima, Triglochin concinna, Puc-
cinellia frigida, Stipa frigida, Fabiana bryoides, Parastrephia quadrangularis, and Adesmia sp.57,59. Many of these
species provide year-round fodder to domesticated and wild South American camels (llamas [Lama glama], and
vicuñas [Vicugna vicugna]).
Human occupation of the area began in the Early Archean period (ca. 9000 to 6000 BC)60. Currently, local
Atacameño communities use the area as grazing fields and consider it a sacred landscape. This is why the Ata-
cameño community of Toconao claims the area. Furthermore, due to its socioecological relevance, the Salar de
Tara is part of the National System of Wild Protected Areas (more specifically, part of the Los Flamencos National
Reserve) and is protected under the RAMSAR convention on wetlands.
The fieldwork was conducted in April 2018, after the seasonal summer rains. Three sampling points were
selected: an upwelling spring (T1), a salty lagoon (T2), and a playa lake (T3) (Fig. 1). These sites were selected,
based on a preliminary analysis of aerial images, to include the heterogeneity of the waterscapes of the highland
salt flats and in response to the interests expressed by the Atacameño community of Toconao.
Water parameters and sediment sampling. At each sampling point, the physicochemical parameters
of the surface water (temperature, conductivity, and pH) were measured in situ with a multi-parameter meter
(Hanna HI98194).
The sediment samples were obtained using a Lenz bottom sampler with a grasping area of 225 cm2, which
allowed the total sample volume to be separated into 5 cm layers using dividing sheets. Samples from four layers
were obtained at each sampling point and were labeled as A (0–5 cm depth), B (5–10 cm depth), C (10–15 cm
depth), and D (15–20 cm depth), resulting in a total of twelve sediment samples. The samples were deposited in
plastic bags, sealed, and refrigerated at 4 °C until laboratory analysis.
Mineralogical and elemental composition of the sediments. The mineralogical and elemental
analyses of the sediment samples were conducted in the Unidad de Equipamiento Científico MAINI at the
Universidad Católica del Norte, Chile (UCN), and the thermal analysis was conducted in the Chemistry Depart-
ment of UCN.
The first step in identifying the mineral phases of the samples was to pulverize sediment sub-samples in an
agate mortar to eliminate the roughness of the surface of the samples. Next, the samples were sieved on a 53 µm
sieve to homogenize the grain size. X-ray diffraction (XRD) analysis was conducted using a Bruker D8 Advance
with a Cu X-ray tube (λ = 1.5406 Å) which was operated at 40 kV. The phase identification and quantification
were performed using EVA (Bruker AXS. EVA, version 10; Bruker AXS, Karlsruhe, Germany, 2004) and TOPAS
(Bruker AXS. TOPAS, version 3; Bruker AXS, Karlsruhe, Germany, 2005) software, respectively.
X-ray micro fluorescence analysis was performed to determine the elemental composition of the samples.
Dry samples with a grain size of 53 microns were used and were mounted on double-sided carbon fiber tape
which was then attached to a slide. The aligned samples were then placed on the platform of the TORNADO
Micro-XRF M4 Spectrometer (Bruker nano GmbH) for analysis.
Thermal analysis of the sediments was performed using a simultaneous TG-DSC apparatus (Netzsch STA 448
Jupiter F3). The sediments were roughly powdered, and approximately 15 mg of each of the homogenous samples
was used in the analysis. The samples were loaded into alumina crucibles and heated from room temperature
to 900 °C at a heating rate of 10 °C min−1, under an N2 atmosphere with a flow rate of 50 mL min−1. Finally, the
samples were cooled to room temperature. Onset temperatures of energetics events were evaluated by taking
the first derivative of the DSC curve.
Analysis of sediment magnetic properties. A sediment fraction (ca. 2.00 g) was mounted into 8 cm3
standard size paleomagnetic cubes for volume magnetic susceptibility (k) measurements. The k was measured
in SI units using a Kappabridge MFK1-FA susceptibility bridge (AGICO Co.) under normal ambient conditions
(22–24 °C) and a 200 A/m field. Measurements were performed at (a) 976 Hz (kf1) and (b) 15.616 Hz (kf3). This
method allowed us to calculate the frequency-dependent magnetic susceptibility (kfd %)30, as follows:
(1)
kfd% = ( kf 1 − kf 3 /kf 1) × 100
Scientific Reports | (2021) 11:7681 | https://doi.org/10.1038/s41598-021-87162-6 10
Vol:.(1234567890)www.nature.com/scientificreports/
in which kfd % is widely used as a normalized parameter, and it is interpreted to reflect the content of the particles
close to the SP/SD boundary.
Biological proxies and statistical analyses. To remove the large material (such as branches and stones)
from the sample, 500 mL of each sediment sample was filtered through a 5 mm mesh. Next, the samples were
filtered through a 500 µm and 250 µm diameter mesh to separate invertebrate organisms of the class Ostracoda.
To identify the genera of the separated ostracods, 200 mL of clean sample was observed under a binocular
stereomicroscope, following the protocol described in the relevant literature61–64. A minimum of 300 shells of
individual ostracods per sample was obtained to ensure the validity of the statistical analyses and an accurate
representation of the fauna present65. Diatoms (Bacillariophyceae) were observed in pre-treated sediments by
digestion of the organic matter and carbonates with 30% H2O2 and 37% HCl66. Dilutions were conducted to
observe an estimated 400 organisms per sample. The samples were prepared for taxonomic analysis as indicated
in Díaz et al. (2016) and identified to genus level by observation under a microscope (Leica DM750) and Camera
Mod ICC 50 HD, following ad-hoc literature66,67.
Community indices, including the genera richness (S), exponential of Shannon entropy (Exp(H’)), Pielou (J),
and Shannon and Simpson Hill’s ratio index (HE and DE, respectively) were calculated by site and depth. The
sampling sites were classified by HCR cluster analysis (in Euclidean distance) to observe the similitude in both
Q mode (between samples) and R mode (between layers from samples), following the unweighted pair-group
average model (UPGMA). Cluster analyses were obtained using the free software P AST68.
A principal component analysis (PCA) was conducted to assess the relative importance of each measured
environmental variable on the community indices of species richness, exponential of Shannon entropy (Exp(H’)),
Pielou, Shannon, and Simpson Hill’s ratio index by site and depth. The PCA was conducted in the R environment
using the vegan package69.
To determine whether there was a spatial and temporal association in the variation of the biotic commu-
nity, a multivariate analysis of variance with permutations (PERMANOVA) was p erformed70. This analysis was
applied to the triangular Bray–Curtis similarity matrix and was considered an experimental design based on
the existence of different levels of one or more factors. This type of analysis performs a partition of the variance
components in relation to the factor(s) to be considered and calculates a pseudo-F-statistic70 considering 9,999
permutations. In the present study, we considered two factors: space (three sites) and time (four depth levels).
The PERMANOVA was conducted in the R environment using the vegan package69.
Received: 6 October 2020; Accepted: 24 March 2021
References
1. Tapia, J., Audry, S., Townley, B. & Duprey, J. L. Geochemical background, baseline and origin of contaminants from sediments in
the mining-impacted Altiplano and Eastern Cordillera of Oruro, Bolivia. Geochemistry 12, 3–20. https://doi.org/10.1144/1467-
7873/10-RA-049 (2012).
2. Sarricolea, E. P. & Romero, H. Variabilidad y cambios climáticos observados y esperados en el Altiplano del norte de Chile. Revista
de Geografía Norte Grande. 62, 169–183 (2015).
3. Garreaud, R., Vuille, M. & Clement, C. A. The climate of the Altiplano: observed current conditions and mechanisms of past
changes. Palaeogeogr. Palaeoclimatol. Palaeoecol. 194(1–3), 5–22. https://doi.org/10.1016/S0031-0182(03)00269-4 (2003).
4. Vuille, M. & Keiming, F. Interannual variability of summertime convective cloudiness and precipitation in the central andes
derived from ISCCP-B3 data. J. Clim. 17(17), 3334–3348. https://doi.org/10.1175/15200442(2004)017%3c3334:IVOSCC%3e2.0.
CO;2 (2004).
5. Cerveny, R. Present climates of South America. In Climates of the Southern Continents: Present, Past and Future (ed. Hobbs, J. E.)
107–135 (Wiley, Chichester, 1998).
6. Garreaud, R. & Aceituno, P. Interannual rainfall variability over the South American Altiplano. J. Clim. 14(12), 2779–2789. https://
doi.org/10.1175/1520-0442(2001)014%3c2779:IRVOTS%3e2.0.CO;2 (2001).
7. Coronel, J., Declerck, S. & Brendonck, L. High-altitude peatland temporary pools in Bolivia house a high cladoceran diversity.
Wetlands 27(4), 1166–1174. https://doi.org/10.1672/0277-5212(2007)27[1166:HPTPIB]2.0.CO;2 (2007).
8. Dorador, C., Vila, I., Witzel, K. P. & Imhoff, J. F. Bacterial and archaeal diversity in high altitude wetlands of the Chilean Altiplano.
Fundam. Appl. Limnol. 182(2), 135–159. https://doi.org/10.1127/1863-9135/2013/0393 (2013).
9. Garcia, E. & Otto, M. Caracterización ecohidrológica de humedales alto andinos usando imágenes de satélite multitemporales en
la cabecera de cuenca del río Santa, Ancash, Perú. Ecología Aplicada 14(2), 115–125 (2013).
10. Buytaert, W., Camacho, F. C. & Tobón, C. Potential impacts of climate change on the environmental services of humid tropical
alpine regions. Glob. Ecol. Biogeogr. 20(1), 19–33. https://doi.org/10.1111/j.1466-8238.2010.00585.x (2011).
11. Hribljan, J. A. et al. Carbon storage and long-term rate of accumulation in high-altitude Andean peatlands of Bolivia. Mires Peat
15(12), 1–14 (2015).
12. Yager, K. et al. Dimensiones socioecológicas del cambio del paisaje pastoral andino: puente entre el conocimiento ecológico
tradicional y el análisis de imágenes satelitales en Sajama Parque Nacional, Bolivia. Cambio ambiental regional 17, 27–37 (2019).
13. Urrutia, R. & Vuille, M. Climate change projections for the tropical Andes using a regional climate model: temperature and pre-
cipitation simulations for the end of the 21st century. J. Geophys. Res. 114, D02108. https://doi.org/10.1029/2008JD011021 (2009).
14. Buytaert, W. et al. Uncertainties in climate change projections and regional downscaling in the tropical Andes: implications for
water resources management. Hydrol. Earth. Syst. Sci. 14, 1247–1258. https://doi.org/10.5194/hess-14-1247-2010 (2010).
15. Rabatel, A. et al. Current state of glaciers in the tropical Andes: a multi-century perspective on glacier evolution and climate change.
Cryosphere 7, 81–102. https://doi.org/10.5194/tc-7-81-2013 (2013).
16. Prieto, G. et al. A mass sacrifice of children and camelids at the Huanchaquito-Las Llamas site, Moche Valley, Peru . PLoS ONE
14(3), e0211691. https://doi.org/10.1371/journal.pone.0211691 (2019).
17. Babidge, S., Kalazich, F., Prieto, M. & Yager, K. That’s the problem with that lake; it changes sides’: mapping extraction and ecologi-
cal exhaustion in the Atacama. J. Political Ecol. 26(1), 738–760. https://doi.org/10.2458/v26i1.23169 (2019).
18. Prieto, M., Fragkou, M. & Calderón, M. Water policy and management in Chile. In The Wiley Encyclopedia of Water: Science,
Technology, and Society (ed. Strickland, C.) 2589–2600 (Wiley, New York, 2020).
Scientific Reports | (2021) 11:7681 | https://doi.org/10.1038/s41598-021-87162-6 11
Vol.:(0123456789)www.nature.com/scientificreports/
19. Fritz, S. C., Baker, P. A., Tapia, P., Spanbauer, T. & Westover, K. Evolution of the Lake Titicaca basin and its diatom flora over the
last 370,000 years. Palaeogeogr. Palaeoclim. Palaeoecol. 317–318, 93–103 (2012).
20. Cohen, S. C. Scientific drilling and biological evolution in ancient lakes: lessons learned and recommendations for the future.
Hydrobiologia 682(1), 3–25. https://doi.org/10.1007/s10750-010-0546-7 (2012).
21. Tapia, P. M., Fritz, S. C., Baker, P. A., Seltzer, G. A. & Dunbar, R. B. A Late Quaternary diatom record of tropical climatic history
from Lake Titicaca (Peru and Bolivia). Palaeogeogr. Palaeoclimatol. Palaeoecol. 194, 1–3. https://doi.org/10.1016/S0031-0182(03)
00275-X (2003).
22. Vining, B. R., Steinman, B. A., Abbott, M. B. & Woods, A. Paleoclimatic and archaeological evidence from Lake Suches for high-
land Andean refugia during the arid middle-Holocene. The Holocene 29(2), 328–344. https://doi.org/10.1177/0959683618810405
(2019).
23. Fritz, S. C., Baker, P. A., Tapia, P. & Garland, J. Spatial and temporal variation in cores from Lake Titicaca, Bolivia/Peru during the
last 13,000 years. Quat. Int. 158(1), 23–29. https://doi.org/10.1016/j.quaint.2006.05.014 (2006).
24. Hernández, A. et al. Biogeochemical processes controlling oxygen and carbon isotopes of diatom silica in Late Glacial to Holocene
lacustrine rhythmites. Palaeogeogr. Palaeoclimatol. Palaeoecol. 299(3–4), 413–425. https://doi.org/10.1016/j.palaeo.2010.11.020
(2012).
25. Placzek, C. et al. Climate in the dry central Andes over Geologic, millennial, and interannual timescales. Ann. Mo. Bot. Gard.
96(3), 386–397. https://doi.org/10.3417/2008019 (2009).
26. Cerda, M. et al. A new 20th century lake sedimentary record from the Atacama Desert/Chile reveals persistent PDO (Pacific
Decadal Oscillation) impact. J. S. Am. Earth Sci. 95, 102302. https://doi.org/10.1016/j.jsames.2019.102302 (2019).
27. Aránguiz-Acuña, A. et al. Aquatic community structure as sentinel of recent environmental changes unraveled from lake sedimen-
tary records from the Atacama Desert, Chile . PLoS ONE 15(2), e0229453. https://doi.org/10.1371/journal.pone.0229453 (2020).
28. Flores-Varas, A. et al. Ascotán and Carcote salt flats as sensors of humidity fluctuations and anthropic impacts in the transition
zone of the Andean Altiplano. J. S. Am. Earth Sci. 105, 102934. https://doi.org/10.1016/j.jsames.2020.102934 (2021).
29. Maher, B. A. & Taylor, R. M. Formation of ultrafine-grained magnetite in soils. Nature 336, 368–370 (1988).
30. Dearing, J. A. et al. Frequency-dependent susceptibility measurements of environmental materials. Geophys. J. Int. 124, 228–240.
https://doi.org/10.1111/j.1365-246X.1996.tb06366.x (1996).
31. Evans, M. & Heller, F. Environmental magnetism: principles and applications of enviromagnetics. Int. Geophys. 86, 202 (2003).
32. Pizarro, H. et al. The origin of the magnetic record in Eocene-Miocene coarse-grained sediments deposited in hyper-arid/arid
conditions: examples from the Desert. Palaeogeogr. Palaeoclimatol. Palaeoecol. 516, 322–335. https://doi.org/10.1016/j.palaeo.
2018.12.009 (2019).
33. Risacher, F., Alonso, H. & Salazar, C. Geoquímica de Aguas en Cuencas cerradas: I, II y III Regiones-Chile. Volumen III Estudio
de Cuencas de la II Región. (Convenio de Cooperación DGA-UCN-IRD. S.I.T. Nº51, 1999).
34. Tapia, R. et al. Glacial differences of Southern Ocean Intermediate Waters in the Central South Pacific. Quat. Sci. Rev. 208, 105–117.
https://doi.org/10.1016/j.quascirev.2019.01.016 (2019).
35. Horne, D. J. Life-cycles of podocopid Ostracoda - a review (with particular reference to marine and brackish-water species). In
Applications of Ostracoda. Proceedings of the Eighth International Symposium on Ostracoda (ed. Maddocks, R.) 581–590 (University
of Houston, Texas, 1983).
36. Cohen, A. C. & Morin, J. G. Patterns of reproduction in ostracodes; a review. J. Crust. Biol. 10(2), 184–211. https://doi.org/10.
2307/1548480 (1990).
37. Mesquita-Joanes, F., Smith, A. J. & Viehberg, F. A. The ecology of ostracoda across levels of biological organization from individual
to ecosystem. J. Quat. Sci. 17, 15–35. https://doi.org/10.1016/B978-0-444-53636-5.00002-0 (2012).
38. McLay, C. L. The population biology of Cyprinotus carolinensis and Herpetocypris reptans (Crustacea, Ostracoda). Can. J. Zool.
56(5), 1170–1179. https://doi.org/10.1139/z78-161 (1978).
39. Hamouda, S. A., Sames, B., Mohammed, A. & Bensalah, M. First record of non-marine ostracods from the Paleogene “hamadian
deposits” of Méridja area, west of Bechar (southwestern Algeria). Annales de Paléontologie 104(1), 27–44. https://d oi.o
rg/1 0.1 016/j.
annpal.2017.12.001 (2018).
40. Bergue, C. T., Maranhao, M. D. S. A. S. & Fauht, G. Paleolimnological inferences based on Oligocene ostracods (Crustacea: Ostra-
coda) from Tremembé Formation. Southeast Brazil. An. Acad. Bras. Cienc. 87(3), 1531–1544. https://doi.org/10.1590/0001-37652
01520140366 (2015).
41. Sylvestre, F., Servant-Vildary, S. & Roux, M. Diatom-based ionic concentration and salinity models from the south Bolivian
Altiplano (15–23°S). J. Paleolimnol. 25, 279–295 (2001).
42. Nunnery, J. A., Fritz, S. C., Baker, P. A. & Selenbien, W. Lake-level variability in Salar de Coipasa, Bolivia during the past ∼40,000
yr. Quat. Res. https://doi.org/10.1017/qua.2018.108 (2018).
43. Herrera, C. et al. Investigaciones hidrogeológicas en la laguna Tuyajto perteneciente a la Reserva Nacional de los Flamencos
(Atacama, Chile). Bol. Geol. Min. 130(4), 789–806. https://doi.org/10.21701/bolgeomin.130.4.011 (2019).
44. Houston, J. Variability of precipitation in the Atacama Desert: its causes and hydrological impact. Q. J. R. Meteorol. Soc. 26(15),
2181–2198. https://doi.org/10.1002/joc.1359 (2006).
45. Herrera, C. et al. Groundwater flow in a closed basin with a saline shallow lake in a volcanic area: Laguna Tuyajto, northern Chilean
Altiplano of the Andes. Sci. Total Environ. 541, 303–318. https://doi.org/10.1016/j.scitotenv.2015.09.060 (2016).
46. Munk, L. A., Boutt, D. F., Hynek, S. A. & Moran, B. J. Hydrogeochemical fluxes and processes contributing to the formation of
lithium-enriched brines in a hyper-arid continental basin. Chem. Geol. 493, 37–57. https://doi.org/10.1016/j.chemgeo.2018.05.
013 (2018).
47. Godfrey, L. & Álvarez-Amado, F. Volcanic and Saline Lithium Inputs to the Salar de Atacama. Minerals 10(2), 201. https://doi.org/
10.3390/min10020201 (2020).
48. Marazuela, M. A., Ayora, C., Vázquez-Suñé, E., Olivella, S. & García-Gil, A. Hydrogeological constraints for the genesis of the
extreme lithium enrichment in the Salar de Atacama (NE Chile): A thermohaline flow modelling approach. Sci. Total Environ.
739, 139959. https://doi.org/10.1016/j.scitotenv.2020.139959 (2020).
49. Bobst, A. L. et al. A 106 ka paleoclimate record from drill core of the Salar de Atacama, northern Chile. Palaeogeogr. Palaeoclimatol.
Palaeoecol. 173(1–2), 21–42. https://doi.org/10.1016/S0031-0182(01)00308-X (2001).
50. Baspineiro, C. F., Franco, J. & Flexer, V. Potential water recovery during lithium mining from high salinity brines. Sci. Total Environ.
720, 137523. https://doi.org/10.1016/j.scitotenv.2020.137523 (2020).
51. Marazuela, M. A., Vázquez-Suñé, E., Ayora, C. & García-Gil, A. Towards more sustainable brine extraction in salt flats: Learning
from the Salar de Atacama. Sci. Total Environ. 703, 135605. https://doi.org/10.1016/j.scitotenv.2019.135605 (2020).
52. Babidge, S. Sustaining ignorance: the uncertainties of groundwater and its extraction in the Salar de Atacama, northern Chile. J.
R. Anthropol. Inst. 25(1), 83–102. https://doi.org/10.1111/1467-9655.12965 (2018).
53. Sonter, L. J., Dade, M. C., Watson, J. E. M. & Valenta, R. K. Renewable energy production will exacerbate mining threats to biodi-
versity. Nat. Commun. 11, 4174. https://doi.org/10.1038/s41467-020-17928-5 (2020).
54. Stahl, A. T., Fremier, A. K. & Cosens, B. A. Mapping legal authority for terrestrial conservation corridors along streams. Conserv.
Biol. 34(4), 943–955. https://doi.org/10.1111/cobi.13484 (2020).
55. García, M., Prieto, M. & Kalazich, F. The protection of the mountain ecosystems of the Southern Central Andes: tensions between
Aymara herding practices and conservation policies. Eco. Mont. 13(1), 22–30 (2021).
Scientific Reports | (2021) 11:7681 | https://doi.org/10.1038/s41598-021-87162-6 12
Vol:.(1234567890)You can also read