Trajectory-Enhanced AIRS Observations of Environmental Factors Driving Severe Convective Storms
←
→
Page content transcription
If your browser does not render page correctly, please read the page content below

MAY 2019                                                    KALMUS ET AL.                                                                    1633

                 Trajectory-Enhanced AIRS Observations of Environmental Factors
                                Driving Severe Convective Storms

                                               PETER KALMUS AND BRIAN H. KAHN
                            Jet Propulsion Laboratory, California Institute of Technology, Pasadena, California

                                    SEAN W. FREEMAN AND SUSAN C. VAN DEN HEEVER
                          Department of Atmospheric Science, Colorado State University, Fort Collins, Colorado

                                   (Manuscript received 16 February 2018, in final form 6 February 2019)

                                                                  ABSTRACT

                  We investigate environmental factors of severe convective weather using temperature and moisture re-
               trievals from the Atmospheric Infrared Sounder (AIRS) that lie along parcel trajectories traced from tornado,
               large hail, and severe wind producing events in the central United States. We create AIRS proximity
               soundings representative of the storm environment by calculating back trajectories from storm times and
               locations at levels throughout the troposphere, using the Hybrid Single Particle Lagrangian Integrated
               Trajectory (HYSPLIT) model forced with the 32-km North American Regional Reanalysis (NARR) and
               12-km North American Mesoscale Forecast System (NAM12). The proximity soundings are calculated for
               severe weather events including tornadoes, hail $2 in. diameter, and wind gusts .65 mph (29 m s21) specified
               in the NCEI Storm Events database. Box-and-whisker diagrams exhibit more realistic values of enhanced
               convective available potential energy (CAPE) and suppressed convective inhibition (CIN) relative to con-
               ventional ‘‘nearest neighbor’’ (NN) soundings; however, differences in lifting condensation level (LCL), level
               of free convection (LFC), and significant tornado parameter (STP) from the HYSPLIT-adjusted back traced
               soundings are more similar to NN soundings. This methodology should be extended to larger swaths of
               soundings, and to other operational infrared sounders, to characterize the large-scale environment in severe
               convective events.

1. Introduction                                                            supercells with significant tornadoes, compared to
                                                                           supercells with either weak tornadoes or no torna-
   There is an extensive literature that describes prox-
                                                                           does. The statistical properties of the environment
imity soundings of temperature T, humidity, vertical
                                                                           obtained from proximity soundings can be ambiguous
wind shear, and derived convective indices from ra-
                                                                           because of time and space mismatches to convective
diosondes or model analyses (e.g., Brooks et al. 1994;
                                                                           storms (Potvin et al. 2010).
Rasmussen and Blanchard 1998; Doswell and Evans
                                                                             The processes contributing to the tornado life cycle
2003; Thompson et al. 2003, 2012; and references
                                                                           within supercells and other types of convective storms
therein). Brooks et al. (1994) highlight the importance of
                                                                           remain enigmatic (Markowski and Richardson 2009).
low-level moisture in discriminating types of convec-
                                                                           Advances in our theoretical (e.g., Davies-Jones et al.
tion, and that temporally and spatially variable low-level
                                                                           2001) and observational (e.g., Wakimoto and Cai 2000;
moisture fields are more common than quasi-uniform
                                                                           Markowski et al. 2002; Wurman et al. 2007) under-
moisture fields. Doswell and Evans (2003) describe
                                                                           standing, and the numerical representation of con-
proximity soundings for tornadic and nontornadic su-
                                                                           vection (e.g., Rotunno and Klemp 1985; Rotunno
percells and the environmental differences among
                                                                           et al. 1988; Weisman et al. 2008) and of tornado-like
them, finding (cf. their Fig. 3) higher relative humidity
                                                                           vortices (e.g., Grasso and Cotton 1995; Wicker and
(RH) in the boundary layer and lower troposphere for
                                                                           Wilhelmson 1995; Markowski et al. 2003; Lerach and
                                                                           Cotton 2012; Coffer and Parker 2017) illustrate the im-
  Corresponding author: Peter Kalmus, peter.m.kalmus@                      portance of a rapidly evolving thermodynamic envi-
jpl.nasa.gov                                                               ronment in proximity to convective storms.

DOI: 10.1175/MWR-D-18-0055.1
Ó 2019 American Meteorological Society. For information regarding reuse of this content and general copyright information, consult the AMS Copyright
Policy (www.ametsoc.org/PUBSReuseLicenses).
1634                                   MONTHLY WEATHER REVIEW                                                 VOLUME 147

   Large networks of surface-based mesoscale observa-         have potential to characterize the local storm environ-
tions and twice-daily radiosonde launches at 0000 and         ment. The dense spatial sampling of T and q vertical
1200 UTC over the continental United States are unable        profiles from AIRS during the afternoon observation
to resolve time-varying and spatial-scale-dependent           time provides a unique opportunity to assess the devel-
gradients of T and specific humidity q; radiosonde            oping storm environment a few hours before convective
launches during morning and late evening miss the             initiation, complementing a glaring temporal gap in the
‘‘prime time’’ of convective initialization (e.g., Kain       operational radiosonde record. Botes et al. (2012) calcu-
et al. 2008). As a result, T and q are frequently poorly      lated atmospheric stability indices from AIRS, RUC, and
represented in model analyses used in operations and          radiosondes matched to nearest neighbors in space and
research. This may be true in coarsely gridded analyses       within two hours of each other, to probe preconvective
such as the 40-km resolution Rapid Update Cycle               environments for convective events occurring no more
(RUC-2), the finely gridded 3-km resolution variational       than six hours after the AIRS overpass. CAPE and CIN
version of the Local Analysis and Prediction System           calculated using AIRS profiles were found to be generally
(vLAPS; Jiang et al. 2015), and 3-km High-Resolution          underestimated relative to CAPE and CIN calculated
Rapid Refresh (HRRR; Benjamin et al. 2016). Koch              using the radiosonde measurements. Gartzke et al.
et al. (2016) show that very strong spatial gradients and     (2017) showed that the correlation of CAPE between
tendencies in moisture, stability, and cloudiness were        AIRS and radiosondes launched at the SGP ARM site
responsible for an unusual EF3 tornado near Windsor,          is r 5 0.34; however, if the AIRS retrieved surface
Colorado, on 22 May 2008. A notably improved repre-           temperature is replaced with a surface observation
sentation of these features was observed in vLAPS             before CAPE is calculated, the comparison is vastly
compared to the RUC-2.                                        improved with r 5 0.95.
   There is a clear need for a dense time- and space-            Jones and Stensrud (2012) showed that the assimila-
resolved network of sounding observations throughout          tion of AIRS thermodynamic profiles led to improve-
the troposphere. Dabberdt et al. (2005) specifically call     ments in the representation of dewpoint profiles in
out the potential capabilities of hyper-spectral infrared     proximity to convective features and convective initiation
sounders such as the Atmospheric Infrared Sounder             within a numerical model using radar as ground truth for
(AIRS, with 45 km footprints and twice-daily over-            validation. This shows that the assimilation of larger-scale
passes at 0130 and 1330 local time; Chahine et al. 2006)      environmental thermodynamic variability that is resolved
to meet some of these needs. Feltz and Mecikalski             by AIRS can have marked improvements in the 1–4-h
(2002) use retrievals of T and q obtained from the            time frame at the smaller convective scales. However, the
upward-looking Atmospheric Emitted Radiance In-               optimal locations and spatial density of soundings, and
terferometer (AERI) at the Southern Great Plains              their proximity to boundaries and thermodynamic gra-
(SGP) Department of Energy (DOE) site, with a                 dients, remain highly uncertain. Coniglio et al. (2016)
temporal resolution of 10 min, to show a rapid evolution of   performed data assimilation of radiosonde observations
convective parameters in proximity to severe convective       launched during the Mesoscale Predictability Experi-
weather. Substantial differences between convective           ment (MPEX) to show that improvements in convective
available potential energy (CAPE) and convective in-          forecasts using WRF-ARW depended on optimal posi-
hibition (CIN) among three AERI instrument sites,             tioning of the radiosondes. One implication is that a
situated approximately in an equilateral triangle with        dense network of satellite soundings may be useful
sides of length 200 km, illustrate the inherent variability   because the most relevant locations for data assimila-
of T and q in the prestorm convective environment.            tion can be customized on a case-by-case basis. Fur-
Wagner et al. (2008) show the time evolution of CAPE          thermore, a higher density of time-resolved soundings
and CIN obtained from AERI retrievals of T and q in           is beneficial for observing an evolving preconvective
tornadic versus nontornadic environments. CAPE is             environment. Weisz et al. (2015) used soundings from
shown to be larger in proximity to tornadic convective        AIRS, the Infrared Sounding Atmospheric Interferom-
storms. However, CIN is also reported to be larger in         eter (IASI), and the Cross-track Infrared Sounder (CrIS)
tornadic convective events.                                   to show that increased low-level moistening and de-
   While the upward-looking infrared AERI observa-            creased lifted index (LI) preceded the 20 May 2013 tor-
tions complement radiosonde observations, and provide         nado outbreak near Moore, Oklahoma.
excellent temporal resolution, their limitations—namely,         The promising early results from surface-based AERI
poor spatial coverage, fixed locations, and inability to      observations, the successful predictive power of AIRS
probe above 3 km—suggest that downward-looking                data assimilation in a numerical prediction of convec-
satellite-based hyper-spectral infrared sounders may          tion by Jones and Stensrud (2012), and the obvious
MAY 2019                                          KALMUS ET AL.                                                       1635

shortcomings from a lack of temporal resolution despite        et al. 2012) and is east of the highly variable topography of
multiple polar-orbiting hyperspectral infrared sounders,       the Rockies that are much more problematic for lower-
motivate a novel approach for exploiting AIRS as               tropospheric infrared sounding. We divide the storm
proximity soundings for severe convection. While not           events into six categories: EF5, EF4, and EF3 tornadoes
as precise as conventional radiosondes, there are po-          (‘‘TOR2’’); EF2, EF1, and EF0 tornadoes (‘‘TOR1’’);
tentially orders of magnitude more AIRS soundings              hail with diameter d $ 3 in. (‘‘HAIL2’’); hail with 2 # d ,
available. We describe a combined approach that uses           3 in. (‘‘HAIL1’’); thunderstorm winds with gust
the Hybrid Single-Particle Lagrangian Integrated Tra-          speeds $100 miles per hour (mph) (‘‘WND2’’);
jectory (HYSPLIT; Stein et al. 2015) model to search for       and thunderstorm winds with speeds between 65 and
the AIRS pixels that best match in time and space the          100 mph (29–45 m s21) (‘‘WND1’’). Wind events that
National Centers for Environmental Information (NCEI)          are reported without speeds are not included in this in-
Storm Events database. We find this methodology en-            vestigation. The wind events in Storm Data should not
hances the interpretation of time evolution of severe          be treated as precise estimates of wind speed as there
convective storm environments. We also speculate that          are many challenges to using these data quantitatively
this approach may be useful in an operational                  (Trapp et al. 2006). Wind gusts are estimated from hu-
‘‘nowcasting’’ context and could offer additional guidance     man observers, observed damage, and anemometers;
to forecasters in the 1–4-h time frame.                        each of these observational methodologies has limita-
   The rest of this paper is organized as follows. Section 2   tions in precision, accuracy, and sampling. Furthermore,
describes the methodology. Section 3 presents the re-          many severe wind gusts go unreported or do not lead to
sults, including ensemble studies of thermodynamic             damage. In this investigation, we include two wind cat-
variables relevant to convective environments and case         egories for the strongest wind gusts to explore differ-
studies of individual storms. Section 4 provides addi-         ences with EF-scale and hail categories.
tional context using sensitivity studies. Section 5 sum-          Ideally the analysis would account for each tornadic
marizes, concludes, and provides a detailed outlook on         supercell, nontornadic supercell, and nonsupercellular
next steps in future research and applications including       thunderstorm within our spatiotemporal domain sepa-
those in operational forecasting environments.                 rately. However, this would require knowing the un-
                                                               derlying mapping between the storm events and the
                                                               actual storm modes. For example, a single supercell
2. Data and methods
                                                               may last for several hours, or evolve into another mode
   The latitudes, longitudes, times, and classification of     and affect multiple municipalities, resulting in a one-to-
tornadoes, hail, and wind events from severe thunder-          many mapping in the database. For another example,
storms over the continental United States are obtained         if a single supercell triggers both tornado and hail re-
from NCEI’s Storm Events database between 2003                 ports, these will remain as separate entries in the NCEI
and 2016.                                                      database. We henceforth make no attempt to discrimi-
   Level 2 (L2) swath data of T and q profiles from the        nate by convective mode and will group convective in-
AIRS instrument on board the Aqua satellite (Chahine           dices by the type of severe weather reported. Every
et al. 2006), launched on 4 May 2002, are obtained for all     storm report within the spatiotemporal domain is used
days and locations that spatially and temporally coincide      in the analysis, except for the cases of EF0 and WND1
with the NCEI Storm Events. The AIRS Level 2 Sup-              storm reports, for which every other storm report is used
port products contain T and q profiles that are sampled        due to their high frequency of occurrence. Some degree
vertically at a spacing of about 26 hPa or 250 m (Maddy        of overlap between the defined bins within each severe
and Barnet 2008) and are archived starting in September        weather category is likely to contribute to reduced dis-
2002. While the vertical grid resolution is high, the in-      crimination of convective indices between the bins. The
formation content of the retrievals implies retrieval          possibility of co-occurrence of different events (e.g., hail
resolution on the order of ;2 km, depending on the             and tornado) remains a potential impact on the results.
vertical structure of T and q. The AIRS retrievals in-            The HYSPLIT model is forced with winds using
corporate information from the Advanced Microwave              the North American Regional Reanalysis (NARR,
Sounding Unit (AMSU) instrument collocated with                with horizontal resolution of 32 km, temporal resolu-
AIRS on board the Aqua satellite.                              tion of 3 h, and 24 pressure levels) and the North
   The longitudinal range of the analysis is limited to be-    American Mesoscale Forecast System (NAM12; available
tween 838 and 1108W, focusing on the plains east of the        from 2008, with resolution of 12 km, temporal reso-
U.S. Rockies. This region of the United States contains        lution of 1 h, and 26 pressure levels) to calculate four-
the highest frequencies of severe weather reports (Smith       dimensional back trajectories from a storm report’s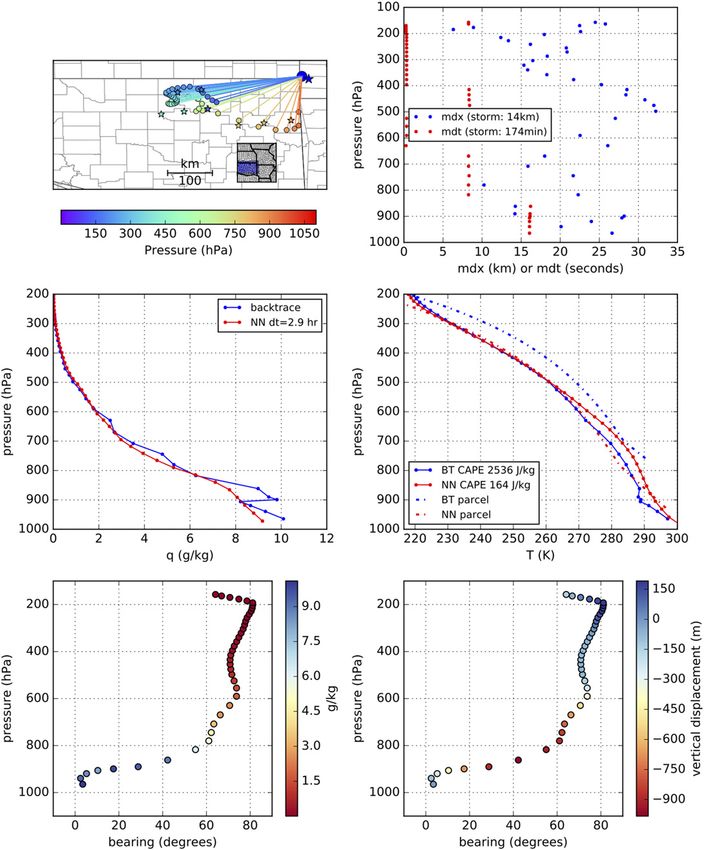
1636                                          MONTHLY WEATHER REVIEW                                                      VOLUME 147

   TABLE 1. Sequential attrition of storm reports within the analysis   within an AIRS footprint. In approximately a third of
pipeline as described in the text, from an input of 26 993 initial      cases, no such NN matchup exists (Table 1). To facilitate
storm reports, for the NARR winds over the entire AIRS record.
                                                                        comparison between the conventional NN method and
        Reason for exclusion                       Percent of input     the new backtrace method described below, these cases
 Storm before overpass                                     28           are excluded from the analysis. In future analyses or
 HYSPLIT lost backtrace level(s)                           10           operational deployments of this methodology relying
 No NN matchup                                             30           only on the backtrace, such losses from lack of NN
 No matchup for at least one level                          8           matchups would not be incurred.
 Poor data quality, at least one level                     15
                                                                           Next, back trajectories are matched to AIRS soundings.
 CAPE 5 0, NN or backtrace                                  3
                                                                        Our HYSPLIT runs produce back-trajectory estimates at
                                                                        the top of any given hour. The back-trajectory locations
beginning latitude, beginning longitude, and begin-                     for matching up to the AIRS overpass are chosen by lin-
ning time at one of 40 starting altitude levels evenly                  early interpolating the backtraced latitude, longitude,
spaced between 50 m and 13.5 km above model                             and altitude to the NN matchup time (i.e., the time of the
ground level. This enables matching of back trajec-                     AIRS overpass near the storm location). For back-
tories to the nearest AIRS retrieved sounding within                    trajectory AIRS matchups, the back-trajectory location is
the Aqua overpass at approximately 1330 local time.                     required to reside within an AIRS footprint and to be
The use of both NARR and NAM12 inputs into                              within 30 min of the overpass time; in practice, the time
HYSPLIT is intended to provide two independent                          interpolation ensures that AIRS and backtrace matchups
estimates of the wind fields (speed and direction) that                 match to within one minute. For events with fewer than 40
may arise from differences in model initialization,                     backtrace matchups, that is, if some altitudes fall outside of
data assimilation, model subgrid physics, model reso-                   the AIRS swath, the storm is excluded from the analysis
lution, and model output reported at different temporal                 (Table 1). This occurs in ;8% of cases.
frequencies. Back trajectories are run for storm reports                   Soundings of temperature and specific humidity are
with beginning times later than the AIRS overpass but                   then created from the level-by-level matched AIRS re-
occurring that same day. There is no consideration of the               trievals. Every datum of a backtrace profile, both T and
end time of storm reports. Eliminating reports earlier than             q, must have an AIRS data quality of either 0 (best) or
1330 LT cuts about a quarter of the total number of storm               1 (good) (e.g., Yue et al. 2013) or else that storm is ex-
reports (Table 1).                                                      cluded from the analysis, which occurs in 15% of cases
   Before the back trajectories are matched to AIRS                     (Table 1). Up to two quality-control marked pressure
soundings, the storm report’s beginning time and loca-                  levels for each sounding are reported, one for 0 (best)
tion are matched to the nearest AIRS footprint; this                    and the other for 1 (good), and demarcate the highest
AIRS footprint is referred to as the nearest neighbor                   pressure (lowest altitude) for which levels can fall within
(NN) matchup. As per convention in NN analyses (e.g.,                   ‘‘best’’ or ‘‘good’’ categories. Most individual soundings
Botes et al. 2012) the storm report time is required to be              are typically only categorized as ‘‘best,’’ ‘‘good,’’ or ‘‘do
no more than 6 h after the overpass (Fig. 1), and to reside             not use’’ (all levels below ‘‘good’’). Since the backtrace

             FIG. 1. (left) Histogram of storm beginning time minus AIRS overpass time for nearest neighbor (NN) matchups
           remaining in the NARR analysis (dt): grouped as hail storms (green), tornadic storms (red), and thunderstorm wind
           events (blue). Mean dt is given in the legend for each group. (right) Map of these storms, with large triangles
           denoting TOR2, HAI2 categories, and WND2 categories; and dots denoting the remaining categories.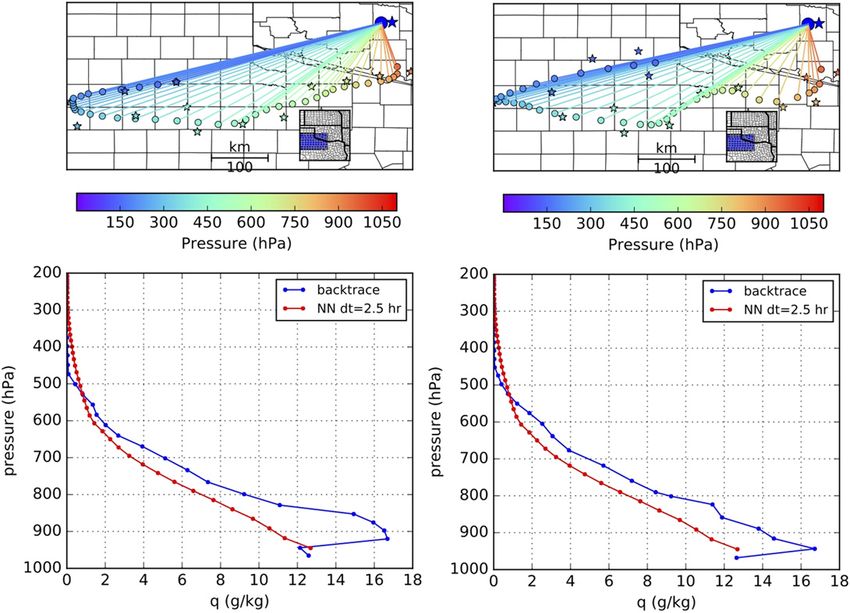
MAY 2019                                       KALMUS ET AL.                                                       1637

methodology by design uses multiple adjacent sound-         nontornadic, in the context of their respective envi-
ings, the quality control flagging can be highly variable   ronments. The first supercell produced a destructive
within a backtrace profile. Altitudes corresponding to      EF5 tornado in Joplin, Missouri, on 22 May 2011 that led
pressure levels are obtained from HYSPLIT for back-         to numerous fatalities (Karstens et al. 2013). Back trajec-
trace profiles, and from the AIRS geopotential height       tories and q and T profiles are shown for the Joplin su-
product for NN profiles.                                    percell in Fig. 2. The direction of the back trajectories
   Backtraced parcels in general experience vertical        veers with height indicating strong vertical wind shear.
motions as they converge to the space–time location of      Enhancement of low-level moisture is apparent in the
the storm. The parcel temperatures are adjusted along       backtrace profile relative to the NN profile. The brightness
both dry (RH , 100%) and moist (RH $ 100% if as-            temperature at 1231 cm21 (Tb1231), q at 925 and 850 hPa, T
cending) adiabats as appropriate, and the lifting con-      at 850 and 700 hPa, and the 925–700 hPa temperature lapse
densation level (LCL) separating the dry and moist          rate (G925–700) are shown in Fig. 3. The q at 925 and 850 hPa
adjustment regimes is calculated using the method of        show a few approximately north–south-oriented bands of
Romps (2017). The value of specific humidity corre-         high values of q that appear to be moistening the low levels
sponding to saturation at each parcel’s ending alti-        of the backtrace sounding in the few hours leading up to
tude and adjusted temperature is calculated, and the        the tornado. In the case of T, the east to west gradient of
saturation-adjusted q value is used if less than the        increasing T at 850 hPa is stronger than at 700 hPa which
parcel’s starting q value. This saturation adjustment       implies more rapid warming at low levels than aloft. The
occurs infrequently and was found to have a negligible      G925–700 also shows about 2 K km21 of steepening to the
effect on results. Phase changes and precipitation are      south and west of the Joplin supercell, which is indicative
assumed to have no further impact on the parcel mix-        of an increasingly unstable boundary layer with time.
ing ratios (e.g., Doswell 1987). Presumably parcels that       The second example supercell produced 41 in. di-
undergo these changes are typically masked out in the       ameter hail in and around Oklahoma City, Oklahoma, on
AIRS data quality control, since infrared sounders          16 May 2010. The Tb1231, 925 and 700 hPa q, 925 and
cannot penetrate opaque cloud. Errors from this as-         850 hPa T, and G925–700 are shown in Fig. 4. Very strong
sumption will be investigated in future work. Finally,      and complex horizontal and vertical gradients in q are
for parity in subsequent calculations, the NN T and q       observed. A strong moistening from the west at 700 hPa
profiles are logarithmically interpolated to the back-      simultaneously occurred along with moistening from the
trace profile pressure levels. Figure 2 illustrates the     east at 925 hPa. At 600 hPa, there is a sharp reduction in
backtrace methodology for a single storm in the anal-       q to the south of the supercell, while moist air is found
ysis, the EF5 Joplin, Missouri, tornado (section 3).        to the north (not shown). The vertical structure of q
   For each surviving storm report (Fig. 1) we thus have    exhibits a moist layer up to 700 hPa and an extensive
T and q profiles from the NN AIRS retrieval, as well as     dry layer above it. The T gradients in the horizontal
profiles reconstructed from AIRS retrievals at each of      were strongest outside of the region containing the
the 40 backtraced locations and levels. From these T and    back trajectories, however, some warming was ob-
q profiles, the SHARPpy python package (Blumberg            served at 850 hPa with some slight cooling at 925 hPa that
et al. 2017) is used to calculate thermodynamic quanti-     implies a slight stabilization with time. The G925–700 map
ties of interest: CAPE, CIN, LCL, and LFC from most         shows a stabilization in southeast Oklahoma near the
unstable (MU) parcels. For backtraced profiles, shear       region where the supercell eventually dissipated.
is calculated using the compass bearing direction from         The horizontal gradients in lapse rates, and the time
the backtraced matchup location to the storm location,      tendencies implied by the back trajectories, are sub-
and a mean wind speed calculated from the distance          stantially different between Figs. 3 and 4. Multiple
between these two locations and the difference in their     bands of high q in Fig. 3 and height-dependent hori-
timestamps. Occasionally CAPE is calculated to be zero;     zontal gradients of q in Fig. 4 illustrate AIRS’ ability
when this occurs for either the NN profile or the back-     to distinguish case-by-case differences in the near-
trace profile, the corresponding storm report is excluded   storm environment. These two cases uniquely de-
from the analysis (Table 1).                                picted by AIRS illustrate near-storm environmental
                                                            differences that are consistent with the severe weather
3. Results                                                  generated by the two supercells.
a. Two contrasting supercells                               b. Environmental convective indices
  We demonstrate the methodology on two well-known            The storm dataset is now examined as an ensemble
and consequential supercells, one tornadic and one          divided into the six storm categories previously defined.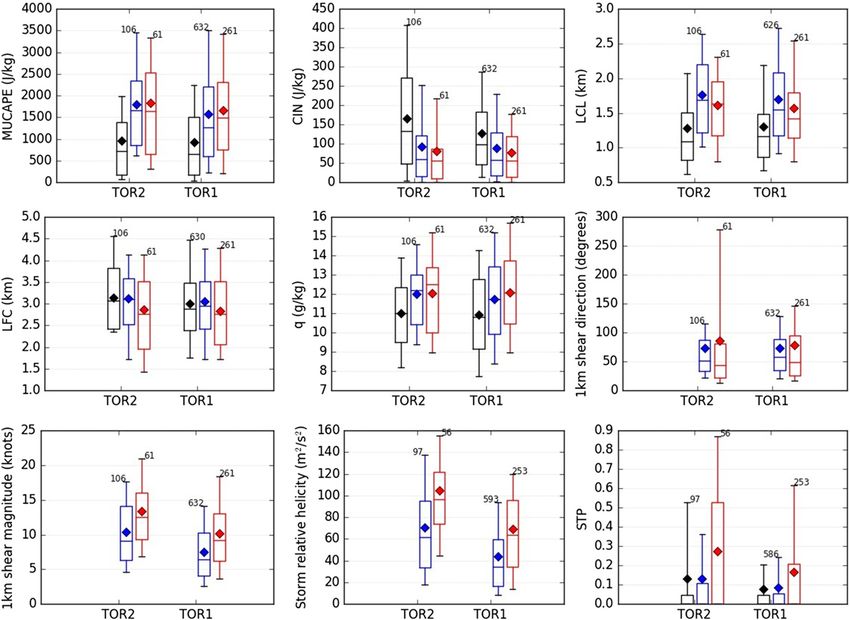
1638                                       MONTHLY WEATHER REVIEW                                                          VOLUME 147

           FIG. 2. Case study illustrating the backtrace methodology, in this case 6 aspects of the Joplin EF5 tornadic
         supercell (see section 3). (top left) Back trajectories using the NAM12 winds (blue 150 hPa to orange 1000 hPa)
         and AIRS matchups (stars). The length scale indicates 100 km. (top right) Time and space differences [matchup
         time difference in seconds (mdt) in red and matchup spatial distance in km (mdx) in blue] for each matchup.
         (middle left) Specific humidity (q) profiles for backtrace and nearest neighbor. (middle right) As in (middle left),
         but for T, and including most unstable parcel lifting profiles (dashed lines). (bottom left) q vs compass bearing
         and pressure level. (bottom right) As in (bottom left), but for parcel vertical displacement from the storm
         location back to the AIRS footprint.

For simplicity, the discussion is focused on thermodynamic          the entire AIRS record. However, the higher-resolution
variables (CAPE, CIN, LCL, and LFC calculated using                 NAM12 backtrace results are used to infer dynamic vari-
SHARPpy, and low-level moisture) around the NARR                    ables (shear, storm relative helicity) because of the poorer
backtrace results, which unlike the NAM12 results, span             representation of dynamics in the NARR (shown later).
MAY 2019                                                  KALMUS ET AL.                                                                 1639

  FIG. 3. AIRS granule measurements for the Joplin tornado case study. (top left) 1231 cm21 brightness temperature, with ‘‘3’’ showing
tornado report location and lines showing backtrace trajectories. (top center) q at 925 hPa. (top right) q at 850 hPa. (bottom left) T at
850 hPa. (bottom center) T at 700 hPa. (bottom right) Lapse rate between 925 and 700 hPa. The back trajectories calculated to the nearest
AIRS pixel, from the surface to 600 hPa, are shown as black segments with the ‘‘3’’ denoting the tornado report at 1640 local time at
37.068N, 94.578W. The white areas indicate retrievals of T and q that did not pass the quality control at that particular pressure level (i.e.,
data quality was not ‘‘good’’ or ‘‘best,’’ 1 or 0, respectively).

  1) CAPE                                                                higher-resolution NAM12 winds yields clear improve-
                                                                         ment over backtracing from NARR winds, suggesting
  The AIRS backtrace analysis demonstrates an en-
                                                                         that estimates might improve further as additional res-
hancement in CAPE from most unstable parcel lifting
                                                                         olution becomes available.
(MUCAPE) across storm categories relative to the
                                                                            Parker (2014), Rasmussen and Blanchard (1998),
conventional NN analysis (Tables 2 and 3, Fig. 5), with
                                                                         Grzych et al. (2007), and Wagner et al. (2008) describe
mean values enhanced by a factor of about 1.5 and
                                                                         proximity radiosondes, mesonet, and AERI observa-
somewhat greater enhancement for tornadoes than hail
and winds.                                                               tions made near tornadic and nontornadic supercells.
  The results of the backtracing approach are generally                  These observations clearly demonstrate large variations
in good agreement with previous studies sounding the                     at spatial scales not resolved by the AIRS operational
storm environment via various methods, although these                    (45 km footprint) retrieval, but Fig. 5 shows that mean
previous works mostly relate to supercells. To facilitate                values of CAPE are similar to AIRS. The results of
comparison, Fig. 5 annotates estimates from these pre-                   the backtracking approach are furthermore in general
vious studies using green text. In general, backtracing                  agreement with previous studies (Thompson et al. 2003,
brings the space-based CAPE estimates into much bet-                     2012; Grams et al. 2012; Schultz and Askelson 2012)
ter agreement with the literature than the traditional                   using MUCAPE and MLCAPE derived from the RUC
NN approach, and could be thought of as a correction                     analysis, although some differences are observed.
for systematic error introduced by the multihour time                       Using numerical simulations, Crook (1996) de-
gap between observations of storm environments and                       termined that CAPE is generally more impacted by q
convective initiation. Furthermore, backtracing from                     than T, while CIN is more impacted by T than q.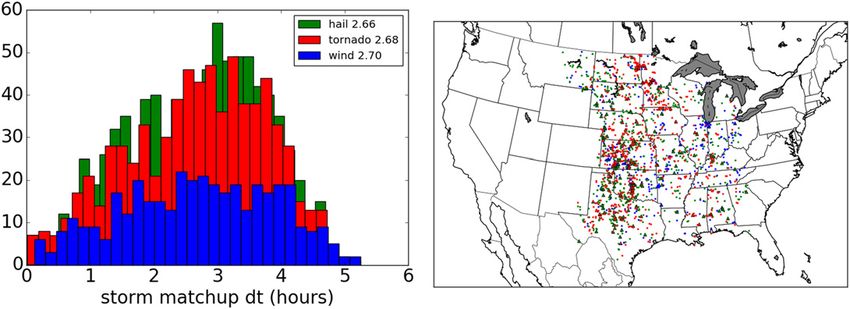
1640                                          MONTHLY WEATHER REVIEW                                                          VOLUME 147

   FIG. 4. AIRS granule measurements for the Oklahoma hail case study. (top left) 1231 cm21 brightness temperature, with ‘‘3’’ showing
first hail report location and lines showing backtrace trajectories. (top center) q at 925 hPa. (top right) q at 700 hPa. (bottom left) T at
925 hPa. (bottom center) T at 850 hPa. (bottom right) Lapse rate between 925 and 700 hPa. The back trajectories calculated to the nearest
AIRS pixel, from the surface to 600 hPa, are shown as black segments with the ‘‘3’’ denoting the first 4.25 in. hail report at 1358 LT at
36.118N, 98.358W. The white areas indicate retrievals of T and q that did not pass the quality control at that particular pressure level.

Once convection is well developed, the variance of q                   strongest hailstorm events with hailstone diameters
near the surface plays a much larger role in modulating                larger than 4 in. relative to weaker hail events (not
convective intensity. McCaul and Weisman (2001) showed                 shown), and the strongest wind gusts relative to weaker
with numerical simulations that the shape of the CAPE                  subcategories using the backtrace method, whereas the
profile, even for fixed CAPE values, has a profound                    opposite trend is observed using the NN method.
impact on convective evolution but this effect is stronger                As with CAPE, CIN calculated with the backtrace
for lower values of CAPE. The backtrace methodology                    method is in much better agreement with the prior lit-
is able to more realistically sample fluctuations in envi-             erature than CIN calculated from NN soundings. The
ronmental CAPE derived from AIRS soundings and                         preponderance of literature results show a substantial
therefore it is no surprise that improved representation               decrease in CIN for tornadic versus nontornadic events
of CAPE is obtained in the backtrace results relative to               (Rasmussen and Blanchard 1998; Grzych et al. 2007;
the NN results.                                                        Parker 2014; Klees et al. 2016; Davies 2004) although a
                                                                       large spread in CIN magnitude is noted. However,
  2) CIN
                                                                       Wagner et al. (2008) present opposing results using
  The AIRS backtrace method shows a striking differ-                   AERI profiles, finding that environments up to three
ence in CIN estimates from the conventional NN ap-                     hours before tornadic and nontornadic supercells have
proach (Tables 2 and 3, Fig. 6), with mean CIN reduced                 CIN of 50–80 and 0–20 J kg21, respectively. The large
by a factor of ;1.5 using the backtrace method. Using                  spread in CIN estimates obtained in the studies cited
NAM12, a much lower CIN is also observed for the                       above and the results from backtraced AIRS profiles,
distribution of violent EF4 and EF5 tornado events                     are consistent with a lack of an obvious physical con-
relative to weaker tornado events (the appendix), the                  nection of CIN to tornado formation in the near-storm
MAY 2019

   TABLE 2. Mean environmental indices tabulated by category, from backtraces calculated with NARR winds over the entire AIRS record. We have inserted representative values from
the literature for comparison in italics, as mentioned in the text. References are abbreviated as follows: RB98 (Rasmussen and Blanchard, 1998); G07 (Grzych et al. 2007); W08 (Wagner
et al. 2008); T03 (Thompson et al. 2003); T12ML (Thompson et al. 2012, using mixed layer indices); G12ML (Grams et al. 2012, using mixed layer indices); SA12 (Schultz and Askelson,
2012); D04 (Davies, 2004); DE03 (Doswell and Evans, 2003); P14 (Parker, 2014), using typical values depicted in the 25 km 3 25 km region to the south and east of the supercell composite,
tornadic supercell data placed into ‘‘tornado’’ category and nontornadic supercell data placed into ‘‘hail’’ category.

 Key         CAPE (J kg21)        CIN (J kg21)       LCL (km)         LFC (km)        q (g kg21)      Shear magnitude (kt)        Shear direction (8)     SRH (m2 s22)            STP
TOR               1606                 88                1.7              3.1            10.8                   8.0                       74                    48               0.09
               1314 RB98            12 RB98           0.8 RB98                                                                                             200-250 P14         .4.4 P14
                3004 G07             96 G07
                2050 W08
              1100 G12ML                             0.8 G12ML
               .2200 P14             65 W08          0.7–0.9 P14
                                   40 G12ML
                                     50 P14
HAIL              1658                 88                1.7              3.0            10.7                   5.6                       83                    29                0.05
               1152 RB98            35 RB98           1.2 RB98                                             10–18 DE03
                2098 G07            187 G07                                                                                                                100–150 P14        1.2–1.6 P14
                1700 W08             10 W08
                1645 T03                               1.4 T03
              1578 T12ML           91 T12ML          1.4 T12ML
              1400 G12ML           70 G12ML          1.3 G12ML
                                                                                                                                                                                             KALMUS ET AL.

               1100 SA12                              1.2 SA12         2.9 SA12
             1800–2000 P14          72 D04           1.0–1.1 P14        2.3 D04                                                                             100 SA12
                                   50–75 P14
TOR2              1698                 94                1.7               2.9           11.0                  10.5                       62                   74                 0.16
              1705 T12ML           47 T12ML            1.0 T03         2.8 SA12                            21–33 DE03                                       300 SA12
                2303 T03                             1.0 T12ML          1.5 D04
               1600 SA12            31 D04            0.8 SA12
TOR1              1601                 88                1.7              3.1            10.8                   7.8                       74                    46                0.09
                1934 T03           55 T12ML            1.3 T03         1.9 D04                             13–23 DE03
              1561 T12ML            38 D04           1.1 T12ML
HAIL2             1839                 85                1.7              2.9            10.9                   5.7                       77                    31                0.06
HAIL1             1618                 89                1.7              3.0            10.6                   5.6                       84                    29                0.05
WND2              1936                 75                1.9              3.1            12.2                   6.4                      141                    26                0.01
WND1              1532                 78                1.8              2.9            11.9                   4.6                       94                    22                0.03
              950 G12ML
                                                                                                                                                                                             1641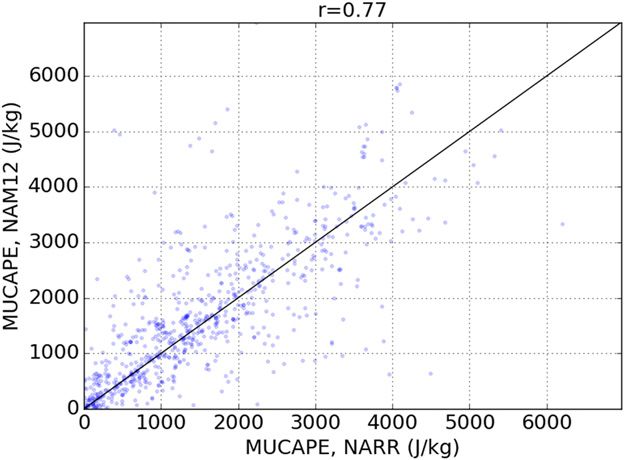
1642                                       MONTHLY WEATHER REVIEW                                                          VOLUME 147

   TABLE 3. Mean environmental indices tabulated by category, from backtraces calculated with NAM12 winds from 2008 to 2016.

           CAPE         CIN                                                    Shear              Shear
 Key      (J kg21)    (J kg21)   LCL (km)      LFC (km)      q (g kg21)     magnitude (kt)     direction (8)   SRH (m2 s22)      STP
TOR         1697         78          1.6           2.8            11.0            10.8               80               76         0.19
HAIL        1741         79          1.7           2.9            10.8             7.5               74               44         0.07
TOR2        1874         72          1.7           2.8            11.1            13.6               85              104         0.19
TOR1        1682         78          1.6           2.8            11.0            10.6               80               73         0.19
HAIL2       2184         78          1.6           2.7            11.6             7.4               67               47         0.13
HAIL1       1663         80          1.7           2.9            10.7             7.5               75               44         0.07
WND2        2257         55          1.6           2.5            12.1             8.3               67               55         0.15
WND1        1603         77          1.7           2.8            12.3             6.5              101               35         0.06

environment. Reliable CIN fields resolved at the storm-                In contrast to CAPE and CIN, the AIRS backtraced
scale, especially those near the rear flank downdraft               estimates are generally in worse agreement with the
using available satellite soundings, may not be possible            literature than the AIRS NN estimates. We speculate
with a nominal AIRS resolution of 45 km. However,                   that the reduced differentiation in AIRS-derived LCL
this topic should be revisited when an improved 15-km               could be related to the coarse AIRS spatial resolution
resolution sounding is made widely available (Irion                 (;45 km near-nadir view), the coarse gridding of
et al. 2018).                                                       NARR (32 km) or NAM (12 km), rendering these un-
  Last, Davies (2004) showed that CIN is lowest for                 able to resolve storm-scale features in q variability. This
F2–F4 tornadoes (31 J kg21), slightly elevated for F0–F1            is supported by slightly larger separation observed with
tornadoes (38 J kg21), and even higher for nontornadic              the NAM compared to NARR; efforts using the 3-km
supercells (72 J kg21). In stark contrast to the AIRS NN
results, the AIRS backtracing with NAM12 are consis-
tent with the results of Davies (2004) despite the fact
that the AIRS profile is inherently smoothed compared
to radiosondes (Botes et al. 2012). This implies that CIN
created from variations in stabilization can be largely
resolved by AIRS soundings.
  3) LCL
   Figure 7 shows that backtracing increases the lifting
condensation level (LCL) estimates from AIRS relative
to NN analysis by 200–500 m across storm categories
with NARR typically 100–200 m higher than NAM12.
From the AIRS record, violent tornadic environments
have a somewhat lower LCL relative to weak and strong
tornadic environments independent of analysis method
(see the appendix). LCL from the AIRS record does not
                                                                       FIG. 5. CAPE (from most unstable parcel) from nearest neighbor
clearly distinguish between the mean tornadic and hail
                                                                    (black), NARR backtrace soundings (blue), and NAM12 back-
environments.                                                       trace soundings (red). Here, as in the rest of the paper, box-and-
   Parker (2014) and Rasmussen and Blanchard (1998)                 whisker plots give means (stars), medians (lines), interquartile
found the LCL to be lower in tornadic supercells than in            ranges (boxes), and 10%–90% ranges (whiskers). The black
nontornadic supercells; this trend is shown in both the NN          number on the left in each group of three boxes, located horizon-
results and the NAM12 backtrace results. We note that for           tally between the NN and NARR whiskers, gives the count of NN
                                                                    and NARR backtrace soundings; the black number on the right in
both the NN and NAM12 backtrace methods, the LCL                    each group of three boxes, located horizontally aligned with the
distributions for tornadic versus hail events are statistically     NAM whisker, gives the count of NAM backtrace soundings. Es-
distinct at 95% confidence, as described in detail below.           timates from references are shown in green (vertical green lines,
However, Thompson et al. (2003) showed a substantial                when present, represent interquartile ranges) and are abbreviated
decrease in MLLCL for strong versus weaker tornadoes, a             here and in following figures as follows: RB98 (Rasmussen and
                                                                    Blanchard, 1998); G07 (Grzych et al. 2007); W08 (Wagner et al.
trend not exhibited by the AIRS backtrace MULCL re-                 2008); T03 (Thompson et al. 2003); SA12 (Schultz and Askelson,
sults. Bunkers et al. (2006) found that the longer-lived            2012); D04 (Davies, 2004); DE03 (Doswell and Evans, 2003); and
supercells generally had lower LCLs.                                P14 (Parker, 2014).
MAY 2019 KALMUS ET AL. 1643
FIG. 6. As in Fig. 5, but for CIN (from most unstable parcel) from FIG. 7. As in Fig. 5, but for LCL from nearest neighbor and back-
nearest neighbor and backtrace soundings. trace soundings.
6) SHEAR, STORM RELATIVE HELICITY
HRRR model will be made in the near future. Further-
more, the lowest layers within the profile and the surface The wind direction and magnitude shear are esti-
itself are not extrapolated from the existing layers in the mated from the start and stop of backtrace trajectories
profile. Future work will consider ways in which to couple at each of the 40 pressure levels. A backtraced proxy to
together the surface and boundary layer in a physically 1 km directional and magnitude shear (Fig. 10) and di-
consistent manner (e.g., Gartzke et al. 2017). rectional shear (Fig. 11) are calculated. Shear magnitude
shows a clear distinction between tornadic and non-
4) LFC
tornadic storm-event categories, as well as a clear in-
The NN and backtrace methods produce similar crease with increasing tornado intensity. Using NAM12
magnitudes of level of free convection (LFC), indicating winds consistently and substantially enhances values of
that this parameter is not very sensitive to the backtrace shear magnitude relative to NARR winds, again sug-
methodology. Results from higher-resolution NAM12 gesting that the analysis remains resolution-limited. The
are consistently lower than results from NARR. Results magnitudes with respect to the severe event categories,
from Schultz and Askelson (2012) from RUC proximity for the NAM12 winds, shows good agreement in shear
soundings for significant tornadoes and nontornadic magnitude with Schultz and Askelson (2012); but these
supercells are very similar to the corresponding AIRS estimates from the higher-resolution winds are low com-
estimates (Tables 2 and 3, Fig. 8). We note that for the pared to estimates from Doswell and Evans (2003), a dis-
NN method only, the LFC distributions for tornadic crepancy that might be reduced with improved resolution.
versus hail events are statistically distinct at 95% confi- Directional shear (Fig. 11) did not discriminate between
dence, as described below. tornadic and nontornadic environments.
Storm relative helicity (SRH) at 1 km measures the
5) LOW-LEVEL MOISTURE
potential for cyclonic updraft rotation and is shown in
The low-level moisture is quantified by taking the Fig. 12. Thompson et al. (2003), Schultz and Askelson
maximum value of q between 850 hPa and the surface. (2012), and Parker (2014) report substantially higher
Figure 9 shows the results using the NN and backtrace estimates of SRH for tornadic and nontornadic super-
methods. The backtrace methodology shows moistening cells. This discrepancy may be partly due to limitations
over the NN method for all categories, although the in spatial and temporal resolution of the meteorological
change is small for the wind categories. The mean value data used by HYSPLIT.
of q between 850 hPa and the surface was also examined While shear and SRH are well described in the literature
(not shown); the results were generally consistent with and AIRS does not provide an estimate of either quantity,
Fig. 9, although, unsurprisingly, the enhancement was Figs. 10–12 are useful for validating the methodology and
less pronounced. We note that for the backtrace method assumed meteorological forcing, which may vary de-
with NAM12 winds, the maximum q distributions for pending on the convective index of interest. We note
tornadic versus hail events are statistically distinct at that for the backtrace method with NAM12 winds, the
95% confidence, as described below. shear magnitude and SRH distributions for both1644 MONTHLY WEATHER REVIEW VOLUME 147
FIG. 8. As in Fig. 5, but for LFC from nearest neighbor and back- FIG. 9. As in Fig. 5, but for maximum low-level q (between the
trace soundings. ground and 850 hPa).
tornadic versus hail events and TOR2 versus TOR1 the samples are normally distributed (95% confidence).
events are statistically distinct at 95% confidence, as Therefore, the nonparametric Kruskal–Wallis test
described below. (Kruskal and Wallis 1952) is used to test the null hy-
pothesis that the sample population median of all dis-
7) SIGNIFICANT TORNADO PARAMETER
tributions in the combinations is equal (i.e., whether
Figure 13 shows significant tornado parameter (STP), a the samples are drawn from the same underlying
compound index that takes into consideration both ther- population). The results of the tests are presented in
modynamic and kinematic information (MLCAPE, Table 4 for both the NN analysis and the NAM12
MLLCL, MLCIN, storm relative helicity, and magni- backtrace analysis and are reported at the 95%
tude shear) in an attempt to maximize discrimination be- confidence level.
tween tornadic and nontornadic supercells (Thompson The differences in CAPE are significant between
et al. 2012). When using the NAM12 winds, STP estimates tornadoes and hail only when using the NN method and
in the tornado category via the backtrace method are not when using the backtrace method, while differences
enhanced by a factor of ;2 relative to corresponding in CAPE are not significant for the tornado EF-scale in
estimates via the NN method, although they are either NN or backtrace. However, it is important to
still significantly below values in the literature. As stress that the distinction between the NN tornado and
with SRH, the STP is apparently limited by resolution hail distributions runs contrary to the values in the lit-
in winds, as the NARR analysis shows little increase erature (hence the designation ‘‘CONTRA LIT’’ in
in STP relative to NN. The backtrace analysis might Table 4); in addition, CAPE magnitudes themselves are
be further limited by the spatial resolution of the AIRS more in line with the literature using the backtrace
soundings. method. For CIN, the differences among backtrace and
NN are not significant in any category, but the CIN
8) TESTING STATISTICAL SIGNIFICANCE OF
magnitude is greatly improved with the backtrace. The
DIFFERENCES AMONG STORM REPORTS
LCL discriminates between tornadoes and hail for NN
The statistical significance of differences for each and backtrace at the 95% confidence level, but not
convective index was quantified with respect to storm within the EF scale for tornadoes. While the LFC only
report type. The statistical significance is tested sepa- discriminates for NN between tornadoes and hail, the
rately for two combinations of storm report types: (i) all larger value for hail does not agree with prior literature.
tornado events versus all hail events, and (ii) between The differences in qmax are significant between torna-
the two different tornado event categories (TOR2 and does and hail when using the backtrace method, but not
TOR1). For each convective index depicted in Figs. 5–13, the NN method. We emphasize that qmax is not a proxy
the samples are tested to determine whether each for relative humidity in which substantial differences
combination arises or does not arise from the same have been found previously (e.g., Brooks et al. 1994).
population. Using the D’Agostino and Pearson test The three dynamical indices (shear magnitude, shear
(D’Agostino and Pearson 1973), we show that none of direction, and SRH) are derived from the backtraceMAY 2019 KALMUS ET AL. 1645
FIG. 10. As in Fig. 5, but for the magnitude of 1 km wind shear. FIG. 11. As in Fig. 5, but for the directional component of 1 km
Shear is calculated from wind directions and magnitudes estimated wind shear.
from the beginning and endpoints of backtrace trajectories; there is
no NN shear estimate.
4. Sensitivity of results to methodology
An unknown magnitude of uncertainty arises from a
only. While the composite STP index is not significant substantial reduction to 6%–7% of the original sample
for NN or backtrace in both storm report difference size (Table 1). An estimate of sampling bias uncertainty
cases, there is a notable improvement in the separa- in the categorical mean and variance estimates of envi-
tion for the NAM12 over the NARR for the backtrace ronmental properties at the storm scale may not offer as
in STP. much insight as the quantification of the larger-scale
environment. Below the focus is instead on the sensi-
c. Parcel vertical ascent
tivity of environmental estimates to the choice of me-
Figure 14 shows mean parcel vertical motions by teorological forcing and the use of a mixed layer versus
storm category, from the location at the AIRS overpass most unstable parcel assumption.
time to the location of the storm event, for NARR winds
a. NARR 32 km versus NAM 12 km
(left) and NAM12 winds (right). Except at the ground
level, mean values of parcel lifting are observed at every Backtraced estimates of environmental properties
other level and every storm category. A 2–3-h time in- use two distinct meteorological forcings, NARR and
terval in between the AIRS overpass and storm event NAM12 are shown in Fig. 15 for a randomly chosen
(Fig. 1), and a typical ascent of ;300 m, translates to storm. The variations in back trajectories and moisture
vertical velocities of ;3–5 cm s –1 that are typical of profiles using NARR and NAM12 can be significant on a
synoptic-scale lift. Large-scale lifting is essential for storm-by-storm basis. With its coarser spatial (32 km)
overcoming CIN and increasing environmental favor- and temporal (3 h) resolution, the NARR is missing
ability for deep moist convection (Doswell 1987). An higher-frequency and smaller spatial variability in the
increase in ascent with height also increases the tempera- flow field relative to the NAM12 with finer spatial
ture lapse rate. In the absence of diabatic processes a (12 km) and temporal (1 h) resolution. Figure 16 shows
typical ascent of 300 m at 2 km translates to a steepening of MUCAPE using both the NARR and NAM 12 km
the 0–2 km lapse rate by 1.5 K km21. The variance of parcel across all storm categories. The set of storms remaining
ascent across storm events within each category (not in the analysis differs substantially between the two
shown) is large: level-dependent standard deviations are as meteorological forcings, due to the different back tra-
large as 400 m for the tornado and hail categories with jectories sampling different portions of the AIRS swath
NAM12 winds, and even higher for the wind categories. and are matched to different AIRS retrievals, not all of
Because of substantial differences in vertical structure in which pass our quality control criteria. Out of 1983
lifting between the lower-resolution NARR winds and NARR events and 1041 NAM12 events, the intersection
higher-resolution NAM12, we speculate that the estimated includes 757 storm events. Over those 757 storm events,
synoptic-scale lifting profiles remain model resolution- the mean value of NAM12 MUCAPE is 7% higher than
limited, and future work with higher-resolution models the mean value of NARR MUCAPE, and the correla-
(e.g., HRRR) is warranted. tion coefficient is r 5 0.77. For CIN and LCL, the mean1646 MONTHLY WEATHER REVIEW VOLUME 147
FIG. 12. As in Fig. 5, but for storm relative helicity. FIG. 13. As in Fig. 5, but for significant tornado parameter (STP).
value of NAM12 across all categories is 9% larger and for storms that occur more than an hour or two after
4% smaller than the mean value of NARR, respectively the AIRS overpass.
(not shown).
b. Mixed layer versus most unstable parcel 5. Conclusions and outlook
Thermodynamic indices from NAM12 backtraces A novel methodology is described that couples back
calculated via the most unstable parcel method and the trajectories to satellite soundings of temperature and
mixed layer parcel method (up to 100 hPa, using the specific humidity. This methodology enables more ac-
SHARPpy) were compared (Fig. 17). While the mean curate environmental estimates of satellite soundings of
CAPE varies by up to a factor of about 2, the mean temperature T and specific humidity q in the proximity
percent difference (the difference of the means divided of rapidly evolving severe convective storms relative to
by the mean of the means) across all eight subcategories the more conventional nearest neighbor approach, by
excluding the two composite categories is 32% with the accounting for changes in the environment that occur
most unstable parcel method giving higher mean values between the time of satellite overpass and the time of
in every category. This is consistent with previous layer- interest (e.g., tornado formation). The new method is
based calculations (e.g., Craven et al. 2002). For CIN, applied to the Atmospheric Infrared Sounder (AIRS)
parcel choice also makes a critical difference; the mean instrument on the EOS Aqua satellite and uses the
percent difference across all eight subcategories is 84%, NOAA Hybrid Single Particle Lagrangian Integrated
with mixed layer parcels always giving larger values of Trajectory Model (HYSPLIT) with meteorological
CIN (not shown). For LCL, the mean percent difference forcing from the North American Regional Reanalysis
across all eight subcategories is 12% with the most un- (NARR) and the 12-km resolution North American
stable parcel method being higher in every category Mesoscale Forecast System (NAM12). Nearest neigh-
(not shown). bor without backtracing (NN), as well as backtraced
soundings of T and q are estimated in proximity to NCEI
c. Thermodynamic indices versus overpass/storm
Storm Event tornadoes, large hail $ 2 in. diameter, and
initiation time delay
thunderstorm wind gusts $ 65 mph. While parcel T is
We examined how the thermodynamic indices, as adjusted adiabatically for vertical motions, parcel q is
estimated via the NN method and the backtrace not adjusted for possible precipitation. Verification of
method, varied as a function of the time difference the storm mode (i.e., tornadic supercell, nontornadic
between the AIRS overpass (at approximately 1330 supercell, or nonsupercellular thunderstorm) underlying
local time) and the reported storm initiation time. the reported event types was not attempted; therefore,
Figure 18 shows that estimates from the two methods the categories reported likely contain mixing between
tend to converge at small time differences, as expected, storm modes, decreasing our ability to discriminate be-
and tend to diverge as the time difference increases, tween the categories in subsequent analysis. Future
especially for CAPE and CIN. Much of the benefit of work could mitigate this limitation by using additional
the backtrace method comes from correcting estimates datasets to categorize events by storm mode.MAY 2019 KALMUS ET AL. 1647
TABLE 4. Shown are the results for the nonparametric Kruskal-Wallis test (Kruskal and Wallis, 1952). ‘‘NO’’ symbolizes that the test did
not pass (p value .0.05), while ‘‘YES’’ symbolizes that the test did pass (p value ,0.05). The bold italic font denotes instances where one
method (either NN or backtrace) allows for distinguishing between the samples while the other method does not. ‘‘CONTRA LIT’’
indicates that the test did pass, but that the sign of the separation between the distributions is in clear contradiction to the body of previous
estimates in the literature. All p values are reported in parentheses. The backtrace results are obtained with the NAM12.
Convective parameter NN tornado vs hail NN TOR1 vs TOR2 Backtrace tornado vs hail Backtrace TOR1 vs TOR2
CAPE CONTRA LIT NO NO NO
(3 3 1026) (0.1) (0.7) (0.2)
CIN NO NO NO NO
(0.05) (0.1) (0.5) (0.9)
LCL YES NO YES NO
(3 3 1024) (0.4) (0.002) (0.2)
LFC YES NO NO NO
(6 3 1026) (0.7) (0.5) (0.6)
q_max NO NO YES NO
(0.1) (0.3) (0.009) (0.5)
Shear magnitude — — YES YES
(4 3 10219) (2 3 1023)
Shear direction — — NO NO
(0.5) (0.5)
SRH — — YES YES
(5 3 10223) (7 3 1024)
STP NO NO NO NO
(0.5) (0.3) (0.3) (0.2)
The backtracing methodology unlocks a previously convective inhibition (CIN) are derived for backtracing
untapped potential of the utility of polar-orbiting sat- than NN soundings. This method may also offer a
ellites in quantifying the favorability of the thermody- pathway forward to determine optimal satellite sound-
namic environment for convective initiation and storm ing locations in proximity to severe convective storms.
evolution. This utility is afforded by accounting for The results show some sensitivity to the choice of winds
temporal gaps between the satellite overpasses, and (NARR versus NAM12) for HYSPLIT, and suggest that
furthermore by providing a continuous record of the the method remains resolution-limited even with the
evolution of T and q during these temporal gaps which, 12-km winds.
in future work, could yield insight into storm evolution. There is potential in the near future to further en-
The 1330 local time overpass of the AIRS instrument hance the spatial (and possibly vertical) resolution and
is ideal for observing subsequent severe weather to otherwise enhance the information content of
outbreaks over the North American continent that ini- backtraced profiles via 1) AIRS soundings at 13.5 km
tiate after the satellite overpass. More realistic values resolution that are produced for targeted studies (Irion
of convective available potential energy (CAPE) and et al. 2018); 2) 3-km HRRR winds to drive HYSPLIT;
FIG. 14. Mean parcel vertical motions by storm category, from the site of the AIRS overpass to the site of the storm
event, for (left) NARR winds and (right) NAM12 winds.1648 MONTHLY WEATHER REVIEW VOLUME 147
FIG. 15. A single storm, an EF4 tornado on 24 May 2011, analyzed with (left) NARR winds and (right) NAM12
winds. (top) Backtrace contours, with color indicating height (orange is near ground, blue is near 200 hPa).
(bottom) Water vapor profiles; cyan are from the AIRS NN retrieval, while blue is from the backtraced parcels. The
dt notations in the legends indicate the time difference between the NN matchup and the storm event in hours.
3) spatial kriging (interpolation via Gaussian process This new methodology could also be utilized to de-
regression) between AIRS soundings to extract the in- velop semicontinuous spatial maps of time-dependent
formation contained in spatial gradients (Cressie and soundings and derived convective indices in regions
Johannesson 2008); and 4) coupling the surface and suspected of having convective potential by applying
boundary layer in a physically consistent manner (Agard forward tracing in time to hundreds or thousands of
and Emanuel 2017) to further enhance the realism of neighboring satellite soundings. This approach is a type
convective indices in the presence of soil moisture var-
iability (e.g., Schär et al. 1999; Hohenegger et al. 2009).
Furthermore, the accuracy of convective indices could
be improved by using surface values of T and q from
nearby ground stations in place of surface AIRS re-
trievals of T and q as demonstrated by Gartzke et al.
(2017). There is also the potential to quantify the time
evolution of environments in proximity to long-lived
supercells or organized convective systems, either by
calculating a series of backtraces with time along the
supercell or convective system trajectory or using
soundings from multiple polar-orbiting satellites with
varying overpass times. The diurnal cycle is a key aspect
to the evolution of severe weather outbreaks (e.g.,
Agard and Emanuel 2017) and a time series of back-
traces from one or more hyperspectral infrared sound-
ing instruments would yield new insight on the diurnal FIG. 16. MUCAPE calculated from two meteorological analyses,
variability of convective indices. NAM12 and NARR (using SHARPpy).You can also read