Tidal response to sea level rise and bathymetric changes in the German Wadden Sea - henry
←
→
Page content transcription
If your browser does not render page correctly, please read the page content below
Article, Online First,

Wachler, Benno; Seiffert, Rita; Rasquin, Carolin; Kösters, Frank
Tidal response to sea level rise and bathymetric changes in
the German Wadden Sea
Ocean Dynamics (Online First)

Verfügbar unter/Available at: https://hdl.handle.net/20.500.11970/107145

Vorgeschlagene Zitierweise/Suggested citation:
Wachler, Benno; Seiffert, Rita; Rasquin, Carolin; Kösters, Frank (2020): Tidal response to
sea level rise and bathymetric changes in the German Wadden Sea. In: Ocean Dynamics
(Online First). https://doi.org/10.1007/s10236-020-01383-3.

Standardnutzungsbedingungen/Terms of Use:

Die Dokumente in HENRY stehen unter der Creative Commons Lizenz CC BY 4.0, sofern keine abweichenden
Nutzungsbedingungen getroffen wurden. Damit ist sowohl die kommerzielle Nutzung als auch das Teilen, die
Weiterbearbeitung und Speicherung erlaubt. Das Verwenden und das Bearbeiten stehen unter der Bedingung der
Namensnennung. Im Einzelfall kann eine restriktivere Lizenz gelten; dann gelten abweichend von den obigen
Nutzungsbedingungen die in der dort genannten Lizenz gewährten Nutzungsrechte.
Documents in HENRY are made available under the Creative Commons License CC BY 4.0, if no other license is
applicable. Under CC BY 4.0 commercial use and sharing, remixing, transforming, and building upon the material
of the work is permitted. In some cases a different, more restrictive license may apply; if applicable the terms of
the restrictive license will be binding.
Ocean Dynamics
https://doi.org/10.1007/s10236-020-01383-3

Tidal response to sea level rise and bathymetric changes
in the German Wadden Sea
Benno Wachler 1         &   Rita Seiffert 1 & Caroline Rasquin 1 & Frank Kösters 1

Received: 5 September 2019 / Accepted: 13 May 2020
# The Author(s) 2020

Abstract
Tidally dominated coasts are directly affected not only by projected rise in mean sea level, but also by changes in tidal dynamics
due to sea level rise and bathymetric changes. By use of a hydrodynamic model, which covers the entire German Bight (South-
Eastern North Sea), we analyse the effects of sea level rise and potential bathymetric changes in the Wadden Sea on tidal current
velocities. The model results indicate that tidal current velocities in the tidal inlets and channels of the Wadden Sea are increased
in response to sea level rise. This is explained by the increased ratio of tidal prism to tidal inlet cross-sectional area, which is due
to the characteristic hypsometry of tidal basins in the Wadden Sea including wide and shallow tidal flats and relatively narrow
tidal channels. The results further indicate that sea level rise decreases ebb dominance and increases flood dominance in tidal
channels. This is, amongst others, related to a decreased intertidal area again demonstrating the strong interaction between tidal
wave and tidal basin hypsometry in the Wadden Sea. The bathymetry scenario defined in this study includes elevated tidal flats
and deepened tidal channels, which is considered a potential future situation under accelerated sea level rise. Application of these
bathymetric changes to the model mostly compensates the effects of sea level rise. Furthermore, changes in current velocity due
to the altered bathymetry are in the same order of magnitude as changes due to mean sea level rise. This highlights the
significance of considering potential bathymetric changes in the Wadden Sea for regional projections of the tidal response to
sea level rise.

Keywords Sea level rise . Tidal basin . Tidal asymmetry . Hypsometric control . Hydrodynamic model . Wadden Sea

1 Introduction                                                         dissipated (Stanev et al. 2014; Rasquin et al. 2020). Jacob
                                                                       et al. (2016) have shown that even relatively small bathymet-
Sea level rise affects tides on all spatial scales ranging from        ric changes in the Wadden Sea (observed differences from
global scale, i.e. oceans (Pickering et al. 2017), to regional         2000 to 2011) are able to substantially modify the local and
scale, i.e. continental shelves such as the European continental       remote response of tidal dynamics in the North Sea. Hence,
shelf (Pickering et al. 2012; Pelling et al. 2013; Pelling and         for estimating future modifications of tidal dynamics in the
Green 2014), and local scale, i.e. coastal waters such as the          German Bight, not only effects of sea level rise itself are rel-
German Bight (Rasquin et al. 2020) and its estuaries (Seiffert         evant, but also feedbacks of bathymetric changes in the
et al. 2014). At the same time, tidal dynamics depend on the           Wadden Sea that are induced by sea level rise. This is also
bathymetry. This is especially important in shelf seas like the        important with regard to the estimation of coastal protection
North Sea and in extremely shallow coastal waters such as the          design heights (Arns et al. 2017). The model domains in
Wadden Sea in the German Bight, where the tidal signal is              existing process-based numerical modelling studies, which
strongly distorted and a large amount of tidal energy is               investigate the long-term morphodynamic response of the
                                                                       Wadden Sea to sea level rise (Dissanayake et al. 2012;
                                                                       Becherer et al. 2018), include only a single tidal basin.
Responsible Editor: Emil Vassilev Stanev
                                                                       However, the hydro- and morphodynamic response of the
                                                                       Wadden Sea to accelerated sea level rise could be spatially
* Benno Wachler
  benno.wachler@baw.de
                                                                       diverse due to local differences in tidal forcing, sediment
                                                                       availability, and other factors. Therefore, the results of local
1
                                                                       models cannot be transferred to the Wadden Sea in general. In
    Department Hydraulic Engineering in Coastal Areas, Federal
                                                                       this study, we use a hydrodynamic model that covers almost
    Waterways Engineering and Research Institute, Hamburg, Germany
Ocean Dynamics

the entire Wadden Sea with a resolution that allows to draw          which is important for the correct simulation of non-linear
more general conclusions regarding the tidal response of the         hydrodynamic effects in tidally dominated, shallow coastal
Wadden Sea to a rise in sea level and to evaluate regional           waters like the Wadden Sea, where the mean depth is compa-
differences within the Wadden Sea.                                   rable with the tidal range.
   The aim of our study is threefold. Firstly, we investigate the        The model covers the entire German Bight (Fig. 1) and
tidal response to a sea level rise of 0.8 m, which represents a      comprises almost the entire Wadden Sea except for the
likely estimate for the end of the twenty-first century in case of   Western part of the Dutch Wadden Sea. The three major es-
the emission scenario RCP8.5 defined by the IPCC (Church             tuaries of the German Bight (rivers Elbe, Weser, and Ems) are
et al. 2013). Secondly, based on an extensive literature re-         included up to the weirs defining the tidal limit. The horizontal
search, we estimate potential, systematic morphologic chang-         model resolution is highest in the coastal waters of the German
es in the Wadden Sea in response to an accelerated sea level         Bight, i.e. in the Wadden Sea, estuaries, and foreshore area
rise within the twenty-first century. We transfer these findings     (between 100 and 400 m), and decreases continuously to-
into schematic changes of the model bathymetry (Section 2.3).        wards the open sea boundary (about 5000 m). The model grid
Thirdly, we analyse the hydrodynamic feedbacks of the                consists of around 100,000 grid cells horizontally. A z-layer
changes applied to the model bathymetry. We compare the              model is used to resolve the vertical dimension. The vertical
effects of these bathymetric changes in the Wadden Sea to            resolution is 1 m up to a depth of 28 m and continuously
the effects of sea level rise. Special emphasis is placed on         decreases in several steps from 2 to 10 m for greater depths.
whether the changes induced by the bathymetric changes                   At the open sea boundary, the German Bight model is
compensate or reinforce the changes induced by sea level rise.       forced by water levels from the Dutch Continental Shelf
The results are mainly analysed in terms of maximum flood            Model DCSMv6FM, which is a further development of the
and maximum ebb current velocity as well as the ratio be-            Dutch Continental Shelf Model DCSMv6 (Zijl et al. 2013; Zijl
tween both as these parameters are most suitable to demon-           et al. 2015). Since this shelf model covers the entire North-
strate changes in tidal asymmetries in tidal inlet systems. In       Western European continental shelf (Fig. 1), it captures shal-
turn, the focus on tidal asymmetry of current velocity is large-     low water effects generated on the shelf. Sea level rise is
ly motivated by its significance for the residual transport of       introduced by adding a constant value to water levels at the
sediment and thus the morphologic development of the                 open boundary of the shelf model. In this way, shallow water
Wadden Sea. The structure of this paper is as follows. A short       effects on the shelf and its potential changes with sea level rise
description of the model setup, the model validation, the ap-        are included in the forcing of the regional German Bight mod-
plied scenarios (sea level rise and bathymetric change), and         el. In turn, we assume that along the open boundary of the
applied analysis methods follows in Section 2. Results are           shelf model, which is located in the deep ocean of the North
elaborated in Section 3. Section 4 discusses the physical pro-       Atlantic, tidal forcing is not significantly changed in response
cesses, which could be responsible for the observed effects of       to the considered sea level rise of 0.8 m according to findings
sea level rise and bathymetric changes, respectively. Finally, a     of e.g. Pickering et al. (2017), who predict M2 amplitude
conclusion is given in Section 5.                                    changes between − 2 and + 2 cm along the open boundary
                                                                     of the shelf model for a sea level rise of 2 m.
                                                                         In the German Bight model as well as in the shelf model,
2 Methods                                                            wind friction is induced by atmospheric forcing (wind fields
                                                                     and atmospheric pressure at 10 m above sea surface) from the
2.1 Hydrodynamic model and model setup                               reanalysis data COSMO-REA6 with a resolution of approxi-
                                                                     mately 6 km (Hans-Ertel-Centre for Weather Research;
For this study, the three-dimensional hydrodynamic model             Bollmeyer et al. 2015). While the effect of wind forcing on
UnTRIM is used that solves the shallow water equations on            currents and surge is included in the model, the generation of
an unstructured grid, consisting of triangles and rectangles         wind waves is not included. The German Bight model in-
(Casulli and Walters 2000). This model is suitable for the           cludes transport of salt. Local bed friction is calculated accord-
simulation of complex, three-dimensional flows. An unstruc-          ing to spatially constant ripple roughness and spatially vari-
tured grid enables an efficient spatial resolution in environ-       able grain roughness, which is based on the measured sedi-
ments of complex bathymetry as it can be fitted to morpho-           ment distribution (assembled by Milbradt et al. 2015b). River
logic structures and allows for a highly variable model reso-        discharge at the landward open boundaries in the three estu-
lution. Therefore, it is especially appropriate for the simulation   aries of the rivers Elbe, Weser, and Ems is based on measure-
of tidal flows in the Wadden Sea with its intertidal flats           ments from the Federal Waterways and Shipping
intersected by a morphologically diverse channel system in-          Administration (WSV). The bathymetric data is mainly based
cluding highly curved channels (Fig. 1). The model contains a        on data provided by the DHI (Danish Hydrological Institute)
flooding and drying scheme (Casulli and Walters 2000),               and the BSH (Federal Maritime and Hydrographic Agency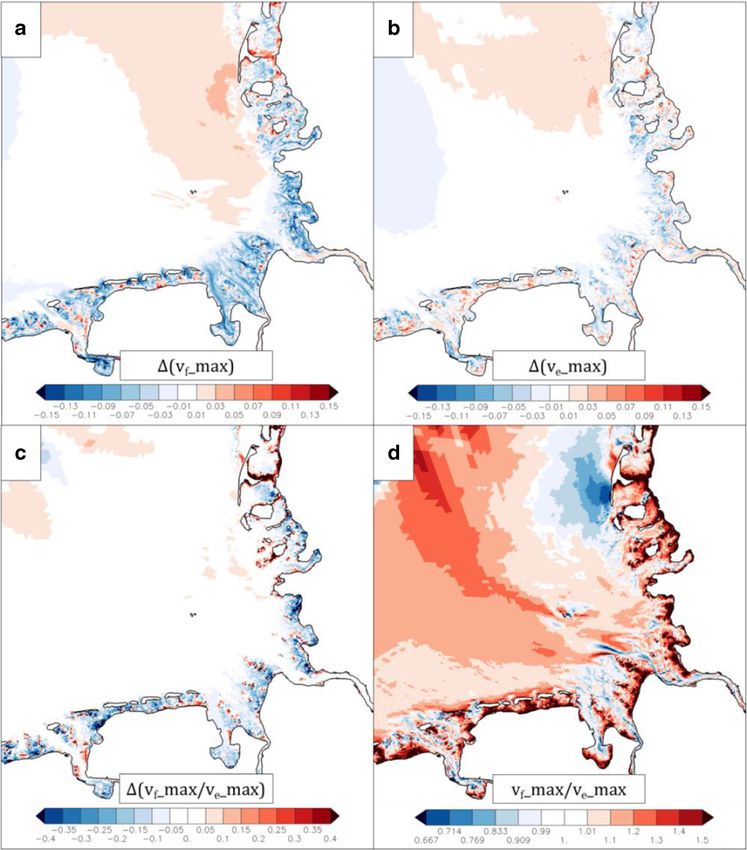
Ocean Dynamics
Fig. 1 Domain of the German Bight model with locations of tide gauges grey-dashed box denotes the area used for evaluation of model results.
(red dots) used for validation (water-level stations shown in Fig. 2 are The domain of the shelf model is given on the right; within this map, the
marked with a yellow frame). The shallow areas with elevations between position of the German Bight model is indicated
± 1 mNHN roughly represent the intertidal flats of the Wadden Sea. The
Germany). These data are updated with bathymetric data from demonstrates the average magnitude of water-level deviations
the project AufMod (Milbradt et al. 2015b) in the shallow from the respective mean water level and thus roughly repre-
coastal zone. sents the half of the simulated or measured tidal range. The
normalised standard deviation is the ratio of the standard devi-
2.2 Model validation ation of the simulation relative to the standard deviation of the
measurements. It is an indicator of how well the simulated tidal
In the following, the validity of the German Bight model is range fits to the measurements and if the tidal range is
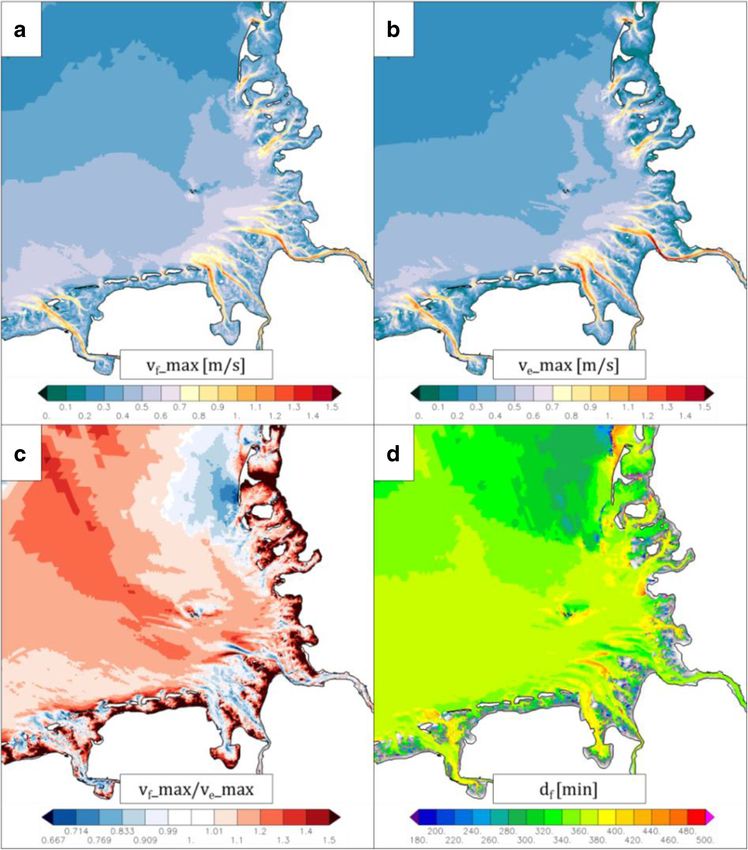
analysed. Figure 2 shows time series of water levels from overestimated (in case of STD* > 1) or underestimated (in case
model simulations and measurements at four different stations of STD* < 1) by the model. Locations with largest deviations
within the German Bight (see Fig. 1 for positions) covering a between model and observation are located at the North Frisian
full spring-neap tidal cycle in July 2010. coast, while the locations at the East Frisian coast show smaller
The tidal low water is generally overestimated, while the tidal differences (Fig. 3). Within the estuaries, tidal dynamics are
high water is mostly underestimated by the model (Fig. 2). represented well with smallest errors obtained in the Weser
Thus, the tidal range is underestimated. Nevertheless, the model and Elbe estuaries (Fig. 3). Overall, it is concluded that the
well captures the propagation of the tidal wave throughout the model validity is sufficient to correctly determine regional-
German Bight and its shallow coastal areas including general scale changes of tidal dynamics in response to changes in sea
features like an increasing tidal range towards the inner German level or bathymetry.
Bight (compare Fig. 2 b and c with Fig. 2 a and d) and an
increasing distortion of the tidal signal towards the coast. The 2.3 Setup of a bathymetry scenario for the Wadden
overall agreement of the simulation with measurements is also Sea
confirmed by rather small values for the root mean square error
(RMSE) (0.22 m on average), root mean square difference The bathymetry scenario applied in this study is based on a
(uRMSD) (0.21 m on average), and bias (0.08 m on average) literature review and aims at representing a first approxima-
as well as by a high correlation (0.993 on average) and a nor- tion of the morphodynamic response of the Wadden Sea to a
malised standard deviation near 1 (0.83 on average) as shown in sea level rise of 0.8 m within the twenty-first century.
Fig. 3 and Table 1 (see Fig. 1 for positions of water-level sta- A fundamental assumption of the bathymetry scenario con-
tions). The standard deviation for simulation and measurement sidered in this study is the existence of a theoretical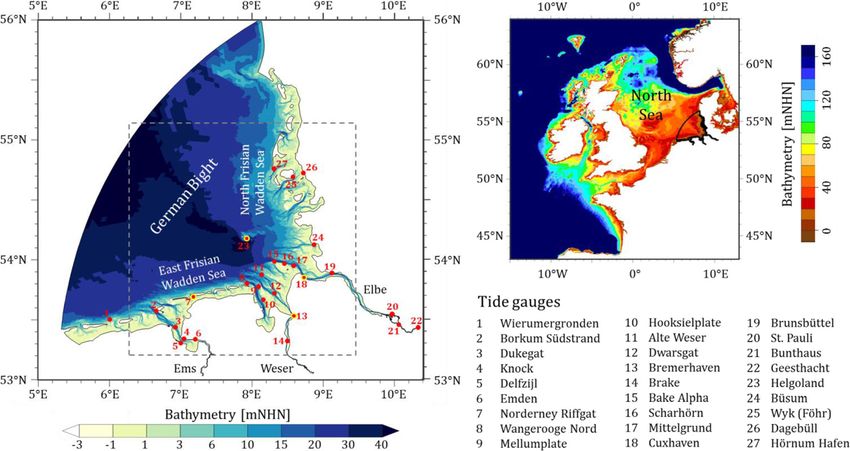
Ocean Dynamics

Fig. 2 Water levels at Norderney Riffgat (a), Bremerhaven (b), Cuxhaven (c), and Helgoland (d) from measurements (black) and model simulations
(red) for a period of 16 days (~ 1 spring-neap cycle)

morphological equilibrium state of a tidal inlet system com-             and channel systems. However, for the setup of a bathymetry
posed of the morphologic macro elements tidal inlet (and                 scenario, specific values for these vertical adjustments need to
channels), tidal flats, and (sometimes) ebb tidal delta. When            be defined. Based on numerical modelling studies of e.g.
the hydrodynamic conditions change (e.g. due to mean sea                 Dissanayake et al. (2012) or Becherer et al. (2018), a valid
level rise), the net sediment exchange between these morpho-             assumption in the setup of the bathymetry scenario is that the
logic macro elements is adjusted to attain a new state of mor-           tidal flat growth is not sufficient to fill the sediment deficit
phological equilibrium. Therefore, the morphological devel-              created by an accelerated sea level rise of 0.8 m within the
opment of the different elements should not be considered                twenty-first century. For this sea level rise scenario, we assume
isolated from each other (De Vriend 1996, van Goor et al.                a vertical growth of tidal flats by 0.5 m, which lies in between
2003). The morphologic macro elements are likely to respond              the mean sea level rise of the last few thousand years (~ 0.1 to
with different vertical adjustments in response to sea level rise,       0.2 m per century), that was fully balanced by tidal flat growth,
especially in case of a high rate of sea level rise, such as the         and a tidal flat growth, which would fully balance the consid-
scenario investigated in this study (0.8 m per century). Sea             ered sea level rise of 0.8 m.
level rise induces an increase of residual sediment transport               The potential of tidal flats to adapt morphodynamically to
from the ebb tidal deltas and channels to the flats (van Goor            an accelerated sea level rise by accretion significantly depends
et al. 2003; Hofstede 2002), which leads to accretion of tidal           on the sediment availability (van Goor et al. 2003). In turn,
flats as well as to erosion of tidal inlets and potentially ebb          sediment availability depends on both internal and external
tidal deltas. Therefore, the bathymetry scenario as defined              sediment sources. External sediments are potentially provided
herein includes different changes in height for tidal channel            by the foreshore area, barrier islands, ebb tidal deltas, or flu-
systems and tidal flats, respectively.                                   vial input and may originate from distant sites as sediments in
    Based on the preceding considerations, qualitative estimates         the nearshore coastal waters of the German Bight are
for the vertical adjustment of the morphologic macro elements            transported via alongshore transport pathways (Zeiler et al.
in tidal basins of the Wadden Sea can be made including a                2000 and references therein; Zeiler et al. 2014; Milbradt
vertical growth of tidal flats and a deepening of tidal inlets           et al. 2015a; Valerius et al. 2015). With regard to the results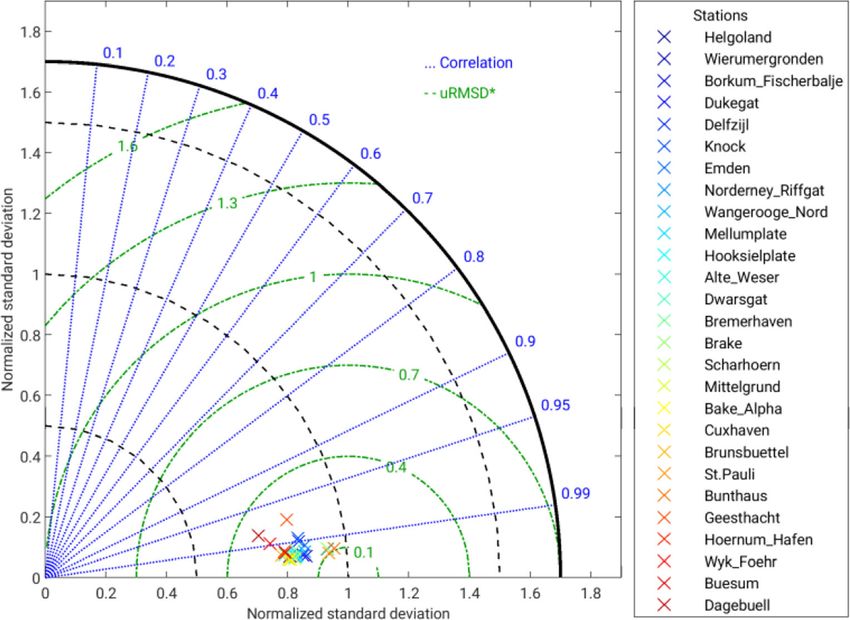
Ocean Dynamics

Fig. 3 Validation of simulated water levels against measurements at          simulated and measured water-level curves fits to each other. The
different stations in the German Bight (see Fig. 1 for positions) by means   uRMSD demonstrates the relative frequency of outliers as larger errors
of the Taylor diagram including normalised standard deviation STD* (see      have a disproportionately large effect on uRMSD. In turn, the uRMSD*
Table 1 for the respective standard deviation of simulation and              compares the simulated frequency of outliers relative to measurements. A
measurement), correlation, and the resultant normalised root mean square     perfect fit is located at a correlation of 1 (on the x-axis), a STD* of 1, and a
difference (uRMSD*). The correlation represents how the shape of the         uRMSD* of 0

of Dissanayake et al. (2012) and Becherer et al. (2018), it is               sediment supply and thus could be diverse. For example,
assumed that the sediment availability from external sediment                while Dissanayake et al. (2012) observe an erosion of the
sources will not be sufficient to completely balance the sedi-               ebb tidal delta, van Maanen et al. (2013) observe an expansion
ment demand that is created on the tidal flats in case of signif-            towards the open sea.
icantly accelerated sea level rise. In this case, an increasing                  We point out that the bathymetry scenario defined here
amount of sediment from internal sediment sources (tidal in-                 represents a first estimate of systematic changes in the
let, channels, and possibly ebb tidal delta) is supposed to ad-              Wadden Sea bathymetry under a sea level rise of 0.8 m to-
ditionally fill the sediment demand on the tidal flats (de Ronde             wards the end of the twenty-first century and thus includes
and de Ruijter 1987; Hofstede 2002) leading to erosion of the                assumptions and simplifications, which we summarise in the
tidal inlet as reported by Dissanayake et al. (2012), Becherer               following.
et al. (2018), and van Maanen et al. (2013). Accordingly, for                    First, for the barrier islands of the East Frisian Wadden Sea,
the scenario of 0.8 m of sea level rise within the twenty-first              a landward shift has been proposed for a future rise in sea level
century, we assume a deepening of the tidal channel systems                  (Flemming and Bartholomä 1997). However, barrier islands
by 0.2 m in our bathymetry scenario, which implicates the                    are excluded from the model domain, which implies the as-
assumption that roughly a third of the added tidal flat volume               sumption of stable barrier islands in accordance with current
originates from the tidal channels. Our assumption that tidal                coastal protection policies.
flats and tidal channels may experience different trends in                      Second, wind waves are known to have a mainly
elevation changes is further supported by an aggregated anal-                erosional effect on tidal flats (Bartholomä et al. 2009;
ysis of morphodynamic observations indicating accretion on                   Hirschhäuser and Zanke 2004; Wilkens and Mayerle
tidal flats and erosion in tidal channels in most tidal basins of            2005; Lettmann et al. 2009). This erosional effect of
the German Wadden Sea in the period from 1998 to 2016                        wind waves may increase as sea level rise increases
(Benninghoff and Winter 2019). In our bathymetry scenario,                   the water depth. However, we assume that (for the con-
the elevation and lateral extension of the ebb tidal deltas is not           sidered scenario of 0.8 m rise in sea level by the end of
changed, since the individual morphodynamic response of                      the twenty-first century) the export of sediment induced
ebb tidal deltas to sea level rise strongly depends on                       by wind waves will not exceed the total import of
Ocean Dynamics

Table 1 Root mean square error
(RMSE), root mean square            Station                RMSE   uRMSD        Bias      Corr.   STD        STD_mea        STD*
difference (uRMSD), bias,                                  (m)    (m)          (m)               (m)        (m)
correlation, and standard
deviation (STD) of simulated        Helgoland              0.20   0.19           0.08    0.996   0.74       0.92           0.81
time series of water levels com-    Wierumergronden        0.12   0.09           0.07    0.995   0.73       0.78           0.93
pared with measurements at dif-     Borkum_                0.16   0.14           0.08    0.996   0.77       0.89           0.86
ferent stations in the German         Fischerbalje
Bight (see Fig. 1 for positions).   Dukegat                0.17   0.16           0.04    0.996   0.83       0.98           0.85
Standard deviation for measure-
ments (STD_mea) was used for        Delfzijl               0.23   0.22           0.07    0.990   0.92       1.09           0.84
calculation of normalised stan-     Knock                  0.23   0.23           0.05    0.988   0.90       1.07           0.84
dard deviation (STD*) shown in      Emden                  0.23   0.21           0.10    0.992   1.00       1.16           0.86
Fig. 3
                                    Norderney_Riffgat      0.19   0.16           0.10    0.995   0.79       0.92           0.86
                                    Wangerooge_Nord        0.22   0.21           0.08    0.995   0.91       1.09           0.83
                                    Mellumplate            0.24   0.21           0.10    0.996   0.94       1.14           0.83
                                    Hooksielplate          0.24   0.23           0.06    0.996   1.04       1.25           0.83
                                    Alte_Weser             0.23   0.21           0.08    0.996   0.90       1.10           0.82
                                    Dwarsgat               0.32   0.28           0.15    0.996   0.99       1.25           0.79
                                    Bremerhaven            0.29   0.27           0.09    0.994   1.14       1.37           0.83
                                    Brake                  0.16   0.16         − 0.01    0.995   1.27       1.36           0.93
                                    Scharhörn              0.25   0.24           0.09    0.997   0.95       1.18           0.81
                                    Mittelgrund            0.24   0.22           0.09    0.997   0.95       1.16           0.83
                                    Bake_Alpha             0.24   0.23           0.06    0.997   0.91       1.13           0.81
                                    Cuxhaven               0.24   0.24           0.05    0.997   0.92       1.14           0.80
                                    Brunsbüttel            0.27   0.24           0.11    0.996   0.82       1.04           0.78
                                    St. Pauli              0.14   0.13           0.06    0.996   1.18       1.26           0.94
                                    Bunthaus               0.13   0.12           0.02    0.995   1.11       1.16           0.96
                                    Geesthacht             0.11   0.11           0.03    0.973   0.32       0.39           0.82
                                    Hörnum_Hafen           0.19   0.18           0.08    0.994   0.61       0.77           0.79
                                    Wyk_Föhr               0.33   0.29           0.15    0.989   0.77       1.03           0.75
                                    Büsum                  0.31   0.29           0.09    0.995   1.03       1.30           0.79
                                    Dagebüll               0.36   0.35           0.10    0.981   0.76       1.06           0.72
                                    Mean of all stations   0.22   0.21           0.08    0.993   0.90       1.07           0.83

sediment induced by mechanisms including flood-                   support our assumption that tidal flats will be generally
dominant tidal current asymmetry related to overtide              elevated and not deepened.
formation (Speer and Aubrey 1985; Friedrichs and                     Finally, we do not consider the effects of conditions or
Aubrey 1988), landward decrease in tidal current ampli-           mechanisms, which are potentially relevant for sediment dy-
tude in combination with settling lag and scour lag ef-           namics and budgets on a rather local scale and which could
fects (van Straaten and Kuenen 1957; Postma 1961;                 result in regionally different morphologic developments with-
Groen 1967; Hoitink 2003; Pritchard and Hogg 2003;                in the Wadden Sea. These include:
Gatto et al. 2017), and gravitational circulation induced
by horizontal density gradients (i.e. mainly due to salin-        (1) Sediment availability (e.g. van Goor et al. 2003; Maan
ity gradients) in combination with tidal straining                    et al. 2018), which depends on the suspended sediment
(Burchard et al. 2008; Burchard and Hetland 2010;                     concentration at the seaward boundary of the tidal inlet
Flöser et al. 2011; Burchard and Badewien 2015).                      system, i.e. in the nearshore zone of the German Bight
Also note that the wind intensity is assumed to remain                (Puls et al. 1999; Gayer et al. 2006), the magnitude of the
unchanged throughout the twenty-first century, since no               alongshore transport (“sediment bypassing”) off the
significant long-term changes of wind speed over the                  Wadden Sea (Zeiler et al. 2000; Zeiler et al. 2014), the
North Sea could be detected in ensembles of recent                    riverine input in the vicinity of estuaries (Gayer et al.
model projections (Ganske et al. 2016). With regard to                2006), the erodibility of tidal channels and foreshore area
our bathymetry scenario, these considerations further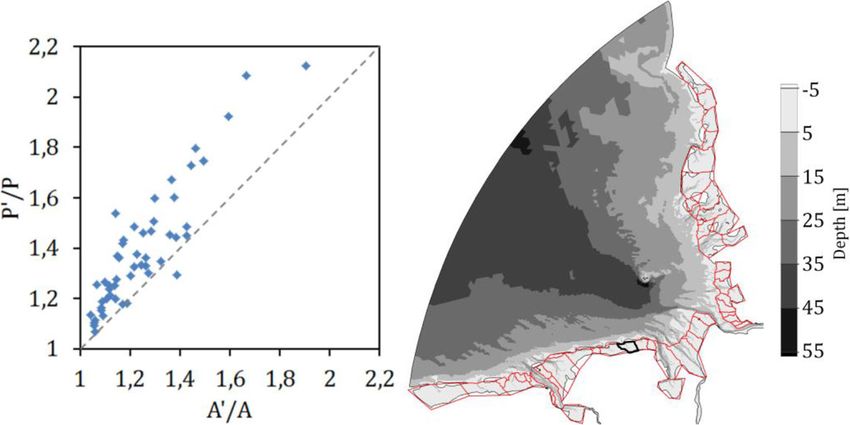
Ocean Dynamics
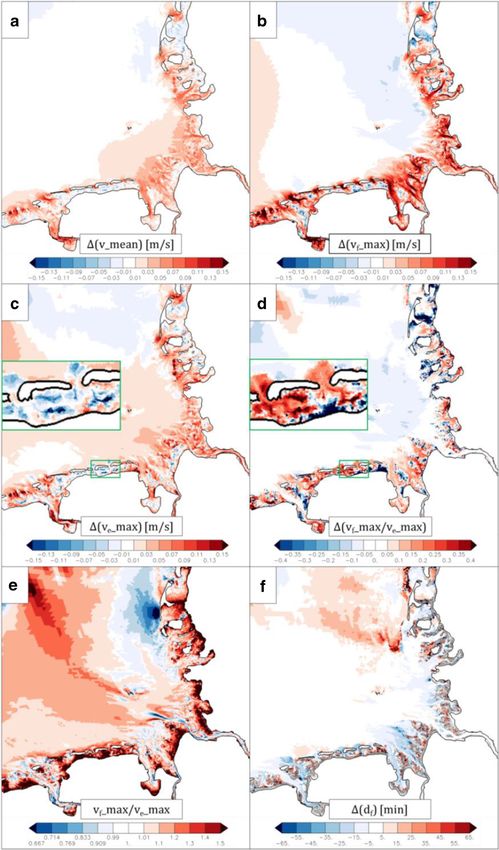
Fig. 4 Maximum flood current velocity vf_max (a), maximum ebb current velocity ve_max (b), ratio of maximum flood current velocity to maximum ebb
current velocity vf_max/ve_max (c), and flood current duration df (d) in the reference condition
(Ricklefs and Asp Neto 2005), and anthropogenic sand (4) Tidal basin–specific geometry affecting tidal
supply (Stive et al. 2013) asymmetries (e.g. Dronkers 1986; Friedrichs et al.
(2) Composition of available sediment, i.e. availability of 1990) and related residual sediment transports
fine sediments (silt and clay) affecting the growth rate (5) Exposure of tidal flats to wind (Allen and Duffy 1998;
of tidal flats (van Ledden et al. 2004) and the general Fagherazzi and Wiberg 2009) and tidal inlet depth and
stability of sand beds (e.g. Le Hir et al. 2011; Bartzke orientation relative to the dominant wind direction affect-
et al. 2013) ing the propagation of swell into the tidal basin
(3) Tidal range affecting the ability to import the available (6) Biological effects on the non-vegetated tidal flats
sediment (e.g. van der Wegen 2013; Hofstede et al. (Kraeuter and Wetzel 1986; Hirschhäuser 2003;
2016) Beukema 2002) and on the salt marshes (Mariotti andOcean Dynamics
Ocean Dynamics
Fig. 5 Effect of the 0.8-m sea level rise on mean tidal current velocity current duration), which may reveal opposite directions
vmean (a), maximum flood current velocity vf_max (b), maximum ebb (Fofonova et al. 2019). Here we mainly use the ratio of max-
current velocity ve_max (c), ratio of maximum flood current velocity to
maximum ebb current velocity vf_max/ve_max (d), and flood current
imum flood current velocity to maximum ebb current velocity
duration df (f). Ratio of maximum flood current velocity to maximum for identification of tidal asymmetry. Changes in tidal current
ebb current velocity vf_max/ve_max at the scenario of the 0.8-m sea level velocities give first-order indications for potential
rise (e). The detailed view of a section of the East Frisian Wadden Sea in morphodynamic changes in the tidal inlets of the Wadden
the insets of c and d is shown to better visualise the along-channel dif-
ferences described in the text
Sea, where tidal currents have been suggested to be the main
driver of morphologic activity by using a simplistic manner of
data assimilation (annual topographies) in morphodynamic
Fagherazzi 2010; Kirwan and Megonigal 2013; Best modelling (Kösters and Winter 2014). In turn, the focus on
et al. 2018) tidal asymmetry of current velocity is largely motivated by its
(7) Anthropogenic changes in bathymetry and tidal basin significance for the residual transport of sediment and thus the
geometry, including the construction of hard structures morphologic development (sediment budget) of the tidal flats
such as dams along tidal watersheds (Ahrendt 2006), the of the Wadden Sea.
reduction of tidal basin size as a result of land reclama-
tion (Elias et al. 2012; Becherer et al. 2018), subsurface
deepening as a result of gas extraction (Dijkema 1997; 3 Results
Marquenie and Vlas 2005; van Thienen-Visser et al.
2015), and the deepening of navigational channels 3.1 Reference condition
(Benninghoff and Winter 2018).
On the tidal flats, flood current velocity (Fig. 4a) is generally
Note that in contrast to these local factors, sea level rise is a stronger than ebb current velocity (Fig. 4b) indicating flood
global factor, which is relevant within the entire Wadden Sea. dominance (red areas in Fig. 4c). In contrast, many tidal chan-
nel systems generally reveal no flood dominance at all or only
weak flood dominance in a few subsections. In fact, the sea-
2.4 Model simulations and analysis ward reaches of the tidal inlets (in the vicinity of the ebb tidal
deltas) rather show ebb dominance (blue areas in Fig. 4c).
To analyse the effects of sea level rise and bathymetric changes, This spatial pattern is especially significant in the tidal inlets
we perform three simulations. The first simulation represents the of the East Frisian Wadden Sea. Hence, tidal flats and tidal
reference condition, which does not include any changes in sea channels reveal significant differences in tidal asymmetry of
level or model bathymetry. The second simulation includes a sea current velocity. Finally, the tidal inlet systems of the German
level rise of 0.8 m, which is introduced at the ocean boundary of Wadden Sea reveal regional differences in tidal asymmetry as
the shelf model (Section 2.1). The third simulation includes a sea indicated by the ratio of maximum flood current velocity to
level rise of 0.8 m and bathymetric changes in the Wadden Sea maximum ebb current velocity (Fig. 4c) and the flood current
according to the scenario described in Section 2.3. The simula- duration (Fig. 4d). Note that the tidal current velcities and tidal
tions cover a period in summer 2010 with generally low wind asymmetries described here are vertically averaged and that
speed and low to moderate discharge from the Elbe, Weser, and deviations from the vertical average may exist along the water
Ems rivers. column, in particular in the deeper sections of the channel-
The 2-week period used for tidal analysis (06–21 July 2010) systems, i.e. in the tidal inlets (Stanev et al. 2007).
starts after a model spin-up of around 5 weeks and covers a full
spring-neap tidal cycle corresponding to 28 semi-diurnal tidal 3.2 Effects of sea level rise
cycles (≈ 15 days). Tidal characteristics are calculated on the
basis of a time series analysis on each grid cell edge and are In response to a sea level rise of 0.8 m, the model simulates a
temporally averaged or integrated over at least one tidal cycle. general increase in mean tidal current velocity (vmean) in the
For further details on the techniques of the applied tidal analysis, tidal inlets of the Wadden Sea (Fig. 5a). The response of vmean
the reader is referred to Lang (2003) or BAW (2017). on the tidal flats is less systematic and reveals stronger region-
In this study, we focus on the analysis of tidal current al differences. On the tidal flats behind barrier islands (East
velocity i.e. the changes in tidal current velocity in response Frisian Wadden Sea), a general reduction of vmean is observed,
to the simulated sea level rise as well as in response to the whereas the tidal flats of the open-coast Wadden Sea (central
applied bathymetric changes. Note that the definition of ebb or German Bight), especially in the Elbe estuary, reveal a pre-
flood dominance can be based on various characteristics of dominant increase of vmean (Fig. 5a).
tidal current velocity (e.g. ratios of mean flood/ebb current The tidal inlets of the Wadden Sea reveal an increase in
velocity, maximum flood/ebb current velocity, flood/ebb maximum flood current velocity (vf_max) typically with aOcean Dynamics maximum increase in the central section of tidal inlets, e.g. Wadden Sea. The different tidal response to sea level rise on between barrier islands (Fig. 5b). Some channels also show an tidal flats compared with tidal channels observed in most of increase in maximum ebb current velocity (ve_max) (Fig. 5c). the Wadden Sea is in agreement with results of Stanev et al. However, the increase in vf_max is generally larger than the (2006). Finally, vf_max/ve_max is increased or decreased on tidal increase in ve_max. Moreover, ve_max decreases in many parts flats and its changes reveal a spatially very heterogeneous of the tidal channel systems of the Wadden Sea (Fig. 5c), pattern (Fig. 5d). Nevertheless, some systematic patterns can especially in the landward sections within the tidal basins as be observed. For example, a maximum decrease in vf_max/v- well as in some ebb tidal deltas (see the inset of a detailed view e_max is often found on tidal watersheds or high tidal flats in in Fig. 5c). As a result, the tidal channel systems of the general. The existing flood dominance on tidal flats (Fig. 4c) Wadden Sea are generally characterised by an increased ratio is reinforced or weakened, but usually not reversed into ebb of maximum flood current velocity to maximum ebb current dominance so that tidal asymmetry is still in favour of flood velocity (vf_max/ve_max) (Fig. 5d). This implies a reinforcement dominance on most tidal flats (Fig. 5e). Furthermore, the mag- of flood dominance, an attenuation of ebb dominance, or a nitude of changes of the ratio of maximum flood to maximum reversion from ebb dominance to flood dominance (compare ebb current velocity on tidal flats differs between tidal basins. Fig. 4c and Fig. 5e). Prominent examples for an attenuation of However, changes of these ratios are very sensitive in case of ebb dominance are the ebb tidal deltas of the East Frisian small flood or ebb current velocities, which is typically the Wadden Sea and the main channel of the outer Weser estuary. case on tidal flats, and thus, they should not be assessed quan- Many sections of tidal channel systems, which have no tidal titatively on tidal flats. asymmetry of current velocity in the reference case, show distinct flood dominance in response to sea level rise. These 3.3 Effects of bathymetric changes results are in agreement with findings of e.g. Stanev et al. (2006), French (2008), and Dissanayake et al. (2012). This section describes the effects of the bathymetric changes However, regional differences are obvious. While an in- applied to the model as described in Section 2.3 (tidal flats creased vf_max/ve_max is observed within the entire tidal chan- elevated by + 0.5 m and tidal channels deepened by − 0.2 m). nel systems of the East Frisian Wadden Sea and central To this end, we analyse the differences between the simulation German Bight, the ratio is increased only in the landward with a sea level rise of 0.8 m and additional bathymetric reaches of the tidal channel systems of the North Frisian changes and the simulation including solely sea level rise. Wadden Sea. A maximum increase in vf_max/ve_max is often The changes applied to the model bathymetry result in a de- located in the landward sections of the channel systems (see crease of maximum flood current velocity (vf_max) in tidal the inset of a detailed view in Fig. 5d), which is primarily inlets and channels of the Wadden Sea (Fig. 6a). The maxi- related to a decreased ve_max (see the inset of a detailed view mum ebb current velocity (ve_max) in the seaward section of in Fig. 5c). In response to sea level rise, the duration of the many tidal inlet systems also decreases (Fig. 6b), but to a flood current (df) is shortened in the major tidal channels of lesser extent compared with vf_max. In the landward sections the southern German Bight (Fig. 5f). This is consistent with of some tidal channel systems, a slight increase in ve_max is the observed increase of vf_max/ve_max in these tidal channels observed, e.g. in the tidal basins between the Weser and Elbe (Fig. 5d). estuaries. Although some tidal channels reveal no significant On the tidal flats, vf_max and ve_max reveal a more complex changes of vf_max/ve_max, this ratio decreases in many tidal and diverse response to sea level rise. While some tidal flats channels in response to the bathymetric changes (Fig. 6c), experience an increase in vf_max (e.g. in the outer Elbe estuary mainly because of a strong decrease of vf_max. Hence, flood and Dithmarschen Wadden Sea), other tidal flats show a pro- dominance is generally reduced in response to the bathymetric nounced decrease in vf_max (e.g. in the eastern back barrier changes. Thus, with regard to tidal current velocities in tidal basins of the East Frisian Wadden Sea, the tidal basins near inlets and channels, the bathymetric changes compensate the the island of Sylt, and the outer Ems estuary; Fig. 5b). systems response to mean sea level rise (Section 3.2). Systematic spatial patterns are hardly observed, except for Nevertheless, the effects of bathymetric changes are not fully the back barrier basins in the East Frisian Wadden Sea, where compensational as effects of sea level rise are usually stronger. a decrease in vf_max is concentrated along the tidal watersheds The compensational effect of elevated intertidal areas com- (Fig. 5b). The ve_max increases on many tidal flats of the pared with changes in tidal current velocity induced by sea Wadden Sea, in particular near tidal watersheds, on level rise was also observed by French (2008) in a hydrody- some tidal flats of the outer estuaries, and on the seaward tidal namic model of the Blyth estuary (eastern England). flat areas in the open-coast Wadden Sea of the central German On the tidal flats, vf_max and ve_max increase or decrease in Bight (Fig. 5c). Both vf_max and ve_max exclusively increase on response to the bathymetric changes, again with a sign which the tidal flats of the outer Elbe estuary and the Dithmarschen is predominantly contrary to the effect of sea level rise. For Bight, which is in contrast to any other tidal basin of the example, on some very high tidal flats, especially on tidal
Ocean Dynamics

Fig. 6 Effect of bathymetric
changes on maximum flood
current velocity vf_max (a),
maximum ebb current velocity ve_
max (b), and ratio of maximum
flood current velocity to
maximum ebb current velocity vf_
max/ve_max (c). Ratio of maximum
flood current velocity to
maximum ebb current velocity vf_
max/ve_max with the 0.8-m sea
level rise and applied bathymetric
changes (d)

watersheds in the East Frisian Wadden Sea, the bathymetric            bathymetric changes on ve_max are not as strong as on vf_max.
changes induce an increase in vf_max (Fig. 6a), which is in           The effects of the bathymetric changes on tidal currents are
contrast to the sea level rise effect (Fig. 5b). Most of the tidal    generally smaller than the effects of sea level rise, but are in
flat areas, which exhibit an increase in ve_max due to sea level      the same order of magnitude on the scale of a tidal basin. On a
rise (Fig. 5c), show a decrease in ve_max in response to the          smaller scale (e.g. subsections of tidal channels or specific
bathymetric change (Fig. 6b), although the changes in ve_max          tidal flats), either sea level rise or bathymetric change can
are generally not as strong as the changes in vf_max. In general,     dominate the net response.
the effect of the bathymetric changes on vf_max/ve_max com-
pensates the effect of sea level rise (compare Fig. 6c with Fig.
5d). Consequently, not only in the tidal channels, but also on        4 Discussion
the tidal flats the effect of sea level rise on tidal current asym-
metry is opposed by the effect of the applied bathymetric             4.1 Effects of sea level rise
changes in most of the Wadden Sea.
   The combined effect of sea level rise and bathymetric              The predicted effects of sea level rise on tidal currents can be
changes results in a spatial distribution of tidal asymmetries,       summarised as follows. First, mean tidal current velocity is
which is comparable with the reference condition (compare             intensified in tidal inlets and channels. Second, flood domi-
Fig. 6d with Fig. 4c). The effects of both sea level rise and         nance is strengthened and ebb dominance is weakened or
Ocean Dynamics
transformed into flood dominance in the majority of the tidal new shoal volume is added to the tidal prism. Due to the
inlet systems of the Wadden Sea. Third, changes in maximum highly curved cross section of tidal inlet systems in the
flood and maximum ebb current velocity show along-channel Wadden Sea, the relative increase of tidal prism (P′/P) is larger
differences in most of the tidal inlet systems. Fourth, in con- than the relative increase of cross-sectional area (A′/A) as
trast to the tidal channels, the response of the tidal flats is less illustrated in Fig. 7a, b. This explains the predicted general
systematic, but mostly shows weakened flood dominance. increase in mean tidal current velocity in the tidal inlets.
Note that in this paper, we aim at understanding the mecha- In case of a tidal inlet, which is narrower (and usually
nisms, which are responsible for the predicted response of steeper) compared with its connected tidal basin (compare
tidal currents to sea level rise, rather than discussing the con- the two different cross-sectional profiles in Fig. 7c), a rise in
sequences for e.g. residual sediment transport which should be sea level results in an even stronger increase of P/A (P′/A′ >>
addressed in further studies. P/A, compare Fig. 7 c and d with Fig. 7 a and b), because with
a narrower tidal inlet, A′/A is smaller than in case of a cross-
sectional shape, which is constant in along-channel direction.
4.1.1 Intensification of tidal currents in tidal inlets
This along-channel variation in cross-sectional width proba-
and channels
bly applies to all tidal inlet/basin systems of the Wadden Sea.
An aggregation of the model results on individual tidal basins
Friction is an important control of tidal dynamics on shelves
shows that P′/P is larger than A′/A in nearly all tidal inlet/basin
and in shallow coastal waters. A rise in mean sea level in-
systems of the Wadden Sea (Fig. 8).
creases the water depth and thereby reduces the frictional con-
trol promoting an increase of current velocity. However, a We note that besides tidal basin hypsometry, the tidal prism
is also determined by tidal range, which potentially changes
distinct relationship between increasing water depth and
with sea level rise. However, in the Wadden Sea, the relative
change in current velocity cannot be observed (note that the
model predicts even a decrease of current velocity on some change of tidal range induced by a sea level rise of 0.8 m (not
shown here) is on average more than one order of magnitude
tidal flats although in general the relative change in water
smaller than the relative change of tidal prism. Thus, we con-
depth is largest there). This suggests that a reduced frictional
clude that in the Wadden Sea, the predicted change in tidal
control due to an increased water depth is not the only mech-
range is generally less important than the change in tidal basin
anism for the predicted changes in current velocity within the
hypsometry for the change in tidal prism and the related
Wadden Sea and thus other physical controls need to be
change in mean tidal current velocity. Nevertheless, since
considered.
the change in tidal range induced by sea level rise is locally
A rise in sea level increases the cross-sectional area of a
variable, its contribution to a change in tidal prism and related
tidal inlet (A′ > A, compare Fig. 7 a and b). As long as inter-
change in mean tidal current velocity is locally different rang-
tidal area is present in the initial condition, also the tidal prism
ing from negligible to moderate.
must increase with sea level rise (P′ > P, compare Fig. 7 a and
b), because in this case, the volume added to the tidal prism by
the raised tidal high water is always larger than the volume 4.1.2 Changes of tidal asymmetries in tidal inlets
removed from the tidal prism by the raised tidal low water, if and channels
we assume that tidal range does not decrease significantly.
This even holds true for tidal basins, which are embanked Figure 9a shows the time series of transport rate in an exem-
along the line of the initial tidal high water and where no plary tidal inlet (Otzumer Balje, see the black polygon in Fig.
Fig. 7 Effect of tidal basin
hypsometry on the change of P/A
with sea level rise. Note the dif-
ferent cross-sectional shapes of
the tidal inlet and the tidal basin in
c and d, which results from the
landward widening of the cross
section from the tidal inlet to the
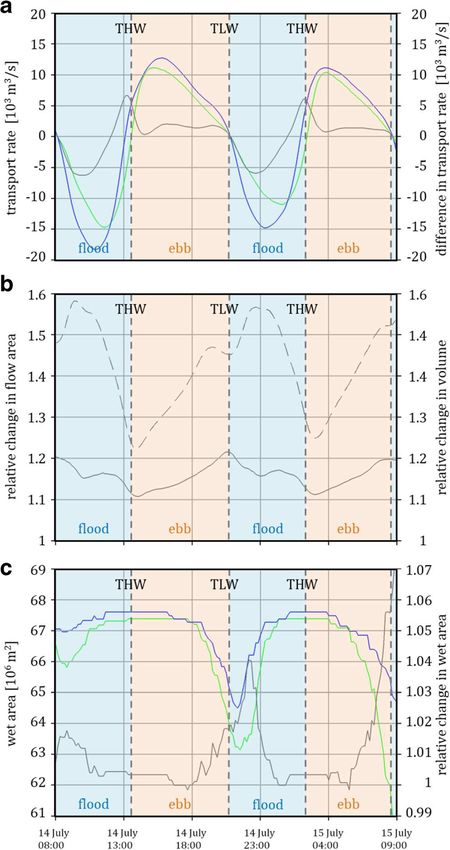
interior of the tidal basinOcean Dynamics Fig. 8 Comparison of the relative change in cross-sectional flow ar- ea of tidal inlets (A′/A) with the relative change in tidal prism (flood volume) of the connected tidal basins (P′/P) induced by a sea level rise of 0.8 m with (P′/P)/ (A′/A) = 1 represented by the dashed line (see Fig. 7 for definition of parameters). Each data point represents a tidal basin of the German Bight (the tidal basins used for analysis are displayed by red polygons) 8 for its position) for the reference case (green line) and the sea sea level rise. The non-linear response of tidal basins is con- level rise scenario (blue line). In response to sea level rise, the trolled by the bottom slope in the intertidal areas (Stanev et al. transition from flood to ebb current around tidal high water 2003a; Hepkema et al. 2018). Accordingly the differential occurs earlier, while the timing of the transition from ebb to response of flood and ebb to sea level rise could be explained flood around tidal low water is not changed. Hence, flood by the changed hypsometry (normalised by the basin area), i.e. current duration is shortened in response to sea level rise, the changed bottom slope of the landward shifted intertidal which has been observed already in the spatial analysis of area. Due to the highly-curved hypsometry of tidal flats of the model results (Fig. 5f). This shortening of flood current the Wadden Sea, the bottom slope in the lower part of the duration in the tidal inlets of the Wadden Sea comes along intertidal area becomes flatter with a rise in sea level. At the with an increased ratio of maximum transport rate at flood to same time the bottom slope in the upper part of the intertidal maximum transport rate at ebb (Fig. 9a), i.e. an enhanced area becomes steeper with a rise in sea level, since most tidal flood dominance or weakened ebb dominance, as observed basins of the Wadden Sea are embanked limiting the avail- already in the spatial analysis of the ratio of (maximum) flood ability of new intertidal area (former supratidal area). current velocity to (maximum) ebb current velocity (Fig. 5d). Therefore, the intertidal area or storage capacity can be The time needed to establish maximum transport after slack flooded much faster resulting in an earlier timing of maximum water is generally much longer for flood than for ebb (Fig. 9a). flood transport whereas the storage capacity added by new This model result is in accordance with findings of Stanev intertidal area is negligible in most tidal basins of the et al. (2003a, 2003b) who demonstrate the dependency of this Wadden Sea resulting in an insignificant to moderate later temporal asymmetry of transport on the hypsometry of tidal timing of maximum ebb transport. This provides an explana- basins in the (East Frisian) Wadden Sea characterised by a tion for the shortening of the flood associated with the asym- large intertidal area (relative to total basin area) and a large metric response of maximum transport rate at flood and ebb, storage capacity (or shoal volume). Here we show that this respectively. tidal asymmetry in the timing of maximum transport is weak- As seen in Fig. 9b, the relative increase in water volume of ened (however not reversed) by a sea level rise of 0.8 m as the the tidal basin (dashed line) is larger than the relative increase maximum flood transport occurs earlier whereas the maxi- in cross-sectional flow area of the tidal inlet (solid line) mum ebb transport occurs later or is not temporally shifted throughout the entire tidal cycle both demonstrating an asym- (Fig. 9a). Stanev et al. (2003a) show that the excursion of metric response to sea level rise. While the relative increase in transport including full physics is lagged compared with a water volume of the tidal basin (dashed line in Fig. 9b) is case including only low-order dynamics and that the contri- largest around mid-flood, the relative increase in tidal inlet bution of higher-order dynamical controls and thus its associ- flow area (solid line in Fig. 9b) is largest around tidal low ated temporal lag effect on the transport rate is strongest be- water. The resulting difference between both parameters is tween maximum flood and maximum ebb conditions. As the larger at flood than at ebb with the largest difference found largest phase shifts of transport rate induced by sea level rise at early to mid-flood (Fig. 9b). This is in accordance with the occur in this period (Fig. 9a), higher-order dynamical controls signal of transport rate (Fig. 9a) which reveals that the largest are suggested to contribute to the predicted tidal response to increase of flood transport occurs at early to mid-flood
Ocean Dynamics

                                                                                  and Byrne 1981; Speer and Aubrey 1985; Friedrichs and
                                                                                  Aubrey 1988; Friedrichs and Madsen 1992), which is typical-
                                                                                  ly expected in embanked tidal basins in case of sea level rise
                                                                                  (Dronkers 2005). This relation can also be seen in our exem-
                                                                                  plary tidal basin connected to the Otzumer Balje where the
                                                                                  intertidal area (indicated by the tidal variation of wet area in
                                                                                  Fig. 9c) decreases with sea level rise (compare the variations
                                                                                  of the green and blue lines, respectively, in Fig. 9c). The
                                                                                  decrease of intertidal area results from a smaller increase in
                                                                                  the wet area around tidal high water compared with the in-
                                                                                  crease in the wet area around tidal low water, which is likely
                                                                                  related to the presence of dikes limiting the area available for
                                                                                  flooding with sea level rise. Note that the tidal periods pre-
                                                                                  sented in Fig. 9 represent spring tide conditions. We are aware
                                                                                  that the geometric properties of the tidal basins and the related
                                                                                  hypsometric controls on tidal asymmetry may differ substan-
                                                                                  tially under neap and spring tide conditions, respectively
                                                                                  (Stanev et al. 2003b). However, since tidal asymmetry is not
                                                                                  reversed between the two different conditions but simply more
                                                                                  pronounced at spring tide, we assume that our conclusions
                                                                                  from spring tide conditions are also valid for mean tide con-
                                                                                  ditions in qualitative terms.
                                                                                      The discussed geometric and volumetric parameters
                                                                                  may also largely explain the predicted regionally different
                                                                                  responses of tidal asymmetry to sea level rise. For exam-
                                                                                  ple, the weaker shift towards flood dominance in the tidal
                                                                                  inlets of the North Frisian Wadden Sea compared with the
                                                                                  tidal inlets of the East Frisian Wadden Sea could be re-
                                                                                  lated to the fact that the relative intertidal area of tidal
                                                                                  basins in the North Frisian Wadden Sea (Spiegel
                                                                                  1997) is generally smaller than in the East Frisian
                                                                                  Wadden Sea (Ferk 1995). Furthermore, the basin-specific
                                                                                  widening from the inlet to the basin provides another ex-
                                                                                  planation for regional differences in the response of tidal
                                                                                  asymmetry to a rise in sea level. In this context, we note
                                                                                  that the tidal inlets of the East Frisian Wadden Sea are
Fig. 9 Time series of transport rate of the tidal inlet (a), relative change in   usually narrower (more confined by barrier islands) than
cross-sectional flow area of the tidal inlet and volume of the tidal basin        the tidal inlets of the North Frisian Wadden Sea. Also,
(b), and wet area of the tidal basin (c) for the Otzumer Balje (see the black
polygon in Fig. 8 for its location). The reference case is represented by the     Ridderinkhof et al. (2014) emphasise the importance of
green lines, the sea level rise scenario is represented by the blue lines, and    tidal inlet widening on the residual velocity in the inlet.
the relative change in or difference between the respective parameters of             Note that tidal asymmetry is also generated by shallow
the two scenarios is represented by the grey lines. In a, transport is defined    water effects outside the Wadden Sea in the German Bight,
positive towards the open ocean (ebb current)
                                                                                  i.e. in the open North Sea where hypsometric controls or tidal
                                                                                  basin geometry in general is not relevant. In the German
whereas the increase of ebb transport is distributed more                         Bight, the tidal distortion is largely composed of the amplitude
equally throughout the ebb phase only with a small minimum                        ratio of M2 and M4 and their relative phase difference (see
at early ebb.                                                                     e.g. Stanev et al. 2014 and Jacob et al. 2016 for a spatial
   The geometric properties of the intertidal area (area relative                 analysis of numerical simulations). Hence, tidal inlet–
to total basin area, bottom slope) represent an important hyp-                    specific changes in tidal asymmetry induced by sea level rise
sometric control on the tidal distortion in shallow tidal basins.                 may also result from regionally different changes in the am-
A shift towards flood dominance in shallow tidal basins is                        plitude ratio of M2 and M4 and their relative phase difference
often associated with a decrease of intertidal area or a de-                      which are already included in the forcing at the seaward
creased ratio of shoal volume to tidal channel volume (Boon                       boundary of the Wadden Sea.
Ocean Dynamics
The observed along-channel differences of the change in reference case is primarily related to the friction-induced gen-
tidal asymmetry in response to sea level rise (Fig. 5d) could be eration of M4 (for theory, see Parker 1991; Friedrichs and
related to the cross-section specific ratio of tidal flat width to Aubrey 1988; Guo et al. 2019) in combination with relative
tidal channel width which generally increases from the inlet phase differences between M2 and M4 (2φM2–φM4 between 0
towards the landward boundary of the tidal basins in the and 180°). The friction-induced formation of higher har-
Wadden Sea (again representing a topographic control). monics on tidal flats is very sensitive to changes in water
Also, three-dimensional processes could be responsible for depth. Therefore, with regard to the tidal flats, the response
the observed along-channel differences including lateral cir- of tidal asymmetry to sea level rise is likely induced by chang-
culation (Becherer et al. 2015; Pein et al. 2018) and vertical es in amplitudes of higher harmonics (mainly M4 and M6)
circulation (Stanev et al. 2007) which are both affected by the and their interaction with the principal tidal component M2 by
topography (geometric characteristics) of a tidal basin. Stanev relative phase difference. In the German Wadden Sea, the M4
et al. (2007) showed that the total transport at shallow channel amplitude typically increases along the tidal channels towards
sections is dominated by the surface layer transport which is the tidal flats (Stanev et al. 2014; Fofonova et al. 2019).
controlled by a non-linear tidal response induced by the Therefore, a change in 2φM2–φM4 induced by sea level rise
flooding and drying of tidal flats (inducing flood dominance). will affect the tidal asymmetry particularly in the landward
By contrast, the deeper channel sections (tidal inlets) are con- sections of tidal channel systems and on the tidal flats.
trolled by hypsometric properties of the tidal basin in the Depending on the sign of the change in 2φM2–φM4, the flood
deeper layer (inducing ebb dominance) and by the tidally in- dominance on tidal flats is either enhanced or weakened.
duced stokes drift in the upper layer (inducing flood domi-
nance) compensating the seaward directed residual transport 4.2 Further mechanisms
induced by the hypsometric control. Following Stanev et al.
(2007), this vertical circulation provides an explanation for Baroclinic processes induced by the interaction of tidal cur-
(vertically averaged) ebb dominance in tidal inlets and deep rents with considerable fresh water input and related horizon-
tidal channels and (vertically averaged) flood dominance in tal density gradients play a major role for generating residual
the shallow extensions of the channel system, which is con- circulation cells in estuaries (Geyer and MacCready 2014).
firmed by our model for the reference case (Fig. 4c). The Also, with regard to the Wadden Sea, the interaction of hori-
vertical circulation is sensitive to relative changes in mean zontal density gradients with tidal currents has been suggested
water depth of shallow tidal basins which in turn is different to generate estuarine circulation and tidal mixing asymmetries
in along-channel direction in response to a rise in mean sea which contribute to a net sediment import (Burchard et al.
level (increasing towards the tidal flats). Hence, the predicted 2008; Flöser et al. 2011). However, compared with the Elbe,
along-channel variation of the tidal response to sea level rise Weser, and Ems estuaries, fresh water input is usually about 2
could also be related to depth-dependent variations of vertical orders of magnitude smaller in the semi-enclosed tidal basins
circulation. In particular, the significant decrease in ebb cur- of the German Wadden Sea (Gräwe et al. 2016). This results
rent velocity in the shallower sections of the channel systems in an along-channel salinity gradient of tidal inlets which is
(Fig. 5c) could be the result of a diminishing hypsometric about 1 order of magnitude smaller than in estuaries, e.g. 1–4
control formerly in part compensating the flood dominance PSU in tidal inlets of the East Frisian Wadden Sea (Staneva
induced by the non-linear response of tidal flats. et al. 2009) compared with ~ 30 PSU in the Elbe estuary with
With regard to the tidal inlets and channels of the Wadden local gradients of up to 1 PSU/km (Stanev et al. 2015).
Sea, we conclude that the response of tidal asymmetry to sea Furthermore, temporal variability of local salinity in the tidal
level rise is strongly controlled by the tidal basin geometry, in inlets of the Wadden Sea is much smaller compared with that
particular by the presence of tidal flats (hypsometric control). in estuaries of the German Bight, e.g. up to 2 PSU on a tidal
timescale in the East Frisian Wadden Sea (Staneva et al. 2009;
4.1.3 Changes of tidal current velocities on tidal flats Gräwe et al. 2016) compared with roughly 10 PSU on a tidal
timescale in the seaward section of the Elbe estuaries (Stanev
On many tidal flats of the Wadden Sea, the response of tidal et al. 2019). Both the rather small horizontal density gradients
dynamics to sea level rise is remarkably different than in tidal and the small temporal variability of salinity are likely the
inlets and channels. The flood dominance prevailing on tidal main reasons for the relatively weak density–driven circula-
flats in the reference condition (Fig. 4c) is weakened in many tion in the German Wadden Sea as observed by Gräwe et al.
regions (Fig. 5d). However, it is also enhanced on some tidal (2016). Instead, Stanev et al. (2007) suggest that the tidal
flats (Fig. 5d). On intertidal flats, the extremely shallow water inlets of the (East Frisian) Wadden Sea are characterised by
depth and the frequent flooding and drying result in a domi- a vertical overturning cell that consists of a residual landward
nance of frictional effects. Therefore, we suggest that the flood transport in the near-surface layer (dominated by the tidally
dominance on the tidal flats being already present in the induced Stokes drift) and a residual seaward transport in theYou can also read